
Submitted:
21 April 2025
Posted:
22 April 2025
You are already at the latest version
Abstract
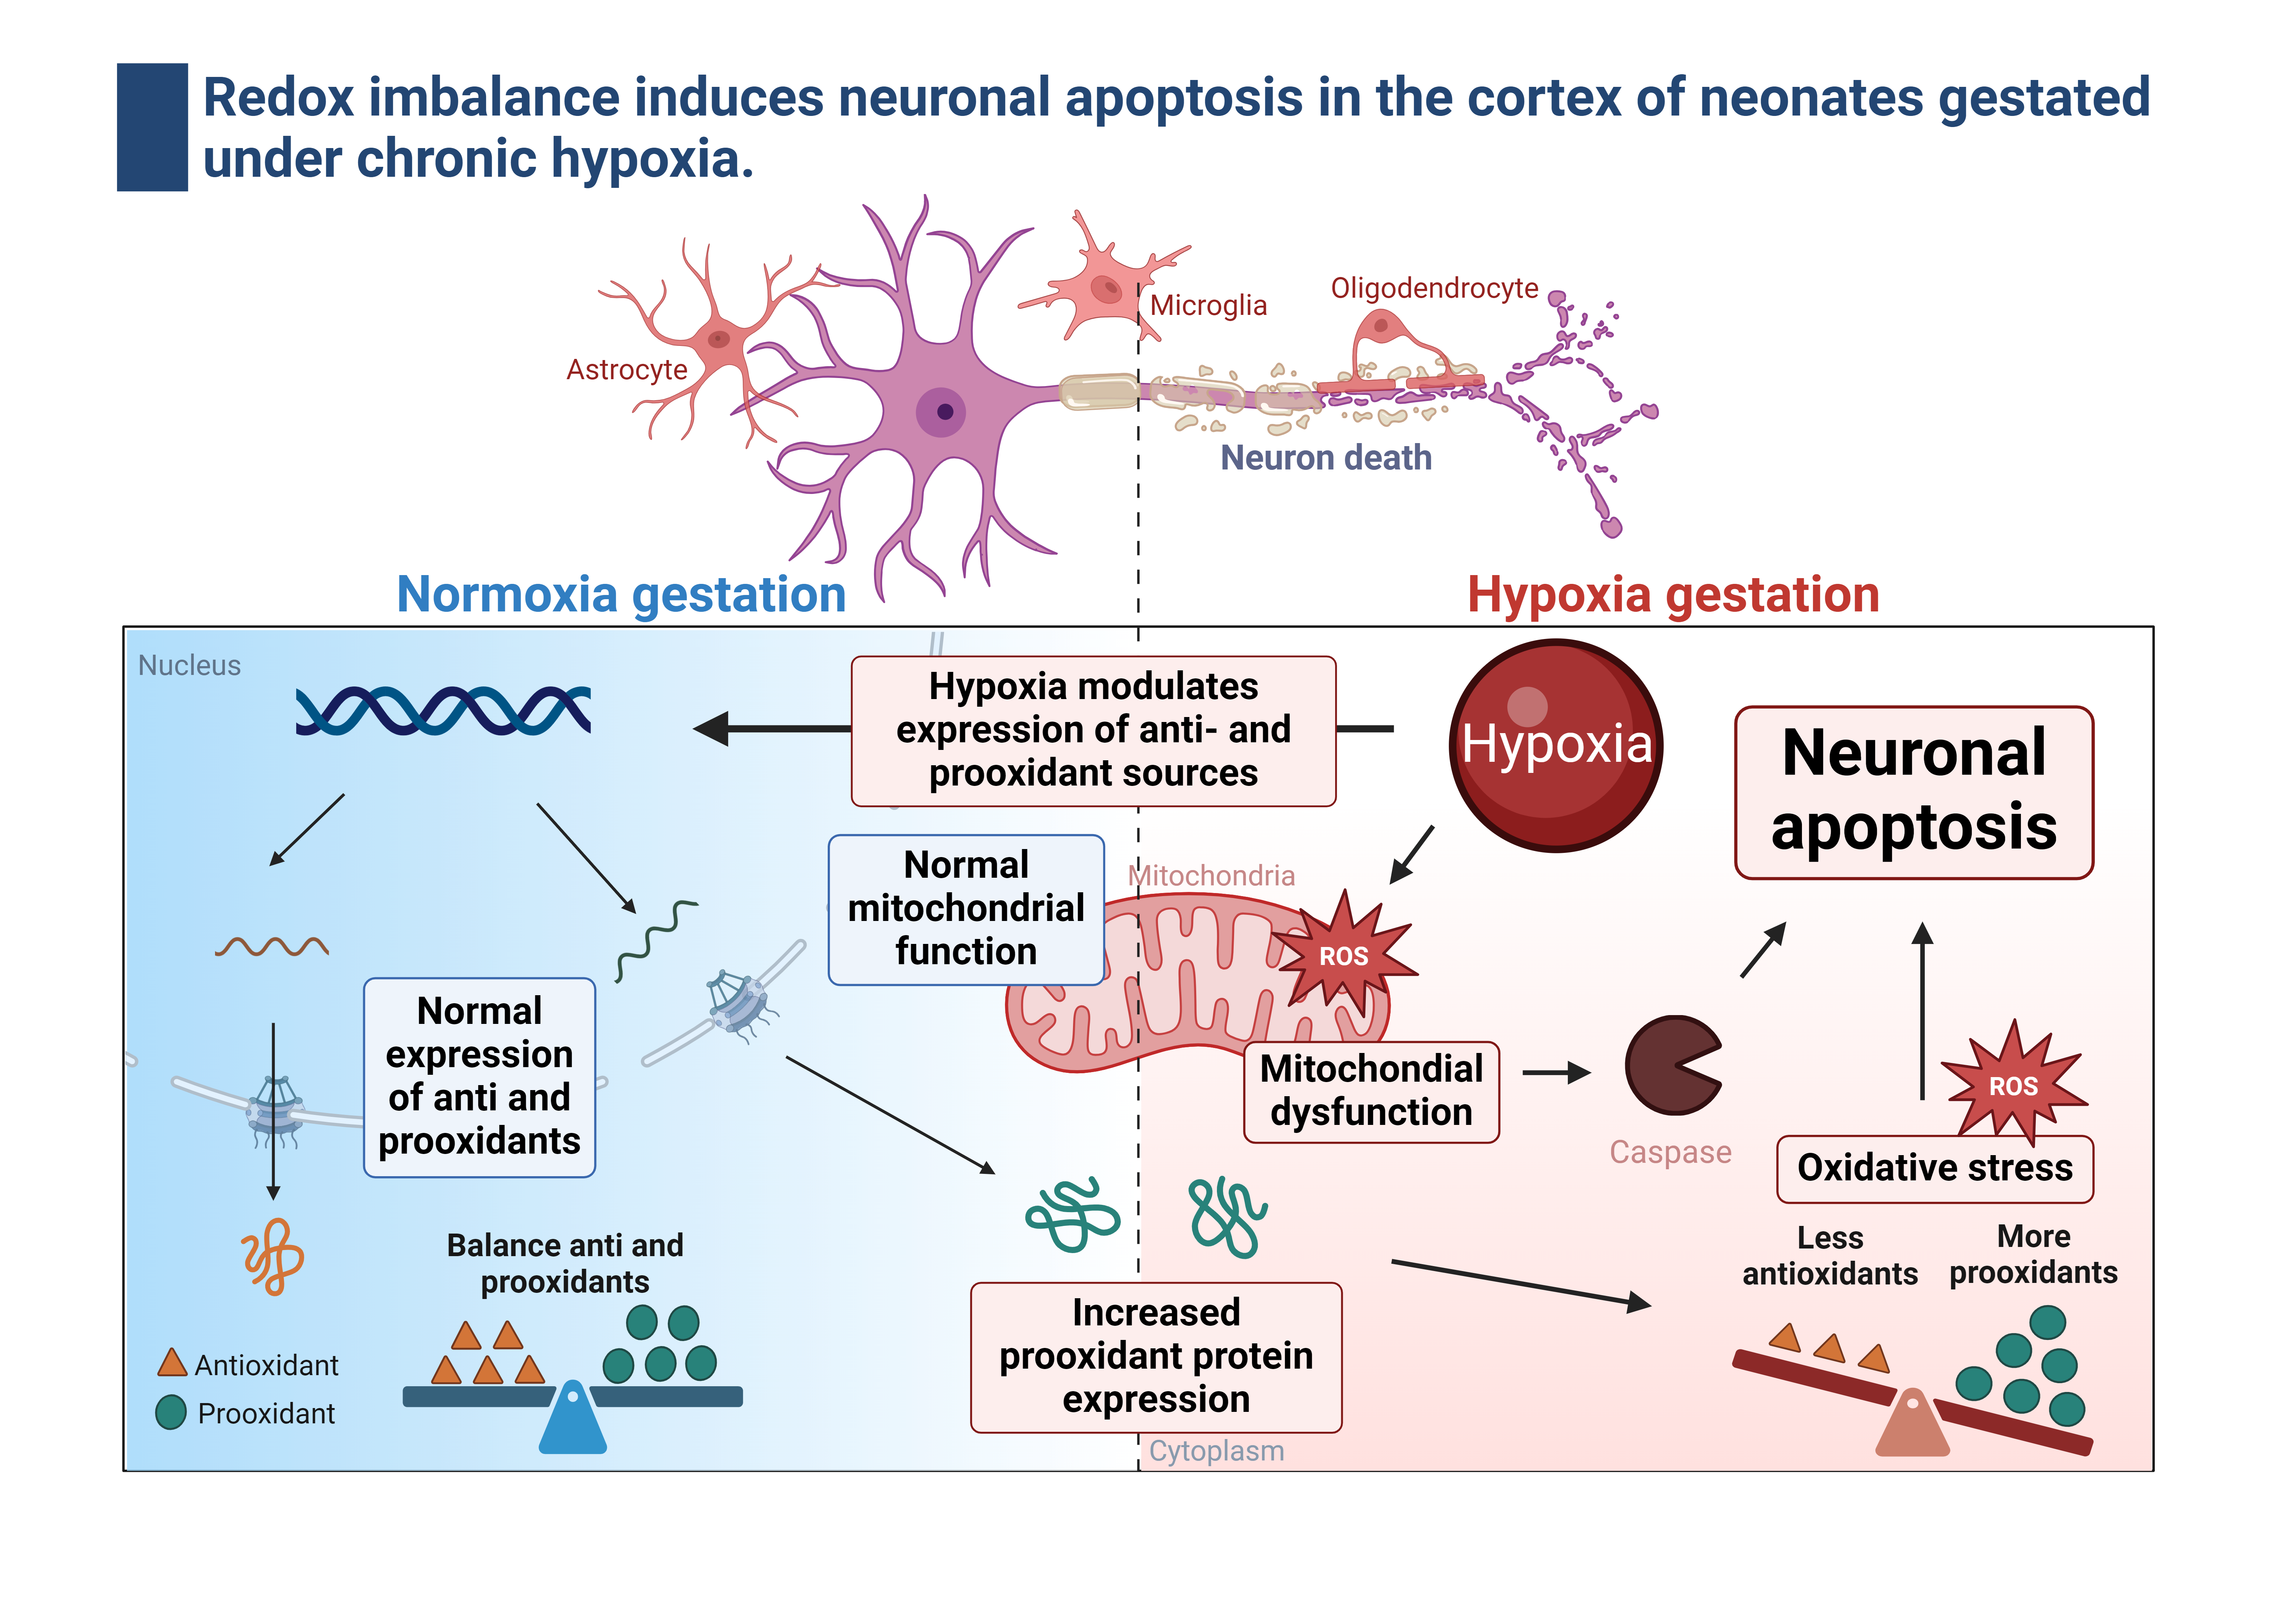
Gestational chronic hypoxia impacts prenatal development, leading to fetal growth restriction (FGR), defined as the fetus's failure to reach its genetic growth potential. Postnatal hypoxia in the cerebral tissue can induce a redox imbalance and mitochondrial dysfunction, consequently increasing neuronal death. However, these data cannot necessarily be extrapolated to prenatal hypoxia. In this regard, this study aims to describe the effect of gestational hypoxia on redox balance and apoptosis cell death mechanisms in the prefrontal cortex of guinea pigs. Ten Guinea pig (Cavia porcellus) pregnant dams were utilized in this study; 5 gestated in normoxia (Nx), and 5 gestated under chronic hypobaric hypoxia (Hx). We monitored the pregnancy by ultrasound examinations from gestational days 20 to 65 (term ~70). At birth, pups were euthanized, and the fetal brain was collected for cellular redox measurement, mitochondrial enzyme expression, and apoptosis assay. Gestation under hypoxia induced an imbalance in the expression of anti- and prooxidant enzymes, resulting in increased oxidative stress. Additionally, a decrease in cytochrome I and III expression and neuronal density in the neonatal prefrontal cortex was observed. Finally, DNA fragmentation was increased by Tunel assay in the brain tissue of newborns gestated under chronic hypoxia. Our findings demonstrate the association of gestational hypoxia with oxidative stress and neuronal death in newborns, which may predispose to neuronal dysfunction in adulthood.
Keywords:
Oxidative Stress
; Intrauterine Chronic Hypoxia
; Mitochondrial Dysfunction
; Neuron Death
1. Introduction
The intrauterine environment in which the fetus develops conditions the physiology and determines its health in adult life [1,2]. Several internal and external factors can affect the intrauterine environment, such as maternal nutrition, stress, infections, and gestational hypoxia [2,3]. During normal gestational development, the placenta is the organ in charge of supplying oxygen and nutrients to the fetus through the umbilical fetal interconnection. However, a decrease in the mother’s blood oxygen supply to the fetus can cause prenatal hypoxia and fetal growth restriction (FGR) [4]. FGR is defined as a condition where the fetus does not reach its growth potential due to decreased blood flow through the placenta [4]. The physiological response to this gestational hypoxia by the fetus is the development of the phenotype called the “brain-sparring effect,” in which blood flow is redistributed to maintain vital organs, such as the brain and heart, at the expense of normal peripheral blood supply and growth [5]. However, although brain sparing is an adaptation to hypoxia, the programming by oxidative stress and its impact on the brain health of the newborn is poorly understood.
Free radical generation is present in the placenta and fetus from the beginning of pregnancy, contributing to normal fetal development. During gestation, the antioxidant activity protects the developing embryo from oxygen-free radical damage. The increase in oxidative stress is a determining factor for brain development, as demonstrated by Neonatal Hypoxic-Ischemic Encephalopathy (HIE) models. Oxidative stress is an imbalance in homeostasis between the production of reactive oxygen species (ROS) by cellular prooxidant sources and antioxidant systems; this can be an alteration of either a decrease in antioxidants or an increase in prooxidants or both, resulting in damage in different organs [6]. However, organs with greater sensitivity to oxygen, such as the cardiovascular and brain systems, are more likely to generate oxidative stress and cellular damage.
The cellular prooxidant sources induced by hypoxia are NADPH oxidase (NOX) and mitochondrial uncoupling, which are responsible for ROS production [7,8]. The NOX family, specifically NOX2 and NOX4, contributes significantly to the production of ROS during hypoxia and in the brain tissue. NOXs are biochemically different in their regulation, expression, and activity but retain their ability to use NADPH as an electron donor to reduce molecular oxygen to superoxide anion radical (•O2-) [9,10,11]. On the other hand, under postnatal hypoxia, the mitochondrial electron transport chain uncouples, which generates a leak of electrons, specifically in complexes I and III, accumulating •O2- in the inner mitochondria membrane, deriving in oxidative stress [12]. In addition, postnatal hypoxia can also decrease antioxidant capacity, further increasing oxidative stress [13]. The mechanisms that control ROS metabolization include enzymatic and non-enzymatic pathways. The enzymatic antioxidant machinery consists of superoxide dismutase (SOD), catalase (CAT), and glutathione peroxidase (GPX), which contribute to the neutralization of •O2- and subsequent reduction of hydrogen peroxide (H2O2) to water [13]. On the other hand, non-enzymatic mechanisms include antioxidant molecules such as vitamins E and C in addition to β-carotenes, ubiquinone, lipoic acid, and urate, and its action is based on direct scavenging [14].
The neonatal brain is susceptible to oxidative stress for different reasons: (i) The rapid increase in tissue oxygen concentration associated with the extrauterine environment, considering the hypoxic gestational environment [15,16]. (ii) Their antioxidant machinery is still immature, and an elevated fraction of iron free of transferrin in their system increases susceptibility to oxidative damage [17]. (iii) The vulnerability of the brain to oxidative stress is accentuated by its high oxygen consumption and (iv) the presence of unsaturated fatty acids, which makes it prone to lipid peroxidation [18]. These oxidative stress mechanisms have been associated with brain development and function, in addition to causing cell death, inflammation, and brain deterioration, contributing to the development of postnatal neurodegenerative diseases [19]. Considering the above, this study aims to describe the effect of chronic hypoxia on brain redox balance and cell death mechanisms, affecting neuronal density in the neonatal cortex of guinea pigs gestated under hypoxia.
2. Materials and Methods
The animal care, maintenance, and procedures received approval from the Institutional Committee for the Care and Use of Animals (CICUA) of the Universidad de Chile, code 20418-MED-UCH; and were performed according to ARRIVE guidelines and followed EU 2010/63/EU guidelines for animal experiments and the NIH Guide for the Care and Use of Laboratory Animals (NIH Publications No. 8023, revised in 1978).
2.1. Animals and Experimental Groups
This study used 10 adult female Pirbright White Guinea Pigs (Cavia porcellus). Animals were housed under standard conditions (35-40% humidity, 20-21ºC, and 12:12 h light-dark cycle) and for a specialized diet for this species (LabDiet 5025, Guinea Pigs, 25-30g/day). At estrous, the female was paired with a male for one day in normoxic conditions, and 20 days later, the pregnancy was confirmed by visualization of the gestational sac by ultrasound examination. Only one neonate per litter was used for this protocol; hence, the number of mothers corresponded to the number of neonates used in our study. However, the ultrasound determinations were performed in all fetuses of each -litter due to the impossibility of separating these results at the prenatal level. Five dams were assigned to the normoxia group, and five were exposed to hypobaric hypoxia. On gestational day (GD) 30, all animals from both groups were introduced to a hypobaric chamber in conditions of normoxia (Nx, controls, 720 torrs) or Hypoxia (Hx, 470 torrs) until delivery. At birth, the newborn underwent euthanasia with an overdose of sodium thiopentone (100 mg/kg, IP). At post-mortem, the brain tissue was quickly obtained from molecular biology, histology, and immunohistochemistry. A coronal cut of 1 cm thickness of the prefrontal cortex was fixed in 4% v/v paraformaldehyde in PBS for 24h at 4°C. Subsequently, the tissue was embedded in paraffin and cut into 10 μm thickness slides for histology and immunohistochemistry assays as previously described [20].
2.2. Pre and Postnatal Biometry Assessment
A portable ultrasonograph (Z6 VET, Mindray) with an L14-6P linear ultrasound transducer performed biometrical prenatal prenatal assessments. Ultrasonographic examinations were conducted in conscious and non-sedated animals, gently restrained by an expert operator. Biparietal diameter (BPD), abdominal circumference (AC), and cranial circumference (CC) were measured by ultrasound examination during pregnancy and averaged at G30-G35, G40-45, and G60-65. Prenatal flow velocity patterns were quantified through the pulsatility index (PI) in the umbilical artery (UA) and middle cerebral artery (MCA) by Doppler ultrasound during G60-65. The cerebroplacental ratio was calculated as MCA PI to UA PI (Candia et al., 2023). Weight, biparietal diameter (BD), and cerebral weight were determined as previously described at birth [21].
2.3. Protein Expression and Activity Assay in Total Brain
Protein expression for SOD1, SOD2, SOD3, CAT, GPX1/2, NOX2, NOX4, COX2, Total OXPHOS, NF-κB, TNFα, iNOS, IL-1β, IL-8, IL-10, Bcl-xL, BAX, cleaved-Caspase 3, Tom20 and α/β tubulin were determined in total cerebral lysates. Briefly, the membranes were incubated with primary antibodies (anti-SOD1, Santa Cruz Biotechnology, sc-101523; anti-SOD2, Santa Cruz Biotechnology, sc-133134; anti-SOD3, Santa Cruz Biotechnology, sc-271170; anti-CAT, Abcam Laboratories, ab1877; anti-GPX1/2, Santa Cruz Biotechnology, sc-133160; anti-NOX2, Santa Cruz Biotechnology, sc-130543; anti-NOX4, Santa Cruz Biotechnology, sc-518092; anti-COX2, Abcam Laboratories, ab102005; Total OXPHOS Rodent WB Antibody Cocktail, Abcam Laboratories, ab110413; anti-NF-κB, Abcam Laboratories, ab16502; anti-TNFα, Santa Cruz Biotechnology, sc-12744; anti-iNOS, Santa Cruz Biotechnology, sc-7271 anti-IL-1β, Santa Cruz Biotechnology, sc-12742; anti-IL-8, Santa Cruz Biotechnology, sc-376750; anti-IL-10, Santa Cruz Biotechnology, sc-365858; anti-Bcl-xL, Cell Signaling, #2764; anti-BAX, Cell Signaling, #2772; anti-Tom20, Santa Cruz Biotechnology, sc-17764; and anti-α/β-tubulin, Cell Signaling, #2148, respectively), The signals were revealed using chemiluminescent substrates (SuperSignal West Pico, #34080 and Femto, #34095, Thermo Scientific), digitalized by a scanner (ChemiDoc™ Imaging Systems, Bio-Rad, USA), quantified by densitometry, and normalized by α/β-tubulin or Tom20 signal using Scion Image software, as described elsewhere [22]. On the other hand, the antioxidant enzymes activities in cerebral homogenate and plasma were measured using the Superoxide Dismutase (SOD) Activity Assay Kit (706002, Cayman Chemical Company, Ann Arbor, MI, USA), Catalase Activity Assay Kit (707002, Cayman Chemical Company, Ann Arbor, MI, USA), Glutathione Peroxidase Assay Kit (703102, Cayman Chemical Company, Ann Arbor, MI, USA), Glutathione reduced (GSH). It oxidized (GSSG) ratio Detection Assay Kit (Colorimetric) (ab239709, Cayman Chemical Company, Ann Arbor, MI, USA) and 8-Isoprostane ELISA Kit (516351, Cayman Chemical Company, Ann Arbor, MI, USA), according to the manufacturers’ guidelines. As previously described [23], total protein concentration was used for normalization.
2.4. Immunolocalization of Proteins in the Cerebral Cortex
4-Hydroxynonenal (4-HNE), 3-Nitrotyrosine (NT), and cleaved caspase-3 were assessed in coronal sections of the prefrontal cortex (anti-4-HNE. Abcam Laboratories, ab46545; anti-NT, Santa Cruz Biotechnology, sc-32757; and anti-cleaved caspase-3, Cell Signaling, #9664). Briefly, the tissue sections were exposed to retrieval buffer 1X for antigen retrieval (Target Retrieval Solution, Dako) at 120º C for 25 min. The primary antibodies were incubated in bovine serum albumin 1% (1:100) for three hours. Then, the slides were incubated for one hour with a Mouse/RabbitPolydetector DAB HRP Brown System (Bio SB®, Goleta, CA, UEA). Finally, diaminobenzidine revealed the immunoreaction and the nuclear stain was performed with Harris hematoxylin. All slides were digitally acquired at 400X (Olympus BX-41) and analyzed as specific brown reddish-pixel count per area relative to the positive control. The neuron was selected for mark quantification, and pixels were quantified using Adobe Photoshop (CS5 extended version 12.0, San Jose, CA, USA). The mark intensity (pixels) was then divided by the area of each arterial layer (pixels/m2), as previously described [20].
2.5. Apoptosis Detection in the Cerebral Cortex
Prefrontal cortex slices sections of 10 μm thickness were used to measure neuronal death using the TUNEL Dead End™ Fluorometric TUNEL System apoptosis detection kit (Promega, Madison, WI, USA). This kit measures fragmented DNA from apoptotic cells by catalytically incorporating fluorescein-12-dUTP into the 3’-OH ends of DNA using the recombinant terminal deoxynucleotidyl transferase (rTdT) enzyme. rTdT forms a polymeric tail utilizing the principle of the TUNEL (TdT-mediated dUTP NickEnd Labeling) assay. Fluorescein-12-Dut-labeled DNA was then directly visualized by fluorescence microscopy (Zeiss microscope). DAPI was utilized to detect nuclear localization [24].
2.6. Statistical Analyses
Statistical analyses were performed using Graph Pad Prism 10.0 (San Diego, California, USA). The results are expressed as mean ± SEM. Multiple unpaired t-tests were used to compare the prenatal biometry, and all other results were compared with a nonparametric student t-test. Statistical significance was considered when P < 0.05. Grubb’s test (using 5% significance level critical values) detected outlier ratios [22,23].
3. Results
3.1. Pre-and Postnatal Biometric Variables
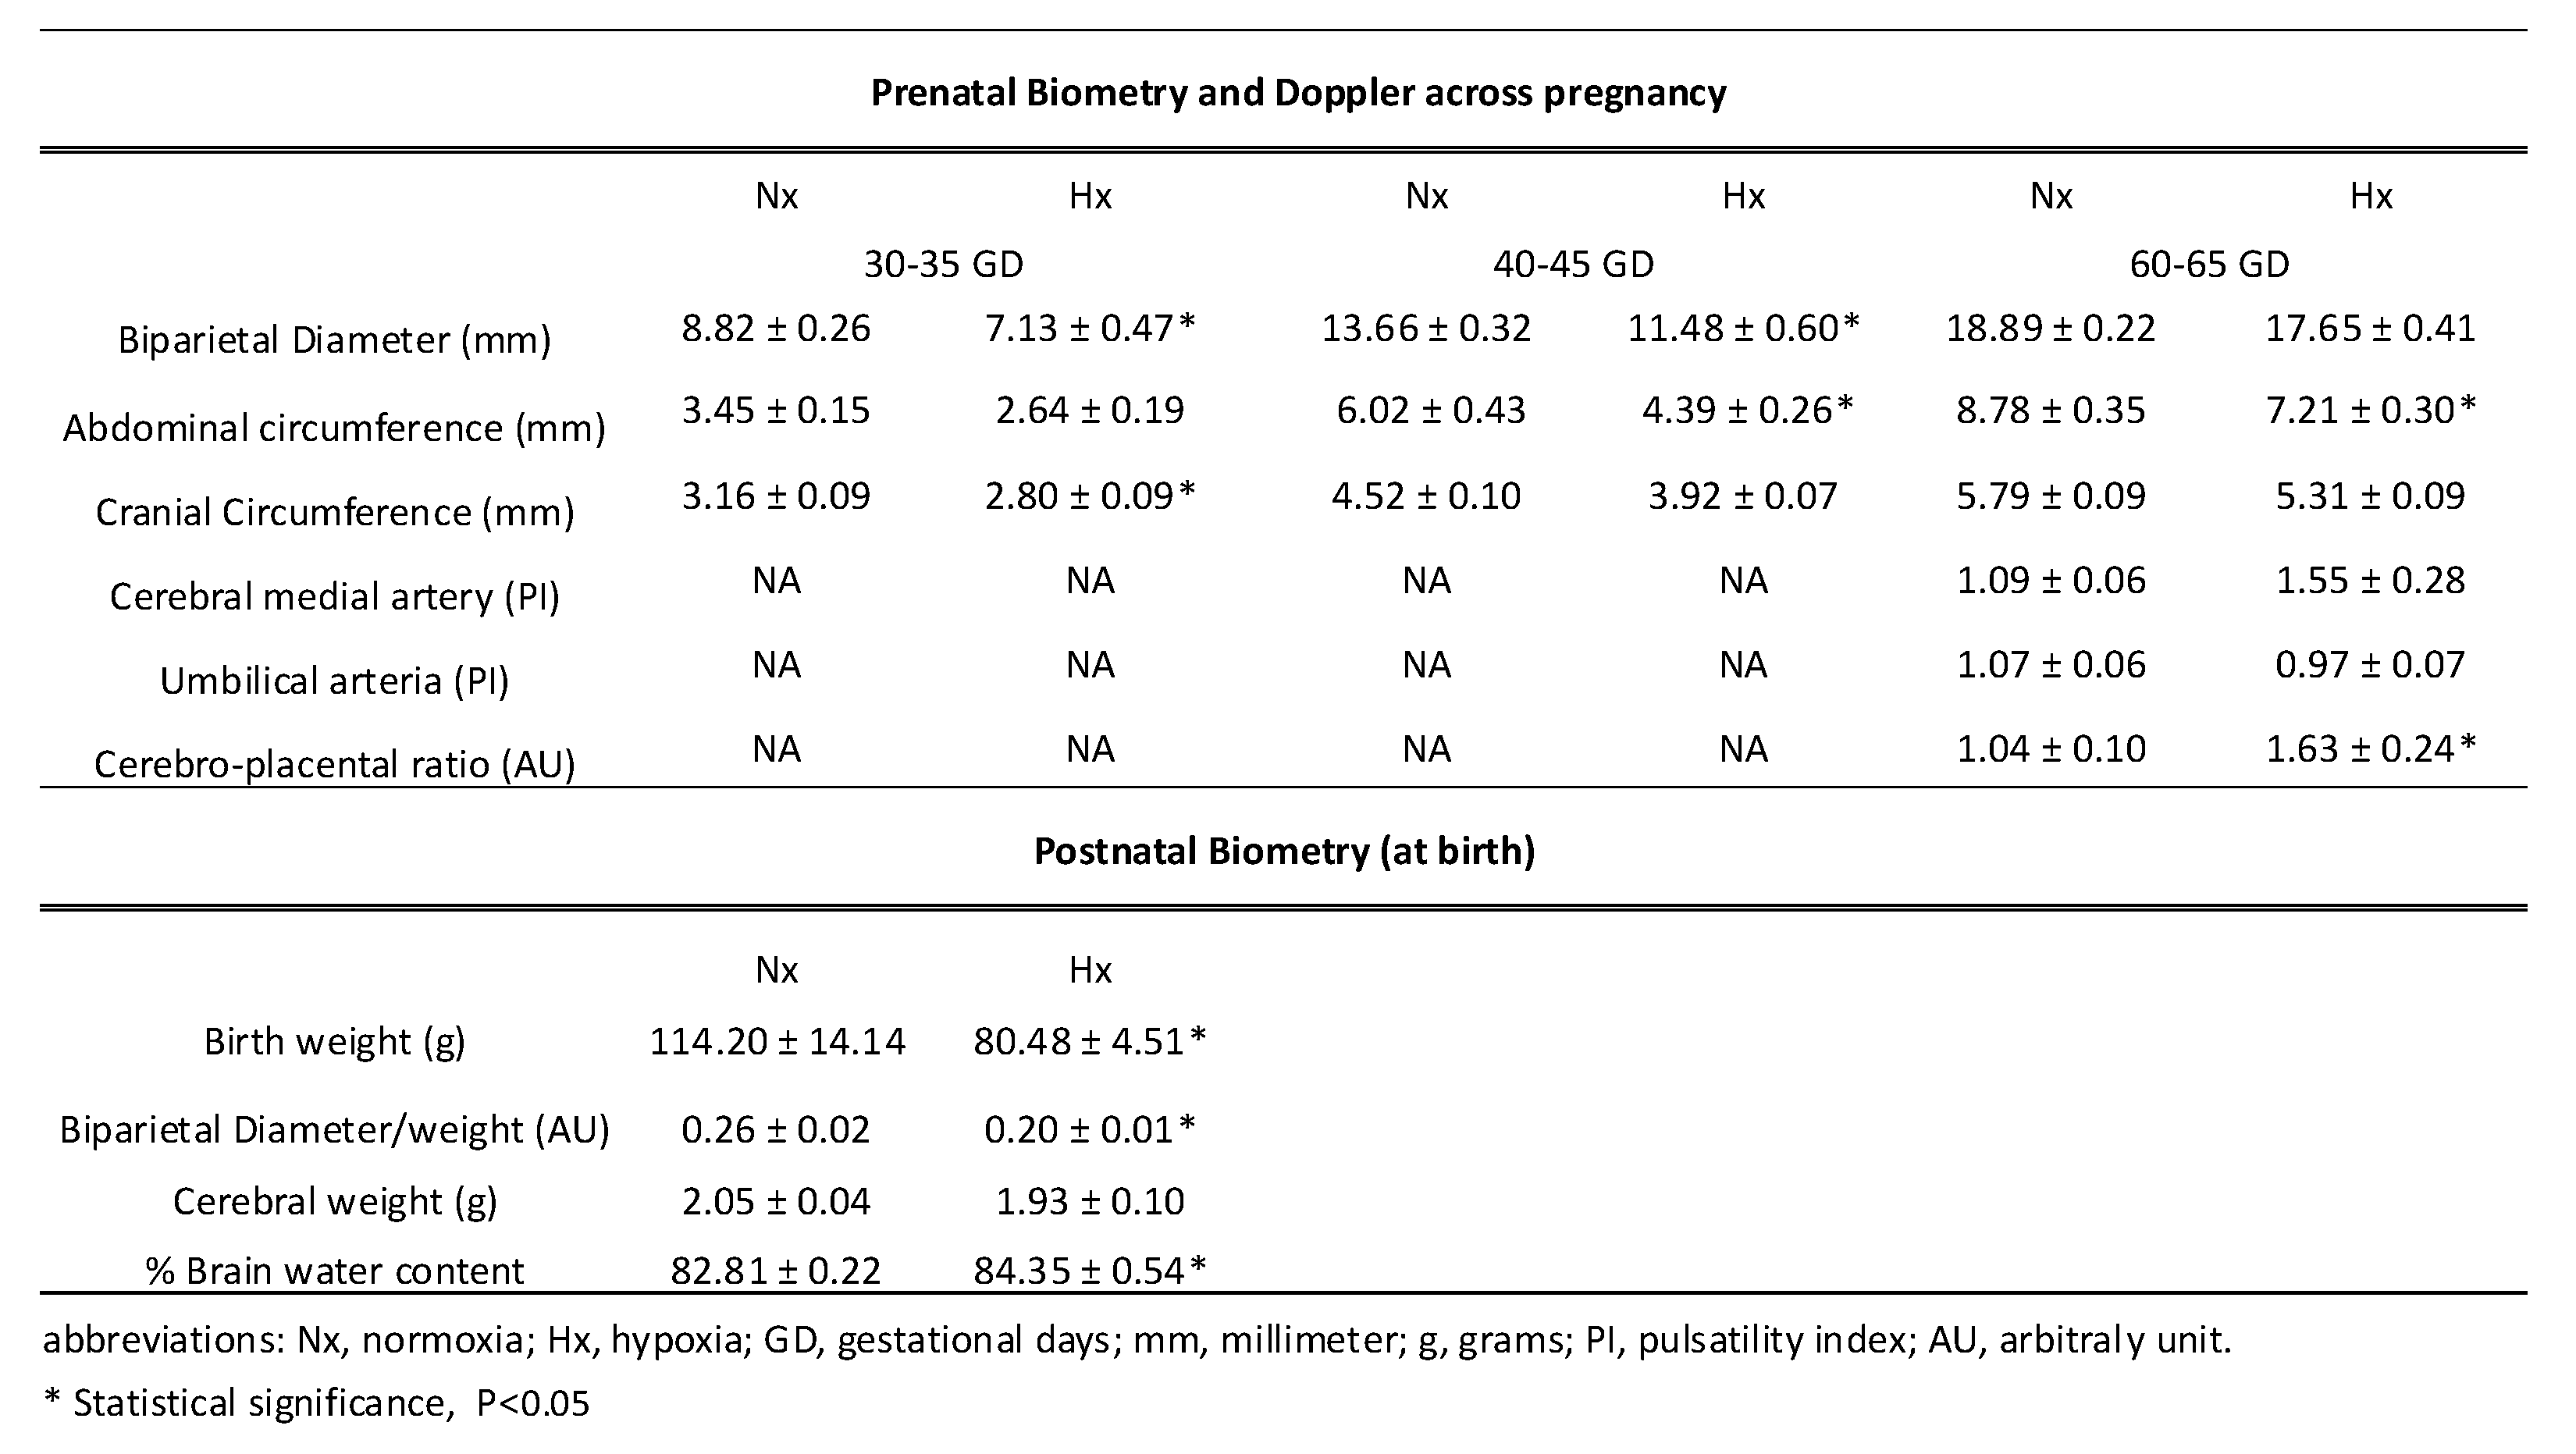
Fetal BPD, AC, and CC were measured using ultrasound in three stages of the pregnancy: GD 30-35, 40-45, and 60-65. Fetuses gestated in chronic hypoxia showed a decrease in their BPD during GD 30-35 and 40-45; in addition, AC decreased towards the end of gestation from GD 40-45 onwards in fetuses gestated in chronic hypoxia compared to control fetuses as shown in Table 1. Finally, in fetuses gestated under hypoxia, only a significant decrease in CC was observed between days GD 30-35 compared to the normoxic group, as described in Table 1. On the other hand, hypoxic fetuses at GD 60-65 showed an increase in the CPR in chronic hypoxic fetuses compared to normoxic fetuses, as shown in Table 1. Gestational hypoxia decreased birth weight and BPD/weight ratio in the hypoxic group compared to the normoxic group, although the cerebral weight was similar between groups, as seen in Table 1.
3.2. Antioxidant Capacity of the Postnatal Brain
The protein levels of SOD1 and SOD3 showed similar expressions among the groups analyzed (Figure 1A, C), while SOD2 protein expression decreased in the hypoxic group compared to the normoxic one (Figure 1B). Nevertheless, no changes in SOD activity were observed between groups (Figure 1D). Concerning protein levels and CAT activity in neonatal brain tissue, our data showed no differences between the analyzed groups (Figure 1E and F). Similarly, the protein levels and activity of the GPX1-2 showed no significant difference between groups, as seen in Figure 1G and H.
3.3. Prooxidant Protein Levels and Oxidative Stress Marker in the Postnatal Brain
Prooxidant sources were measured in total brain homogenate. The isoforms NOX2 and NOX4 showed no differences between groups (Figure 2A and B). However, the protein levels of COX2 were increased in the Hx group relative to the Nx group (Figure 2C). Quantification of mitochondrial cytochrome proteins showed a decrease in CI, CII, and CIII levels of proteins for the hypoxia group compared to the normoxia group (Figure 2D-F). However, no significant changes were observed in CIV and CV (Figure 2G and H). On the other hand, the oxidative stress markers, 4HNE and NT, were increased in the cortex in the hypoxic group relative to the normoxic group (Figure 3).
3.4. Inflammatory Protein Levels in the Postnatal Brain
Inflammatory markers were measured in total brain homogenate. The protein levels of IL-8 and NF-κB were decreased in the hypoxic group compared to the normoxic group (Figure 4B and D); however, no changes were observed in the protein levels of IL-1β, IL-10, TNFα, and iNOS (Figure 4A, C, E, and F). Finally, the expression of iNOS in the total brain was similar between the analyzed groups (Figure 4F).
3.5. Apoptosis and Neuronal Density in Postnatal Brain Cortex
Apoptosis markers were evaluated in the total brain tissue. The protein levels of BCL2 were decreased in the hypoxic group relative to the normoxic one (Figure 5A). In contrast, BAX and cleaved Caspase 3 protein levels showed an increase in the hypoxic group compared to the normoxic (Figure 5B and C). In addition, the immunolocalization of the cleaved Caspase 3 protein in neurons showed a significant increase in the Hx group concerning the Nx group (Figure 5D). On the other hand, the DNA fragmentation measurement through the TUNEL assay showed an increased positive signal in cortex neurons in the hypoxia group compared to the normoxia group (Figure 6A and B). Finally, neuronal density quantified by toloudin staining (Figure 6C) showed a decrease in the number of neurons of the neonates gestated under hypoxia compared to the normoxia group (Figure 6D).
4. Discussion
This study demonstrates that alterations in the oxidative stress balance are associated with detrimental brain effects due to exposure to chronic hypoxia during pregnancy. The adverse environmental conditions to which an individual is exposed during pregnancy, such as intrauterine hypoxia, can predispose to an increased risk of diseases during adulthood with limited treatment options [25,26]. Under physiological conditions, ROS are mediators that fulfill specific functions that contribute to cellular homeostasis [27]. This is achieved by maintaining a balance between the production of oxidative stress-generating sources and the antioxidant machinery that protects from cellular damage; however, during the fetal period, it has been demonstrated that the antioxidant machinery is still immature, reaching maturity at term and in the first days after birth [28,29]. Hypobaric hypoxia during gestation induces FGR associated with decreased prenatal and postnatal biometry. The latter involves the fetal redistribution of cardiac output related to vasodilation of the MCA and increased cerebroplacental ratio, which suggests a brain-sparing phenotype as a chronic response mechanism to hypoxia [5]. Although the mechanistic pathways linking gestational hypoxia, oxidative stress, and placental dysfunction have not been fully elucidated, in sheep gestated and born in chronic hypoxia, there is an increased oxidative stress associated with the programming of prooxidant sources and a decrease in the cardiopulmonary antioxidant machinery [23]. Although our data do not show results in the activity or expression of the antioxidant systems of CAT and SOD in brain tissue, we observed a decrease in the protein levels of GPx1 and a reduction in the total activity in brain tissue of the GPXs. This enzymatic system is susceptible to the cytosolic redox state since it depends on Glutathione (GSH), which is vulnerable to oxidation (GSSG) by uncoupling [30].
There are several ROS sources in the brain. The Nox family proteins are involved in various signalling pathways, including brain adaptation to different physiological and pathophysiological stresses. The main isoforms expressed in the brain parenchyma are Nox2 and Nox4 [10]. While Nox2 and Nox4 seem to be regulated by hyperoxia and hypoxia in postnatal models [31], their contribution to oxidative stress remains to be elucidated in models of prenatal hypoxia. In the present study, we did not observe changes in total brain tissue’s Nox2 and Nox4 levels. NOX can be induced by transactivation through proinflammatory molecules [32]; according to our data, gestational hypoxia in brain tissue decreased the levels of IL-8 without changing IL1β and TNFα. Moreover, the decrease in NFκ- B (p65 subunit) blunted the NOX activation by inflammation, although postnatal and intermittent hypoxia induces pathways associated with HIF-dependent inflammation according to the previous antecedents [33]. However, one limitation of our study is that we analyzed whole brain homogenate and did not assess NOX levels in different areas or cellular in the brain parenchyma.
COX-2 is expressed under normal conditions in the CNS and contributes to fundamental brain functions; however, COX-2 can be induced by post-translational modifications associated with oxidative stress and proinflammatory responses [34]. Our data showed increased levels of lipoperoxidation (4HNE) and protein nitration (nitrotyrosine) due to oxidative stress in the neonatal cortex. On the other hand, assuming that the brain is the most metabolically active tissue, the primary source of ATP is produced in the mitochondria. Under hypoxic conditions, oxygen availability decreases, leading to a reduction in ATP production. The decrease in ATP results in the accumulation of radicals in the electron transport chain, as observed in HIE models [35]. Our results indicate that the main complexes involved in radical generation (complex I, II, and III) decrease, favoring mitochondrial dysfunction. An increase in oxidative stress and mitochondrial dysfunction has been documented in uteroplacental dysfunction, which underlies the pathogenesis of preeclampsia and FGR [12].
On the other hand, studies in animal models of FGR have reported an increase in activated microglia and astrogliosis, indicative of inflammatory responses [36,37]. Neuroinflammation involves an increase in proinflammatory cytokines (IL-1β, IL-8, and TNFα) and a decrease in anti-inflammatory cytokines (IL-10) [38,39]. Proinflammatory cytokines are critical in postnatal acute hypoxia-ischemia brain injury, affecting neonatal brain development [40,41]. Both IL-1β and IL-8 are glycoproteins involved in cellular communication and are secreted in response to injuries [42]. The release of IL-8 and IL-1β in cerebrospinal fluid after a brain injury has been associated with blood-brain barrier (BBB) dysfunction, facilitating the entry of systemic proinflammatory cytokines into the fetal brain [43,44,45]. Our results indicate chronic hypoxia exposure during gestation decreases inflammatory markers, specifically in IL-8 and NFκB. A possible explanation is attributed to the timing of hypoxia exposure during the gestation used for the FGR model and the immaturity of the inflammatory system in response to perinatal stress [46]. FGR caused by intrauterine hypoxia significantly decreased neurotrophic markers such as nerve growth factor (NGF), neurotrophin-3 (NT-3), and neurotrophin-4 (NT-4) in the FGR group compared with the fetus at the appropriate gestational age [47,48]. In addition, in guinea pig models exposed to hypoxemia for 14 days (GD 46-49) and studied at 64 days postnatal, an increase in proinflammatory cytokines was observed, leading to the loss of neuronal cells [37]. Another study using uterine artery ligation for inducing FGR from gestational day 30 did not show changes in the number of neurons but did affect neuroglial development [36,49]. Although this study does not focus on neurodevelopment associated with gestational hypoxia, sufficient data supports our proposal related to the immaturity of the resident proinflammatory system of the brain parenchyma [50].
Several studies have demonstrated that ROS and oxidative stress are pivotal in apoptosis [51,52]. Our results indicate an increased expression of BAX (pro-apoptotic molecule) and cleaved caspase 3 (apoptosis effector), which could be involved in the neuronal decrease observed in the neonatal cortex. Caspase-3 is the most abundant caspase in the brain and appears to play a crucial role during normal development and brain injuries. In addition, the redox regulation of caspase activity seems to involve posttranslational modifications of their catalytic site cysteine residue. The catalytic site cysteines of most caspases are susceptible to oxidation, as demonstrated by previous studies, in which cellular exposure to hydrogen peroxide induces the activation of effector caspases [53]. On the other hand, oxidative stress causes damage to the mitochondrial membrane, allowing the release of cytochrome C (via the intrinsic pathway), which binds to apoptosis protease activating factor 1 (APAF1), subsequently activating caspase-9 and leading to caspase-3 activation [54]. All these data indicate that the presence of mitochondrial dysfunction and oxidative stress caused by gestational hypoxia in the brains of guinea pigs can activate the intrinsic pathway of apoptosis and create an imbalance in the pro and anti-apoptotic molecules [55,56], generating the permeabilization of proapoptotic agents from the mitochondria to the cytosol triggering neuronal apoptosis [57]. However, further studies are needed to determine the effect of neuronal apoptosis on neuronal capacity and the clinical impact of gestational hypoxia.
5. Conclusions
Gestational hypoxia induces a brain-sparing phenotype in guinea pig neonates. Additionally, there is a decrease in antioxidant sources and an increase in prooxidants, resulting in brain oxidative damage. Furthermore, hypoxia leads to mitochondrial dysfunction due to decreased cytochromes I and III expression, accounting for reduced ATP production. These findings ultimately culminate in gestational hypoxia-induced neuronal death through an imbalance between proapoptotic and antiapoptotic factors. Our results establish the groundwork that gestational hypoxia may elicit neuropathologies, as demonstrated in other hypoxia models.
Author Contributions
Conceptualization, A.G.C.; methodology, E.G.F., A.A.P., M.M.A., F.S.P., X.C. and T.A.J.; formal analysis, E.G.F., E.A.H., R.L.C and A.G.C; investigation, E.G.F., E.A.H., R.L.C and A.G.C; resources E.A.H. and A.G.C.; writing—original draft preparation, E.G.F. R.L.C. and A.G.C; writing—review and editing, A.G.C; supervision, E.A.H., R.L.C. and A.G.C.; project administration, E.A.H., and A.G.C..; funding acquisition E.A.H. and A.G.C.. All authors have read and agreed to the published version of the manuscript.
Funding
This work was funded Fondecyt Regular grant N° 1241502 and 1241626.
Institutional Review Board Statement
The animal care, maintenance, and procedures received approval from the Institutional Committee for the Care and Use of Animals (CICUA) of the Universidad de Chile, code 20418-MED-UCH; and were performed according to ARRIVE guidelines and followed EU 2010/63/EU guidelines for animal experiments and the NIH Guide for the Care and Use of Laboratory Animals (NIH Publications No. 8023, revised in 1978).
Conflicts of Interest
The authors declare no conflicts of interest.
Abbreviations
The following abbreviations are used in this manuscript:
| Nx | Normoxia |
| Hx | Hypoxia |
| GD | Gestational Days |
| FGR | Fetal Growth Restriction |
| ROS | Reactive Oxygen Species |
| NOX | NADPH Oxidase |
| SOD | Superoxide Dismutase |
| CAT | Catalase |
| GPX | Glutathione Peroxidase |
| H2O2 | Hydrogen Peroxide |
| GSH | Glutathione (reduced form) |
| GSSG | Glutathione (oxidized form) |
| 4-HNE | 4-Hydroxynonenal |
| NT | 3-Nitrotyrosine |
| TUNEL | TdT-mediated dUTP Nick-End Labeling |
| DAPI | 4’,6-Diamidino-2-phenylindole |
| COX2 | Cyclooxygenase-2 |
| IL-1β | Interleukin 1 beta |
| IL-8 | Interleukin 8 |
| IL-10 | Interleukin 10 |
| TNFα | Tumor Necrosis Factor Alpha |
| iNOS | Inducible Nitric Oxide Synthase |
| NF-κB | Nuclear Factor kappa-light-chain-enhancer of activated B cells |
| BAX | Bcl-2-associated X protein |
| Bcl-xL | B-cell lymphoma-extra large |
| Casp-3 | Caspase-3 |
| OXPHOS | Oxidative Phosphorylation |
| ATP | Adenosine Triphosphate |
| UA | Umbilical Artery |
| MCA | Middle Cerebral Artery |
| PI | Pulsatility Index |
| CPR | Cerebroplacental Ratio |
| HIE | Hypoxic-Ischemic Encephalopathy |
| APAF1 | Apoptotic Protease Activating Factor 1 |
| ELISA | Enzyme-Linked Immunosorbent Assay |
| SEM | Standard Error of the Mean |
| ARRIVE | Animal Research: Reporting of In Vivo Experiments |
| CICUA | Institutional Committee for the Care and Use of Animals |
| NIH | National Institutes of Health |
References
- Gluckman, P.D.; Cutfield, W.; Hofman, P.; Hanson, M.A. The Fetal, Neonatal, and Infant Environments-the Long-Term Consequences for Disease Risk. Early Hum Dev 2005, 81, 51–59. [Google Scholar] [CrossRef] [PubMed]
- Fowden, A.L.; Giussani, D.A.; Forhead, A.J. Intrauterine Programming of Physiological Systems: Causes and Consequences. Physiology (Bethesda) 2006, 21, 29–37. [Google Scholar] [CrossRef]
- Fajersztajn, L.; Veras, M.M. Hypoxia: From Placental Development to Fetal Programming. Birth Defects Res 2017, 109, 1377–1385. [Google Scholar] [CrossRef] [PubMed]
- Sun, C.; Groom, K.M.; Oyston, C.; Chamley, L.W.; Clark, A.R.; James, J.L. The Placenta in Fetal Growth Restriction: What Is Going Wrong? Placenta 2020, 96, 10–18. [Google Scholar] [CrossRef] [PubMed]
- Giussani, D.A. The Fetal Brain Sparing Response to Hypoxia: Physiological Mechanisms. J Physiol 2016, 594, 1215. [Google Scholar] [CrossRef]
- Demirci-Çekiç, S.; Özkan, G.; Avan, A.N.; Uzunboy, S.; Çapanoğlu, E.; Apak, R. Biomarkers of Oxidative Stress and Antioxidant Defense. J Pharm Biomed Anal 2022, 209. [Google Scholar] [CrossRef]
- Chen, R.; Lai, U.H.; Zhu, L.; Singh, A.; Ahmed, M.; Forsyth, N.R. Reactive Oxygen Species Formation in the Brain at Different Oxygen Levels: The Role of Hypoxia Inducible Factors. Front Cell Dev Biol 2018, 6. [Google Scholar] [CrossRef]
- McGarry, T.; Biniecka, M.; Veale, D.J.; Fearon, U. Hypoxia, Oxidative Stress and Inflammation. Free Radic Biol Med 2018, 125, 15–24. [Google Scholar] [CrossRef]
- Lou, Z.; Wang, A.P.; Duan, X.M.; Hu, G.H.; Song, G.L.; Zuo, M.L.; Yang, Z.B. Upregulation of NOX2 and NOX4 Mediated by TGF-β Signaling Pathway Exacerbates Cerebral Ischemia/Reperfusion Oxidative Stress Injury. Cell Physiol Biochem 2018, 46, 2103–2113. [Google Scholar] [CrossRef]
- Wang, J.; Liu, Y.; Shen, H.; Li, H.; Wang, Z.; Chen, G. Nox2 and Nox4 Participate in ROS-Induced Neuronal Apoptosis and Brain Injury During Ischemia-Reperfusion in Rats. Acta Neurochir Suppl 2020, 127, 47–54. [Google Scholar] [CrossRef]
- Gaur, P.; Prasad, S.; Kumar, B.; Sharma, S.K.; Vats, P. High-Altitude Hypoxia Induced Reactive Oxygen Species Generation, Signaling, and Mitigation Approaches. Int J Biometeorol 2021, 65, 601–615. [Google Scholar] [CrossRef]
- Hu, X.Q.; Zhang, L. Hypoxia and Mitochondrial Dysfunction in Pregnancy Complications. Antioxidants 2021, 10, 405. [Google Scholar] [CrossRef]
- Herrera, E.A.; Krause, B.; Ebensperger, G.; Reyes, R. V.; Casanello, P.; Parra-Cordero, M.; Llanos, A.J. The Placental Pursuit for an Adequate Oxidant Balance between the Mother and the Fetus. Front Pharmacol 2014, 5, 149. [Google Scholar] [CrossRef] [PubMed]
- Ahamad, T.; Ansari, W.A.; Negi, D.S.; Khan, M.F. NON-ENZYMATIC NATURAL REACTIVE OXYGEN SCAVENGERS (ROS): A REVIEW ON STRUCTURES AND MODE OF ACTION. Era’s Journal of Medical Research 2019, 6, 103–112. [Google Scholar] [CrossRef]
- Ozsurekci, Y.; Aykac, K. Oxidative Stress Related Diseases in Newborns. Oxid Med Cell Longev 2016, 2016. [Google Scholar] [CrossRef] [PubMed]
- Panfoli, I.; Candiano, G.; Malova, M.; De Angelis, L.; Cardiello, V.; Buonocore, G.; Ramenghi, L.A. Oxidative Stress as a Primary Risk Factor for Brain Damage in Preterm Newborns. Front Pediatr 2018, 6. [Google Scholar] [CrossRef]
- Baud, O.; Greene, A.E.; Li, J.; Wang, H.; Volpe, J.J.; Rosenberg, P.A. Glutathione Peroxidase-Catalase Cooperativity Is Required for Resistance to Hydrogen Peroxide by Mature Rat Oligodendrocytes. J Neurosci 2004, 24, 1531–1540. [Google Scholar] [CrossRef]
- Hulbert, A.J.; Pamplona, R.; Buffenstein, R.; Buttemer, W.A. Life and Death: Metabolic Rate, Membrane Composition, and Life Span of Animals. Physiol Rev 2007, 87, 1175–1213. [Google Scholar] [CrossRef]
- Hassan, W.; Noreen, H.; Rehman, S.; Kamal, M.A.; da Rocha, J.B.T. Association of Oxidative Stress with Neurological Disorders. Curr Neuropharmacol 2022, 20, 1046–1072. [Google Scholar] [CrossRef]
- Astorga, C.R.; González-Candia, A.; Candia, A.A.; Figueroa, E.G.; Cañas, D.; Ebensperger, G.; Reyes, R. V.; Llanos, A.J.; Herrera, E.A. Melatonin Decreases Pulmonary Vascular Remodeling and Oxygen Sensitivity in Pulmonary Hypertensive Newborn Lambs. Front Physiol 2018, 9, 348028. [Google Scholar] [CrossRef]
- Candia, A.A.; Jiménez, T.; Navarrete, Á.; Beñaldo, F.; Silva, P.; García-Herrera, C.; Sferruzzi-Perri, A.N.; Krause, B.J.; González-Candia, A.; Herrera, E.A. Developmental Ultrasound Characteristics in Guinea Pigs: Similarities with Human Pregnancy. Vet Sci 2023, 10. [Google Scholar] [CrossRef] [PubMed]
- Torres, F.; González-Candia, A.; Montt, C.; Ebensperger, G.; Chubretovic, M.; Serõn-Ferré, M.; Reyes, R. V.; Llanos, A.J.; Herrera, E.A. Melatonin Reduces Oxidative Stress and Improves Vascular Function in Pulmonary Hypertensive Newborn Sheep. J Pineal Res 2015, 58, 362–373. [Google Scholar] [CrossRef]
- Gonzalez-Candia, A.; Veliz, M.; Carrasco-Pozo, C.; Castillo, R.L.; Cárdenas, J.C.; Ebensperger, G.; Reyes, R. V.; Llanos, A.J.; Herrera, E.A. Antenatal Melatonin Modulates an Enhanced Antioxidant/pro-Oxidant Ratio in Pulmonary Hypertensive Newborn Sheep. Redox Biol 2019, 22, 101128. [Google Scholar] [CrossRef] [PubMed]
- Yang, X.; Zhang, J.; Cheng, Y.; Cui, M.; Jiang, Z.; Fan, C.; Chen, J.; Qi, L.; Liu, H.; Bao, D. Tenofovir Disoproxil Fumarate Mediates Neuronal Injury by Inducing Neurotoxicity. Eur J Clin Microbiol Infect Dis 2023, 42, 1195–1205. [Google Scholar] [CrossRef]
- Lau, C.; Rogers, J.M.; Desai, M.; Ross, M.G. Fetal Programming of Adult Disease: Implications for Prenatal Care. Obstetrics and gynecology 2011, 117, 978–985. [Google Scholar] [CrossRef]
- Coe, C.L.; Lubach, G.R. Fetal programming: Prenatal origins of health and illness. Curr Dir Psychol Sci 2008, 17, 36–41. [CrossRef]
- Valko, M.; Leibfritz, D.; Moncol, J.; Cronin, M.T.D.; Mazur, M.; Telser, J. Free Radicals and Antioxidants in Normal Physiological Functions and Human Disease. Int J Biochem Cell Biol 2007, 39, 44–84. [Google Scholar] [CrossRef] [PubMed]
- Frank, L.; Groseclose, E.E. Preparation for Birth into an O2-Rich Environment: The Antioxidant Enzymes in the Developing Rabbit Lung. Pediatr Res 1984, 18, 240–244. [Google Scholar] [CrossRef]
- Davis, J.M.; Auten, R.L. Maturation of the Antioxidant System and the Effects on Preterm Birth. Semin Fetal Neonatal Med 2010, 15, 191–195. [Google Scholar] [CrossRef]
- Uchoa, M.F.; de Souza, L.F.; dos Santos, D.B.; Peres, T.V.; Mello, D.F.; Leal, R.B.; Farina, M.; Dafre, A.L. Modulation of Brain Glutathione Reductase and Peroxiredoxin 2 by α-Tocopheryl Phosphate. Cell Mol Neurobiol 2016, 36, 1015–1022. [Google Scholar] [CrossRef]
- Terraneo, L.; Paroni, R.; Bianciardi, P.; Giallongo, T.; Carelli, S.; Gorio, A.; Samaja, M. Brain Adaptation to Hypoxia and Hyperoxia in Mice. Redox Biol 2016, 11, 12. [Google Scholar] [CrossRef] [PubMed]
- Bedard, K.; Krause, K.H. The NOX Family of ROS-Generating NADPH Oxidases: Physiology and Pathophysiology. Physiol Rev 2007, 87, 245–313. [Google Scholar] [CrossRef]
- Gonzalez-Candia, A.; Herrera, E.A. High Altitude Pregnancies and Vascular Dysfunction: Observations From Latin American Studies. Front Physiol 2021, 12. [Google Scholar] [CrossRef] [PubMed]
- Fathali, N.; Ostrowski, R.P.; Lekic, T.; Jadhav, V.; Tong, W.; Tang, J.; Zhang, J.H. Cyclooxygenase-2 Inhibition Provides Lasting Protection against Neonatal Hypoxic-Ischemic Brain Injury. Crit Care Med 2010, 38, 572. [Google Scholar] [CrossRef]
- Odegaard, A.O.; Jacobs, D.R.; Sanchez, O.A.; Goff, D.C.; Reiner, A.P.; Gross, M.D. Oxidative Stress, Inflammation, Endothelial Dysfunction and Incidence of Type 2 Diabetes. Cardiovasc Diabetol 2016, 15. [Google Scholar] [CrossRef]
- Rodríguez, M.; Valez, V.; Cimarra, C.; Blasina, F.; Radi, R. Hypoxic-Ischemic Encephalopathy and Mitochondrial Dysfunction: Facts, Unknowns, and Challenges. Antioxid Redox Signal 2020, 33, 247–262. [Google Scholar] [CrossRef] [PubMed]
- Mallard, C.; Loeliger, M.; Copolov, D.; Rees, S. Reduced Number of Neurons in the Hippocampus and the Cerebellum in the Postnatal Guinea-Pig Following Intrauterine Growth-Restriction. Neuroscience 2000, 100, 327–333. [Google Scholar] [CrossRef]
- Guo, R.; Hou, W.; Dong, Y.; Yu, Z.; Stites, J.; Weiner, C.P. Brain Injury Caused by Chronic Fetal Hypoxemia Is Mediated by Inflammatory Cascade Activation. Reprod Sci 2010, 17, 540–548. [Google Scholar] [CrossRef]
- Wixey, J.A.; Chand, K.K.; Colditz, P.B.; Bjorkman, S.T. Review: Neuroinflammation in Intrauterine Growth Restriction. Placenta 2017, 54, 117–124. [Google Scholar] [CrossRef]
- Wan, L.; Luo, K.; Chen, P. Mechanisms Underlying Neurologic Injury in Intrauterine Growth Restriction. J Child Neurol 2021, 36, 776–784. [Google Scholar] [CrossRef]
- Huang, Z.; Liu, J.; Cheung, P.Y.; Chen, C. Long-Term Cognitive Impairment and Myelination Deficiency in a Rat Model of Perinatal Hypoxic-Ischemic Brain Injury. Brain Res 2009, 1301, 100–109. [Google Scholar] [CrossRef] [PubMed]
- Fan, L.W.; Lin, S.; Pang, Y.; Rhodes, P.G.; Cai, Z. Minocycline Attenuates Hypoxia-Ischemia-Induced Neurological Dysfunction and Brain Injury in the Juvenile Rat. Eur J Neurosci 2006, 24, 341–350. [Google Scholar] [CrossRef] [PubMed]
- Girard, S.; Kadhim, H.; Roy, M.; Lavoie, K.; Brochu, M.E.; Larouche, A.; Sébire, G. Role of Perinatal Inflammation in Cerebral Palsy. Pediatr Neurol 2009, 40, 168–174. [Google Scholar] [CrossRef] [PubMed]
- Kossmann, T.; Stahel, P.F.; Lenzlinger, P.M.; Redl, H.; Dubs, R.W.; Trentz, O.; Schlag, G.; Morganti-Kossmann, M.C. Interleukin-8 Released into the Cerebrospinal Fluid after Brain Injury Is Associated with Blood-Brain Barrier Dysfunction and Nerve Growth Factor Production. J Cereb Blood Flow Metab 1997, 17, 280–289. [Google Scholar] [CrossRef]
- Aly, H.; Khashaba, M.T.; El-Ayouty, M.; El-Sayed, O.; Hasanein, B.M. IL-1beta, IL-6 and TNF-Alpha and Outcomes of Neonatal Hypoxic Ischemic Encephalopathy. Brain Dev 2006, 28, 178–182. [Google Scholar] [CrossRef]
- Sadowska, G.B.; Chen, X.; Zhang, J.; Lim, Y.P.; Cummings, E.E.; Makeyev, O.; Besio, W.G.; Gaitanis, J.; Padbury, J.F.; Banks, W.A.; et al. Interleukin-1β Transfer across the Blood–Brain Barrier in the Ovine Fetus. Journal of Cerebral Blood Flow & Metabolism 2015, 35, 1388. [Google Scholar] [CrossRef]
- Giannopoulou, I.; Pagida, M.A.; Briana, D.D.; Panayotacopoulou, M.T. Perinatal Hypoxia as a Risk Factor for Psychopathology Later in Life: The Role of Dopamine and Neurotrophins. Hormones (Athens) 2018, 17, 25–32. [Google Scholar] [CrossRef]
- Malamitsi-Puchner, A.; Nikolaou, K.E.; Economou, E.; Boutsikou, M.; Boutsikou, T.; Kyriakakou, M.; Puchner, K.P.; Hassiakos, D. Intrauterine Growth Restriction and Circulating Neurotrophin Levels at Term. Early Hum Dev 2007, 83, 465–469. [Google Scholar] [CrossRef]
- Chung, Y.; So, K.; Kim, E.; Kim, S.; Jeon, Y. Immunoreactivity of Neurogenic Factor in the Guinea Pig Brain after Prenatal Hypoxia. Ann Anat 2015, 200, 66–72. [Google Scholar] [CrossRef]
- Tolcos, M.; Mcgregor, H.; Walker, D.; Rees, S. Chronic Prenatal Exposure to Carbon Monoxide Results in a Reduction in Tyrosine Hydroxylase-Immunoreactivity and an Increase in Choline Acetyltransferase-Immunoreactivity in the Fetal Medulla: Implications for Sudden Infant Death Syndrome. J Neuropathol Exp Neurol 2000, 59, 218–228. [Google Scholar] [CrossRef]
- Kannan, K.; Jain, S.K. Oxidative Stress and Apoptosis. Pathophysiology 2000, 7, 153–163. [Google Scholar] [CrossRef] [PubMed]
- Popa-Wagner, A.; Mitran, S.; Sivanesan, S.; Chang, E.; Buga, A.M. ROS and Brain Diseases: The Good, the Bad, and the Ugly. Oxid Med Cell Longev 2013, 2013. [Google Scholar] [CrossRef]
- Ultanir, S.; Shetty, A.S.; Constantin Badea, T.; Sun, M.; Wang, B.; Zeng, H.; Liu, J. Effects of Prenatal Hypoxia on Nervous System Development and Related Diseases. Front Neurosci 2021, 15, 755554. [Google Scholar] [CrossRef]
- Gu, M.; Mei, X.L.; Zhao, Y.N. Sepsis and Cerebral Dysfunction: BBB Damage, Neuroinflammation, Oxidative Stress, Apoptosis and Autophagy as Key Mediators and the Potential Therapeutic Approaches. Neurotox Res 2021, 39, 489–503. [Google Scholar] [CrossRef] [PubMed]
- Silva, F.F.V. e.; Padín-Iruegas, M.E.; Caponio, V.C.A.; Lorenzo-Pouso, A.I.; Saavedra-Nieves, P.; Chamorro-Petronacci, C.M.; Suaréz-Peñaranda, J.; Pérez-Sayáns, M. Caspase 3 and Cleaved Caspase 3 Expression in Tumorogenesis and Its Correlations with Prognosis in Head and Neck Cancer: A Systematic Review and Meta-Analysis. Int J Mol Sci 2022, 23, 11937. [Google Scholar] [CrossRef]
- Delivoria-Papadopoulos, M.; Mishra, O.P. Mechanisms of Perinatal Cerebral Injury in Fetus and Newborn. Ann N Y Acad Sci 2000, 900, 159–168. [Google Scholar] [CrossRef]
- Blomgren, K.; Hagberg, H. Free Radicals, Mitochondria, and Hypoxia-Ischemia in the Developing Brain. Free Radic Biol Med 2006, 40, 388–397. [Google Scholar] [CrossRef]
Figure 1.
Antioxidant proteins expression and activity in the neonatal brain. Protein expression by Westen blot and activity levels by ELISA kit of (A) SOD1, (B) SOD2, (C) SOD3, (D) total SOD activity, (E) CAT, (F) CAT activity, (G) GPX1-2 and (H) GPX total activity. (I) shown the blots with the molecular weight and ponceau corresponding to each membrane for each protein. Groups are neonates gestated in normoxia (Nx, n=5, black bars, and circles) or hypobaric hypoxia (Hx, n=5, blue bars, and circles). Data expressed as mean ±S.E.M. and compared using a Mann-Whitney t-test. Significant differences (P ≤0.05): * vs Hx.
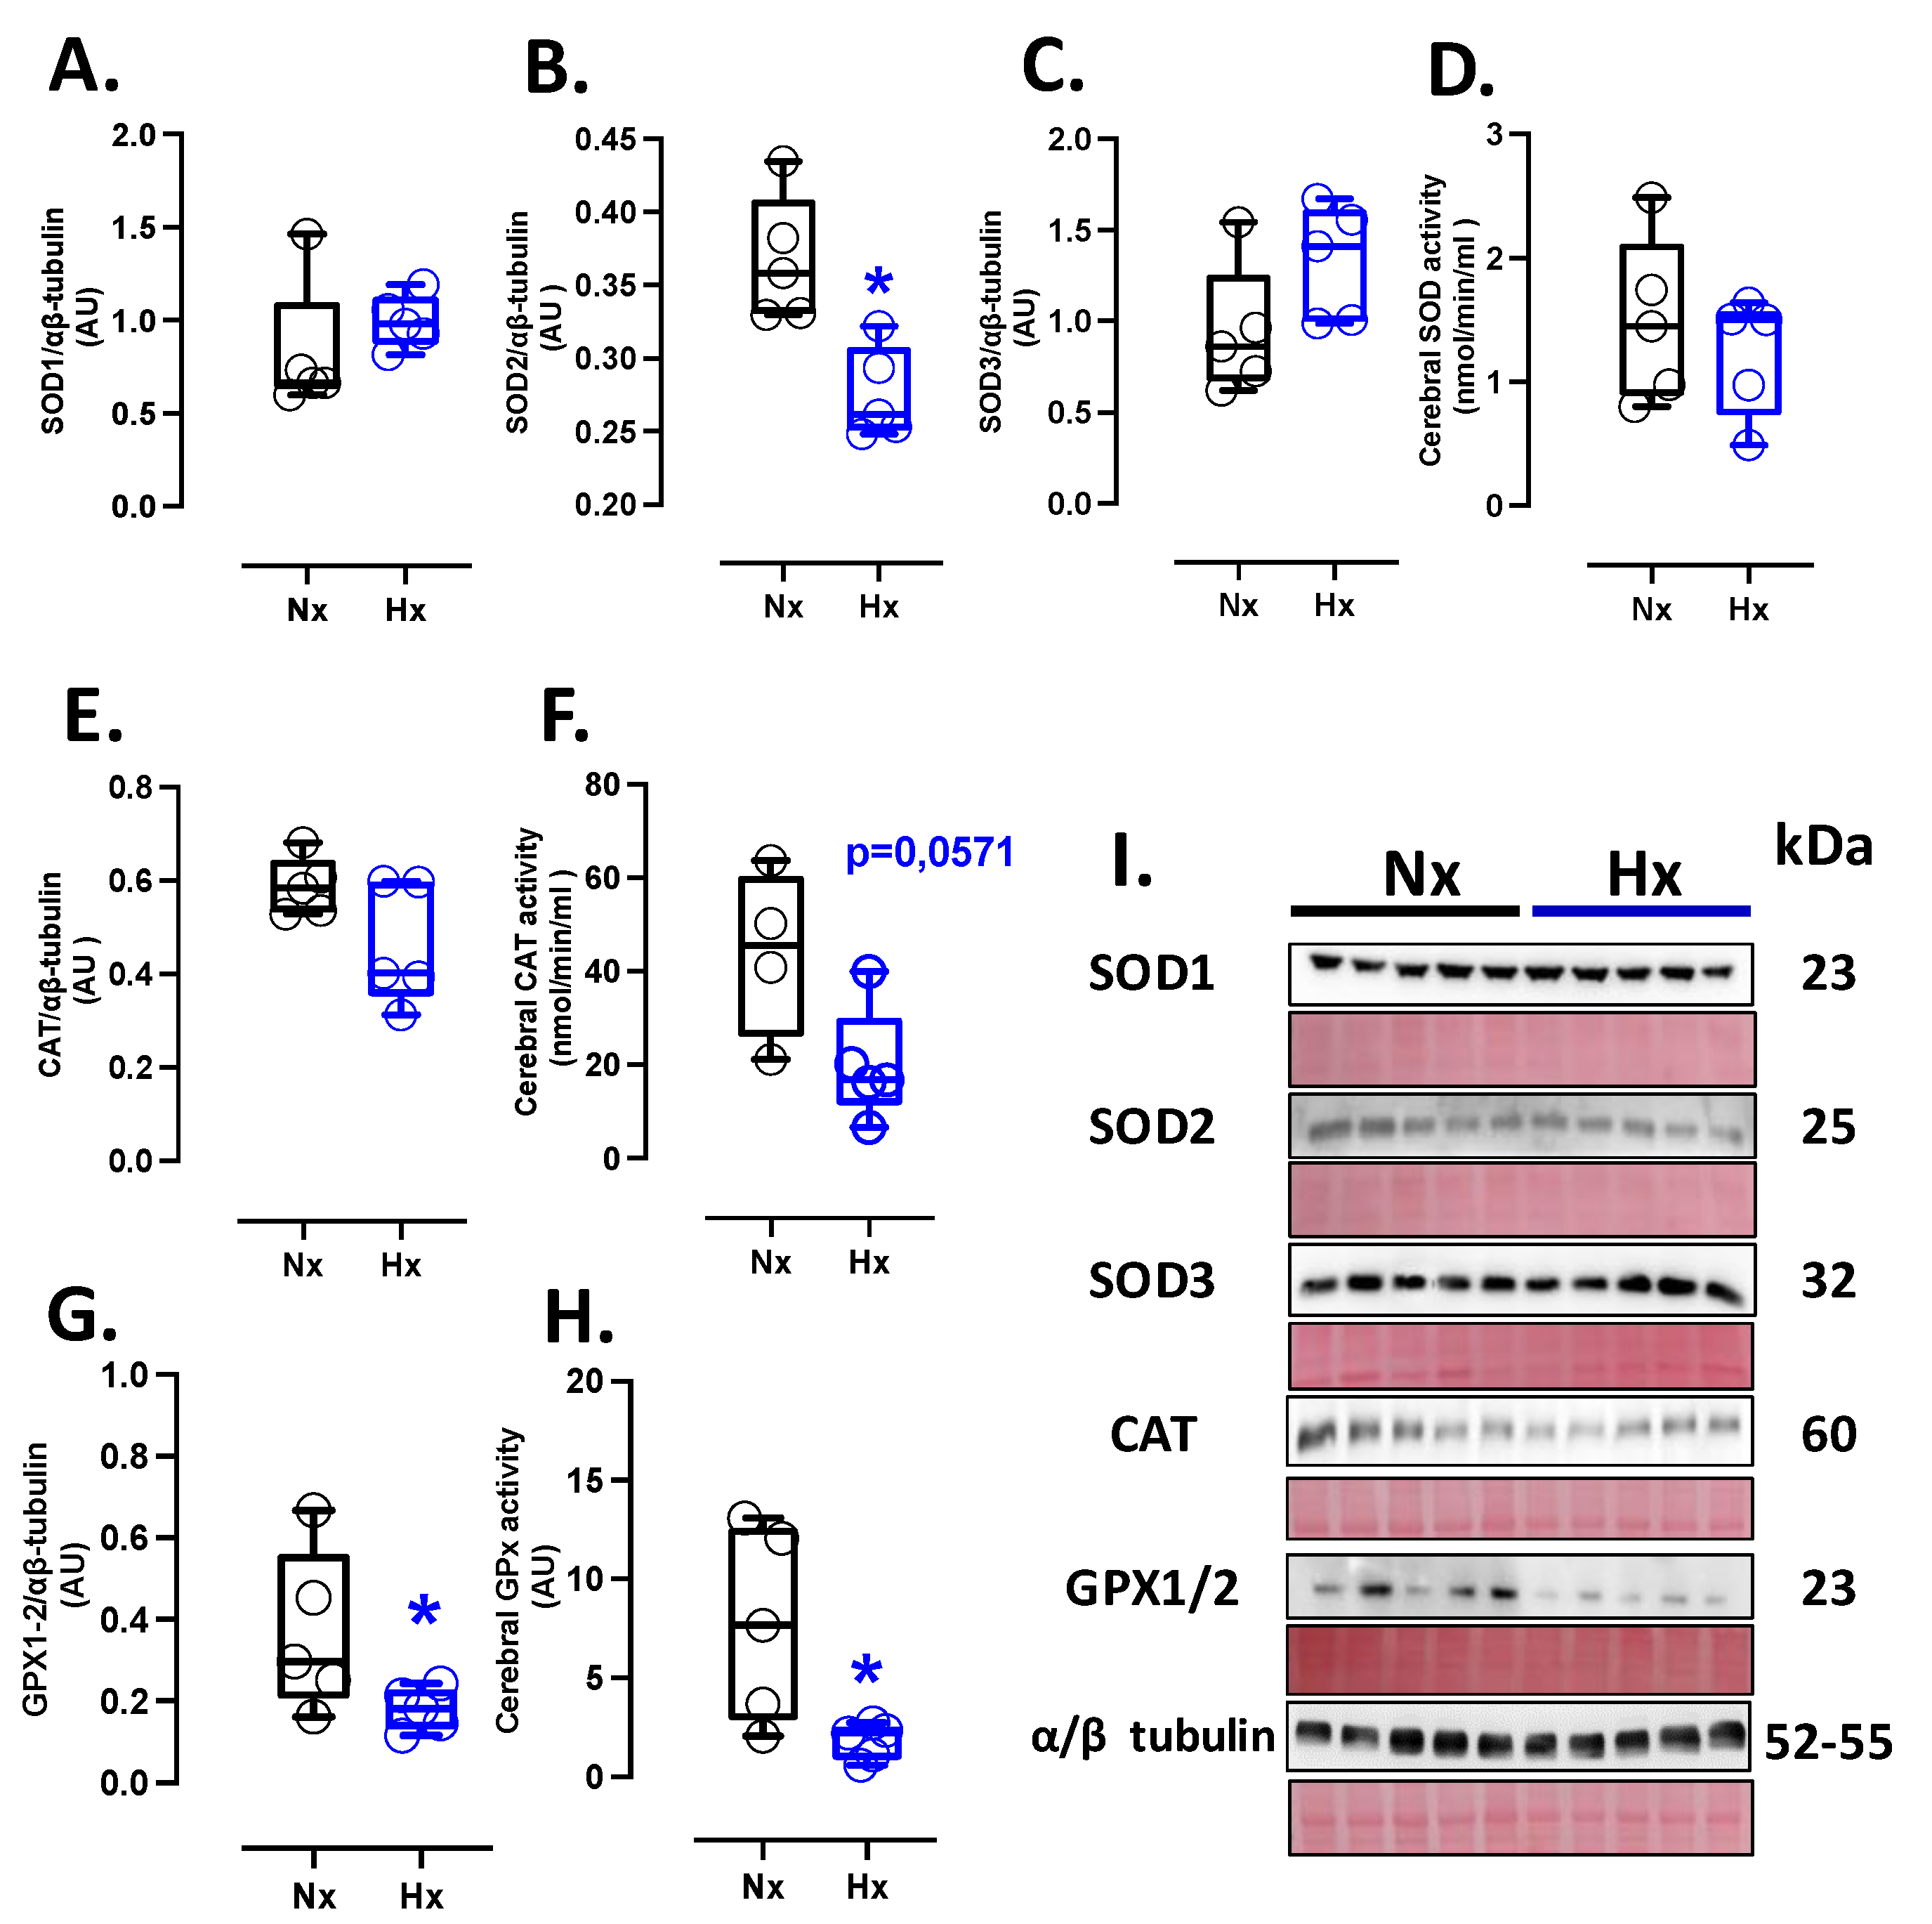
Figure 2.
Prooxidants proteins expression in the neonatal brain. Protein expression by Westen blot of (A) NOX2, (B) NOX4, (C) COX2 and OXPHOS: (D) Cytochrome I or NDUFB8 (NADH:ubiquinone oxidoreductase subunit B8), (E) Cytochrome II or SDHB (Succinate dehydrogenase cytochrome b), (F) Cytochrome III or UQCRC2 (ubiquinol-cytochrome c reductase core protein 2), (G) Cytochrome IV or MTCO1 (Mitochondrially Encoded Cytochrome C Oxidase I) and (H) Cytochrome V or ATP5A (ATP Synthase Subunit Alpha, Mitochondrial). (I) shown the blots with the molecular weight and ponceau corresponding to each membrane for each protein. Groups are neonates gestated in normoxia (Nx, n=5, black bars, and circles) or hypobaric hypoxia (Hx, n=5, blue bars, and circles). Data expressed as mean ±S.E.M. and compared using a Mann-Whitney t-test. Significant differences (P ≤0.05): * vs Hx.
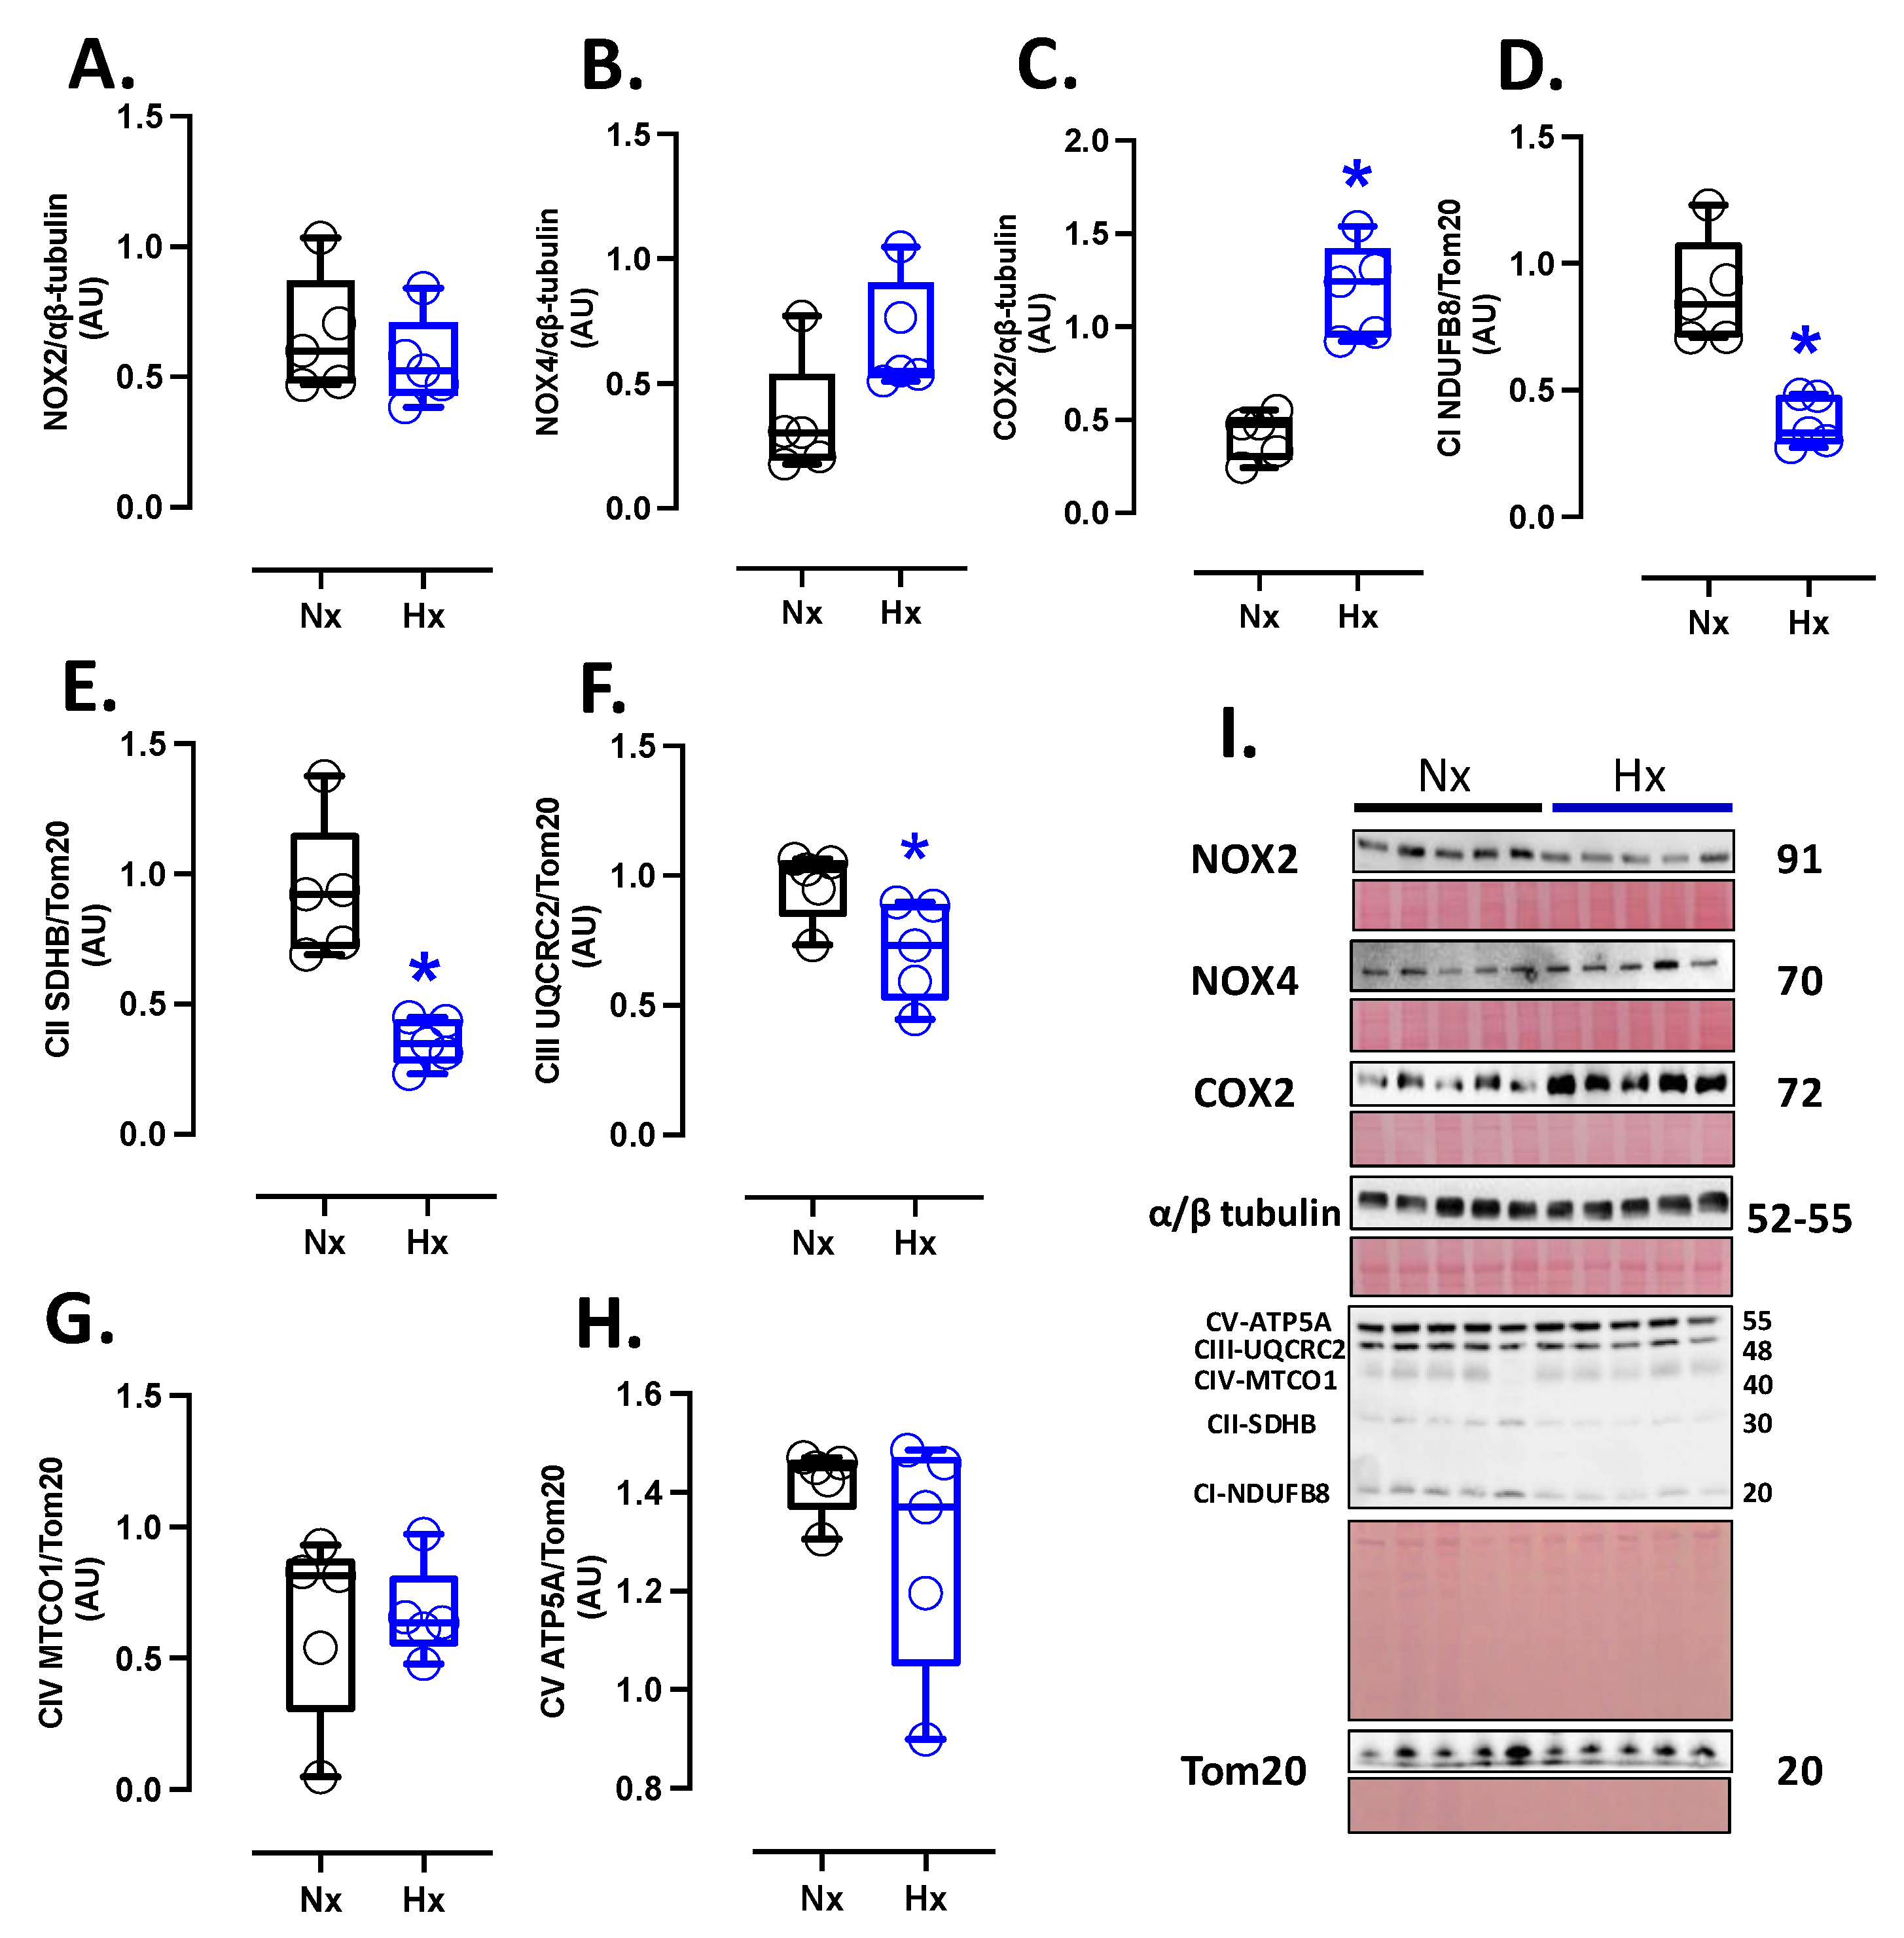
Figure 3.
Oxidative stress markers in the neonatal cortex. Immunohistochemistry of (A) IP (8-isoprostane), (B) 4HNE (4-Hydroxynonenal), and (C) NT (3-Nitrotyrosine) with representative micrographs (40x, panel below). Groups are neonates gestated in normoxia (Nx, n=5, black bars and circles) or hypobaric hypoxia (Hx, n=5, blue bars). Bar in the micrographs =100 μm. Reddish- brown color indicate positive staining and the arrows show cortical neurons. Data expressed as mean ±S.E.M. and compared using a Mann-Whitney t-test. Significant differences (P ≤0.05): * vs Hx.
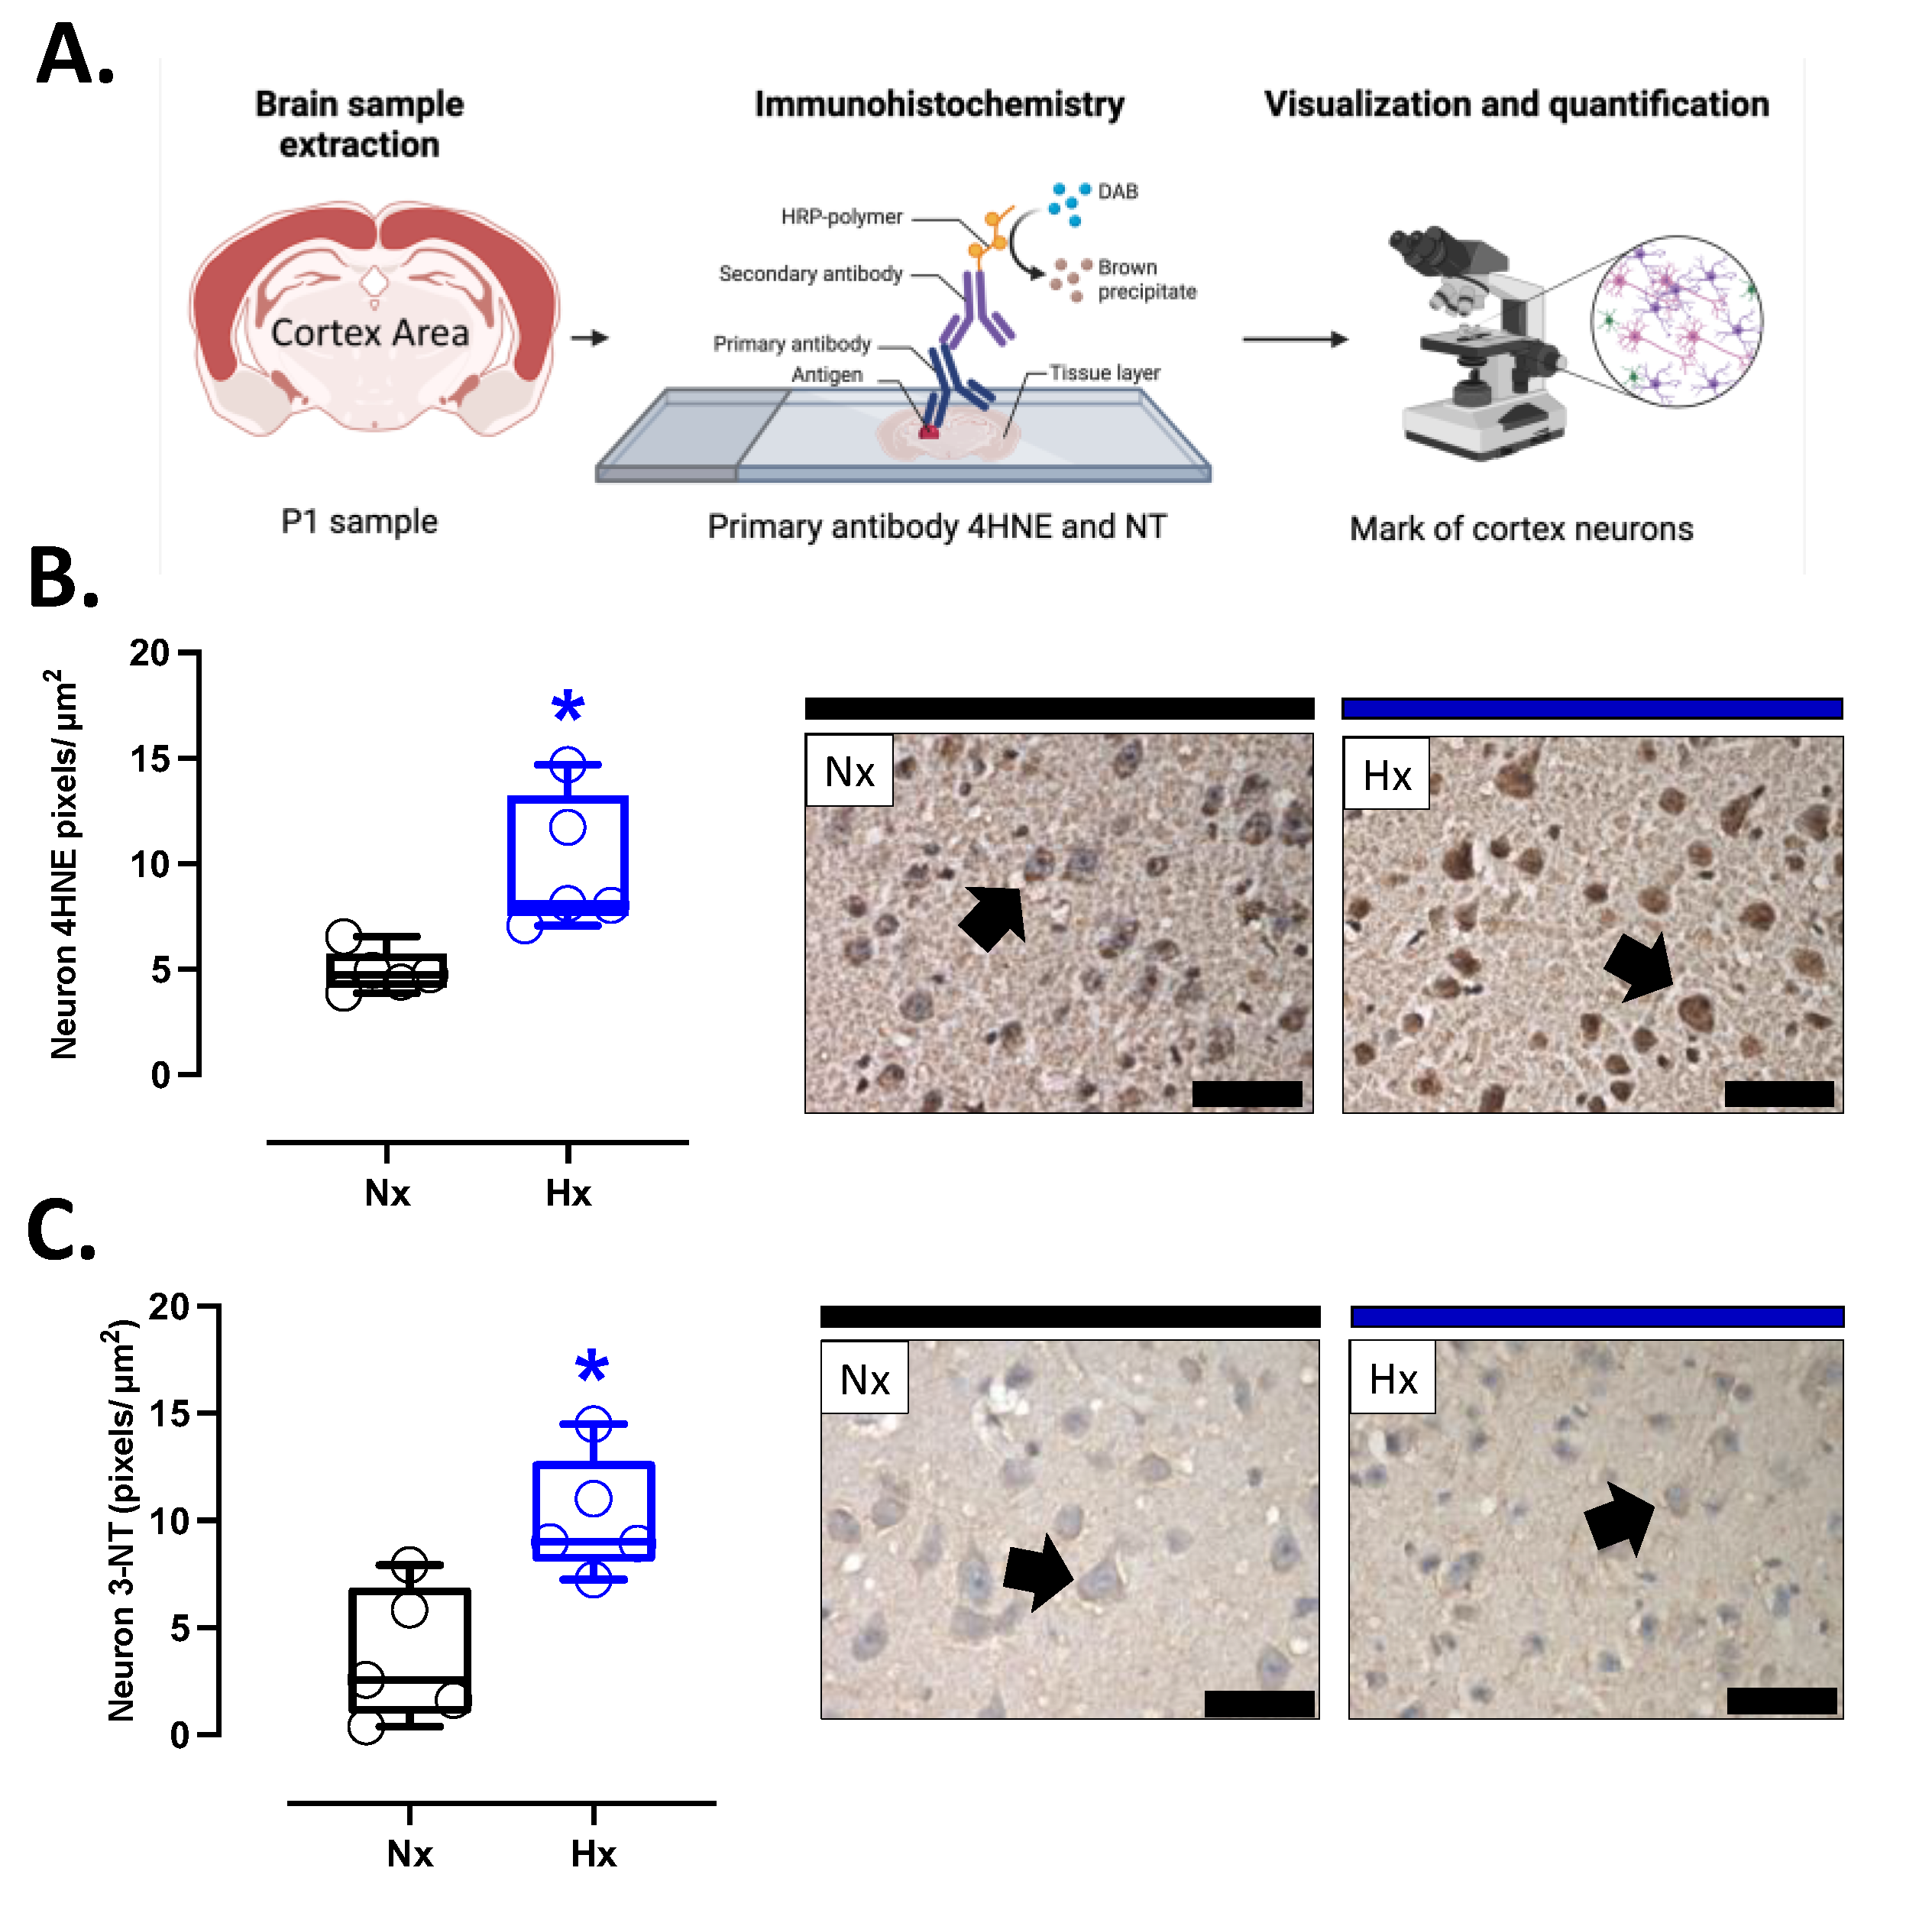
Figure 4.
Inflammation-related protein expression in the neonatal brain. Protein expression by Westen blot of (A) IL-1β (Interleukin 1β), (B) IL-8 (Interleukin 8), (C) IL-10 (Interleukin 10), (D) NF-κB (Nuclear factor kappa-light-chain-enhancer of activated B cells), (E) TNFα (tumor necrosis factor-alpha) and (F) iNOS (Inducible nitric oxide synthase). (G) shown the blots with the molecular weight and ponceau corresponding to each membrane for each protein. Groups are neonates gestated in normoxia (Nx, n=5, black bars, and circles) or hypobaric hypoxia (Hx, n=5, blue bars). Data expressed as mean ±S.E.M. and compared using a Mann-Whitney t-test. Significant differences (P ≤0.05): * vs Hx.
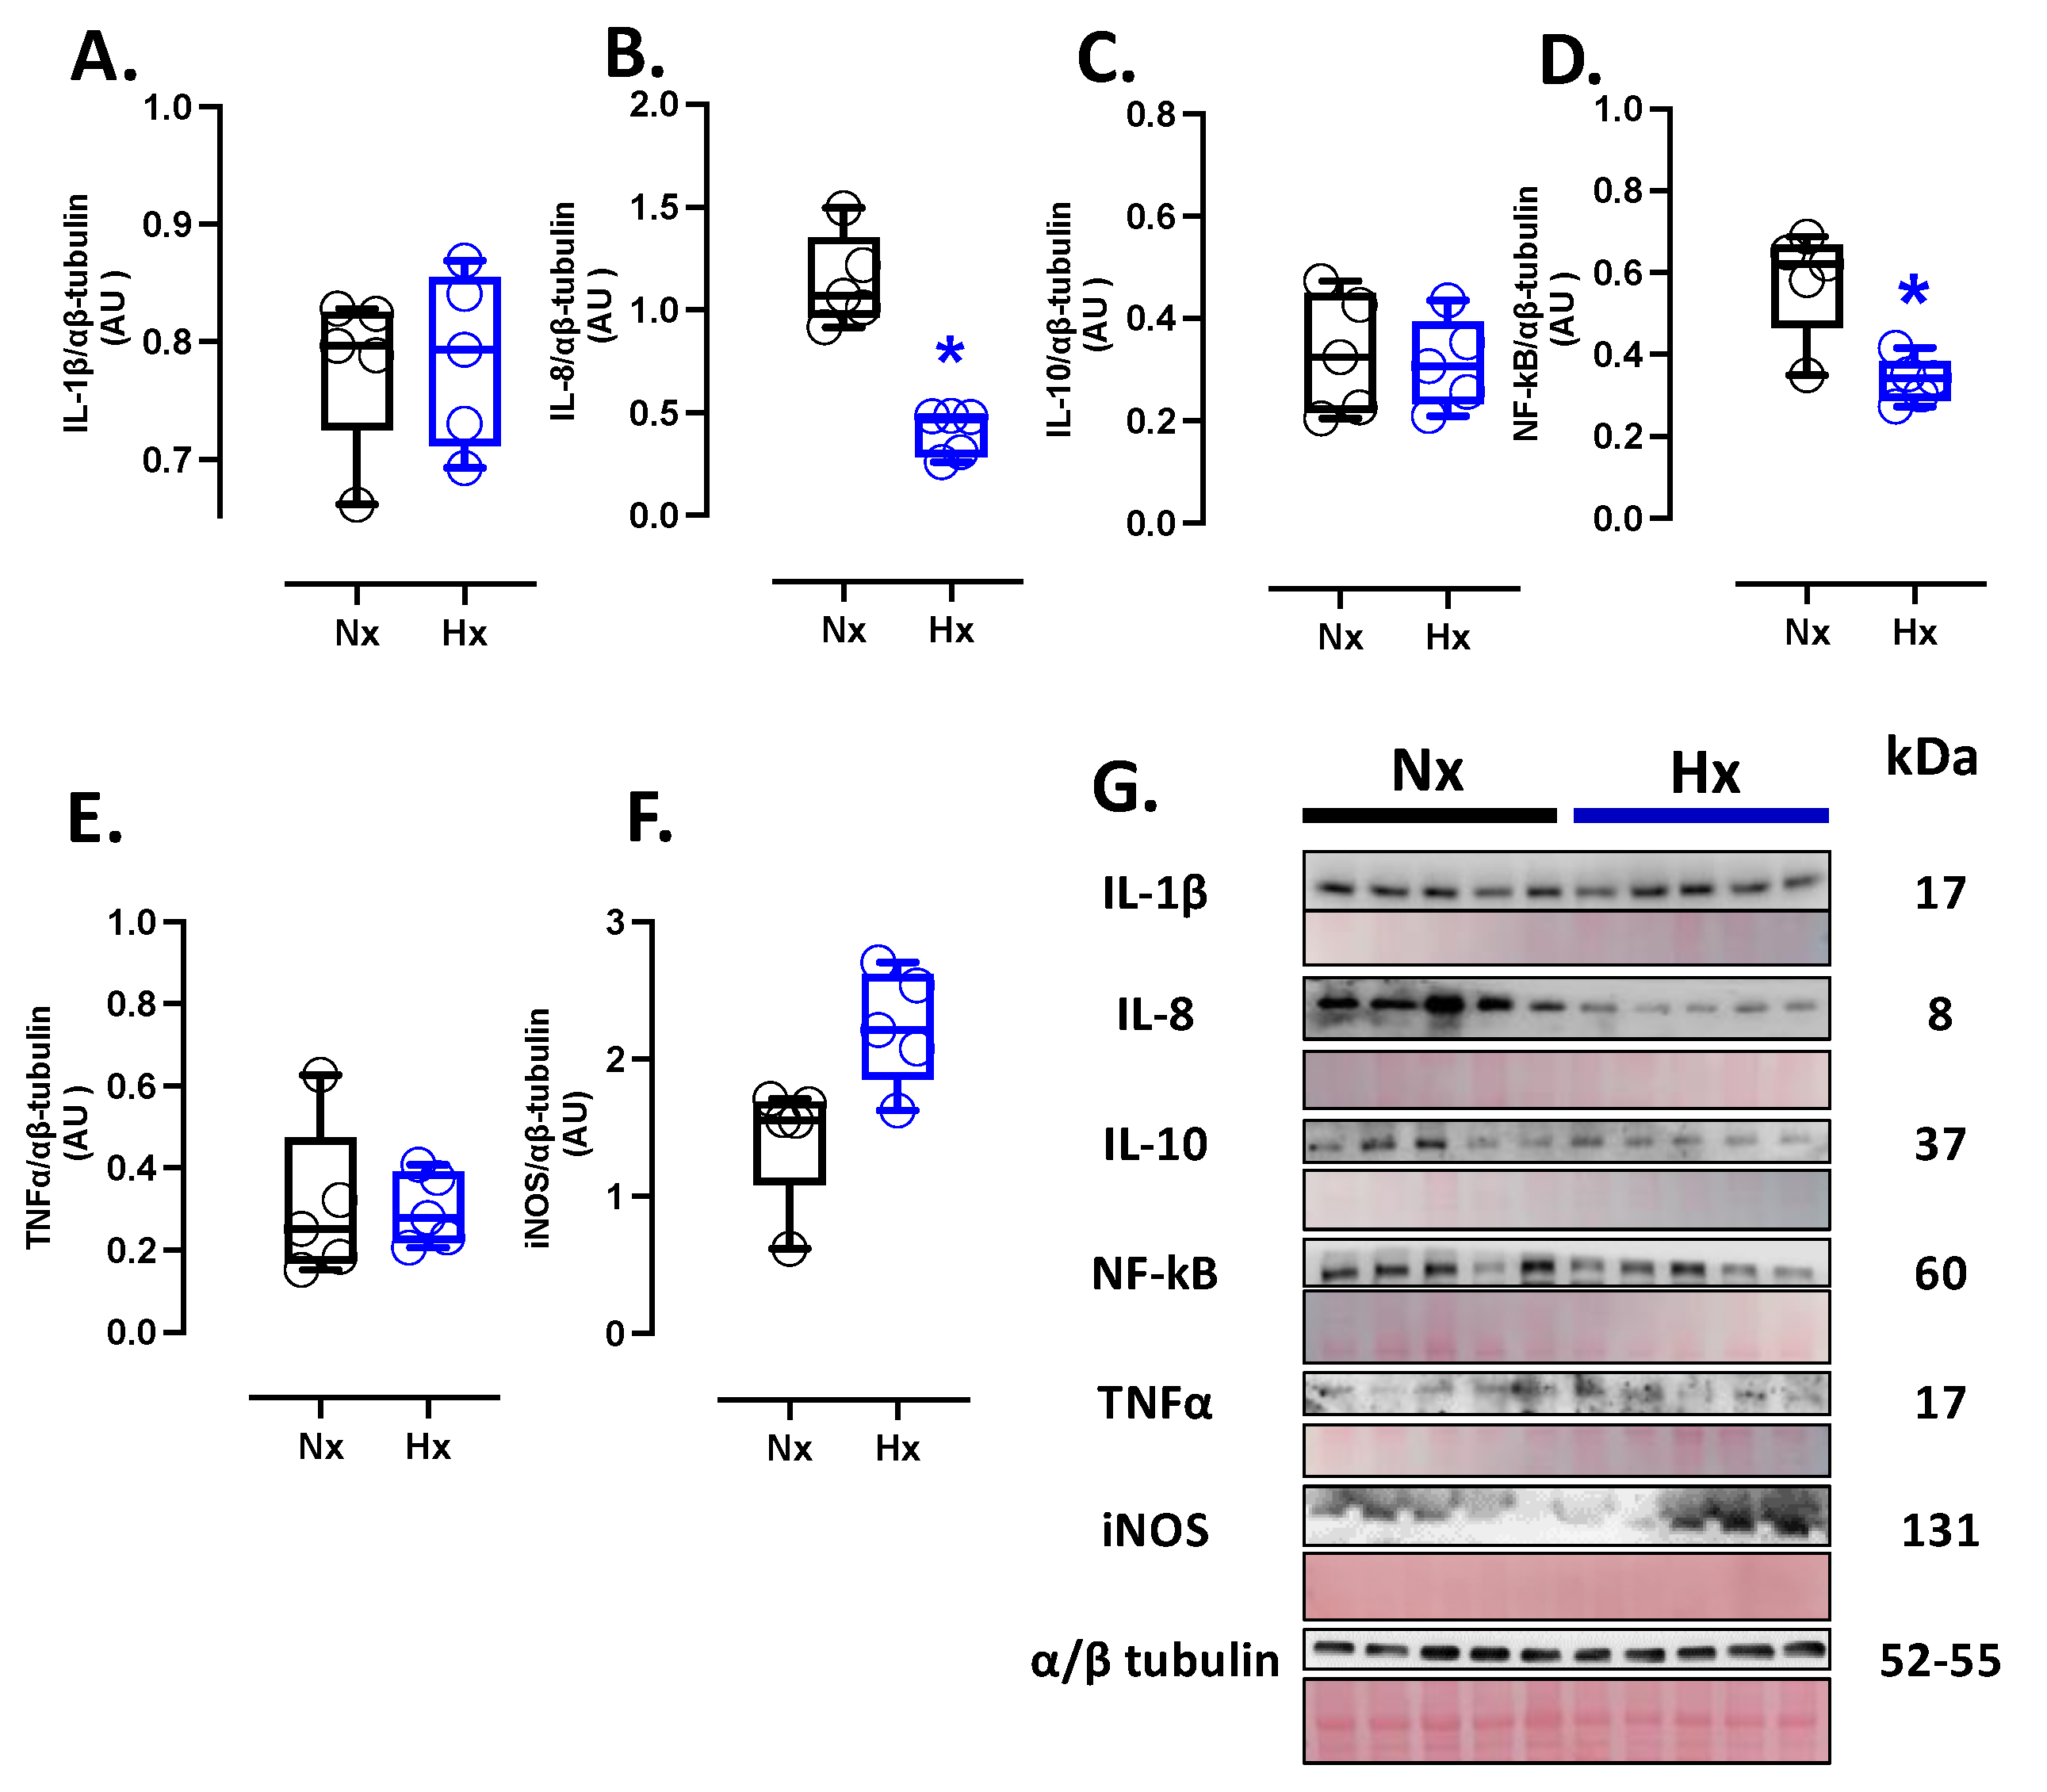
Figure 5.
Apoptotic-related protein expression in brain and neuron density in the neonatal cortex. Protein expression by Westen blot of (A) BLC-XL (antiapoptotic B-cell leukemia/lymphoma extra-large), (B) BAX (Bcl-2-associated X protein), Cleaved Casp-3 (cleaved-caspase 3); and immunohistochemistry of (D) Cleaved Casp-3 with representative micrographs (40x, panel below). Neuro density was measured by (E) touloudin with representative micrographs (40x, panel below). The blots with the molecular weight and ponceau corresponding to each membrane for each protein are shown. Groups are neonates gestated in normoxia (Nx, n=5, black bars, and circles) or hypobaric hypoxia (Hx, n=5, blue bars). Bar in the micrographs =100 μm. Reddish- brown color indicate positive staining and the arrows show cortical neurons by immunohistochemistry. Blue color indicates positive staining and arrows show cortical neurons by toloudin. Data expressed as mean ±S.E.M. and compared using a Mann-Whitney t-test. Significant differences (P ≤0.05): * vs Hx.
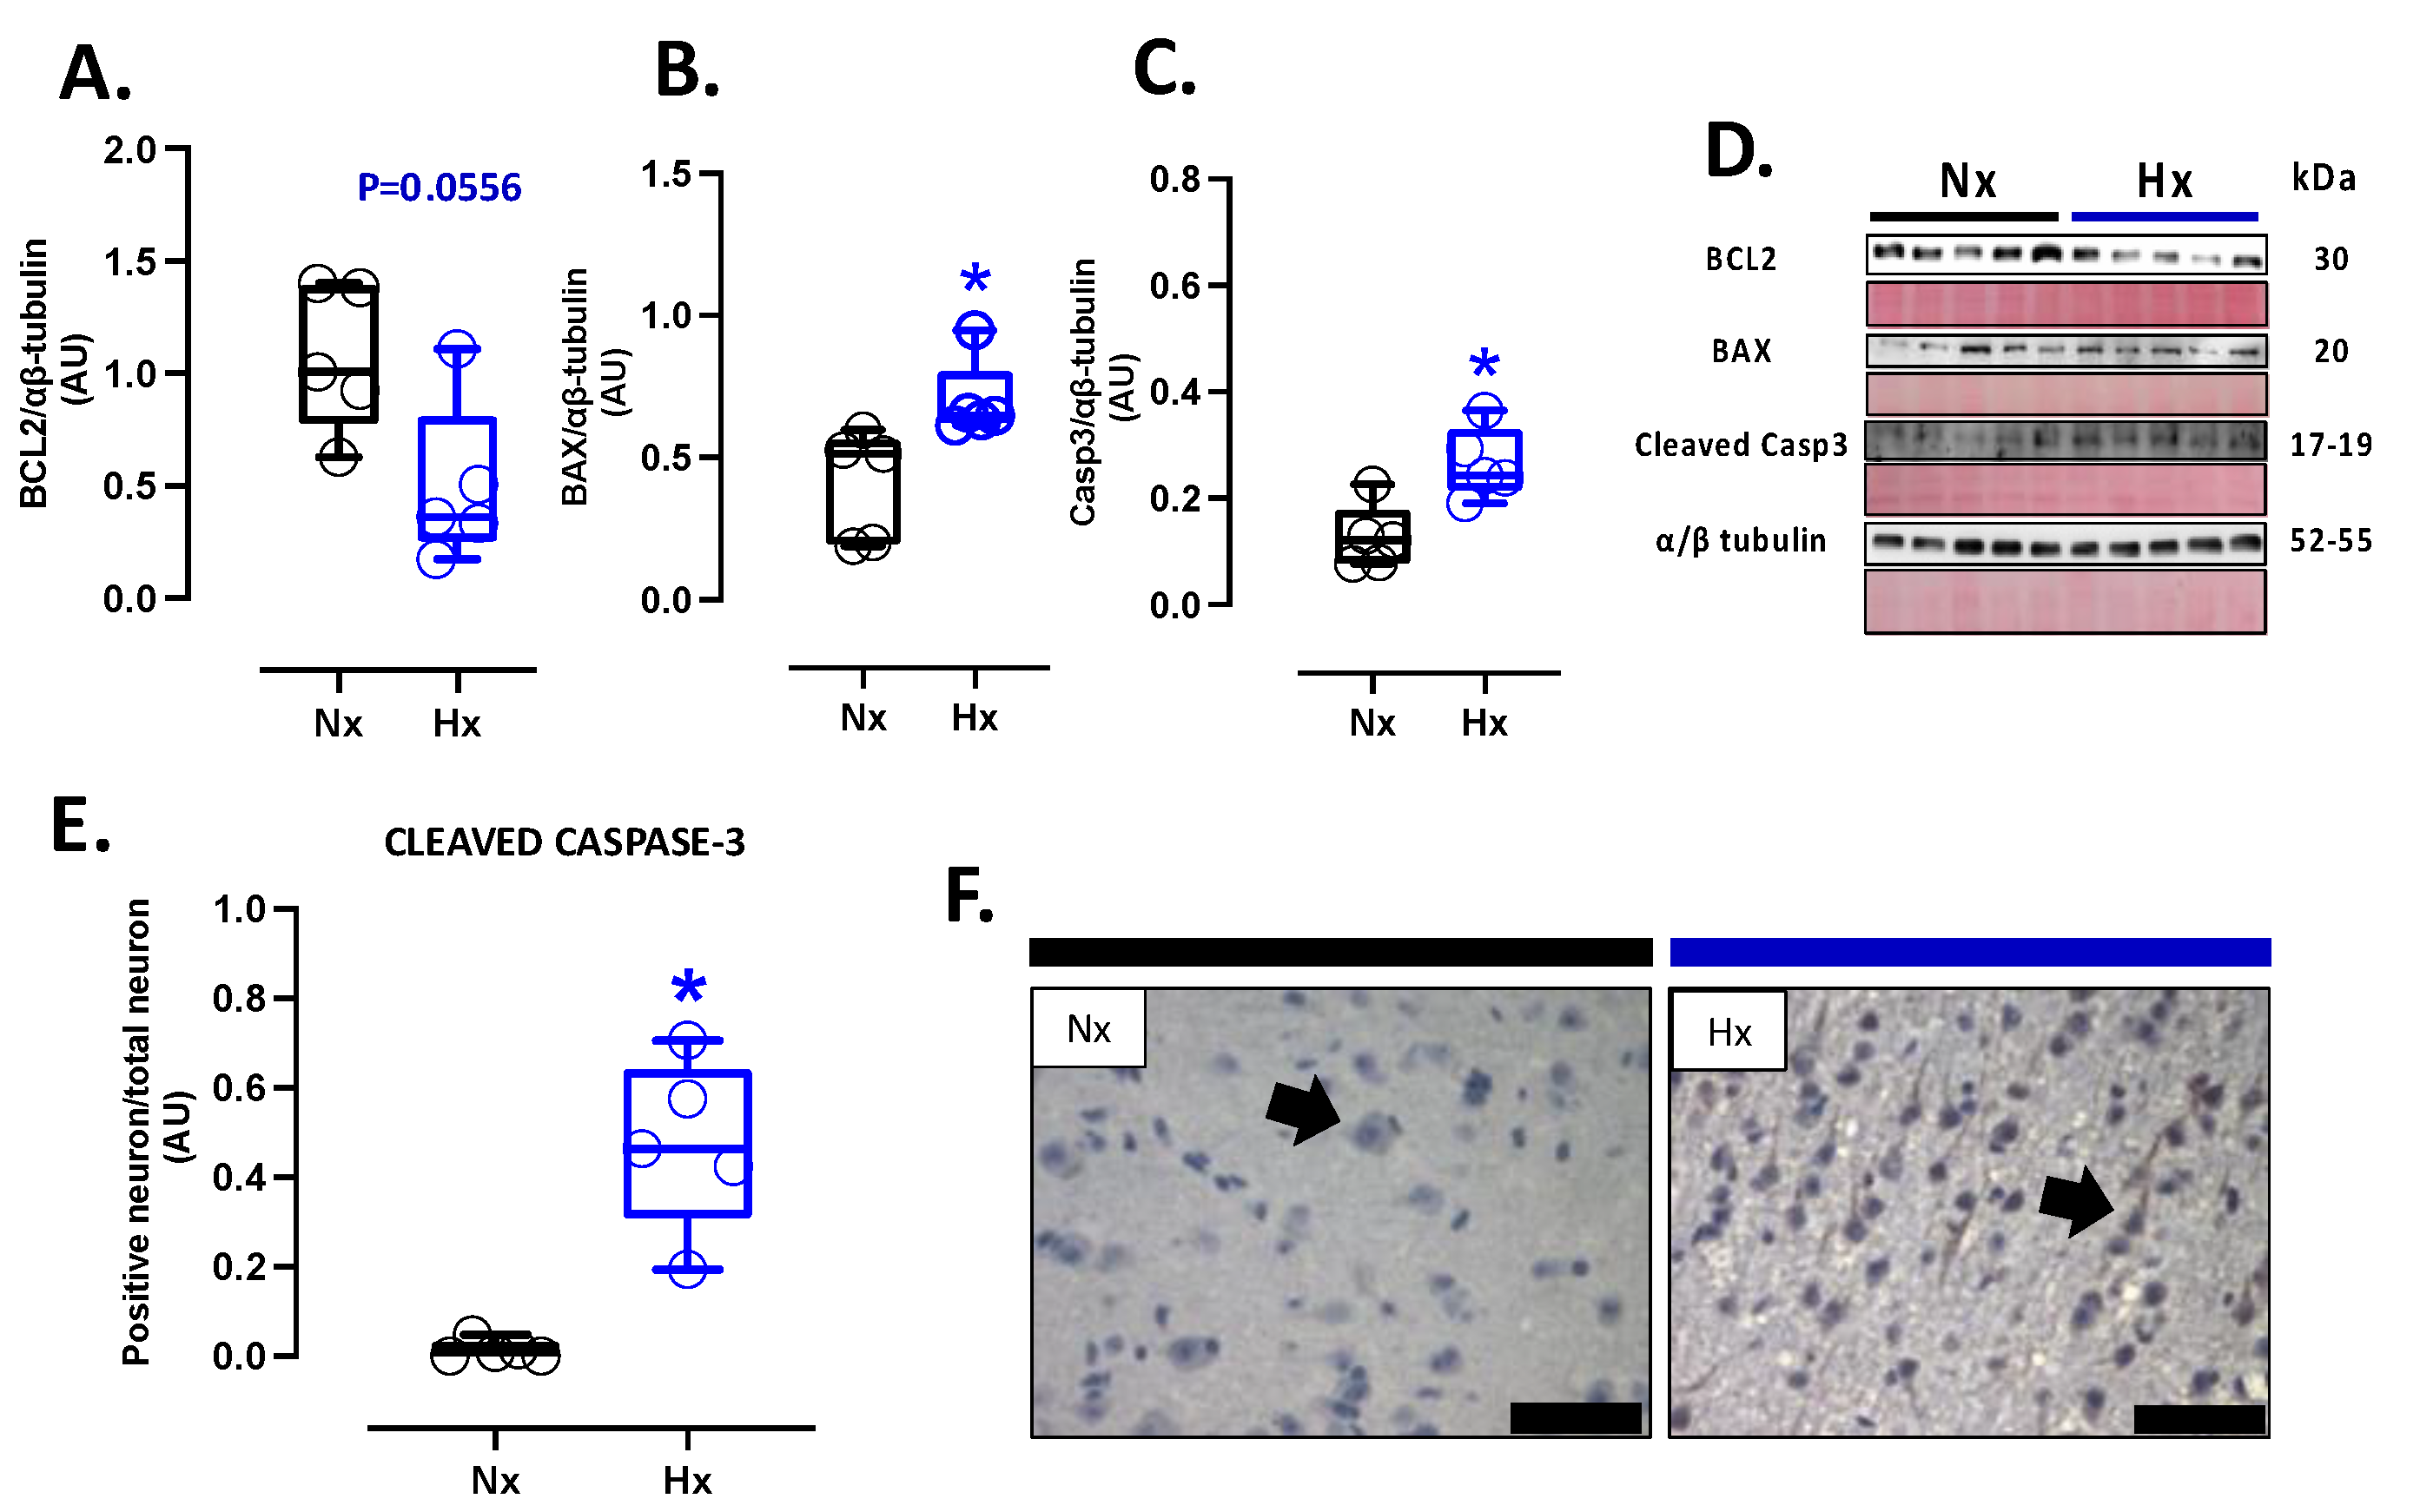
Figure 6.
Apoptosis in the neonatal cortex. TUNEL fluorometric was used to determine neuron apoptosis with representative micrographs (40x, panel below). Groups are neonates gestated in normoxia (Nx, n=5, black bars, and circles) or hypobaric hypoxia (Hx, n=5, blue bars). Bar in the micrographs =100 μm. Data expressed as mean ±S.E.M. and compared using a Mann-Whitney t-test. Significant differences (P ≤0.05): * vs Hx.
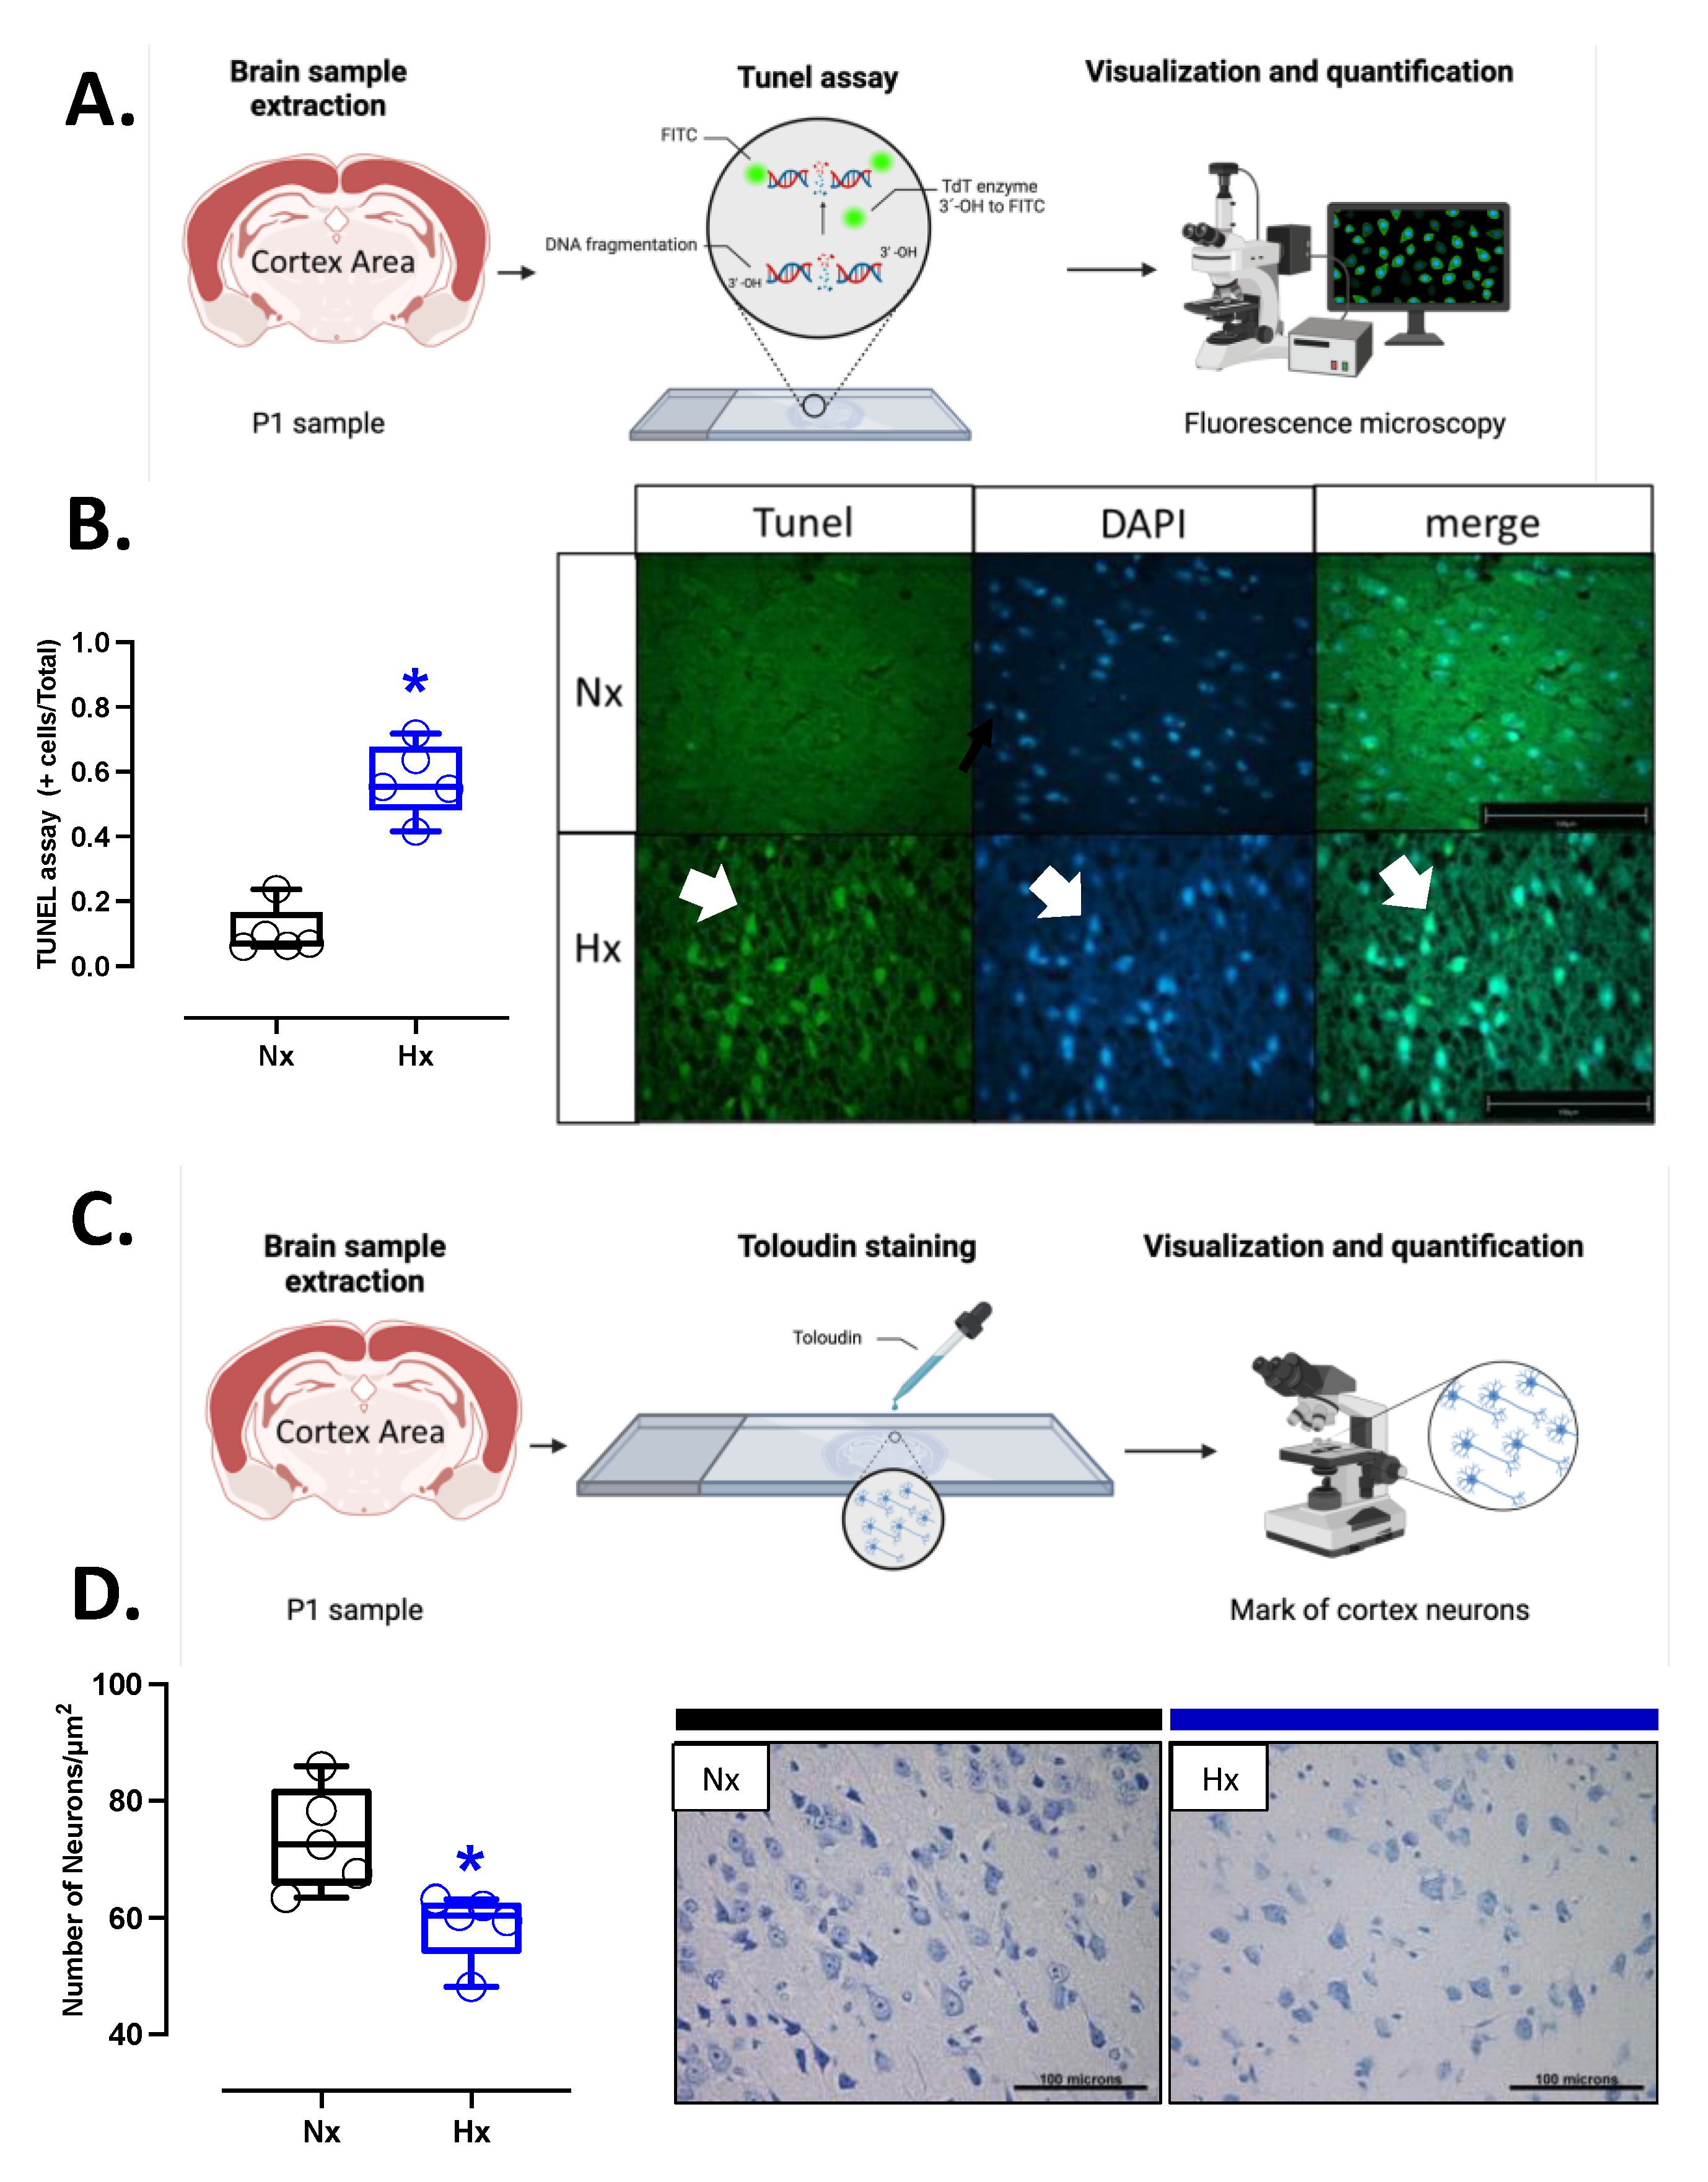

Table 1.
Fetal and neonatal biometry.
Disclaimer/Publisher’s Note: The statements, opinions and data contained in all publications are solely those of the individual author(s) and contributor(s) and not of MDPI and/or the editor(s). MDPI and/or the editor(s) disclaim responsibility for any injury to people or property resulting from any ideas, methods, instructions or products referred to in the content. |
© 2025 by the authors. Licensee MDPI, Basel, Switzerland. This article is an open access article distributed under the terms and conditions of the Creative Commons Attribution (CC BY) license (http://creativecommons.org/licenses/by/4.0/).
Copyright: This open access article is published under a Creative Commons CC BY 4.0 license, which permit the free download, distribution, and reuse, provided that the author and preprint are cited in any reuse.


