Submitted:
21 April 2025
Posted:
22 April 2025
You are already at the latest version
Abstract
This article introduces the Potential Payback Period (PPP) as an integrated valuation framework designed to reconcile the analytical divide between equity and fixed-income instruments. Unlike traditional metrics such as the P/E ratio, PPP accounts for earnings growth, discounting, and time, defining the period required for discounted earnings to equal the stock price. From this foundation, it derives four internally consistent return metrics: SIRR, SPARR, SIRRIPA, and SRP, which together decompose total shareholder return and enable direct comparison between stocks and bonds. A case study on NVIDIA illustrates the model’s flexibility, and practical applications are outlined for portfolio management and asset allocation. The PPP methodology offers a disciplined, risk-adjusted lens for evaluating investments across asset classes.
Keywords:
Potential Payback Period (PPP)
; Equity Valuation
; Stock Internal Rate of Return (SIRR)
; Price Appreciation Return (SPARR)
; Total Return (SIRRIPA)
; Stock Risk Premium (SRP)
; Cross-Asset Comparison
1. Introduction: A New Paradigm in Asset Valuation
In traditional investment analysis, stocks and bonds are treated as fundamentally different asset classes — valued using separate metrics and frameworks. Stocks are commonly assessed using tools like the Price-to-Earnings (P/E) ratio or PEG ratio, while bonds are evaluated through present value models centered on fixed cash flows and yields such as the Yield to Maturity (YTM).
This fragmented approach has long hindered a unified view of portfolio management — until now.
The Potential Payback Period (PPP) introduces a groundbreaking methodology that not only corrects the flaws of the P/E ratio but also lays the foundation for a common valuation framework across both equities and fixed-income securities. It does so by providing time- and risk-adjusted return metrics that bring stocks and bonds under a shared analytical lens, revolutionizing how we build and manage portfolios.
2. What Is the Potential Payback Period (PPP)?
The Potential Payback Period (PPP) is the theoretical number of years required for the sum of a stock’s discounted future earnings to equal its current market price, assuming all earnings are fully distributed to shareholders.
Unlike the static P/E ratio, which simply reflects the price paid per unit of current earnings, the PPP incorporates three key dimensions:
- Earnings growth rate (g) — accounting for expected increases in earnings per share (EPS) over time,
- Discount rate (r) — derived from the Capital Asset Pricing Model (CAPM) to reflect risk and the time value of money,
- Present value discounting — ensuring that future earnings are valued appropriately in today’s terms.
PPP Formula
- If both g and r are set to zero (no growth, no discounting), the formula reduces to PPP = P/E, recovering the traditional P/E.
- When growth and discounting are present, PPP reflects how long it takes for discounted future earnings to match the stock’s price — thus aligning valuation with modern financial principles.
Why PPP Matters
The PPP is the anchor from which all return metrics in this framework are derived. It provides a consistent time horizon for evaluating:
- SIRR – the return from earnings alone,
- SPARR – the return from price appreciation alone,
- SIRRIPA – the total return from both sources,
- SRP – the excess return above the risk-free rate.
By linking valuation to time, growth, and risk, the PPP serves as a bridge between intrinsic value and expected return — making it a foundational metric in this methodology.
Key Insight
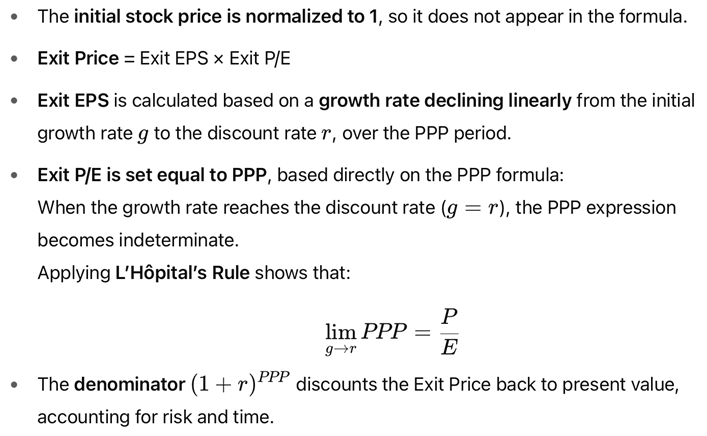
When g = r, the PPP formula becomes indeterminate. Applying L’Hôpital’s Rule to resolve the limit yields:
PPP = P/E
This result is later used to justify the conservative assumption that the Exit P/E equals the PPP in terminal valuation.
3. Return Metrics Based on the Potential Payback Period
The PPP is more than just a valuation tool — it serves as the gateway to a structured set of return metrics that quantify a stock’s earning power, capital appreciation, and total internal return.
This section introduces the four core derivatives of the PPP, each representing a distinct yet internally consistent dimension of return. Together, they break down total shareholder return into its fundamental components and help assess a stock’s attractiveness in both absolute and risk-adjusted terms.
3.1. Stock Internal Rate of Return (SIRR)
- Exit Price = Exit EPS × Exit P/E
- Exit EPS is based on a growth rate declining linearly from g to r
- Exit P/E is set equal to the PPP, justified internally.
SIRR (Stock Internal Rate of Return) measures the annualized return generated from earnings alone over the Potential Payback Period (PPP). It is derived from the Doubling Formula, which calculates the compound rate required for the sum of discounted earnings to equal the stock’s current price, normalized to 1.
In this framework, the investor potentially recovers their entire initial outlay through earnings alone — that is, the value of all earnings would sum to 1 if they were fully distributed. The investment then doubles in value, from 1 to 2, which explains the “2” in the formula:
Solving for SIRR:
This makes SIRR a direct proxy for the intrinsic earning power of a stock — abstracting away from market prices and capital gains.
3.2. Clarification
In practice, most companies do not distribute all their earnings as dividends — and many distribute none at all. Thus, SIRR does not measure realized return, but rather the company’s potential to generate economic value through earnings. This approach is fully validated by market behavior: High-growth companies that retain most or all of their earnings often trade at high P/E multiples, precisely because investors value earnings power, not just cash payouts.
Therefore, SIRR captures what ultimately drives share prices — sustainable, scalable earnings — regardless of whether those earnings are distributed or reinvested.
Note: SIRR excludes capital gains. It isolates the return attributable solely to earnings, making it a pure measure of income-generating strength, not total shareholder return.
3.3. Stock Price Appreciation Rate of Return (SPARR)
SPARR (Stock Price Appreciation Rate of Return) measures the compound annual return from capital appreciation alone — i.e., from the terminal value of the stock at the end of the PPP period. It isolates the portion of return associated with price appreciation and ignores the other portion associated with earnings accumulation over the same PPP horizon. This makes SPARR especially useful for separating the impact of valuation and market expectations from the company’s fundamental earning power.
Interpretation of SPARR
SPARR reflects how much the discounted terminal value of the stock grows, in compound terms, relative to the initial investment (normalized to 1). It addresses the question:
“If I ignore all earnings and focus only on capital gains, what annualized return would the stock price deliver over PPP years?”
This metric is particularly useful for evaluating stocks that are expected to derive most of their value from price appreciation rather than from the distribution of earnings.
Key Insight
In traditional stock valuation, it is notoriously difficult — if not impossible — to predict the resale price of a stock at a future date. However, the PPP methodology offers a way to realistically and prudently estimate the Exit Price at the end of the PPP period in order to calculate SPARR.
This is made possible through two intellectual assumptions, both grounded in market logic and mathematical consistency with the PPP formula:
- A linearly declining earnings growth from the initial rate g to the discount rate r by the end of the PPP period.
This assumption reflects the inevitable process of corporate maturation. No company can sustain high growth indefinitely. Over time, due to market saturation, competitive pressures, or internal limitations, growth slows as the business matures.
A linear decline from g to r mirrors this natural trajectory and justifies using an average growth rate in the PPP calculation—anchoring the model in both economic realism and mathematical soundness.
- 2.
- An exit P/E ratio equal to the PPP.
This assumption captures a mature valuation state at the end of the PPP period, when the company’s growth rate has slowed to match the discount rate.
Conclusion: SPARR isolates the price-driven portion of return and enables a rare, reliable estimation of capital appreciation — something few valuation models can achieve with such clarity and discipline.
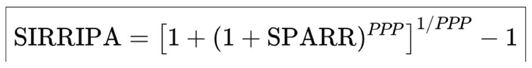
3.4. Stock Internal Rate of Return Including Price Appreciation (SIRRIPA)
Scheme 1. Recalling the Definition of SPARR.
By definition:
Solving for the discounted Exit Price:
Step 2: Applying the Doubling Formula Approximation
From the PPP definition, we know that:
This approximation reflects the fact that PPP is defined as the time it takes for the present value of future earnings to recover the initial investment, which is normalized to 1.
Step 3: Substituting Into the SIRRIPA Formula
Replacing both components in the original SIRRIPA formula:
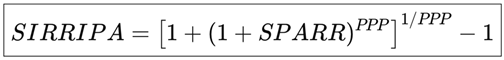
Conclusion: This expression shows that SIRRIPA builds directly upon SPARR, incorporating the contribution of earnings accumulation (approximated as 1) into the capital appreciation component. It provides a unified compound return that reflects both fundamental and valuation-driven sources of shareholder value.
Why SIRRIPA Matters
SIRRIPA is the most complete and decision-relevant return metric in this framework:
- It combines the earning power (captured by SIRR) with valuation-based capital appreciation (captured by SPARR),
- It applies consistent present value logic using the discount rate r,
- It reflects conservative growth dynamics and terminal valuation (Exit P/E = PPP),
- And it adheres to a normalized valuation base (initial price = 1), enabling comparability across stocks and markets.
Because it integrates all relevant sources of return, SIRRIPA is always greater than or equal to both SIRR and SPARR. It serves as the anchor internal rate of return for investment evaluation.
Key Insight
SIRRIPA consolidates income, growth, valuation, and time into a unified return measure — and it directly supports the calculation of the Stock Risk Premium (SRP) introduced in the next section.
3.5. Stock Risk Premium (SRP)
SRP = SIRRIPA – Risk-free rate
The Stock Risk Premium (SRP) measures the excess return a stock is expected to deliver above the risk-free rate (rf). It is calculated as the difference between the stock’s total internal rate of return — captured by SIRRIPA (Stock Internal Rate of Return Including Price Appreciation) — and the return on a risk-free asset, most commonly represented by the yield on a long-dated government bond, such as the 10-year U.S. Treasury note.
SRP quantifies the compensation investors require for bearing equity risk. For a stock to be considered attractive relative to fixed-income alternatives, its SRP should be positive. A noticeably high SRP suggests the stock offers an appealing risk-adjusted premium, potentially justifying its inclusion in a well-balanced portfolio.
At a broader level, SRP can also serve as a macro-financial indicator. Applied across markets or indices, it can help signal potential shifts between bull and bear phases:
- A rising SRP that moves decisively above zero may reflect undervaluation or improving fundamentals.
- A falling or negative SRP can suggest market overheating, reduced risk compensation, or deteriorating earnings outlooks.
This forward-looking role parallels that often attributed to the Earnings Yield (the inverse of the P/E ratio), but SRP offers a more rigorous, dynamic, and risk-adjusted alternative, free from the structural limitations of static valuation multiples.
4. Stocks and Bonds: A Shared Analytical Framework
Traditionally, bonds are valued by solving for the YTM — the internal rate of return that discounts all future cash flows (coupons + principal) to match the bond’s price. With the PPP-derived SIRRIPA, we apply exactly the same principle to stocks.
To make this symmetry crystal clear, consider the following table:
How the PPP Framework Mirrors Bond Valuation
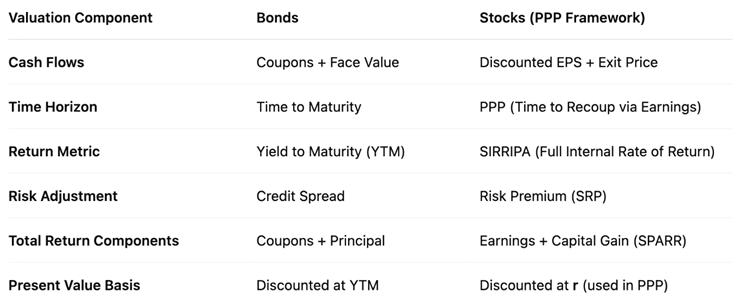 This parallel structure
creates a bridge between asset classes, enabling a consistent approach to portfolio allocation and risk-reward analysis.
This parallel structure
creates a bridge between asset classes, enabling a consistent approach to portfolio allocation and risk-reward analysis.New Paradigm
What this framework confirms is that stocks and bonds must now be assessed against a common benchmark — one that is objective, neutral, and universal: the risk-free interest rate, typically represented by the yield on the 10-year U.S. Treasury bond.
This is no longer theoretical: the reality of modern markets confirms it every day. A rise or fall in the 10-year Treasury yield has an immediate impact on the valuation of both bonds and stocks alike. The PPP methodology reflects this deep connection and embeds it mathematically into equity valuation.
5. Case Study: NVIDIA (As of April 17, 2025)
The discount rate used in this analysis has been determined using the Capital Asset Pricing Model (CAPM), as follows:
- Risk-free rate (rf) = 4.33% (10-year U.S. Treasury yield)
- Expected market risk premium (rm) = 3.00%
- Beta (β) = 1.96
Discount rate : rd = rf + (β x rm) = 4.33 + (1.96 x 3.00) = 4.33 + 5.88 = 10.21%
This CAPM-based rate reflets the return investors require given NVIDIA’s level of systematic market risk.
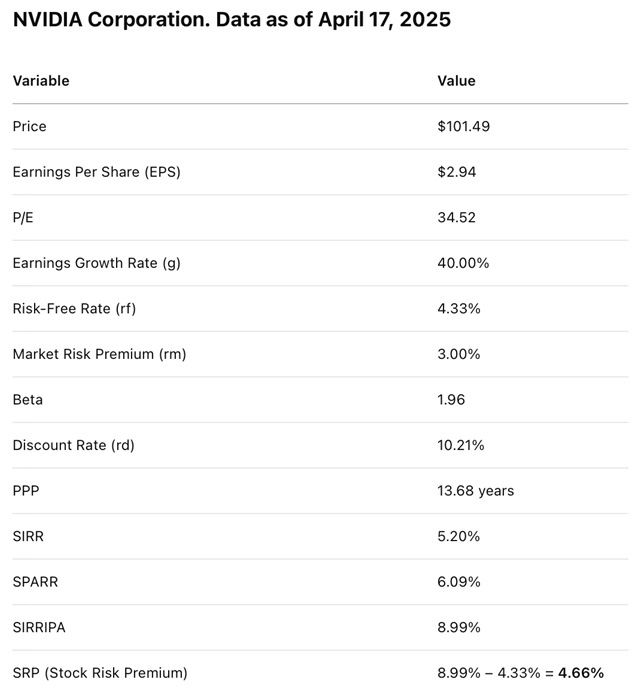
This case study confirms the flexibility and robustness of the PPP model. Even when applying a discount rate derived from the CAPM — significantly higher than the risk-free rate — the framework effectively isolates a stock’s earning power, capital appreciation potential, and risk premium, all benchmarked against the risk-free rate.
An SRP of 4.66% is significant under the current assumptions, especially when compared to the 4.33% risk-free rate. This meaningful excess return suggests that NVIDIA remains attractively priced at $101.49 with a P/E ratio of 34.52, implying that the market may still be undervaluing the stock’s future earnings and long-term return potential relative to the risk it carries.
6. Strategic Applications in Portfolio Management
6.1. Cross-Asset Allocation
Use SIRRIPA to compare equities with bond YTM, allocating capital where the intrinsic return is superior, adjusted for risk.
6.2. Dynamic Rebalancing
As interest rates or risk premiums shift, real-time adjustments can be made using PPP-based metrics rather than trailing data or outdated multiples.
6.3. Global Market Valuation
Compare stocks across countries and currencies by adjusting for local growth and interest rate environments through PPP and SIRRIPA.
6.4. Life-Cycle Investing
Investors nearing retirement can prioritize stocks with shorter PPPs and higher SIRRIPA, mimicking the cash flow profile of bonds while retaining upside potential.
Conclusion: A Unified Framework for a Diversified World
The Potential Payback Period (PPP) transforms equity analysis by aligning it with bond valuation methodologies. Its derived metrics — SIRR, SPARR, SIRRIPA, and SRP — allow investors to assess the earning power, growth potential, and risk-adjusted return of stocks in a way that mirrors how we understand bonds.
More than just a better P/E ratio, the PPP builds a conceptual and mathematical bridge between stocks and bonds, enabling:
- Deeper fundamental insights
- Smarter cross-asset decisions
- More coherent and consistent portfolio strategies.
Most importantly:
Stocks and bonds can now be assessed against the same neutral benchmark: the risk-free rate, typically represented by the 10-year U.S. Treasury yield.
The market itself already validates this view: every movement in that benchmark rate triggers immediate repricing of both bond and stock valuations. The PPP framework simply formalizes and clarifies this logic.
In a world where integration and precision are paramount, the PPP methodology stands out as a revolutionary tool for modern, global, and forward-looking portfolio management.
References
- Bodie, Z., Kane, A., & Marcus, A. J. (2013). Investments (10th ed.). McGraw-Hill. The book is a comprehensive coverage of investment theory, useful for readers to contrast traditional valuation methods with the PPP-derived SIRR.
- Damodaran, A. (2002). Investment Valuation: Tools and Techniques for Determining the Value of Any Asset. Wiley Finance. The book provides insights on valuation techniques for various asset classes, offering context for why traditional methods fall short in capturing long-term earning power.
- Fama, E. F., & French, K. R. (1993). Common Risk Factors in the Returns on Stocks and Bonds. Journal of Financial Economics, 33 (1), 3-56. The article examines the risk factors influencing returns in stocks and bonds, relevant for understanding the importance of risk-adjusted metrics in investment evaluation.
- Graham, B., & Dodd, D. (1934). Security Analysis. McGraw-Hill. The book represents the classic text on value investing that underscores the importance of intrinsic value, a concept integral to the PPP-derived SIRR’s focus on earning power.
- Kobiyh, M., El Amri, A., Oulfarsi, S., & Hilmi, Y. (2023). Behavioral finance and the imperative to rethink market efficiency. Financial Markets, Institutions and Risks, Volume 7, Issue 4. [CrossRef]
- Modigliani, F., & Miller, M. H. (1958). The Cost of Capital, Corporation Finance, and the Theory of Investment. The American Economic Review, 48(3), 261-297. The article represents a foundational work in financial theory, highlighting the impactof capital costs on corporate finance decisions, relevant to the discussion of discount rates in PPP and SIRR.
- Sam, R. (1984). “Le PER, un instrument mal adapté à la gestion mondiale des portefeuilles. Comment remédier à ses lacunes“. Revue Analyse Financière publiée par la Société Française des Analystes Financiers (SFAF), 2ème trimestre 1984. The article critiques the P/E ratio’s effectiveness in global portfolio management and advocates for the adoption of the “Délai de Recouvrement (DR)” or “Payback.
- Period (PP)” as a more robust and adaptable evaluation tool. This article is part of a set of three articles written by Rainsy Sam in the 1980s that laid the foundation for the Potential Payback Period (PPP).
- Sam, R. (1985). Le Délai de Recouvrement (DR). Revue Analyse Financière, 3ème trimestre 1985. The article, which refines the concept of the DR (or PP), is part of a set of three articles written by Rainsy Sam in the 1980s that laid the foundation for the Potential Payback Period (PPP).
- Sam, R. (1988). Le DR confronté à la réalité des marchés financiers. Revue Analyse Financière, 4ème trimestre 1988. The article, which demonstrates the first applications of the DR (or PP) to portfolio management, is part of a set of three articles written by Rainsy Sam in the 1980s that laid the foundation for the Potential Payback Period(PPP).
- Sam, R. (2024). Stock Evaluation: Discovering the Potential Payback Period (PPP) as a Dynamic P/E Ratio. The website is a specialized platform dedicated to financial analysis, focusing on the Potential Payback Period (PPP) and its innovative application in deriving the Stock Internal Rate of Return (SIRR). It serves as both an educational and practical resource for investors, academics, and finance professionals interested in modern stock and bond valuation methodologies.
- Sam, R. (2025). “Le Potential Payback Period (PPP) : Une Généralisation Utile du Price Earnings Ratio (PER) Pour l’Evaluation des Actions”. Revue Française d’Economie et de Gestion, “Volume 1 : Numéro 2” pp 621-632. Février 2025.
- Sam, R. (2025). “Le Potential Payback Period (PPP) : La Septième Révolution Financière”. Revue Française d’Économie et de Gestion, “Volume 6 : Numéro 2” pp : 594- 620. Mars 2025.
- Sam, R. (2025). “Anatomy of a Looming Bear Market: How to Assess the Impact of Donald Trump’s Chaotic Measures on Wall Street“. Revue Française d’Économie et de Gestion, “Volume 6 : Numéro 3” pp : 550- 560. Mars 2025.
- Sam, R. (2025). “Comparing Global Stock Markets Using Risk-Premiums Derived from the Potential Payback Period (PPP)“. Revue Française d’Économie et de Gestion, “Volume 6 : Numéro 3” pp : 541- 549. Mars 2025.
- Sam, R. (2025). “Analyse Financière: Le Potential Payback Period (PPP), une alternative au Price Earnings Ratio pour évaluer les entreprises temporairement déficitaires – Etude de cas : Intel Corp.“. Revue Française d’Économie et de Gestion, “Volume 6 : Numéro 3” pp : 561- 576. Mars 2025.
- Sharpe, W. F. (1964). Capital Asset Prices: A Theory of Market Equilibrium under Conditions of Risk. The Journal of Finance, 19(3), 425-442. The article introduces the Capital Asset Pricing Model (CAPM), which informs the risk adjustments in the PPP-derived SIRR. [CrossRef]
Disclaimer/Publisher’s Note: The statements, opinions and data contained in all publications are solely those of the individual author(s) and contributor(s) and not of MDPI and/or the editor(s). MDPI and/or the editor(s) disclaim responsibility for any injury to people or property resulting from any ideas, methods, instructions or products referred to in the content. |
© 2025 by the authors. Licensee MDPI, Basel, Switzerland. This article is an open access article distributed under the terms and conditions of the Creative Commons Attribution (CC BY) license (http://creativecommons.org/licenses/by/4.0/).
Copyright: This open access article is published under a Creative Commons CC BY 4.0 license, which permit the free download, distribution, and reuse, provided that the author and preprint are cited in any reuse.


