Submitted:
22 April 2025
Posted:
22 April 2025
You are already at the latest version
Abstract
An innovative method was presented in this paper for the solution of the vehicle-bridge coupled vibration problem for highway bridges using the ANSYS software. By comparing the calculation results of this paper with those of literature, the correctness and reliability of this method were verified. Taking a new structural bridge (composite truss bridge with partially concrete-filled rectangular steel tube members) as the engineering foundation, the vehicle-induced responses of the lower chords of the main truss were compared and analyzed in two states: partially con-crete-filled and non-filled. Accordingly, the concept of concrete filling coefficient was further developed, and the vehicle-induced responses of the new structural bridge and its impact coeffi-cients were solved and analyzed for different concrete filling coefficients. The results show that after partially filling the new structural bridge with concrete, the vertical dynamic stiffness of the bridge can be improved, the vehicle-induced response can be reduced, and the fatigue re-sistance can be increased. It is recommended that the concrete filling coefficient of the new structural bridge be within a range of 0.35 to 0.5. Under different concrete filling coefficients, the fitting results of the impact coefficient of the bridge submit to the extreme value distribution type-I, and the suggested value of the impact coefficient is 0.223 at 95% assurance rate. For this new structural bridge, the impact coefficient values in Chinese specification are less than the suggested value of 0.223, which should be taken into account by bridge designers.
Keywords:
Bridge engineering
; Composite truss bridge
; Partially concrete-filled
; Constraint equation
; Vehicle-induced response
; Impact coefficient
1. Introduction
A concrete-filled steel tube composite truss girder and a concrete-filled steel tube composite pier are suitable for heavy-load and long-span structures. It is widely used in engineering construction because of the high bending stiffness of concrete-filled steel tubular members, the clear stress of truss systems, and the high bearing efficiency. (Dauner et al. 1998; Mato et al. 2014; Wu et al. 2014; Liu et al. 2019; Xie et al. 2021).
In light of the engineering design, Liu et al. (2017) optimized the bottom slab and web of concrete box girders and proposed a new type of bridge structure, called a composite truss bridge with partially concrete-filled rectangular steel tubes. The first step of application of the new bridge in highway bridge construction in western China was taken. Liu et al. (2018) carried out the real bridge test of the new bridge in practical engineering. It was found that the new bridge was still in elastic working state under overload conditions with static load coefficients of 1.90 ~ 3.05, and that the static load ratio between the concrete-filled steel tube chord and the hollow steel tube chord was consistent with its axial stiffness ratio. The researchers (Gao et al. 2017; Gao et al. 2018) conducted bending test and analyzed vertical deflection limit of partially concrete-filled rectangular steel tube composite truss, examined the effect of joint deformation on the overall deformation of truss, and then discussed the good service performance of the new bridge from the perspective of durability and maintainability. In succession, the researchers (Jiang et al. 2020; Liu et al. 2020; Jiang et al. 2022) introduced hot spot stress method to optimize the fatigue design of the new bridge joints.
There has been a lot of research on composite truss bridges with partially concrete-filled rectangular steel tube members so far. Most of their studies have focused on analyzing the static and fatigue performance of the whole bridge, the local components, and the joints (Liu and Zhou 2021). However, there are few reports on the dynamic performance of the new bridge, including vehicle-induced vibration response. Therefore, it is necessary to study the dynamic response of the new bridge.
The research methods for vehicle-bridge coupled vibration can be mainly divided into four categories: field measurement method, classical theoretical analysis method, model testing method and numerical analysis method (Chatterjee et al. 1994; Yang and Wu 2001; Wyss et al. 2011; Huang et al. 2014; Ettefagh et al. 2015; Jin et al. 2016; Hou et al. 2018; Li et al. 2019; Hou et al. 2020; Tian and Zhang 2020; Shen et al. 2021). The field measurement method is the main research method used to study vehicle-bridge coupled vibrations in the early stages of research. It is time-consuming, and the results reflect a comprehensive view of all factors, which cannot be formulated as a rigorous theoretical framework. There are limitations to the classical theoretical analysis method due to the calculation conditions. Based on the simplified vehicle model and bridge model, approximate calculations are performed, and it is difficult to guarantee the accuracy of the analysis. Model testing is a complex, expensive method that does not take into account the randomness of actual traffic loads. With the advent and development of the computer and finite element method in the 1960s and 1970s, vehicle-bridge coupled vibration research had made significant progress. The numerical analysis method has been widely applied to the study of vehicle-bridge coupled vibration response of bridge structures. The majority of existing numerical methods require the derivation of the vibration equation of the vehicle-bridge system as well as the compilation of a complex solution program. The configuration of a coupled vibration analysis of vehicle-bridge is a complex process that is difficult for engineers to master and apply.
In this paper, an innovative method for solving vehicle-bridge coupled vibration problem was proposed based on ANSYS software. In this method, the vehicle finite element model and the bridge finite element model were built in ANSYS classical environment by APDL language. Through ANSYS constraint equations, the displacement coordination relationship between the wheel and the bridge deck contact point could be realized at any time. The vehicle-bridge coupled vibration problem was solved by ANSYS transient dynamic solution function. It was determined that the method presented in this paper was correct and reliable by quantitatively comparing the calculated results with the original ones in literature (Shen and Xiao 2003). A composite truss bridge with partially concrete-filled rectangular steel tube members was taken as the research object, and the concrete filling coefficient was proposed. The vehicle-induced response and impact coefficient of the bridge were analyzed in relation to nine concrete filling coefficients taking into account grade A bridge deck roughness (GB/T7031-2005 2005). In this field, researchers as well as engineering designers might find it useful to refer to the relevant conclusions or experiences.
2. Method for Solving Vehicle-Bridge Coupled Vibration
2.1. Vehicle Model
Vehicles are complex vibration systems, which should be simplified appropriately according to the problems analyzed. It has been demonstrated in research on vehicle dynamics that the longitudinal vibration of the vehicle body, suspension and wheel components along the vehicle operation direction has little effect on the vertical and transverse vibration of the bridge, and the coupling effect between the vertical and lateral vibration of the vehicle is weak (Yu and Lin 2005; Yang et al. 2012). Generally, the vertical vibration of a vehicle and the transverse vibration of a vehicle are calculated in their respective planes in order to make calculation easier. Consequently, when studying the vertical vibration of the vehicle-bridge coupled system, the vehicle model only needs to consider the three degrees of freedom of the vehicle body’s heave (vertical displacement), pitch, and roll, as well as the vertical displacement of each wheel. A simplified model of a two-axle vehicle, which consists of the upper structure (vehicle body) and the lower structure (wheels and suspensions), is presented as follows: 1) The vehicle body is considered a rigid body, which includes three degrees of freedom in terms of its heave, pitch, and roll, without taking into account the transverse movement of the vehicle body. 2) The wheels are also considered rigid bodies, which only include one degree of freedom, namely vertical displacement. The characteristics of stiffness and damping of a wheel tire fitted with a spring damper. 3) The suspensions are considered spring-dampers, which provide vertical support for the vehicle body as well as vibration reduction. 4) There are rigid beams that connect the upper structure and lower structure of the vehicle, allowing displacement and force to be transferred from one to the other.
Figure 1 is a simplified three-dimensional model of a two-axle vehicle, where is mass of vehicle body; and are rotational inertia of vehicle body around the x-axis and z-axis; is the mass of each wheel; represent the stiffness of each wheel tire and suspension; represent the damping of each wheel tire and suspension; is vertical displacement of vehicle body; and are angular displacement of vehicle body around the x-axis and z-axis; is the vertical displacement of each wheel.
ANSYS software integrates multiple physical fields such as structure, fluid, and electromagnetic fields. There are a wide variety of element types available in the ANSYS software, so it is convenient to accurately model a simplified vehicle model with the software. The rigid body of the vehicle body as well as the rigid body of the wheel can be simulated using the MASS21 element, the spring dampers of the suspension and wheel tire can be simulated using the COMBIN14 element, and the rigid beam can be simulated using the MPC184 element. Table 1 illustrates the types of elements and their setting options corresponding to all components of the simplified vehicle model in ANSYS software (Wang et al. 2011).
Following this, a finite element model of the simplified vehicle can be built by compiling the APDL command flow using ANSYS software. Figure 2 shows an ANSYS finite element model of a spacial two-axle simplified vehicle, where M0 represents the MASS21 element and K0 represents the COMBIN14 element.
Based on the above method, the simplified multi-rigid-body finite element model of common automobile models (multi-axle or trailer) can be established by ANSYS software. Considering the traffic flow through a bridge, the traffic flow model can be formed by establishing multiple independent vehicles in each lane.
2.2. Bridge Model
In the vehicle-bridge coupled vibration analysis, the bridge structure types are extensive, including girder bridges, arch bridges, rigid frame bridges, suspension bridges, cable-stayed bridges, and various composite systems bridges. With powerful functions and an extensive element library and material library, ANSYS can be used for full-bridge simulation analysis of bridges with any structural system (Wang et al. 2011). Using solid elements in the bridge finite element model for vehicle-bridge coupled vibration analysis results in a large number of elements, and costs a lot of resources for the solution. By contrast,Using beam and plate elements can reduce the number of elements and the amount of resources for the solution. In this paper, the bridge model is simulated by ANSYS BEAM188 beam element or SHELL181 plate element.
2.3. Bridge Deck Roughness Model
Bridge deck roughness refers to the deviation of the actual bridge deck from its absolute ideal datum plane (a smooth horizontal plane) due to unevenness of the bridge deck surface, which is one of the main factors affecting vehicle-bridge coupled vibration. As a steady gauss stochastic process with zero mean and ergodicity, bridge deck roughness can be described statistically by Power spectral density(PSD). The general form of the power spectrum density of road roughness specified by ISO 8608:2016 and Chinese national standard GB/T7031-2005 is fitted by Eq. (1)
where is the reference spatial frequency, m-1; is the exponent of the fitted PSD.
The inverse Fourier transform technique is a common simulation method for bridge deck roughness samples because it is a simple method with a clear concept and a simple operation, and its calculation results are highly consistent with the expected power spectrum. The Eqs. (2) to (4) represent the discrete Fourier inverse transformation method for solving bridge deck roughness samples (GUI et al. 2007).
where is the discrete spatial frequency; is the sampling interval; is the number of sampling points; is the power spectral density of bridge deck roughness at discrete spatial frequency; is a Fourier spectrum of time-domain samples of bridge deck roughness that represents a complex number; is a module of complex number; is a random phase that is subject to uniform distribution on [0, 2π]; is time domain samples of bridge deck roughness; is an imaginary unit.
In order to simulate the time domain samples of bridge deck roughness numerically, the M file is compiled by MATLAB software using the Fourier inverse transformation method. The Figure 3 shows bridge deck roughness samples of class A and D in accordance with the Chinese standard GB/T7031-2005.
2.4. Displacement Compatibility Relation of Vehicle-Bridge Coupled System and Its Implementation
Figure 4 shows the schematic diagram of vehicle-bridge coupled vibration model in which beam and plate(shell) elements are used to simulate the bridge, while the vehicle is modeled as a spatial two-axle vehicle as discussed previously. In the vehicle model, represents the number of nodes at contact position between wheel tire and bridge deck, and is vertical displacement of node numbered . Oxyz represents the global coordinate system. A bridge model is built based upon the Oxyz global coordinate system with x as the longitudinal direction, y as the vertical direction, and z as the transverse direction for bridge.
When the vehicle passes through bridge, the trajectory of the vehicle is usually approximately parallel to the central axis of the bridge, and its driving state is usually in the state of uniform or uniform variable speed motion. Assuming that the coordinates of node numbered of the vehicle model are , and at the initial moment, the vehicle’s initial speed is and its acceleration is. The coordinates of node numbered of the vehicle model at any moment are calculated by Eq. (5).
At any time, the position of each node at contact position between wheel tire and bridge deck in the vehicle model can be determined according to Eq. (5). In the case that these nodes are located exactly at the node positions of the bridge finite element model, the vertical displacement of the bridge deck can be determined directly by the node of bridge element at the corresponding position. Alternatively, if these nodes are located outside the node positions of the bridge finite element model, the vertical displacement of the bridge deck at a given position can be calculated by the interpolation of bridge element shape function. Figure 5 is the diagram of displacements at beam element nodes, represents the element local coordinate system. The vertical displacement at any position in the beam element can be obtained by Eq. (6). A vertical displacement at any position in a plate element can also be expressed as a function of the degree of freedom at the relevant nodes of the plate element according to the element shape function.
Where is length of beam element; are the vertical displacements of the nodes at both ends of the beam element; are the rotation angle of the nodes at both ends of the beam element around the element axis.
It is assumed that, when a vehicle is driving on a bridge, the wheel tires are in close contact with the bridge deck without separation. Figure 6 illustrates a diagram of displacement compatibility relationship for contact point between the wheel tire and the bridge deck.
In Figure 6, The node represents the point of contact between the wheel tire and the bridge deck in the vehicle model. represents the vertical displacement of the node; represents the vertical displacement of the bridge deck at the corresponding wheel tire node position, which can be calculated by the displacement of the relevant bridge element node according to the element shape function Eq. 6; and represents the bridge deck roughness value at the corresponding wheel tire node position. On the basis of the above assumptions, the geometric displacement compatibility relation between the vehicle and bridge, as shown in Eq. (7), can be derived.
As can be seen from the literature (Wang 2007), the ANSYS constraint equation is a linear equation (Eq. (8)) that relates degrees of freedom of nodes,which can replace the coupling of degrees of freedom of nodes and is more general.
where represents degrees of freedom of nodes, including translational degrees of freedom and rotational degrees of freedom. is a coefficient of degree of freedom; is the number of terms in the equation.
By using the constraint equation function of ANSYS software, the displacement compatibility relationship between the vehicle and bridge can be established at any load substep (any time) to realize the close contact between wheel tire and bridge deck. As shown in Eq. (7), the constraint equation form in ANSYS is as follows:
where represents vertical translation degree of freedom of node; represents the numbers of nodes of bridge finite element model, and represents degree of freedom of node and its corresponding coefficient, which can be determined by the element shape function interpolation for calculating vertical displacement of bridge deck at node position.
2.5. Solution Steps of Vehicle-Bridge Coupled Vibration Problem in ANSYS
Based on the transient dynamic analysis function of the large general finite element analysis software ANSYS platform, the vehicle-bridge coupled vibration analysis system for highway bridges is compiled by APDL language. Figure 7 depicts this algorithm flow, which consists of the following steps:
Step1: In ANSYS software, bridge finite element model and vehicle finite element model are established.
Step2: Based on the inverse Fourier transform method, the time-domain sample data of bridge deck roughness are obtained using MATLAB M-files, which are then read into ANSYS tables. As a result, the surface roughness time-domain sample value at the position of vehicle-bridge interaction at any time is determined using the index rule of „0 row, 0 column” of the ANSYS tables array and its automatic interpolation function.
Step3: The modal solution of the finite element model of the bridge is conducted, and the fundamental frequency and natural vibration period of the bridge structure can be determined. The appropriate time integral step length for transient dynamic calculation can be selected, and the general time integral step length can be taken as .
Step4: By using the ANSYS constraint equation, the vertical displacement constraint conditions of the contact point between the wheel tire and the bridge deck at any given time can be determined according to Eq. (7) (the geometric displacement compatibility relation between the vehicle and bridge). The dynamic time-history analysis of the vehicle crossing the bridge is realized based on transient dynamic analysis function of ANSYS software.
2.6. Verification of the Method
In order to verify the correctness and reliability of the proposed method and the self-compiled program, numerical example from the literature (Shen and Xiao 2003) was simulated using the proposed method. Due to limited space, only a few comparative data and results are presented. As shown in Figure 8, the vertical displacements at midspan of the simply-supported girder bridge in this paper were compared to those calculated by Ruge-Kutta method in the literature (Shen and Xiao 2003). It was evident that the calculation results of this paper were in excellent agreement with those of the literature (Shen and Xiao 2003),and the maximum relative error of both methods under different driving speeds was less than 5%.
3. Vehicle-Induced Vibration Response of Composite Truss Bridge with Partially Concrete-filled Rectangular Steel Tube Members
3.1. Engineering Overview
A composite truss bridge with partially concrete-filled rectangular steel tube members (Huang Yan Bridge) had been constructed in China, and the overall length of the bridge is 96.96 m. The main bridge was composed of two parallel rectangular steel tubular truss girders with a triangular web member truss system. The length of the main truss was 88 m (the span arrangement is: 24 m + 40 m + 24 m), with a total of 22 internodes (the internode length is 4 m). Bridge deck width was 5.5 m, and the truss height was 2.5 m. The height- span ratio of truss was 1/16. C50 micro expansive concrete is symmetrically grouted in the range of 2.5 m length of the lower chord segment near the edge fulcrum and 13 m length of the lower chord segment near the middle fulcrum. Bridge pier was a double-limb Y-shaped concrete-filled steel tubular pier stiffened with PBL. There is a rigid connection between the pier and the main truss, and the pier cap is octagonal The bridge abutment was a lightweight bridge abutment with direct connection between piles and bent cap. The bent cap measured 5.5m in transverse by 1.8m in longitudinal by 1.5m in height, and the foundation was a bored pile foundation. All the steel plates of the whole bridge were made of Q345D steel. The cast-in-site concrete bridge deck was connected with the main truss through PBL perforated steel plate connectors of the upper chord, which was designed according to the crack control. The front view of the bridge was shown in Figure 9, Figure 10 was the structural diagram at the interface between the concrete-filled segment and the empty steel tube segment, and the cross section of the main members of the bridge were showed in Figure 11.
3.2. Finite Element Model
The finite element model of composite truss bridge with partially concrete-filled rectangular steel tube members was established by ANSYS software through bottom-up method. All members of the main truss and piers were simulated by 3D linear finite strain beam element BEAM188, and the bridge deck was simulated by 3D finite strain shell element Shell181. Fixed constraints were imposed on the bottom of the pier. The full bridge ANSYS finite element model was shown in Figure 12.
3.3. Analysis of Vehicle-Induced Vibration Response
Due to the high level of maintenance and management of highway bridge deck in China, it was difficult for highway bridge deck to appear class C and class D in Chinese national standard GB/T7031-2005. Moreover, existing studies had shown that the influence of vehicle speed on vehicle-bridge coupled vibration was complex and had no obvious regularity. Accordingly, when analyzing the vehicle-induced vibration response in this paper, the roughness level of the bridge deck was set at class A and the vehicle speed was set at 60 km/h. In addition, because of the plate-truss combination effect for composite truss bridge, the force of the upper chords of main truss were complex, which were affected by many factors. Therefore, in this paper, the vehicle-induced response analysis and impact coefficient calculation of the composite truss bridge were only carried out with lower chords of the composite truss bridge as an example.
When the vehicle passed through the bridge, the time history of vertical displacement and time history of axial force (negative value of axial force represents compression) of every lower chord of the main truss for the composite truss bridge under two working conditions of partially concrete-filled and non-filled were shown in Figure 13 and Figure 14, respectively. It could be seen from Figure 13 and Figure 14 that the shape of time-history curves of the response of lower chords for the bridge were not changed after the bridge was partially filled with concrete. A partially concrete-filled structure had little effect on the position of the maximum value of response of the bridge, which occurred at the midspan of middle-span.
The maximum dynamic response of lower chords of the composite truss bridge with rectangular steel tube members under two working conditions was shown in Table 3. According to Table 3, the maximum vertical displacement of the bridge under partially concrete-filled conditions decreased by 2.48 mm, with a decreasing amplitude of about 7.80%. At the same time, the maximum axial force of lower chords decreased by 118.65 kN, and the decreasing amplitude was about 8.26%.
Under two working conditions of partially concrete-filled and non-filled, dynamic response increments of midspan lower chords at middle-span and side-span for composite truss bridge with rectangular steel tube members were shown in Table 4. Among them, the dynamic response increment referred to the maximum response value of the bridge considering the dynamic effect relative to the maximum response value without considering the dynamic effect when the vehicle crossed the bridge. According to Table 4, after partially concrete-filled, the dynamic response increments of midspan lower chords at middle-span and side-span for composite truss bridge showed a downward trend, and the dynamic response increment of midspan lower chords at middle-span decreased greatly, The dynamic displacement increment of midspan lower chords at middle-span decreased by 11.54% and the dynamic axial force increment decreased by 10.41%. It had been demonstrated that pouring concrete into the hollow steel tubes of lower chords of the composite truss bridge could effectively improve the vertical dynamic stiffness of the bridge, and reduce dynamic response, as well as improve fatigue resistance of composite truss bridge under vehicle load.
4. Influence of Concrete-Filled Segment Length on Dynamic Response of Composite Truss Bridge
4.1. Concrete Filling Coefficient
In order to further explore the influence of concrete-filled segment length on the dynamic response of composite truss bridge with partially concrete-filled rectangular steel tube members, the concrete filling coefficient was defined as follows:
where was the concrete-filled segment length of the lower chord near the edge fulcrum, was the concrete-filled segment length of the lower chord near the middle fulcrum, andwas the overall length of main truss,as indicated in Figure 9. The concrete filling coefficient had a range of values between 0 and 1.
According to the internode arrangement of lower chords of the main truss, the concrete filling coefficients = 0, 0.125, 0.216, 0.352, 0.489, 0.625, 0.761, 0.852 and 1 were taken only by changing . Under nine different concrete filling coefficients, the vehicle-induced vibration analysis of the composite truss bridge was carried out. The concrete-filled segment length under nine different concrete filling coefficients was shown in Table 5.
4.2. Dynamic Response Analysis of the Composite Truss Bridge under Nine Concrete Filling Coefficients
Based on a bridge deck roughness class A and a driving speed of 60 km/h, the dynamic responses of composite truss bridge were calculated under nine concrete filling coefficients. The vertical displacements and axial forces of midspan lower chords at both middle-span and side-span were selected for analysis. As a result of the symmetry of the bridge structure, only the left half of the bridge was considered for analysis. The time histories of vertical displacements and axial forces of midspan lower chords at both middle-span and side-span under nine different concrete filling coefficients were depicted in Figure 15 and Figure 16, respectively. The maximum vertical displacement and axial force of midspan lower chords at both middle-span and side-span under nine different concrete filling coefficients were shown in Table 6.
It could be seen from Figure 15, Figure 16 and Table 6 that with the increase of the concrete filling coefficient, the maximum vertical displacements of midspan lower chords at both middle-span and side-span gradually decreased, indicating that partially concrete filling could effectively improve the vertical dynamic stiffness of the bridge. With the increase of the filling coefficient, the maximum axial forces of midspan lower chords at both middle-span and side-span decreased first and then increased, which was mainly due to the change of the relative stiffness of lower chords. As soon as the filling coefficient was set to 0.4886, the axial forces of lower chords appeared to the minimum value. The minimum axial forces of midspan lower chords at both middle-span and side-span were 1 311.89 kN and 494.17 kN, respectively. The recommended concrete filling coefficient for the composite truss bridge with partially concrete-filled rectangular steel tube members was in the range of 0.35 to 0.5.
5. Impact Coefficient of the Composite Truss Bridge with Partially Concrete-filled Rectangular Steel Tube Members
5.1. Impact Coefficient of Bridge
In general, impact coefficient of a bridge is defined as the ratio between the dynamic response and the static response of a bridge structure to moving vehicles (Deng et al. 2020). The calculation formula of impact coefficient is as follows:
where and are the maximum dynamic response and maximum static response of a bridge caused by vehicle loads.
In this paper, the impact coefficient of a bridge is calculated with the vertical displacement(deflection) and axial force of the lower chord, since the specification does not specify which response should be used. In general, the impact coefficient of a bridge under multi-vehicle working condition is smaller than that under single vehicle working condition (Deng and Cai 2010). Based on conservative considerations, this paper uses the impact coefficient under the action of a single vehicle as a representative for analysis.
5.2. Influence of Concrete-filled Length on Impact Coefficient of Composite Truss Bridge
The calculated values of the impact coefficients of the composite truss bridge under nine concrete filling coefficients were shown in Figure 17. With increasing concrete filling coefficients, the impact coefficients of the composite truss bridge fluctuated within a certain range, with the exception of the position of the edge fulcrum and the middle fulcrum, shown in Figure 17. There was no clear correlation between the impact coefficients of the bridge and the concrete filling coefficients. The deflection impact coefficients near the middle fulcrum were larger, with a maximum value of 1.41, and the axial force impact coefficients near the edge fulcrum were larger, with a maximum value of 3.91. As a result of the supporting effects of the fulcrum, the actual dynamic response values of the members were low (see Figure 13 and Figure 14), and the calculated values of impact coefficients of the members could not reflect the overall impact effect of the vehicle on the bridge.
5.3. Suggested Value of Impact Coefficient
Considering the value of the impact coefficient of a bridge in the United States, Canada, China and other national bridge specifications, the sample values of impact coefficient greater than 0.5 near the edge fulcrum and the middle fulcrum were removed. In this paper, the goodness of fit test was carried out for 867 impact coefficients, which were shown in Figure 18 to follow the extreme value distribution type-I. Table 7 provided the statistical parameters of the impact coefficients. Practically, the statistical value of the parameter with a guarantee rate of 95% was taken as the suggested value. In this paper, the probability density function was fitted using MATLAB software, and the impact coefficient corresponding to the 95% guarantee rate was 0.223.
Comparison of the impact coefficient values of five national specifications under nine concrete filling coefficients was shown in Figure 19. In the working conditions discussed in this paper, the impact coefficient values in American, Canadian, British and Australian specifications were all fixed values (Deng et al. 2020), 0.33, 0.3, 0.25, and 0.3 respectively, which were significantly higher than the suggested value of 0.223. The values of impact coefficient in these national specifications were conservative for this new type of bridge. The value of impact coefficient in Chinese specification was related to bridge fundamental frequency (JTG D60-2015 2015). With the increase of concrete filling coefficient, the value increases slightly, as shown in Table 8. Based on the Chinese specifications, the impact coefficient values for the bridge under 9 concrete filling coefficients were less than the suggested value of 0.223, which should be taken into account by bridge designers.
6. Conclusions
This paper presents a new method to solve the vehicle-bridge coupled vibration problem based on ANSYS constraint equation, and its correctness and reliability are verified. This method is used to analyze vehicle-induced dynamic responses and impact coefficients for a new type of composite truss bridge with partially concrete-filled rectangular steel tube members. The conclusions are as follows:
1. The method in this paper is used to calculate the simply supported beam in the literature. the calculation results of midspan deflection of the bridge are highly consistent with the literature results, and the maximum relative error is less than 5 % at different speeds,The accuracy and reliability of the method have been verified. For vehicle-bridge coupling vibration analysis, this method eliminates the need for engineers to design complicated programming programs, resulting in greatly improved efficiency.
2. The partial concrete filling of a bridge does not change the shape of the time history curve of the dynamic responses of the lower chords of the bridge and has little impact on the position at which the maximum dynamic responses occurs. In composite truss bridges, the partial concrete filling can improve the vertical dynamic stiffness, reduce dynamic response, and improve fatigue resistance.
3. The concrete filling can change the relative stiffness of the chord and the bridge. With the increase of the concrete filling coefficient, the axial forces of the midspan lower chords at both middle-span and side-span decrease first and then increase for the composite truss bridge. A recommended concrete filling coefficient for the composite truss bridge with partially concrete-filled rectangular steel tube members is in the range of 0.35 to 0.5.
4. A goodness-of-fit test is conducted on 867 calculated values of impact coefficient of the new bridge under 9 concrete filling coefficients, the fitting results are submitted to the extreme value distribution type I. At a 95 % guarantee rate, the impact coefficient of the composite truss bridge is 0.223, which is the suggested value of the impact coefficient. The suggested value of the impact coefficient is less than the value of the impact coefficient in the American specification, Australian specification, British specification and Canadian specification, but greater than the value of the impact coefficient in Chinese specification, which should be highly valued by bridge designers.
Acknowledgments
This work was supported by Fundamental Research Program of Shanxi Province (20210302123208, 202203021221298); The open project special fund of Fundamental Research Program of Shanxi Province and Intelligent Transportation Laboratory in Shanxi Province (2024-ITLOP-KD-04).
Conflicts of Interest
We declare that we do not have any commercial or associative interest that represents a conflict of interest in connection with the work submitted.
References
- Chatterjee PK, Datta TK, Surana CS. Vibration of continuous bridges under moving vehicles. Journal of Sound & Vibration 1994, 169(5), 619–632. [Google Scholar] [CrossRef]
- Deng L, Cai CS. Development of dynamic impact factor for performance evaluation of existing multi-girder concrete bridges. Engineering Structures 2010, 32(1), 21–31. [Google Scholar] [CrossRef]
- Deng L, Chen YX, Han WS, Wang W. Studying impact factors for short-and medium-span simply supported concrete highway bridges and its suggested values. China Journal of Highway and Transport 2020, 33(1), 69–78. [Google Scholar] [CrossRef]
- Dauner HG, Oribasi A, Wery D. The lully viaduct, a composite bridge with steel tube truss. Journal of Constructional Steel Research 1998, 46, 67–68. [Google Scholar] [CrossRef]
- Ettefagh MM, Behkamkia D, Pedrammehr S, Asadi K. Reliability analysis of the bridge dynamic response in a stochastic vehicle-bridge interaction. KSCE journal of civil engineering 2015, 19(1), 220–232. [Google Scholar] [CrossRef]
- GB/T7031-2005; Mechanical vibration—road surface profiles—reporting of measured data. GB/T7031-2005. Standards Press of China, Beijing, China. 2005.
- Gui SR, Chen SS, Tang ZJ. Numerical simulation based on Fourier inverse transform and analysis of testing of road surface roughness on bridge. Highway Engineering 2007, 32(6), 39–43. [Google Scholar] [CrossRef]
- Gao YM, Liu YJ, Jiang L, Liu JP, Liu XH. Experiment on flexural behaviour of rectangular concrete filled steel tubular truss stiffened with PBL. Journal of Architecture and Civil Engineering 2017, 34(5), 171–180. [Google Scholar] [CrossRef]
- Gao YM, Liu YJ, Zhou XH, Liu B, Jiang L, Xiong ZH. High-performance CFST composite truss bridge. China Journal of Highway and Transport 2018, 31(12), 174–187. [Google Scholar] [CrossRef]
- Hou WQ, Li YK, Guo W, Li JL, Chen YH, Duan XX. Railway vehicle induced vibration energy harvesting and saving of rail transit segmental prefabricated and assembling bridges. Journal of Cleaner Production 2018, 182(MAY 1), 946–959. [Google Scholar] [CrossRef]
- Hou JL, Xu WB, Chen YJ, Zhang KD, Sun H, Li Y. Typical diseases of a long-span concrete-filled steel tubular arch bridge and their effects on vehicle-induced dynamic response. Frontiers of Structural and Civil Engineering 2020, 14(4), 867–887. [Google Scholar] [CrossRef]
- Huang XY, Zhuo WD, Shang GP. ANSYS-based spatial coupled vibration analysis method of vehicle-bridge interaction system. Key Engineering Materials 2014, 2614(1148), 117–126. [Google Scholar] [CrossRef]
- JTG D60-2015; General specifications for design of highway bridges and culverts. JTG D60-2015. China Communications Press Co., Ltd., Beijing, China. 2015.
- Jiang L, Liu YJ, Long X, Wang WS, Ma YP. Fatigue assessment of joints in concrete-filled rectangular hollow section composite truss bridges based on hot spot stress method. Journal of Traffic and Transportation Engineering 2020, 20(6), 104–116. [Google Scholar] [CrossRef]
- Jiang L, Liu YJ, Long X, Liu B, Liu ZB. Experimental study on stress concentration characteristics of joints in concrete-filled rectangular steel tubular truss. Journal of Building Structures 2022, 43(2), 184–196+214. [Google Scholar] [CrossRef]
- Jin ZB, Pei SL, Asce M, Li XZ, Qiang SZ. Vehicle-induced lateral vibration of railway bridges: an analytical-solution approach. Journal of Bridge Engineering 2016, 21(2), 04015038. [Google Scholar] [CrossRef]
- Li Y, Qin LH, Li Z, Yang TT. Dynamic performance of strengthened concrete-filled steel tubular arch bridge due to moving vehicles. Journal of Aerospace Engineering 2019, 32(1), 4018113.1–4018113.11. [Google Scholar] [CrossRef]
- Liu YJ, Ma YP, Tian ZJ, Yuan ZY, Xiong ZH, Yang J. Field test of rectangular concrete filled steel tubular composite truss bridge with continuos rigid system. China Journal of Highway and Transport 2018, 31(5), 53–62. [Google Scholar] [CrossRef]
- Liu YJ, Long X, Jiang L, Liu ZB. Comparison on fatigue structural details of CFST welded joints based on hot spot stress method. Journal of Architecture and Civil Engineering 2020, 37(5), 1–12. [Google Scholar] [CrossRef]
- Liu YJ, Zhou XH. Composite truss bridge with concrete-filled rectangular steel tube members. China Communications Press Co., Ltd, Beijing, China. 2021. [Google Scholar]
- Liu B, Liu YJ, Zhou XH, Li Z, Wang KN. Design of mid-span fabricated RCFST composite truss bridge. Journal of Traffic and Transportation Engineering 2017, 17(4), 20–31. [Google Scholar] [CrossRef]
- Liu B, Liu YJ, Yang YH, Cao MM, Wang KN. Design of PBL-stiffened steel truss-concrete composite girder bridge with truss made of rectangular steel tubes. Bridge Construction 2019, 49(5), 97–102. [Google Scholar] [CrossRef]
- Mato FM, Cornejo MO, Rubio LM. Viaduct over river ulla: an outstanding composite (steel and concrete) high-speed railway viaduct. Structural Engineering International 2014, 24(1), 131–136. [Google Scholar] [CrossRef]
- Shen HP, Chen XJ, Lu K, Huang H. A new vehicle-bridge coupling analysis method based on model polycondensation. KSCE Journal of Civil Engineering 2021, 25(1), 245–255. [Google Scholar] [CrossRef]
- Shen HM, Xiao XB. Numerical method for vehicle-bridge coupled vibrations. Journal of Southwest Jiaotong University 2003, 38(6), 658–662. [Google Scholar] [CrossRef]
- Tian Y, Zhang J. Structural flexibility identification via moving-vehicle-induced time-varying modal parameters. Journal of Sound and Vibration 2020, 474(2), 115264. [Google Scholar] [CrossRef]
- Wang XM. ANSYS numerical analysis of engineering structures. China Communications Press Co., Ltd., Beijing, China, 385 – 409. 2007. [Google Scholar]
- Wyss JC, Di S, Fujino Y. Prediction of vehicle-induced local responses and application to a skewed girder bridge. Engineering Structures 2011, 33(4), 1088–1097. [Google Scholar] [CrossRef]
- Wu QX, Huang YF, Chen BC. Shaking tables testing study of lightweight bridge with CFST composite truss girder and lattice pier. Engineering Mechanics 2014, 31(9), 89–96. [Google Scholar] [CrossRef]
- Wang XM, Li YQ, Xu HW. Element types for structural analysis in ANSYS and their applications. China Communications Press Co., Ltd, Beijing, China. 2011. [Google Scholar]
- Xie X, Huang Y, Qin X. A new composite truss bridge and a study on its dynamic characteristics with FE and experimental methods. KSCE Journal of Civil Engineering 2021, 25(3), 931–947. [Google Scholar] [CrossRef]
- Yang SP, Chen Lq, Li SH. Dynamics of vehicle-road coupled system. Science Press, Beijing, China. 2012. [Google Scholar]
- Yu F, Lin Y. Dynamics of the vehicle’s system. Machine Press, Beijing, China. 2005. [Google Scholar]
- Yang YB, Wu YS. A versatile element for analyzing vehicle–bridge interaction response. Engineering structures 2001, 23(5), 452–469. [Google Scholar] [CrossRef]
Figure 1.
Simplified model of a two-axle vehicle.
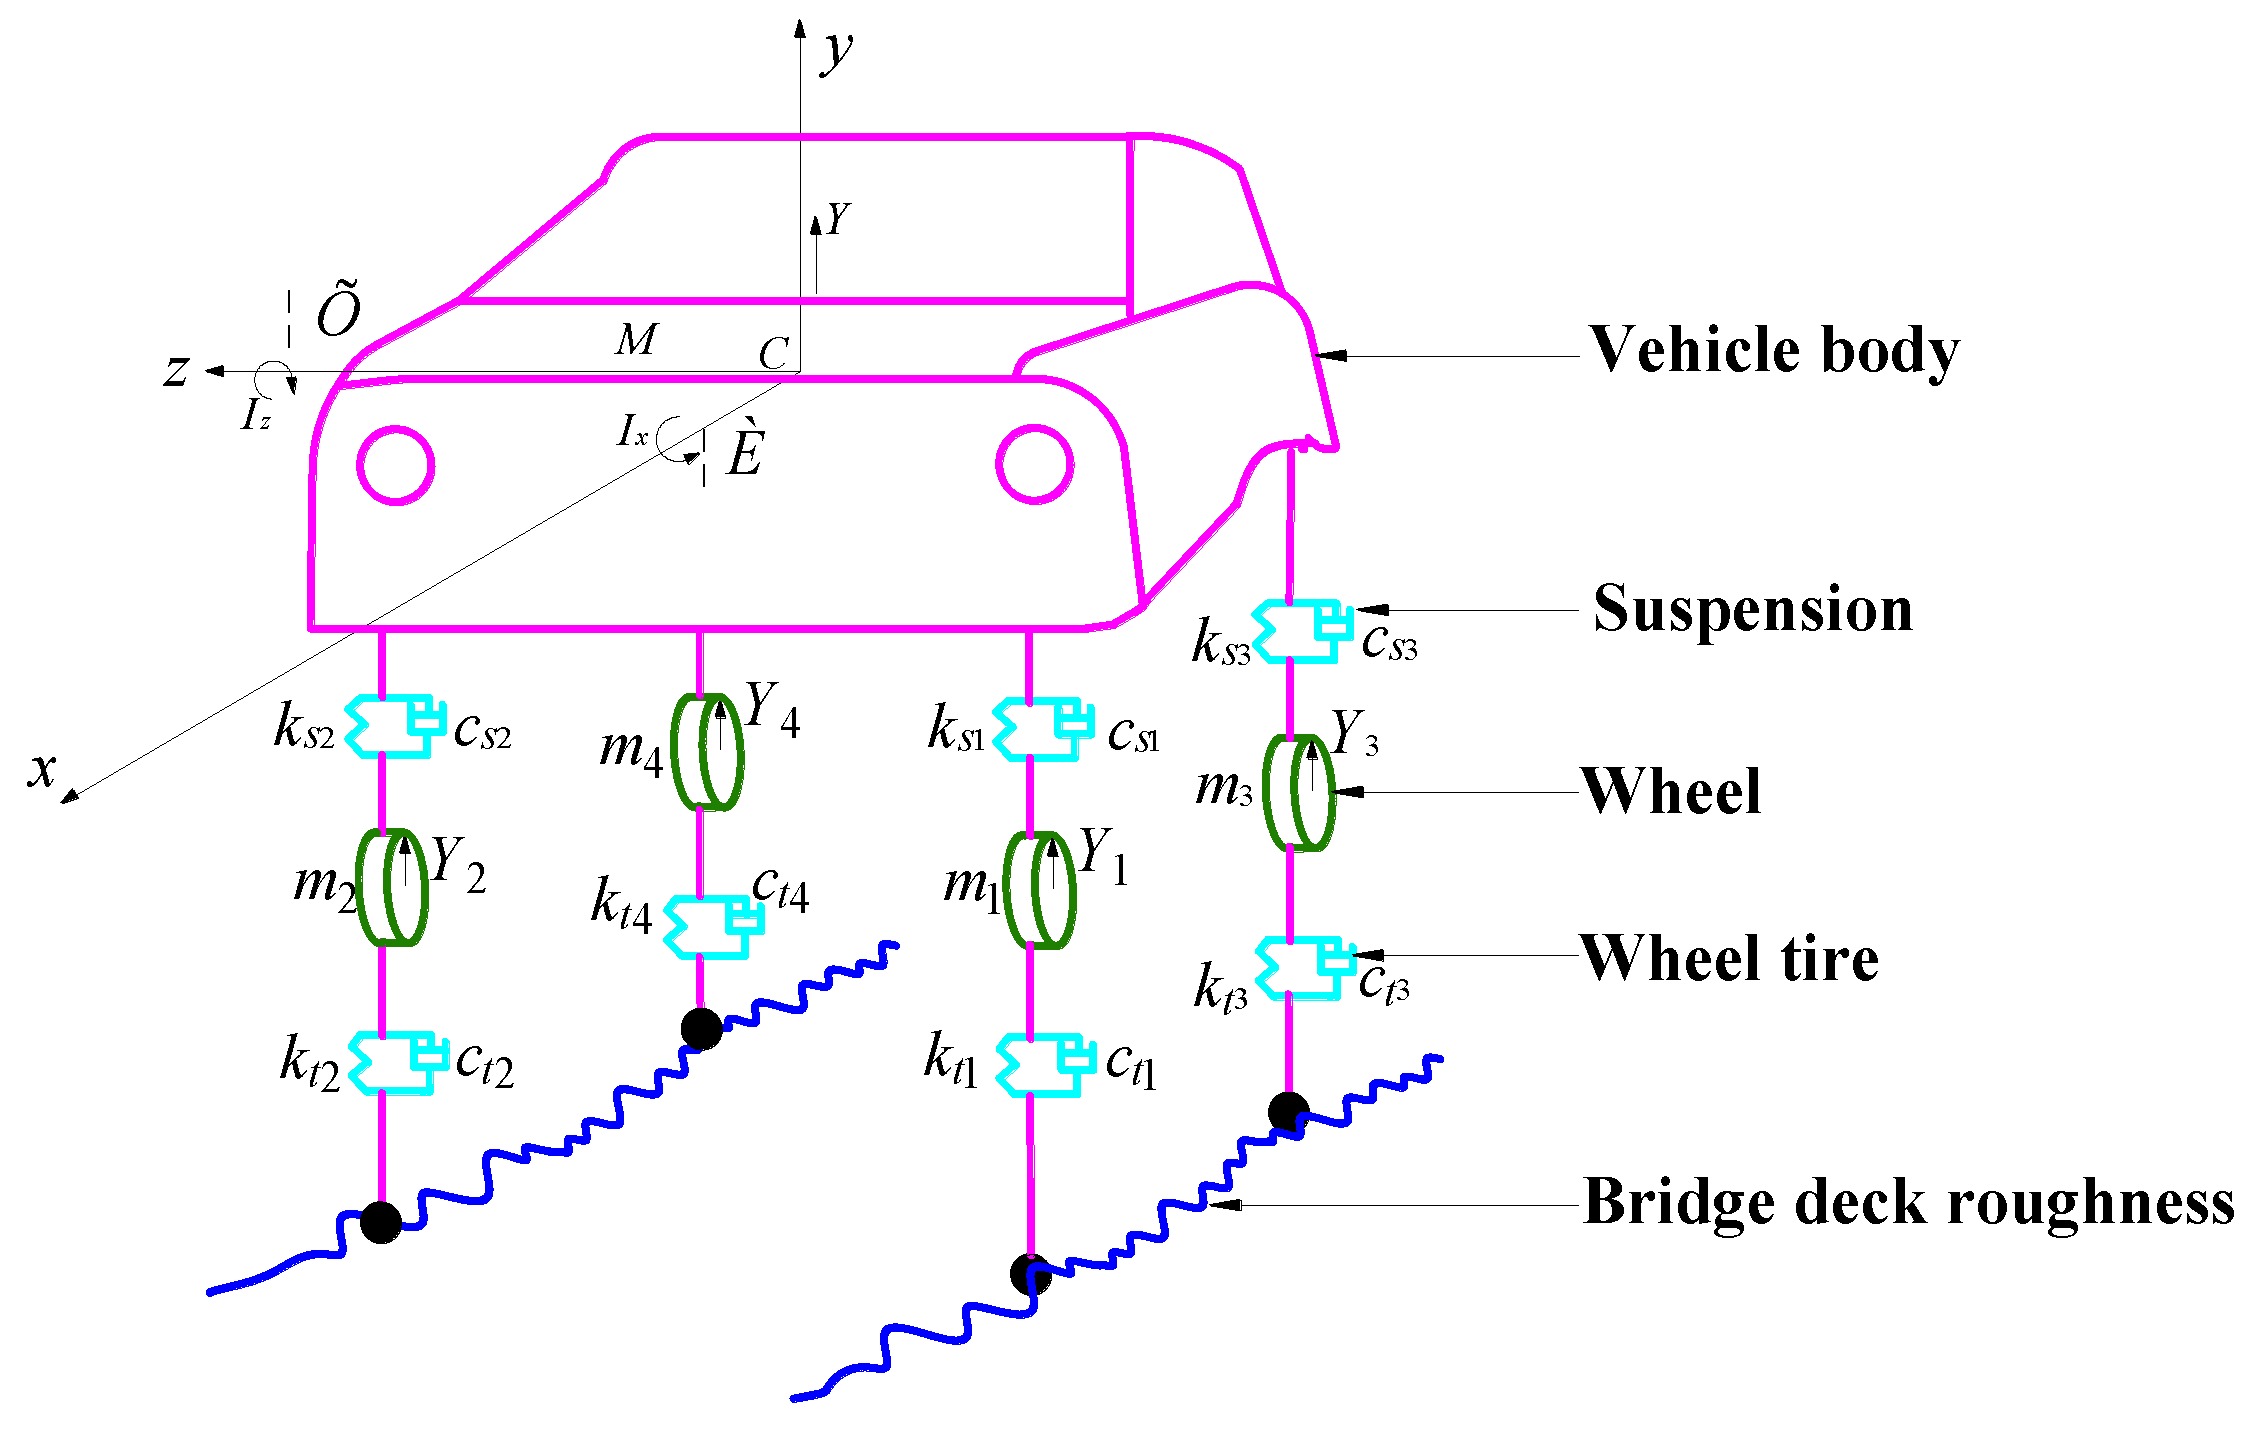
Figure 2.
ANSYS finite element model of a spatial two-axle simplified vehicle.
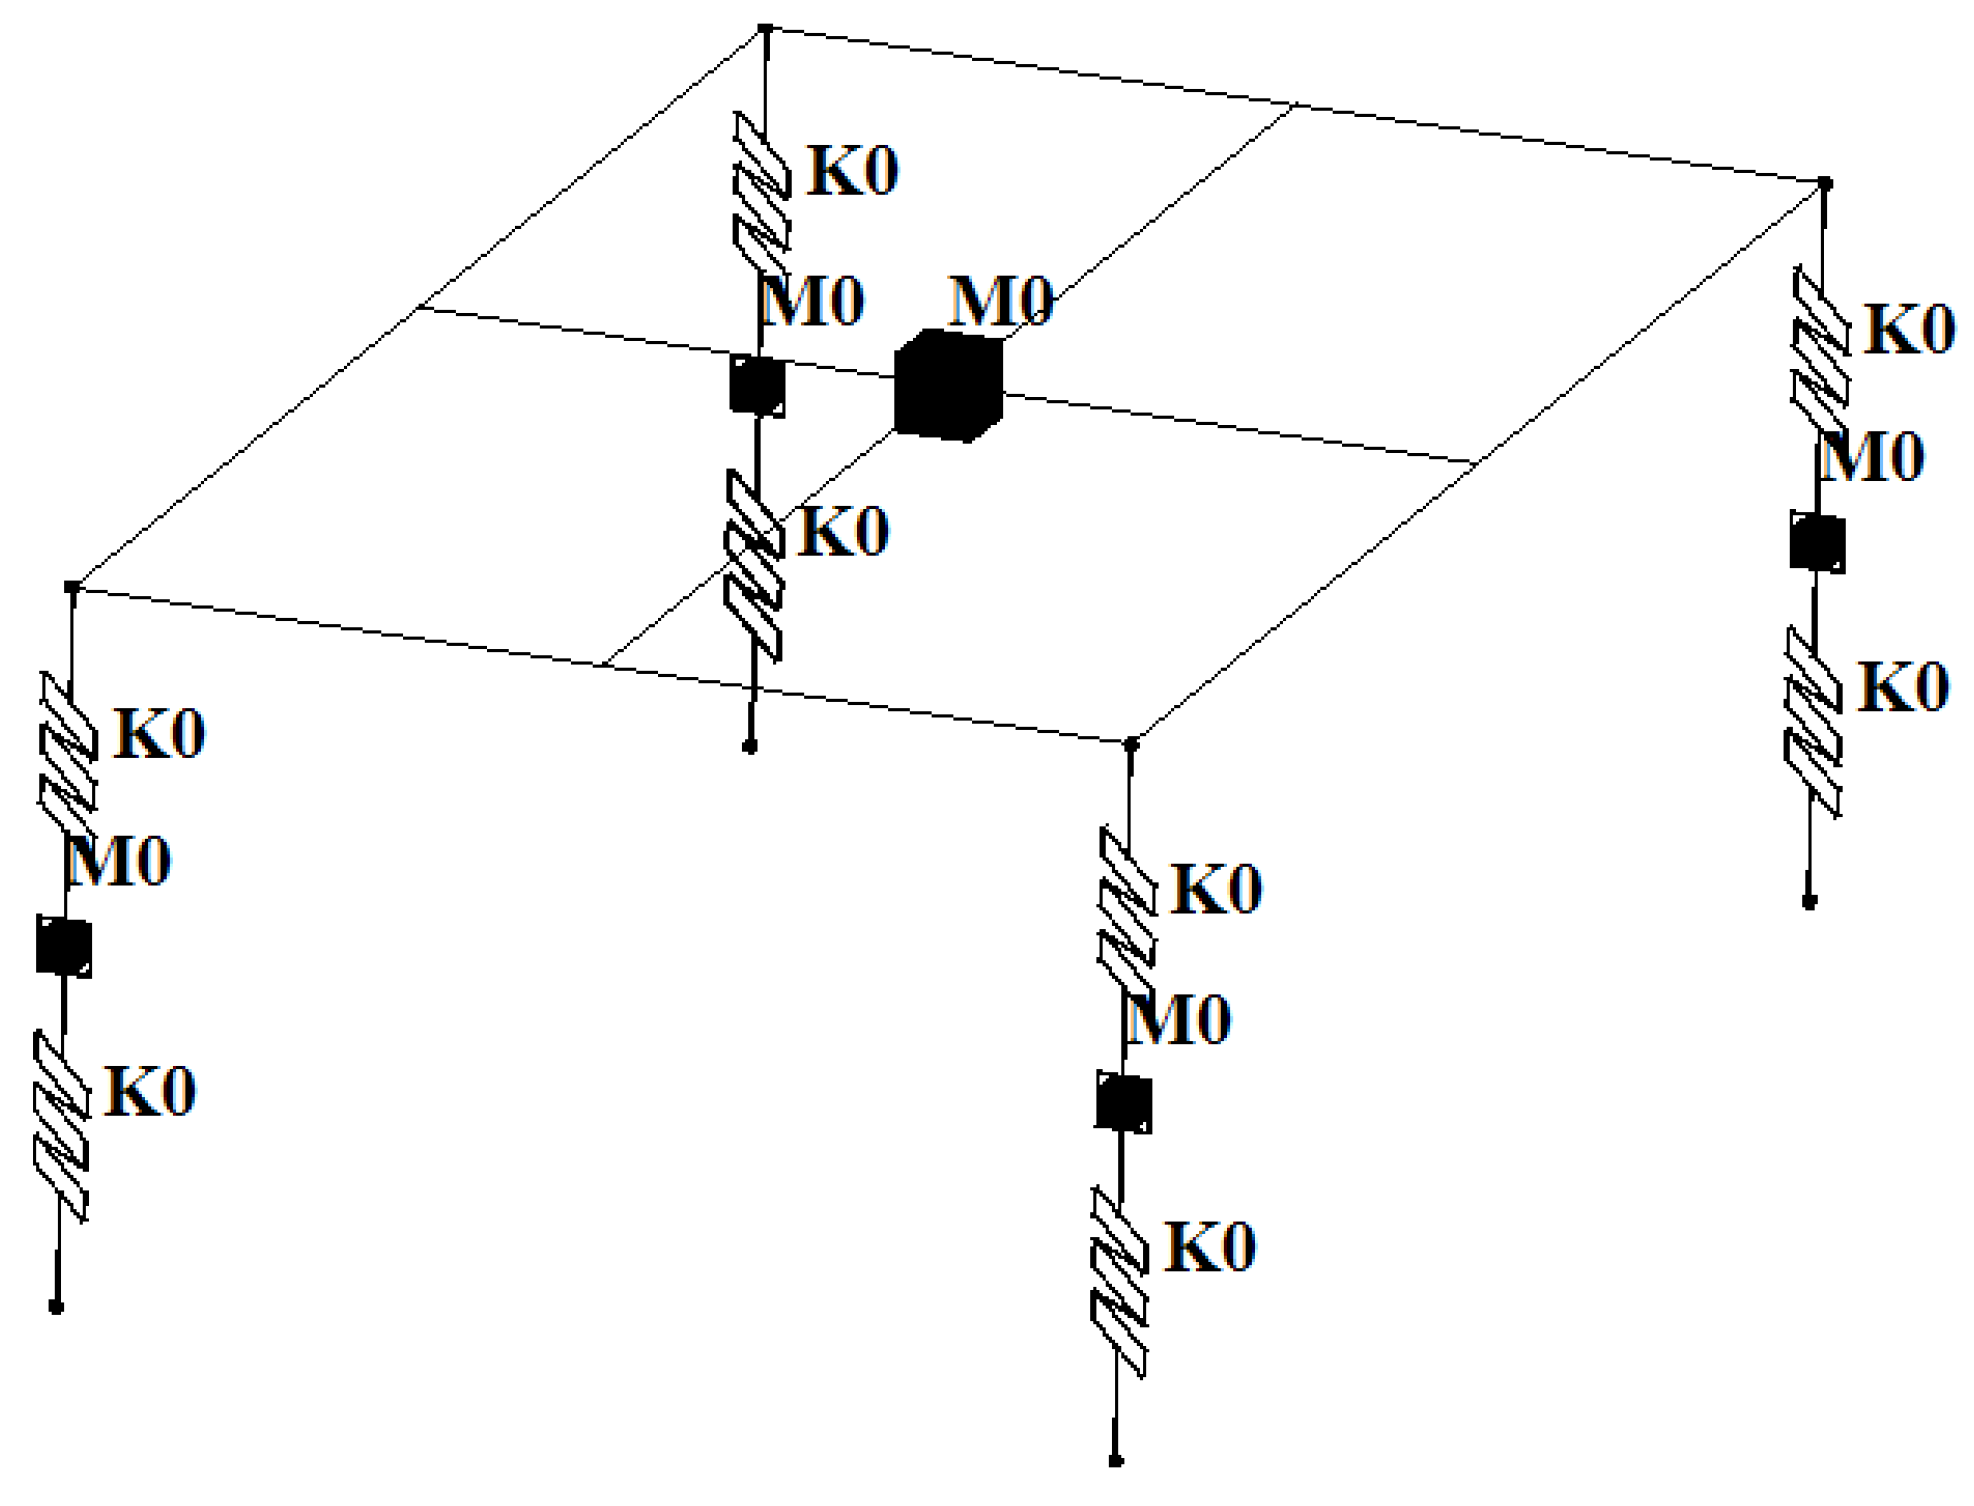
Figure 3.
Bridge deck roughness model.
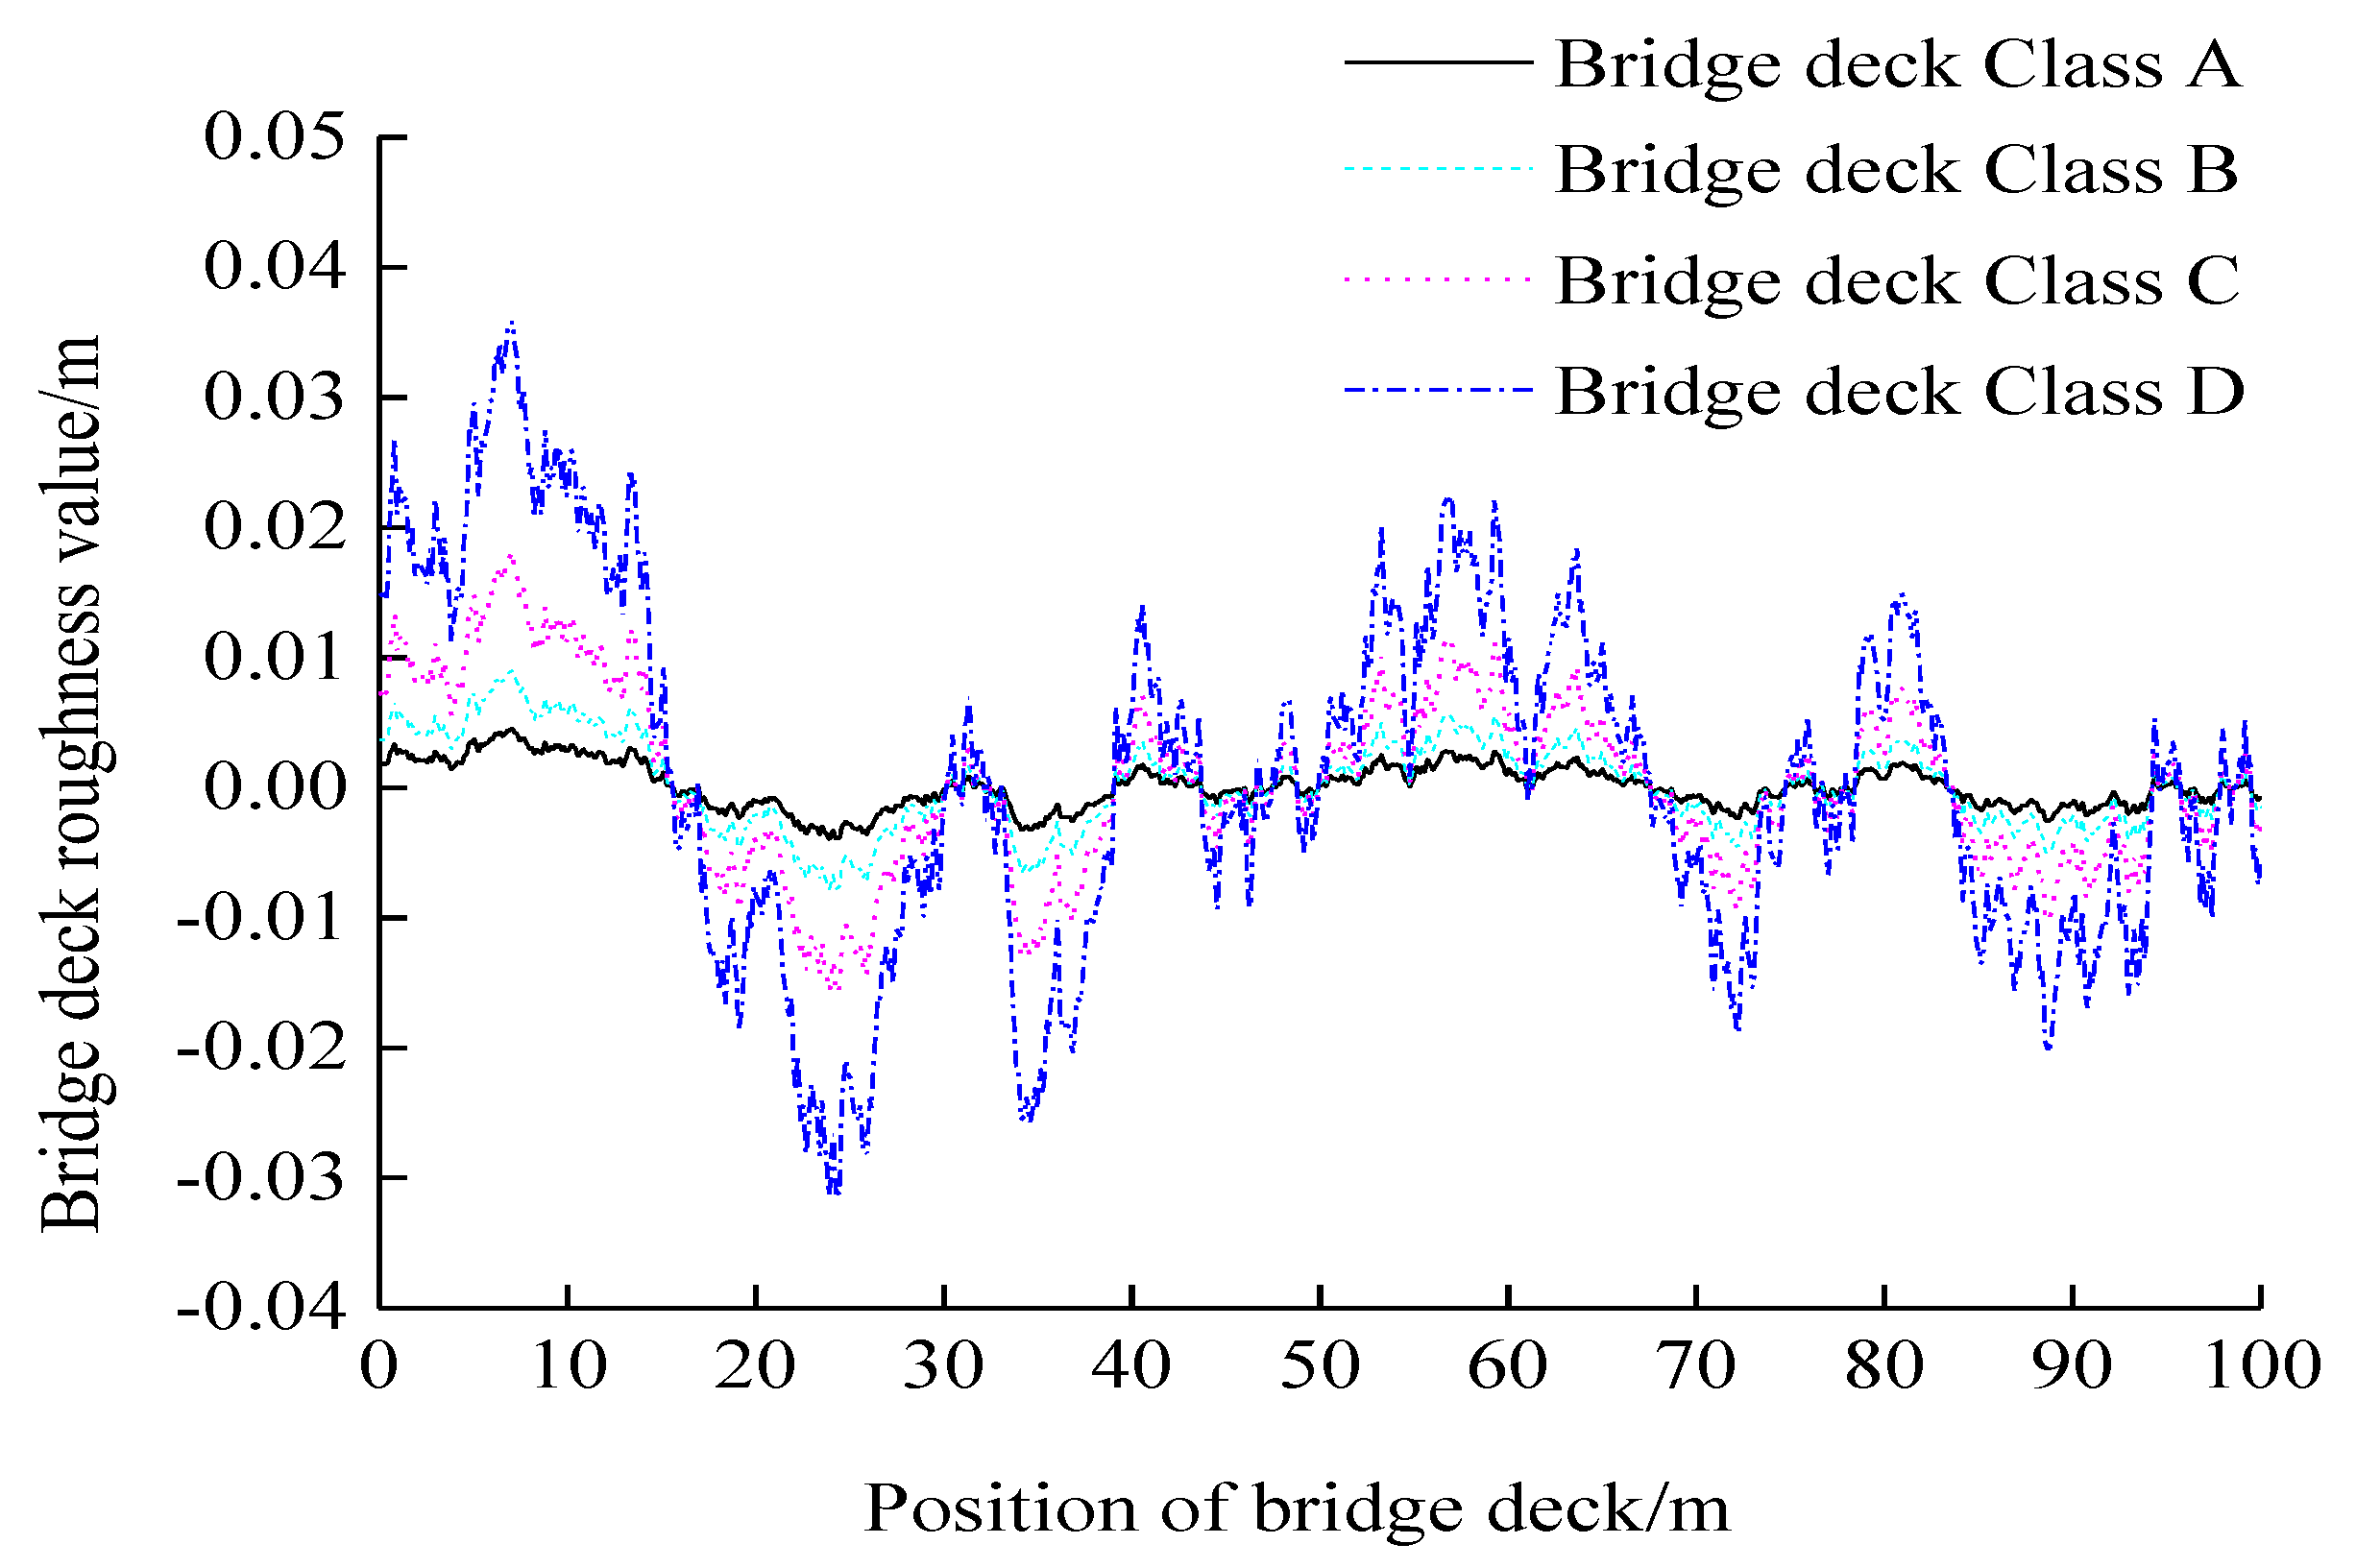
Figure 4.
Schematic diagram of vehicle-bridge coupled vibration model(a)Beam element model for the bridge(b)Plate (shell) element model for the bridge.
Figure 4.
Schematic diagram of vehicle-bridge coupled vibration model(a)Beam element model for the bridge(b)Plate (shell) element model for the bridge.
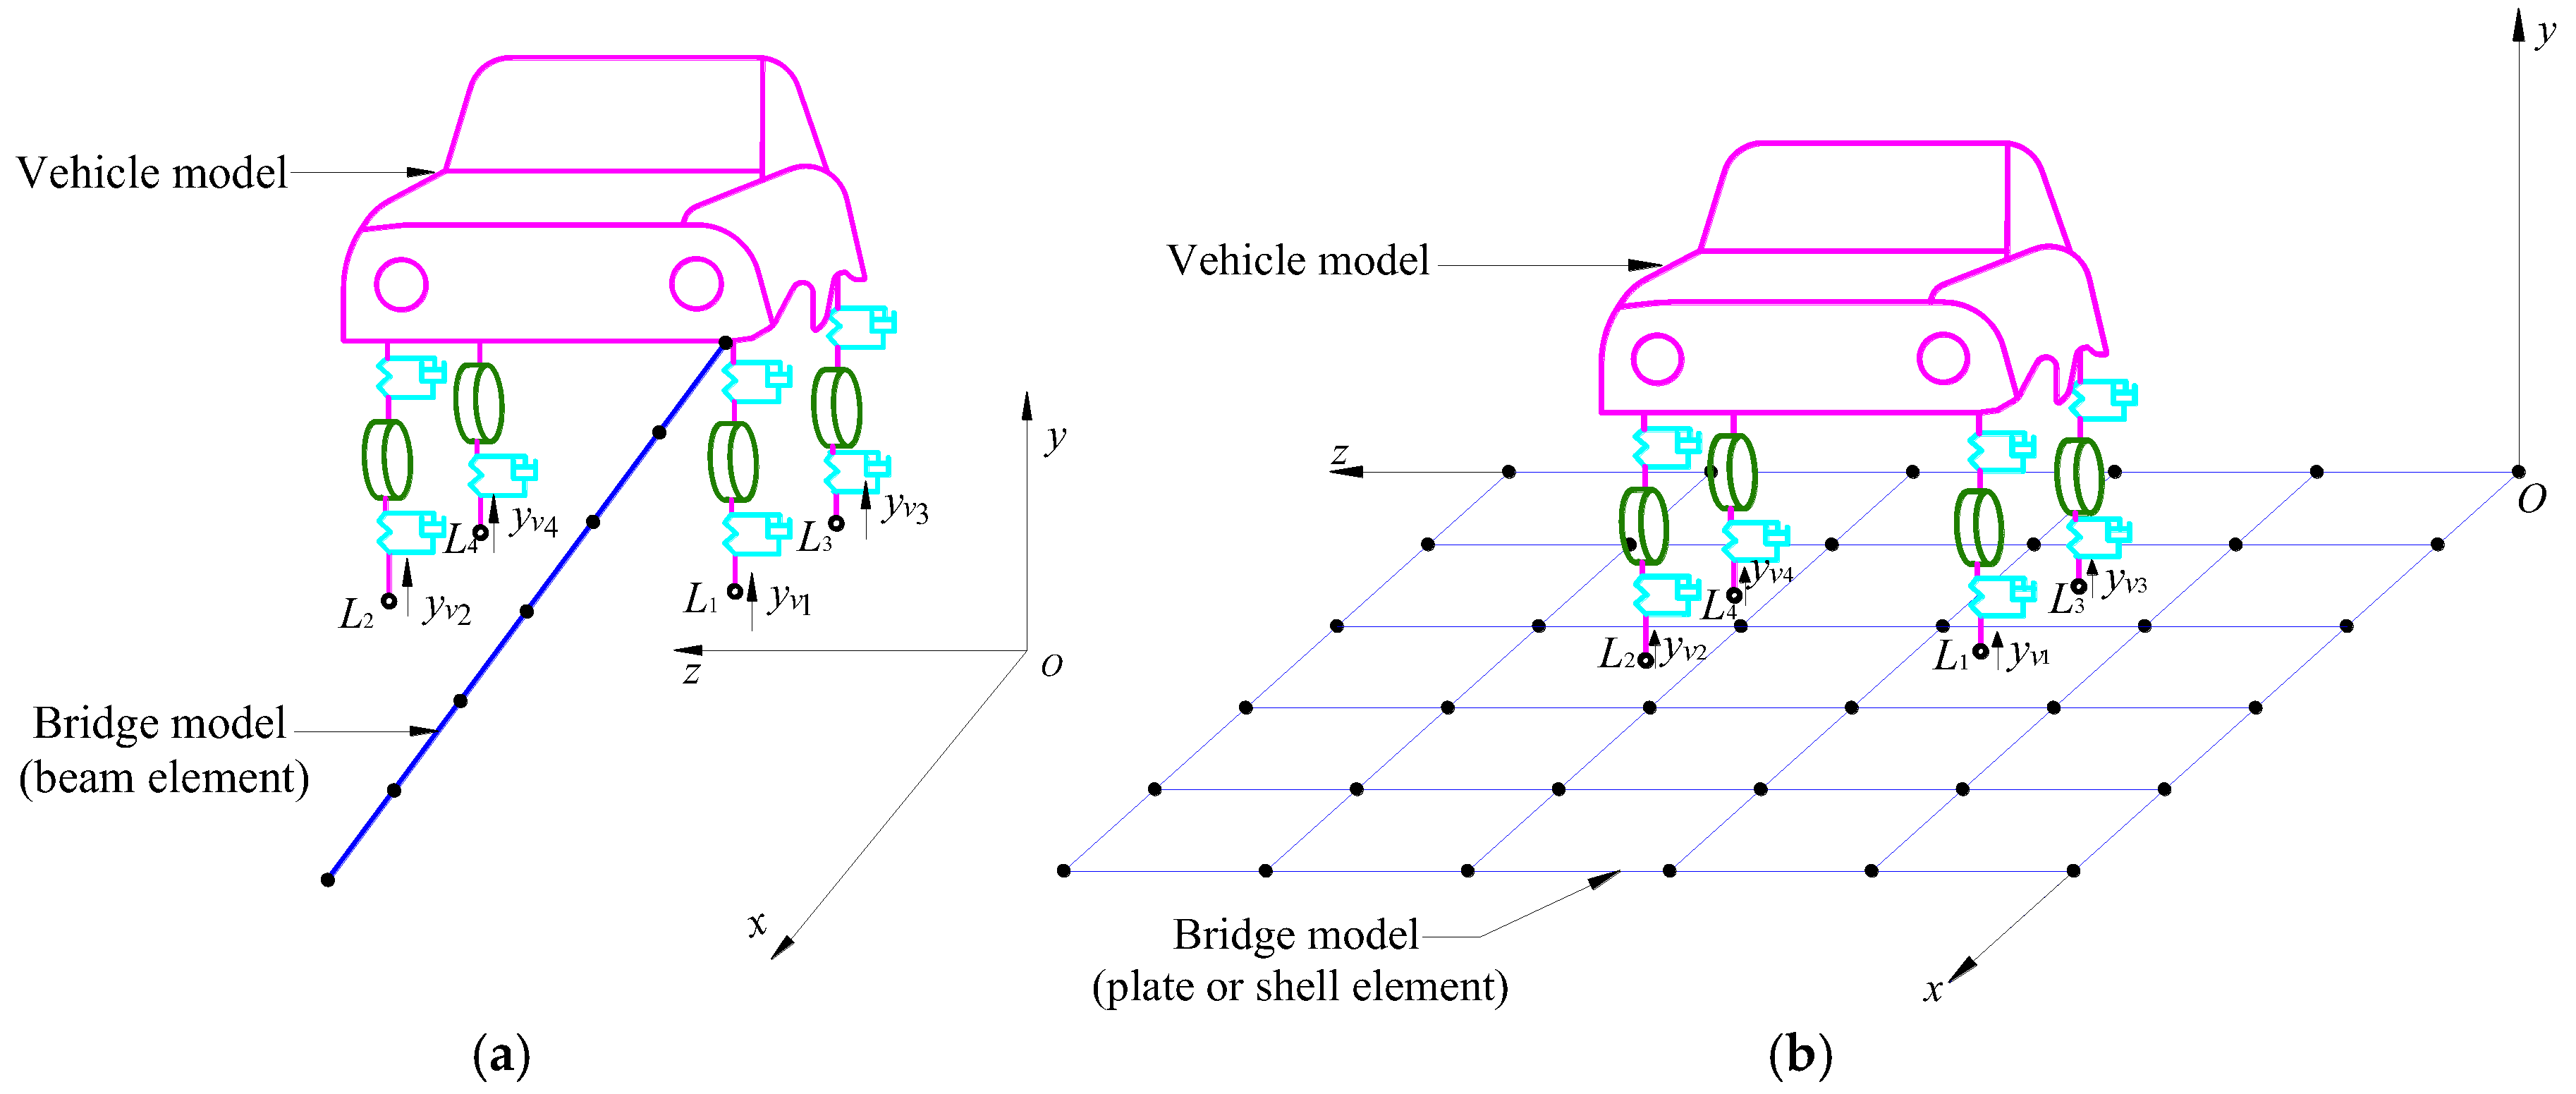
Figure 5.
Diagram of displacements at beam element nodes.
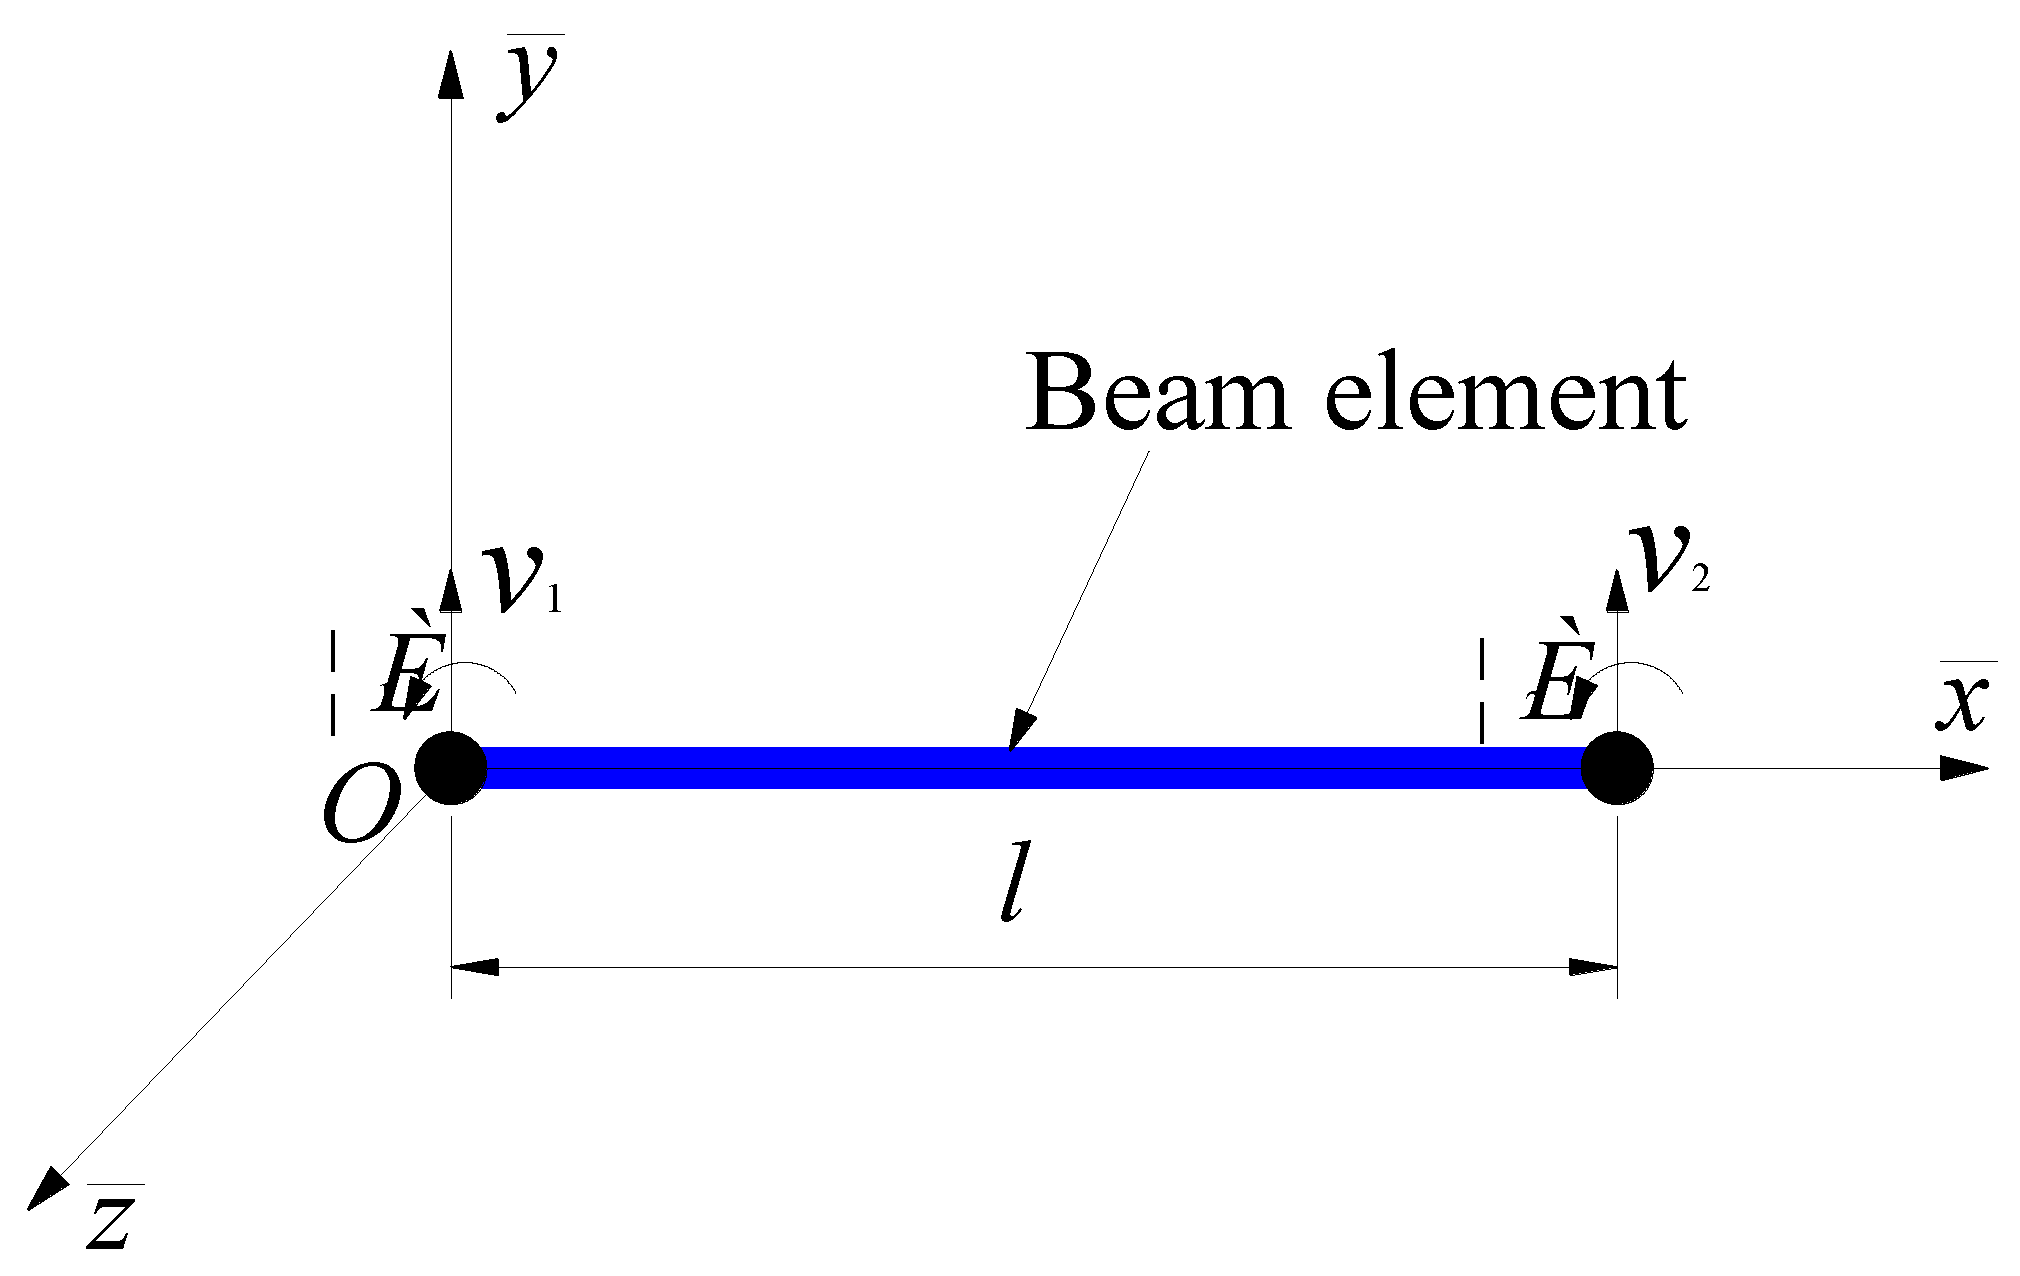
Figure 6.
Diagram of displacement compatibility relationship for contact point between the wheel tire and the bridge deck.
Figure 6.
Diagram of displacement compatibility relationship for contact point between the wheel tire and the bridge deck.
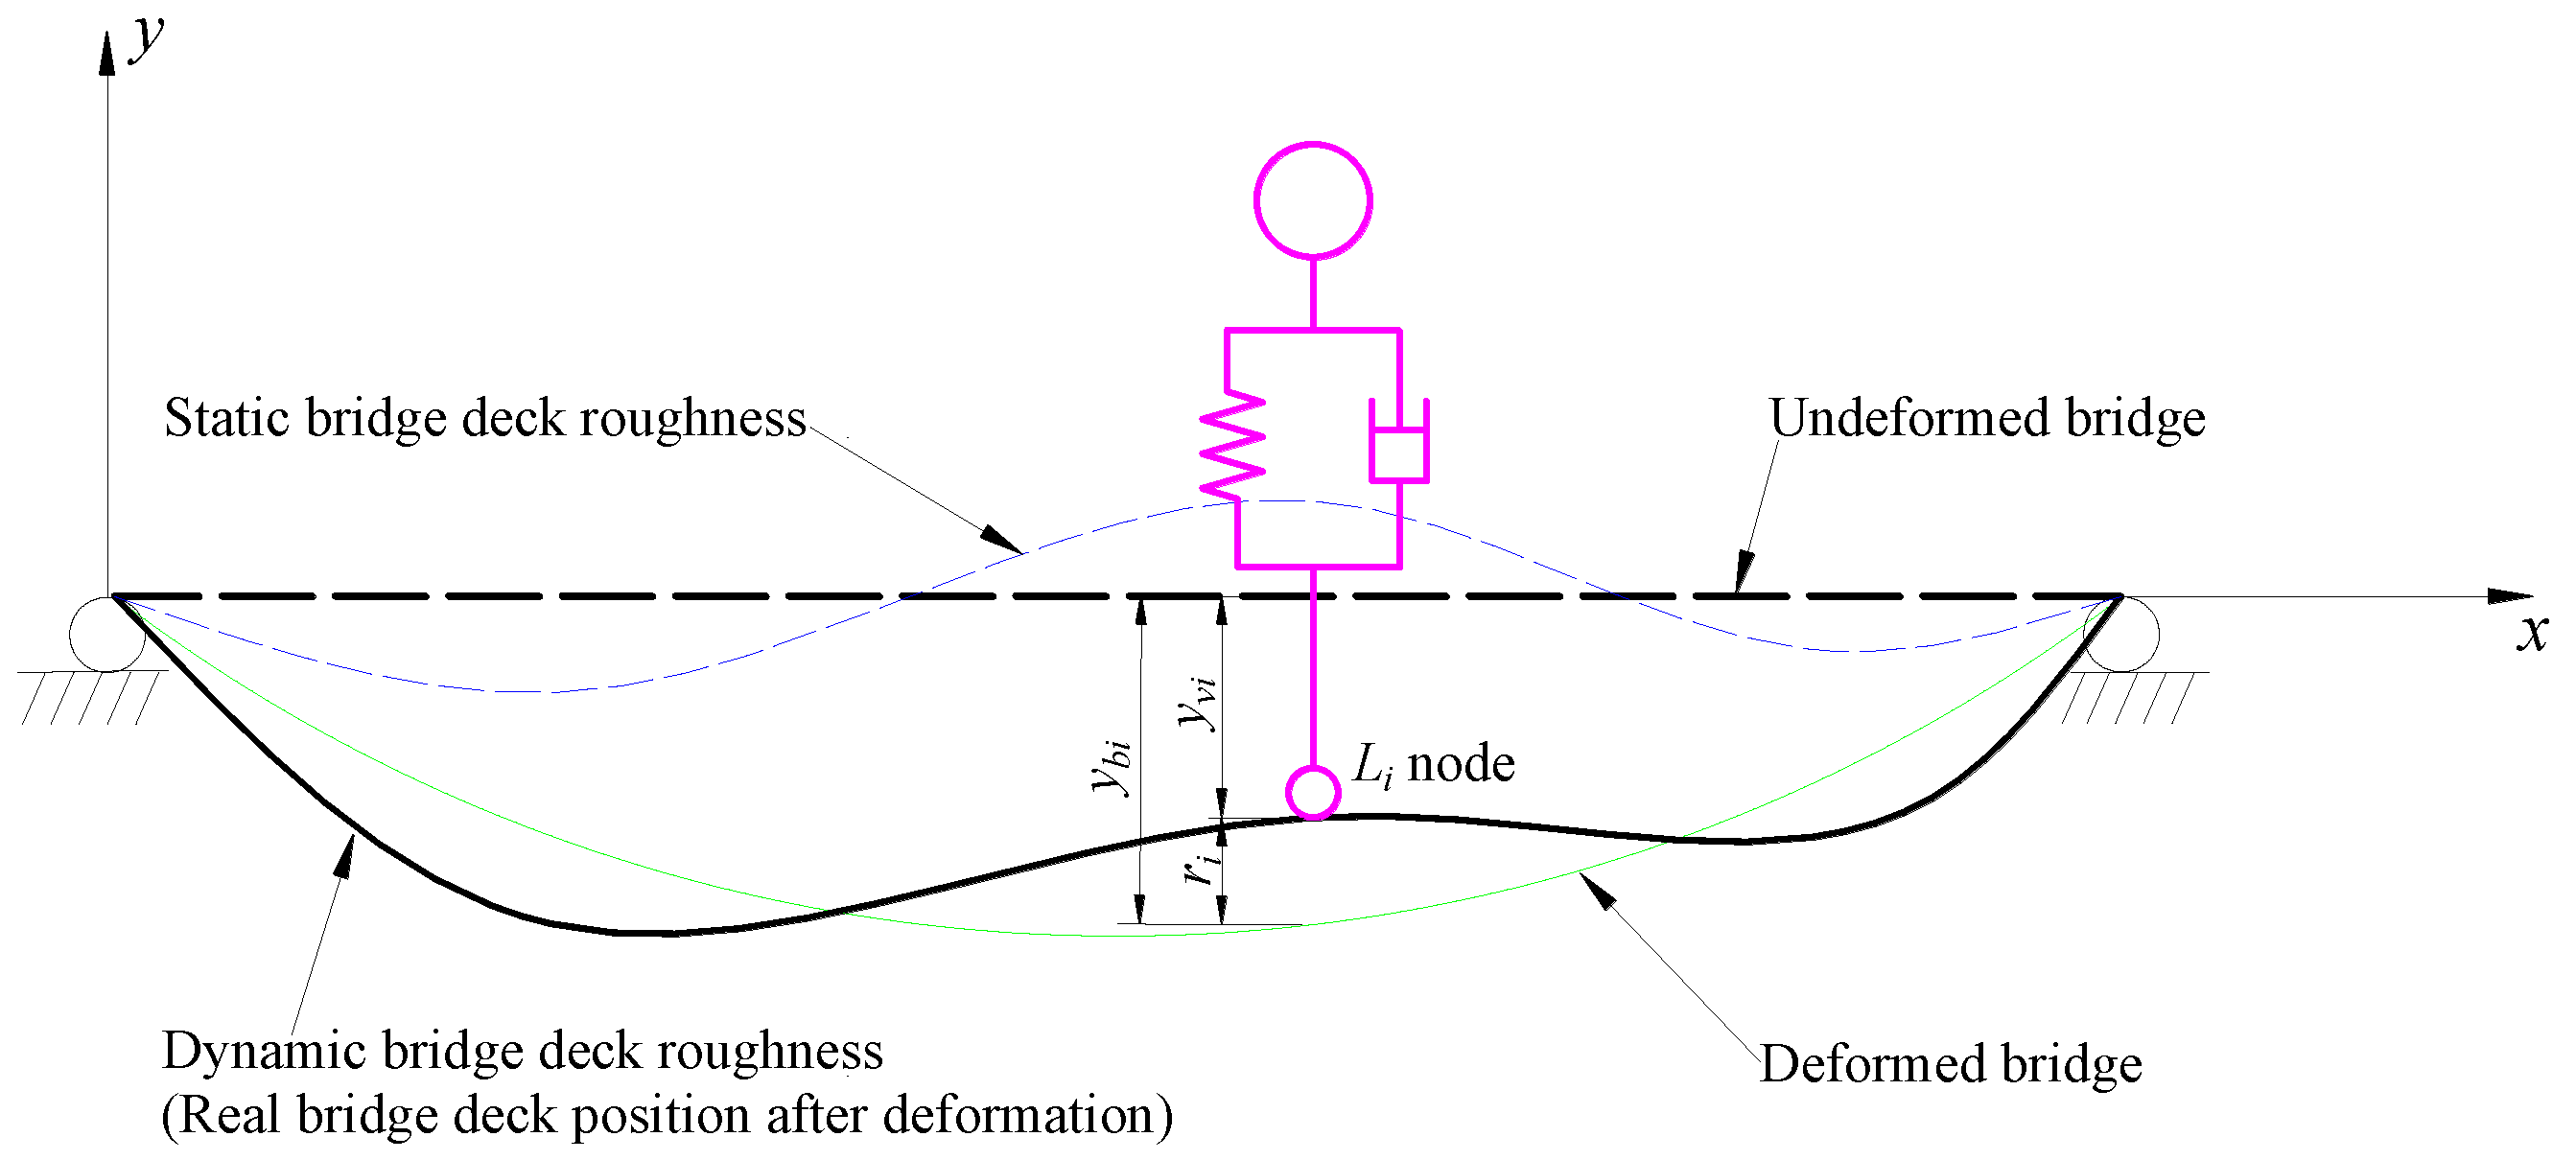
Figure 7.
Flow chart of vehicle-bridge coupled vibration solution in ansys software.
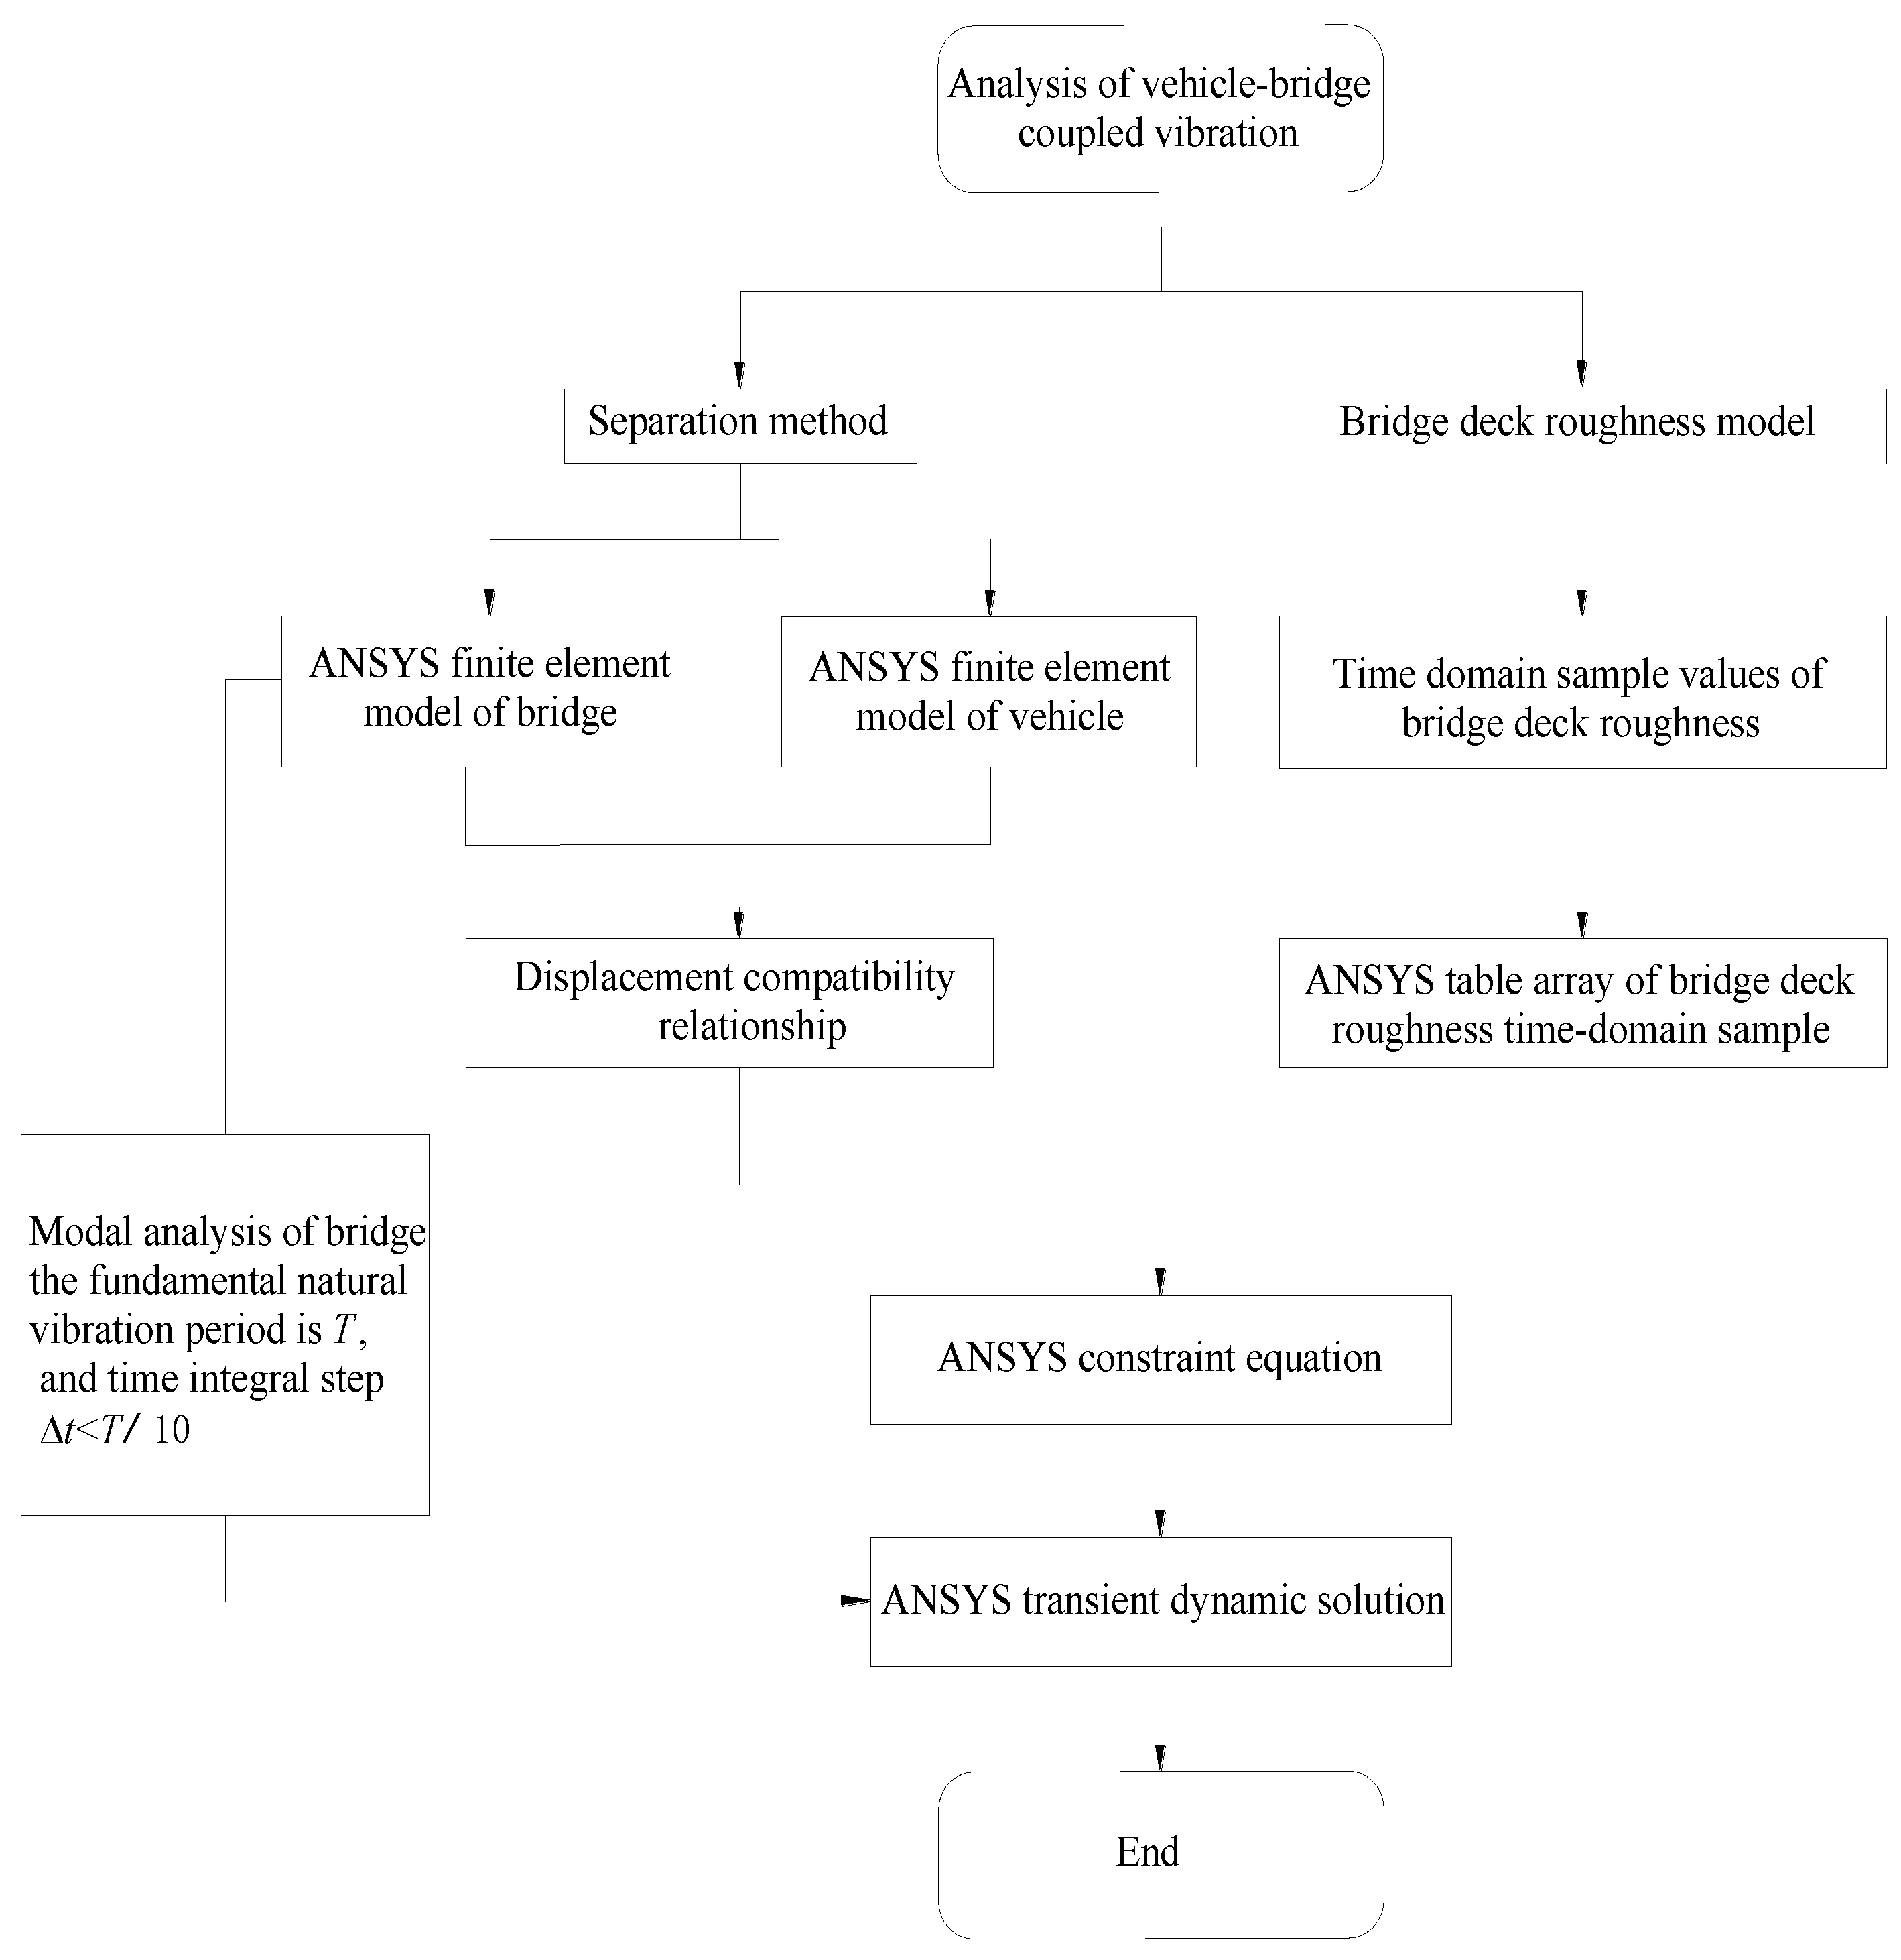
Figure 8.
Comparison of vertical displacement at midspan position of simply-supported girder bridge with different vehicle speeds(a)Results of this paper(b)Results in the literature.
Figure 8.
Comparison of vertical displacement at midspan position of simply-supported girder bridge with different vehicle speeds(a)Results of this paper(b)Results in the literature.
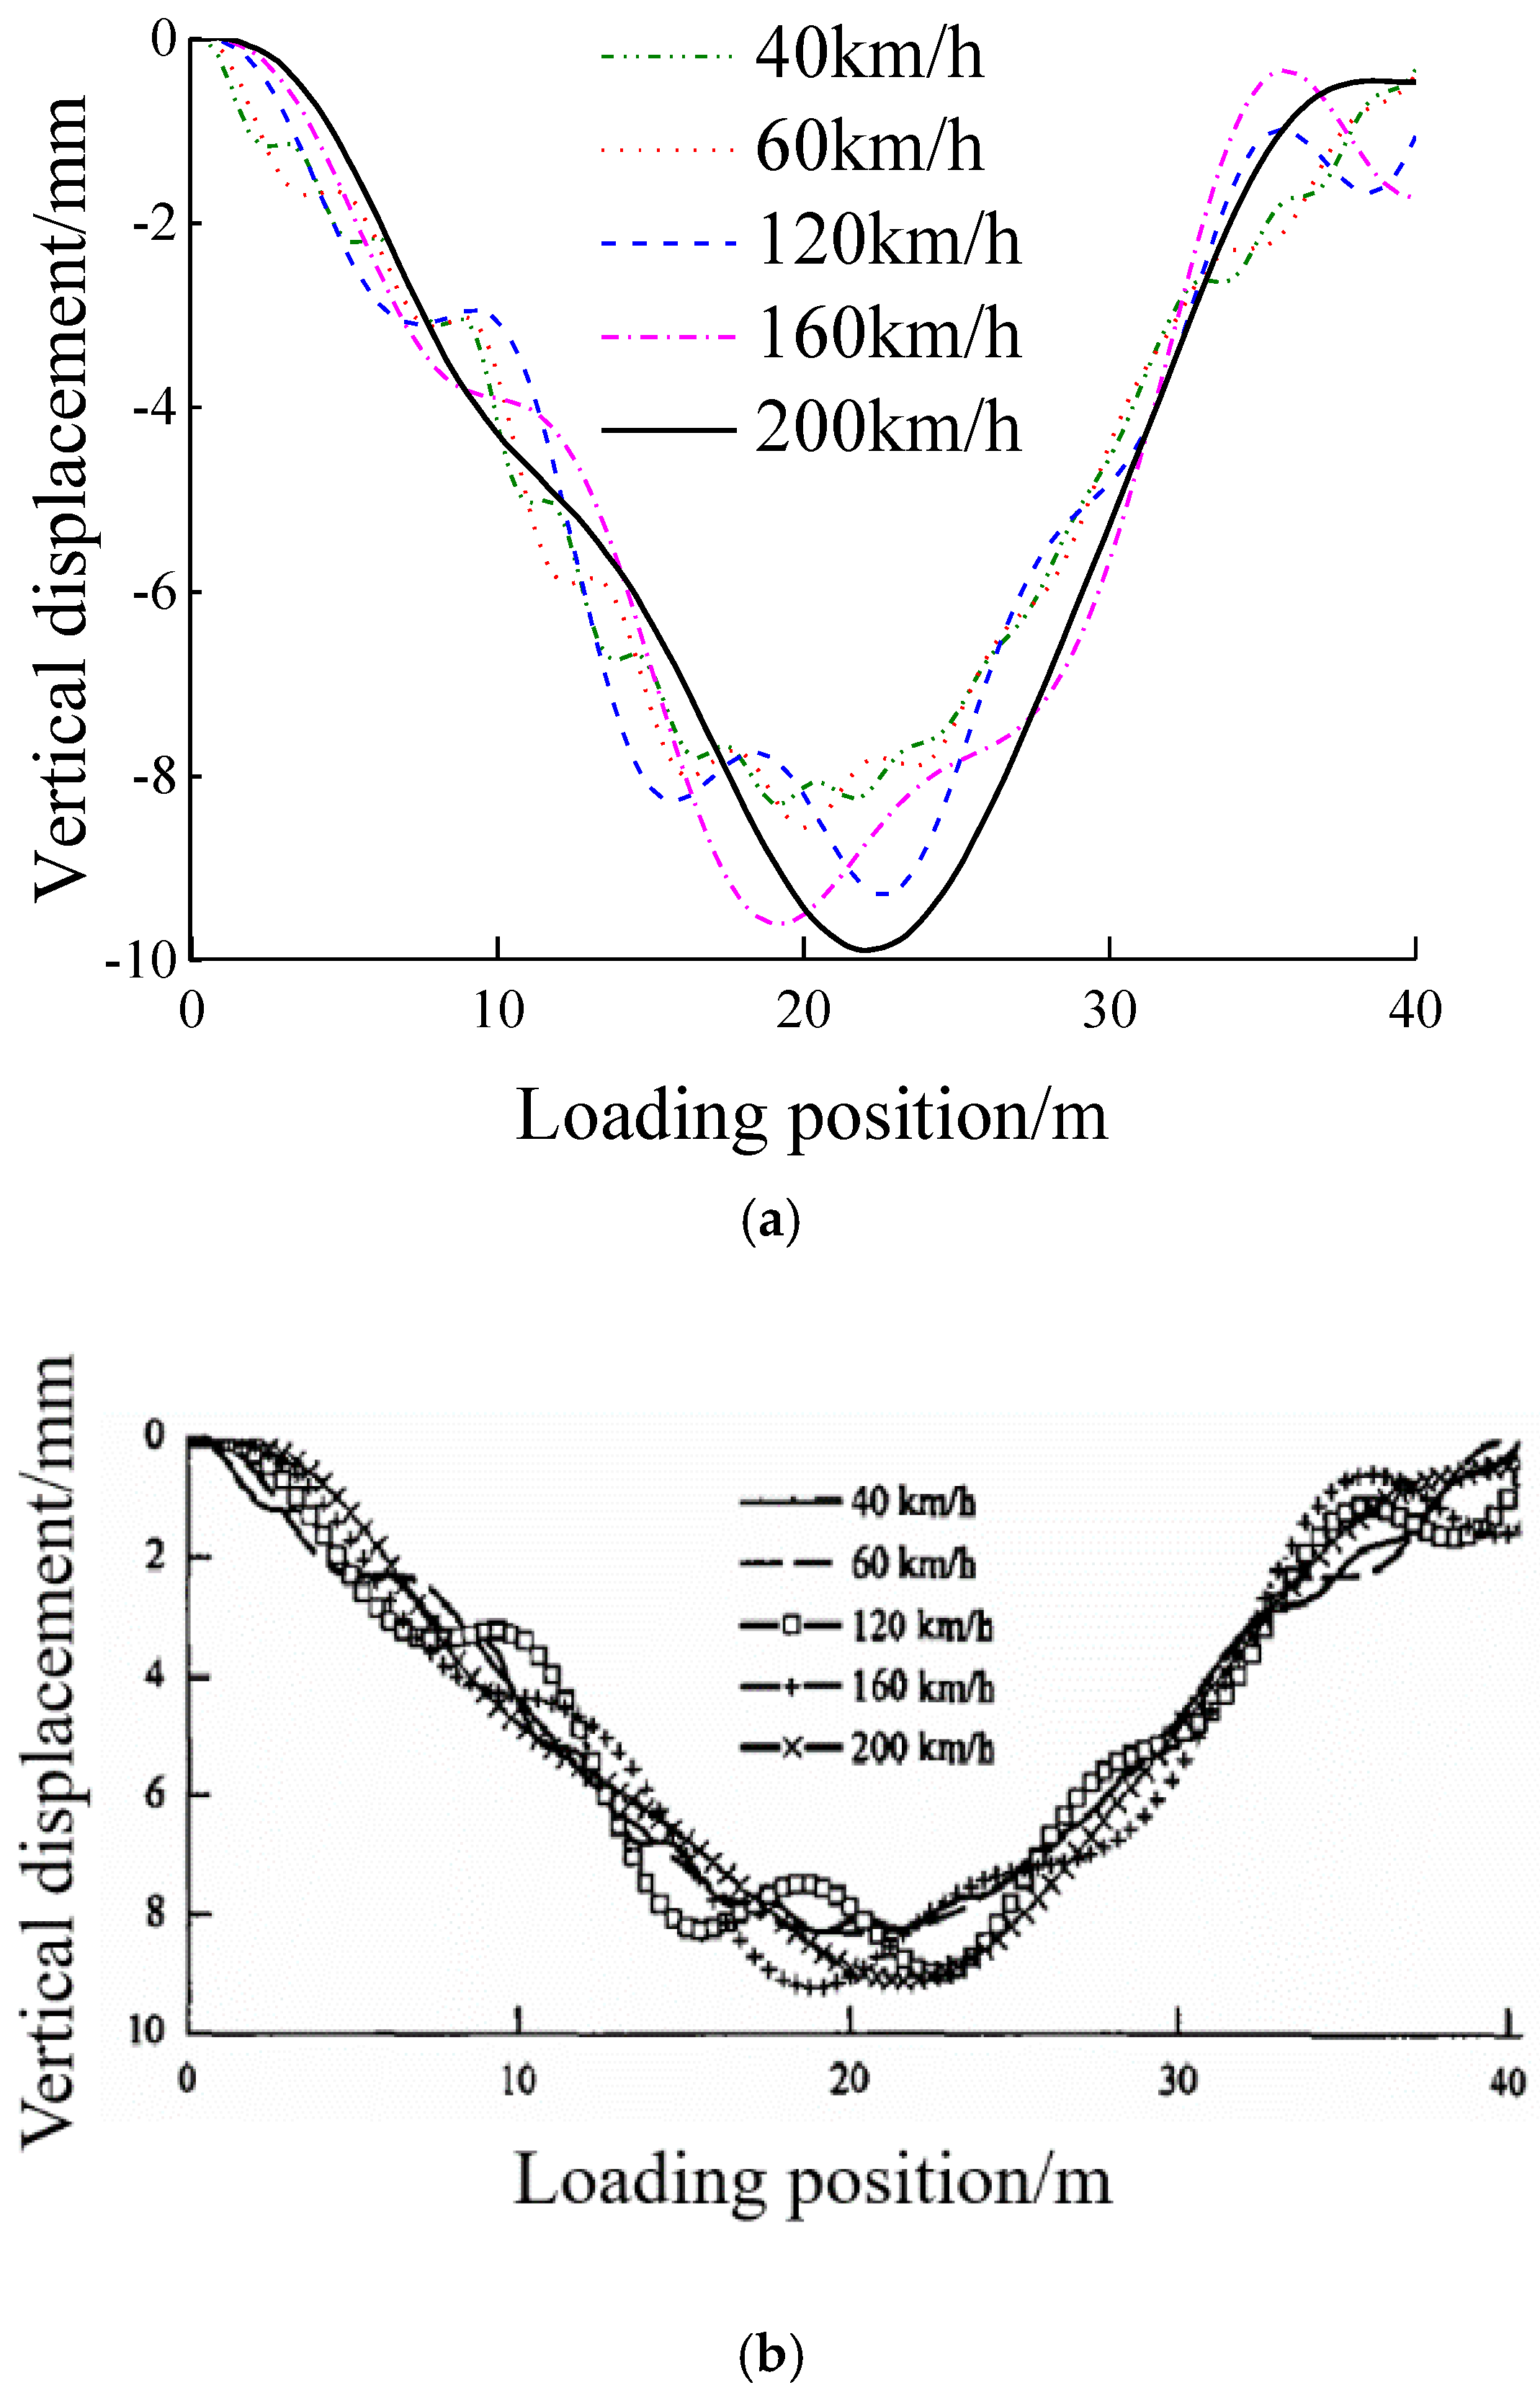
Figure 9.
Front view of composite truss bridge with partially concrete-filled rectangular steel tube members (cm).
Figure 9.
Front view of composite truss bridge with partially concrete-filled rectangular steel tube members (cm).
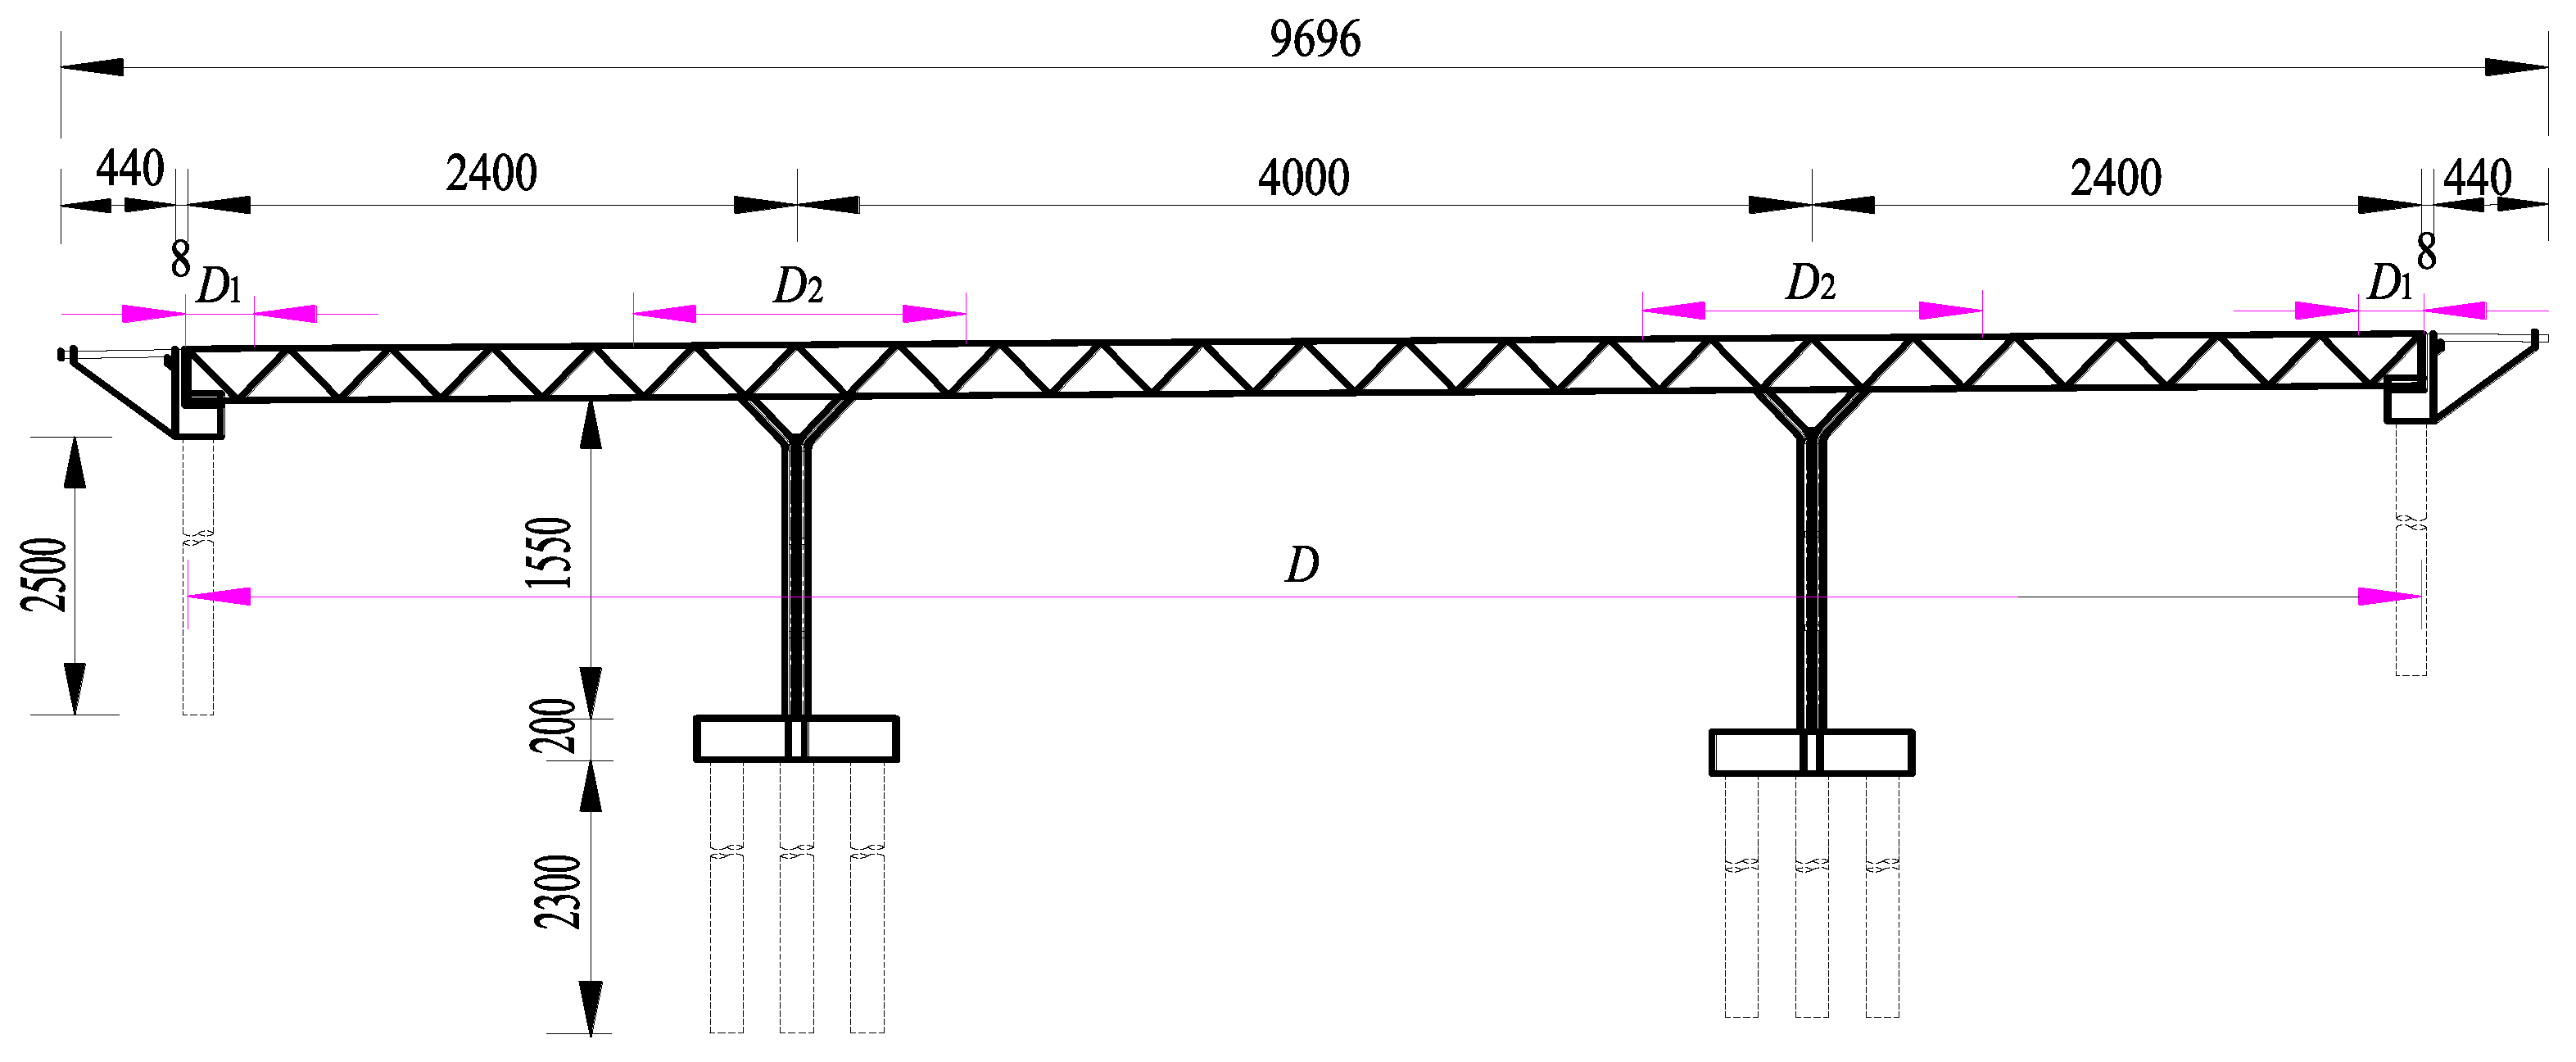
Figure 10.
Structural diagram at the interface between the concrete-filled segment and the empty steel tube segment (mm).
Figure 10.
Structural diagram at the interface between the concrete-filled segment and the empty steel tube segment (mm).
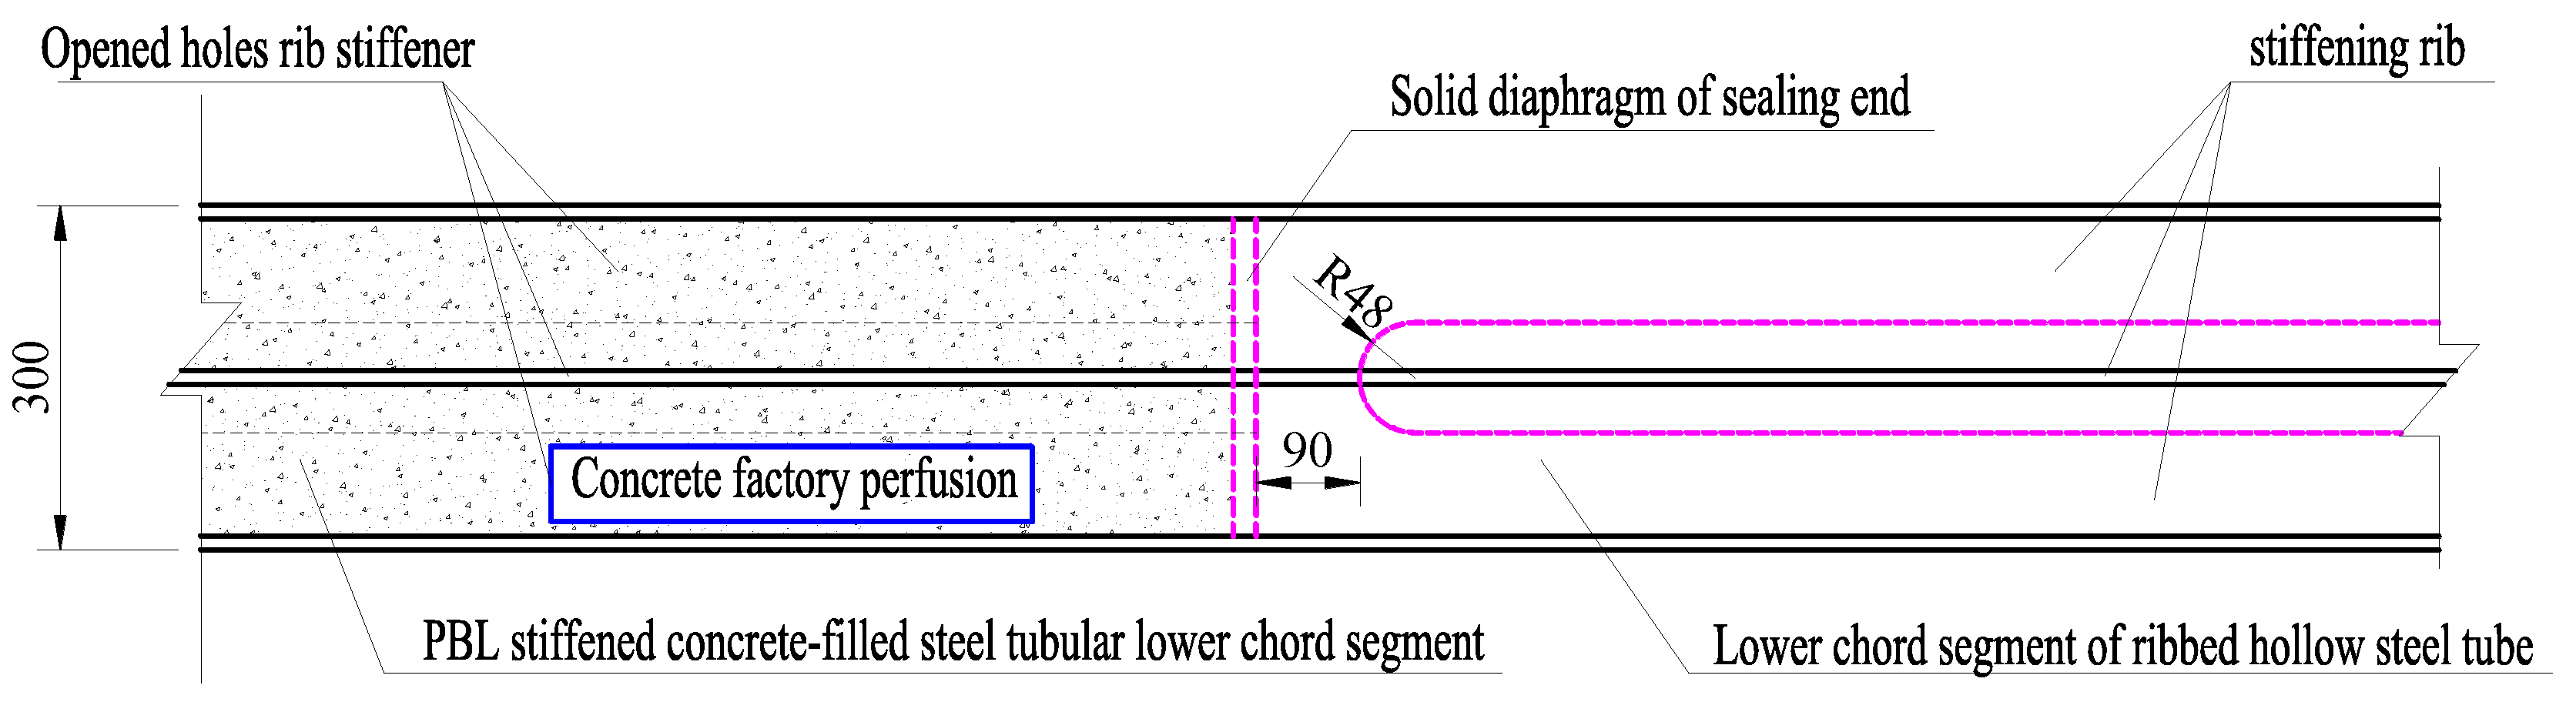
Figure 11.
The cross section of the main member of the bridge span(mm)(a)The upper chord;(b)Lower chord;(c)Hollow lower chord;(d)The web member.
Figure 11.
The cross section of the main member of the bridge span(mm)(a)The upper chord;(b)Lower chord;(c)Hollow lower chord;(d)The web member.
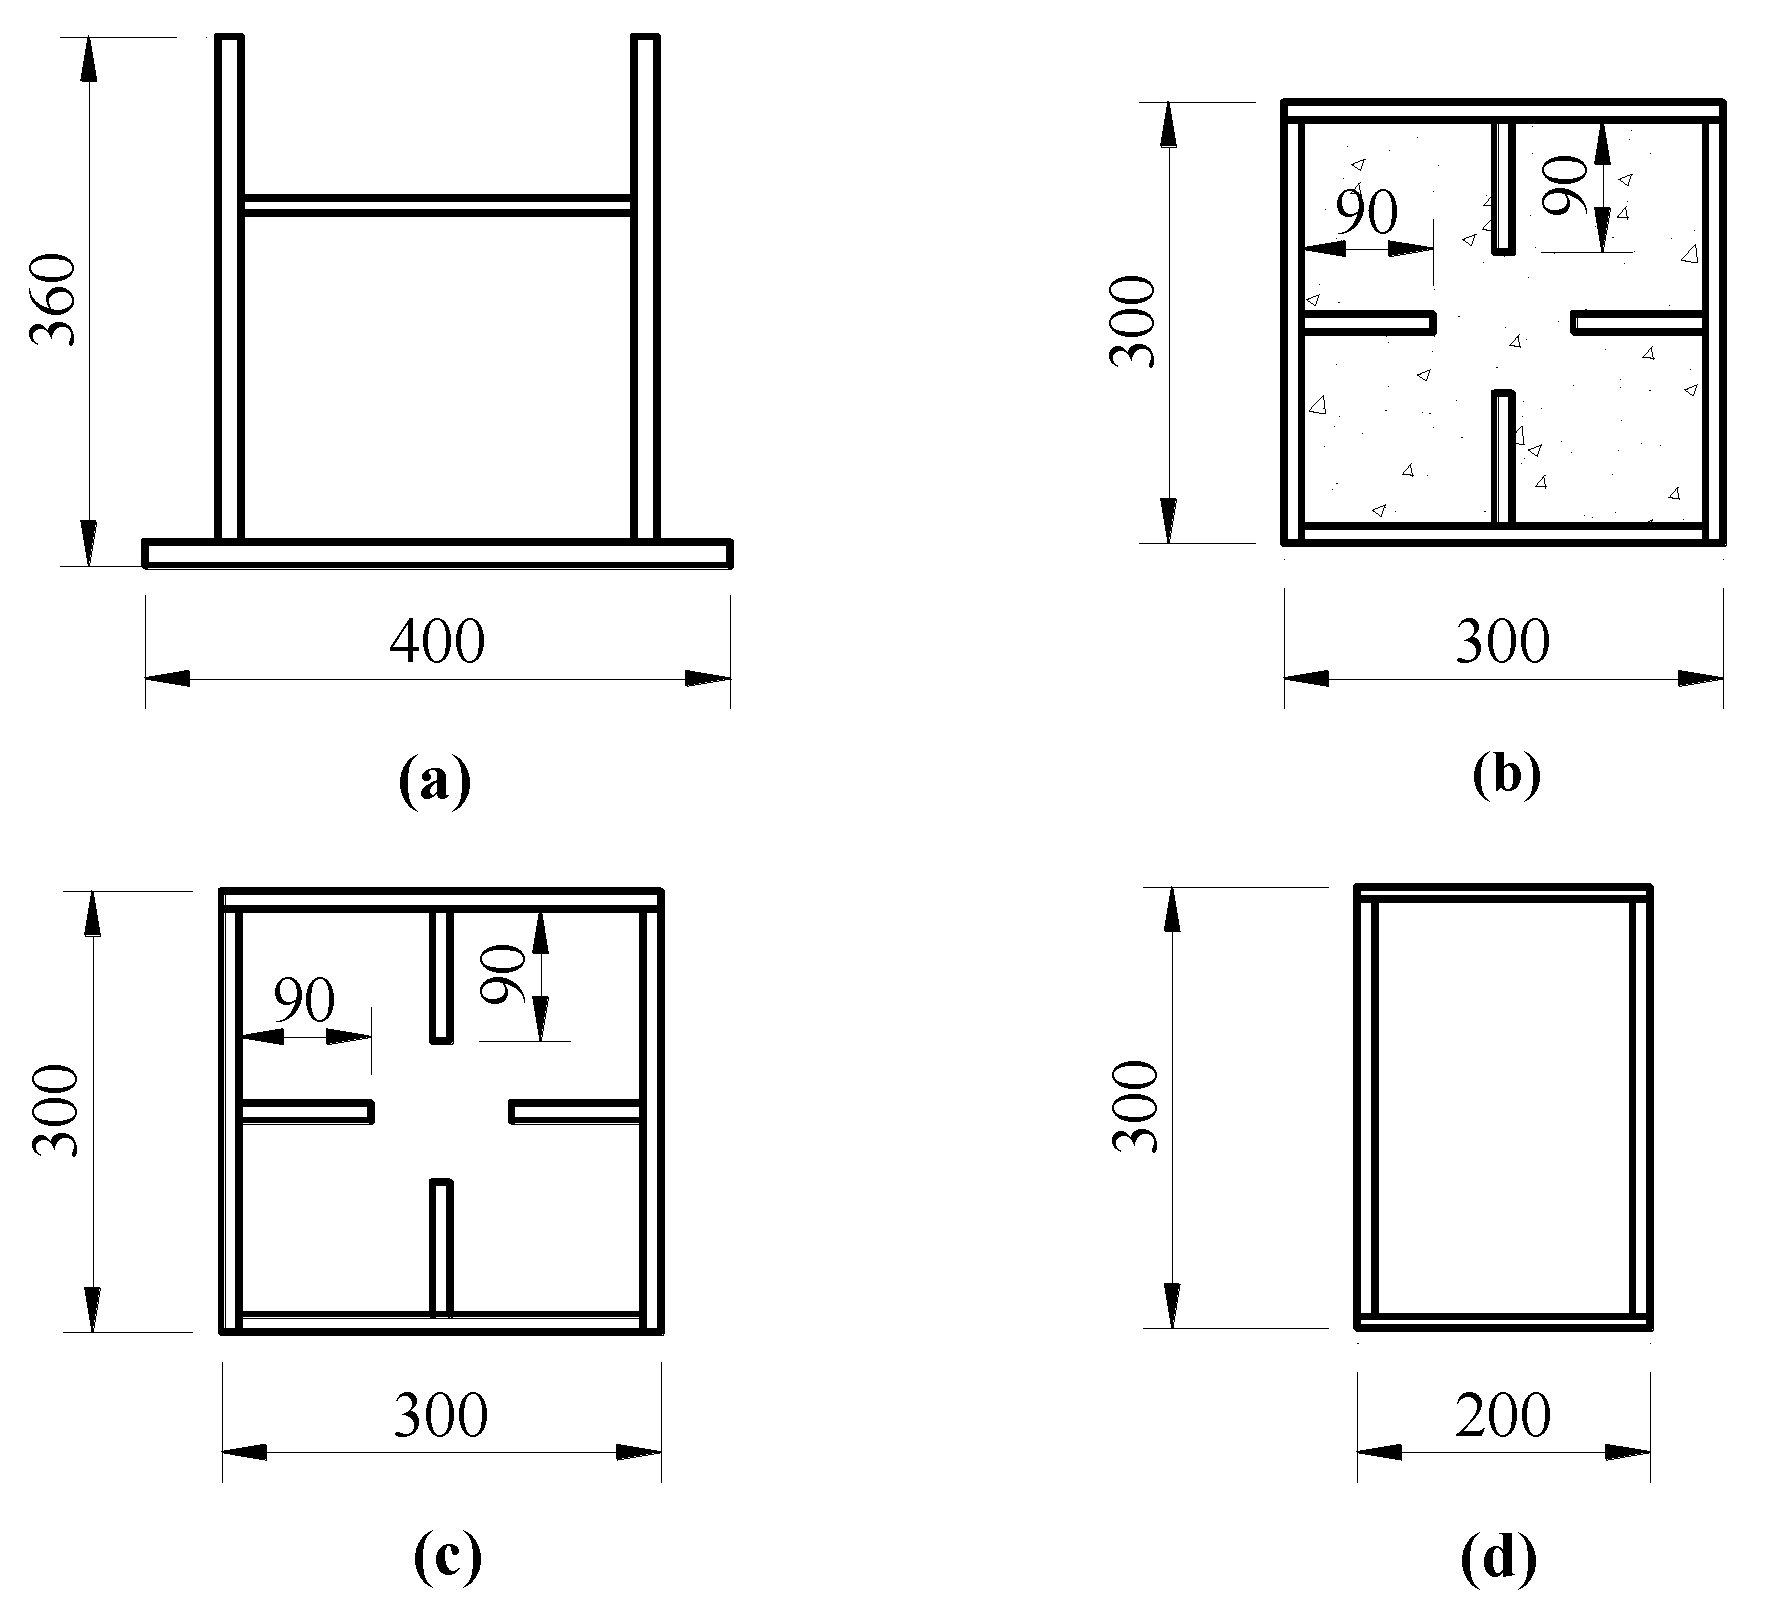
Figure 12.
ANSYS finite element model of composite truss bridge with partially concrete-filled rectangular steel tube members.
Figure 12.
ANSYS finite element model of composite truss bridge with partially concrete-filled rectangular steel tube members.
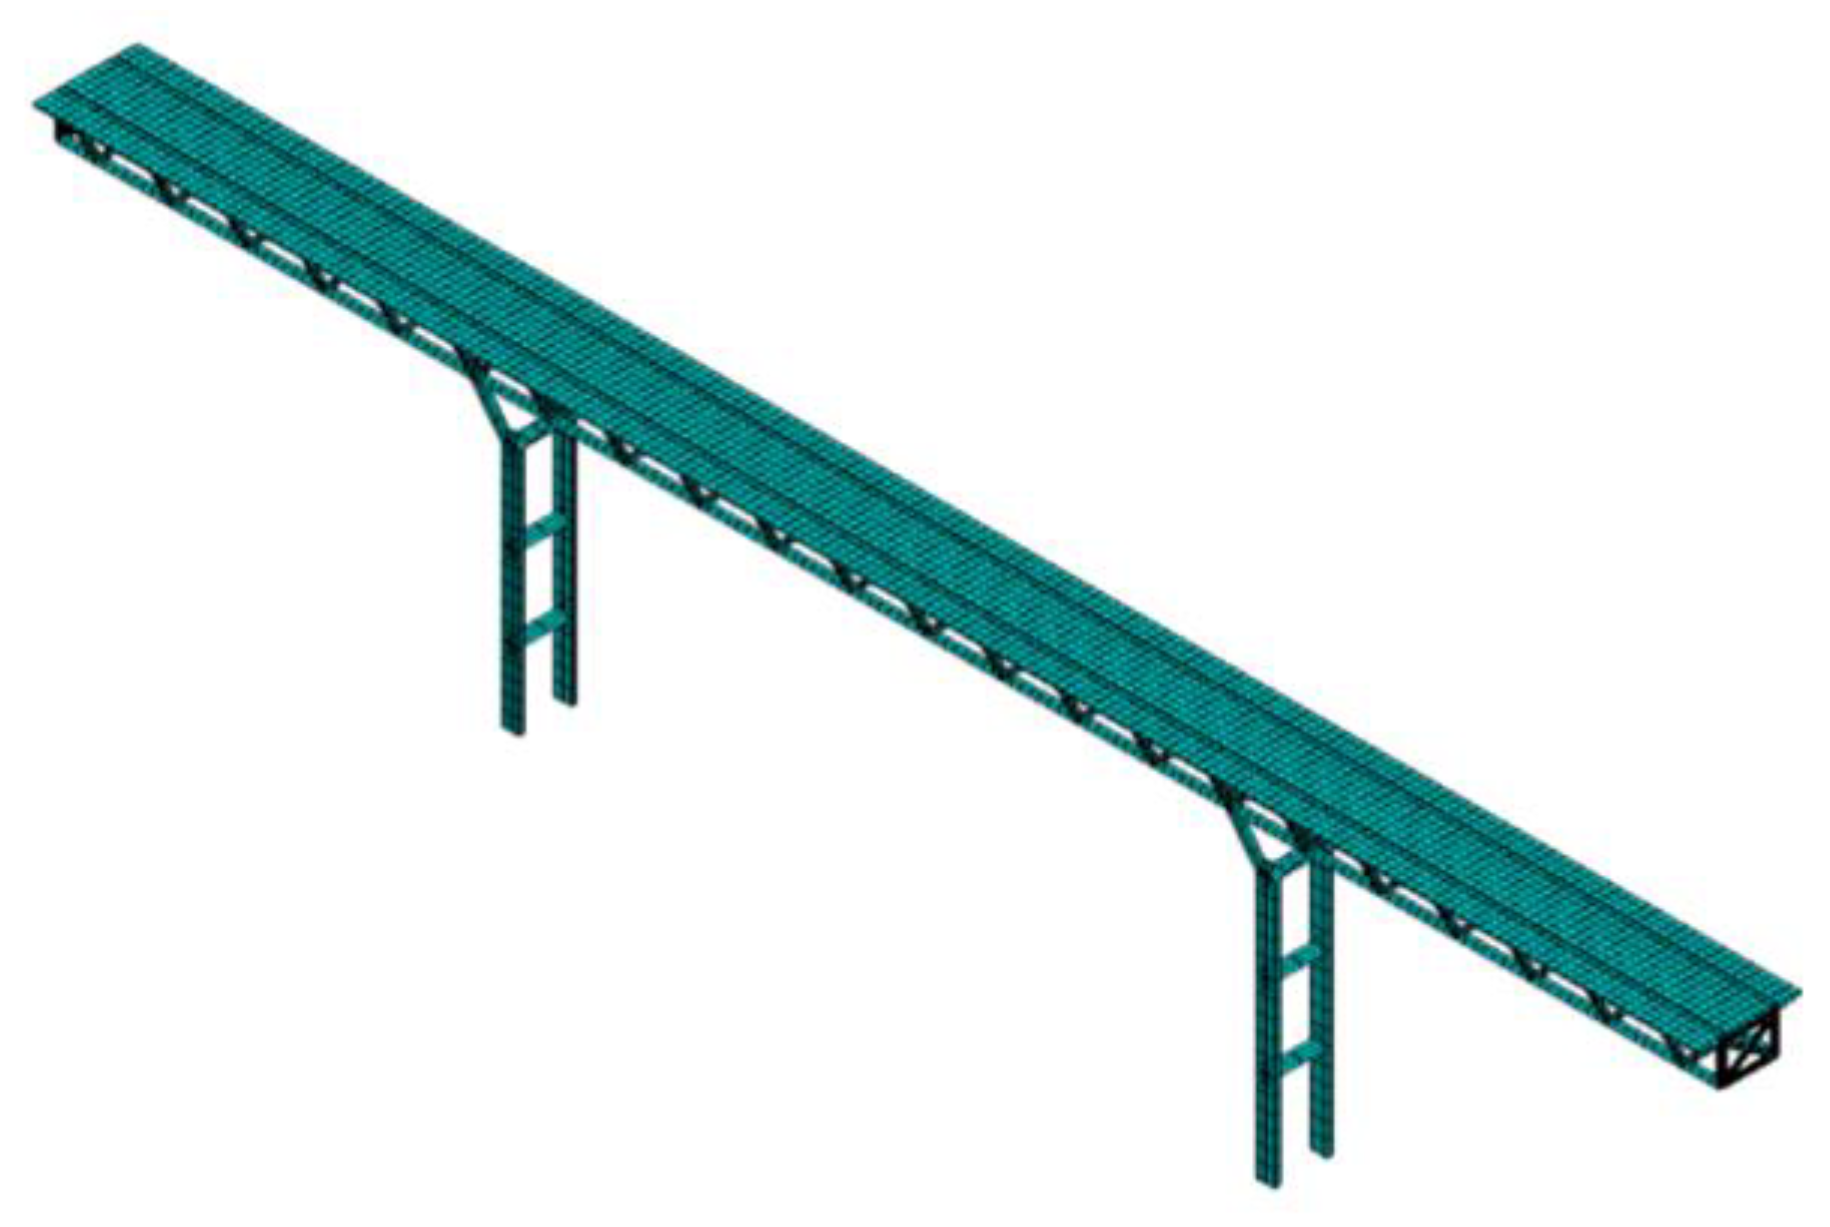
Figure 13.
Time history of vertical displacements of lower chords of main truss for the composite truss bridge under two working conditions(a) Partially concrete-filled(b) Non-filled.
Figure 13.
Time history of vertical displacements of lower chords of main truss for the composite truss bridge under two working conditions(a) Partially concrete-filled(b) Non-filled.
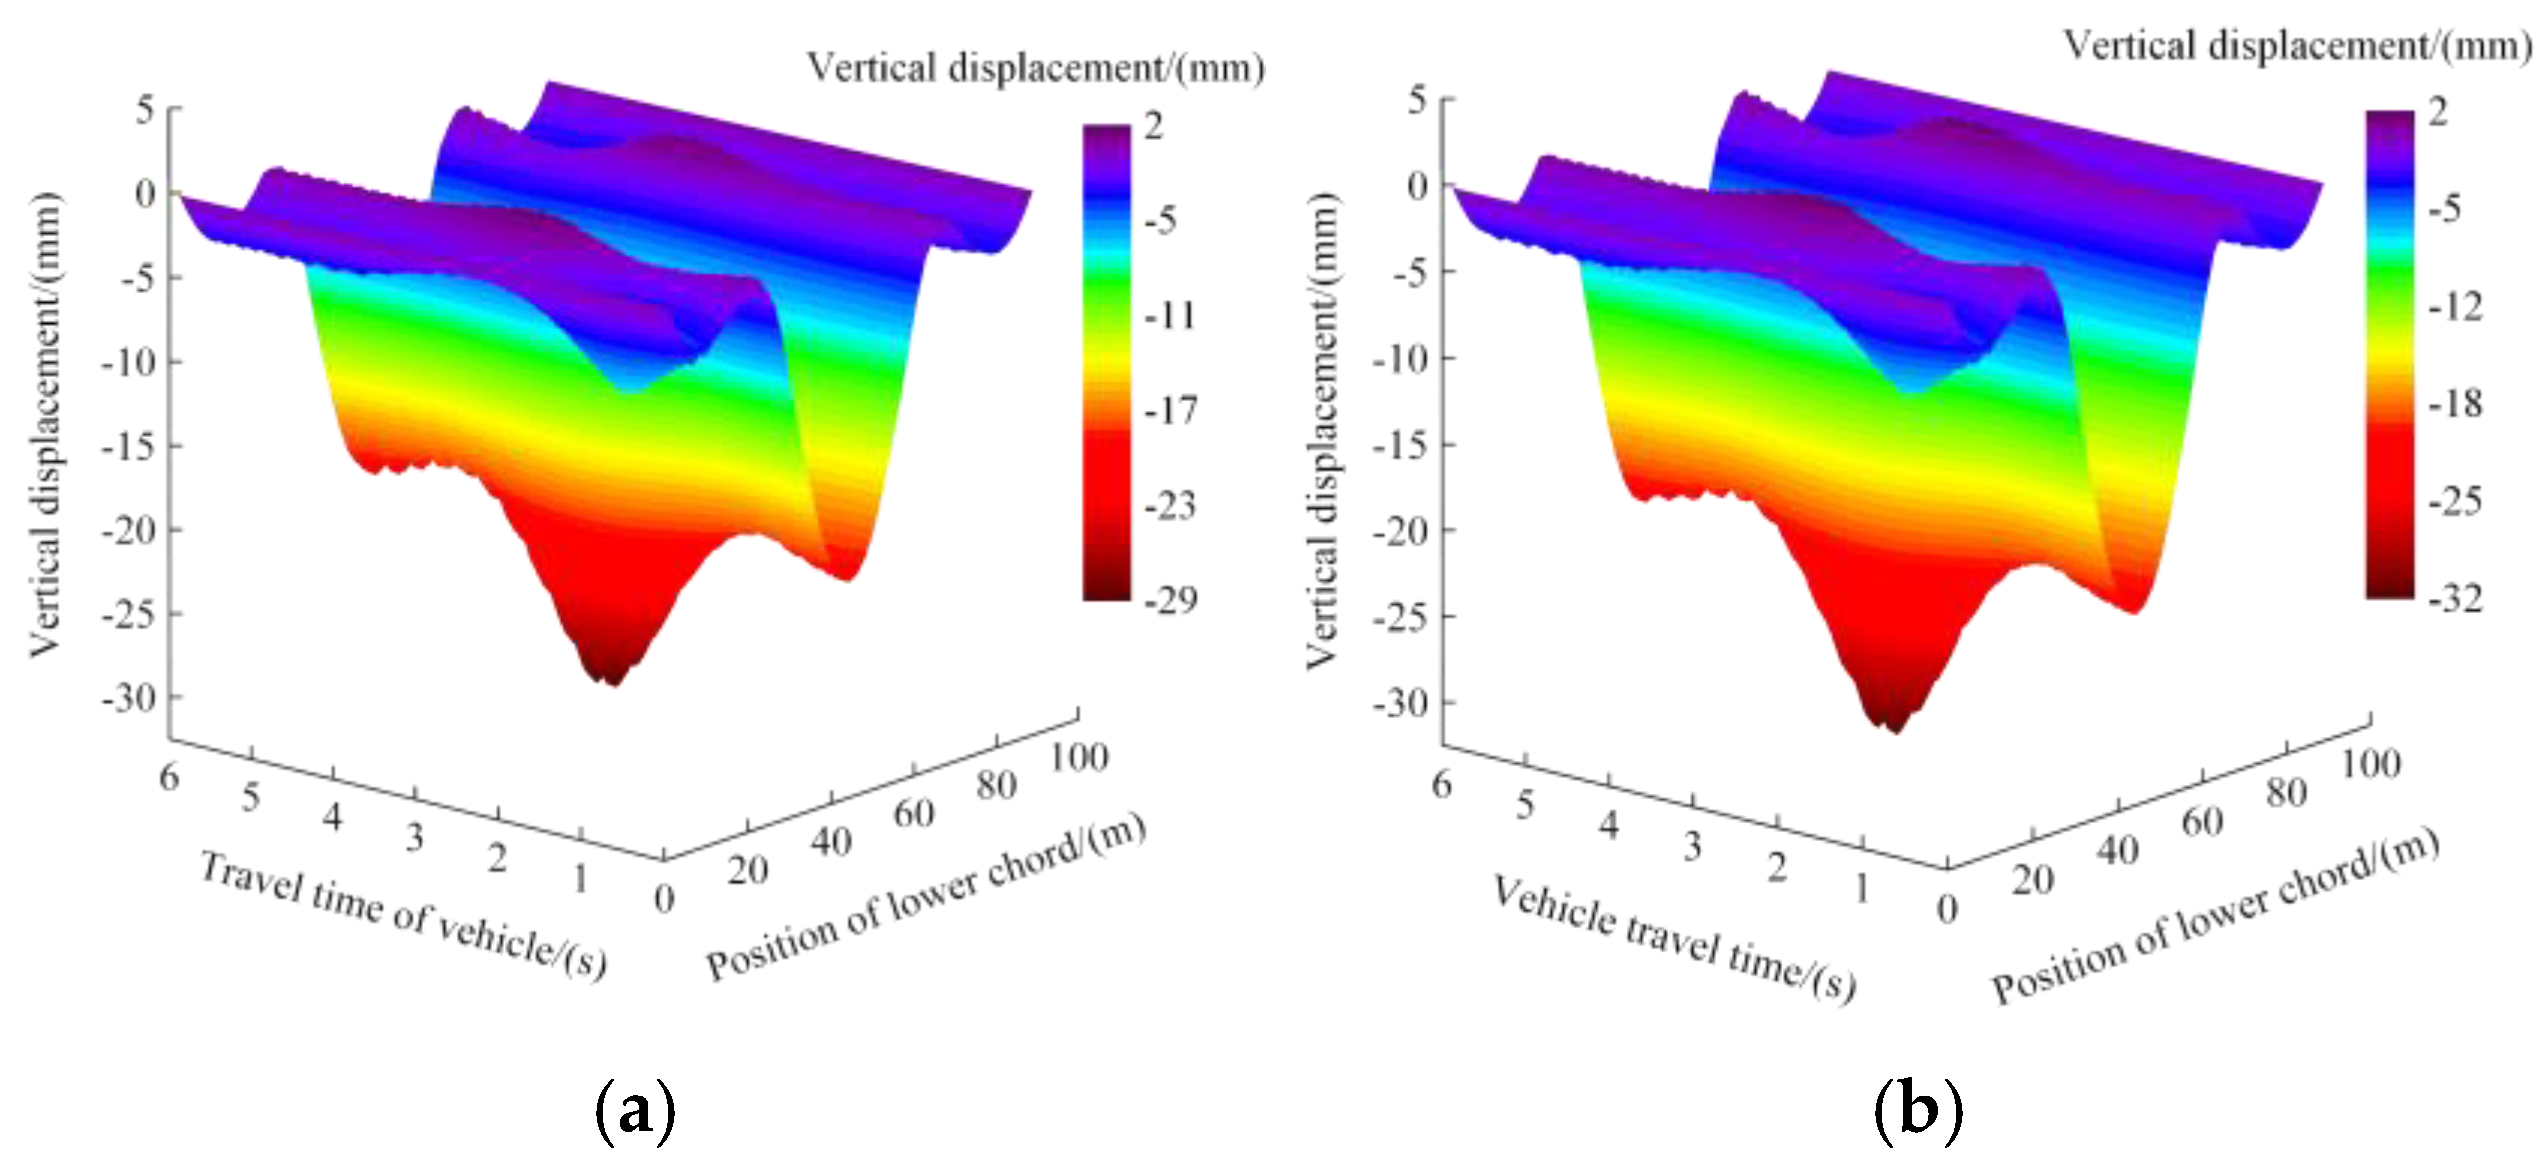
Figure 14.
Time history of axial forces of lower chords of main truss for the composite truss bridge under two working conditions (a) Partially concrete-filled; (b) Non-filled.
Figure 14.
Time history of axial forces of lower chords of main truss for the composite truss bridge under two working conditions (a) Partially concrete-filled; (b) Non-filled.
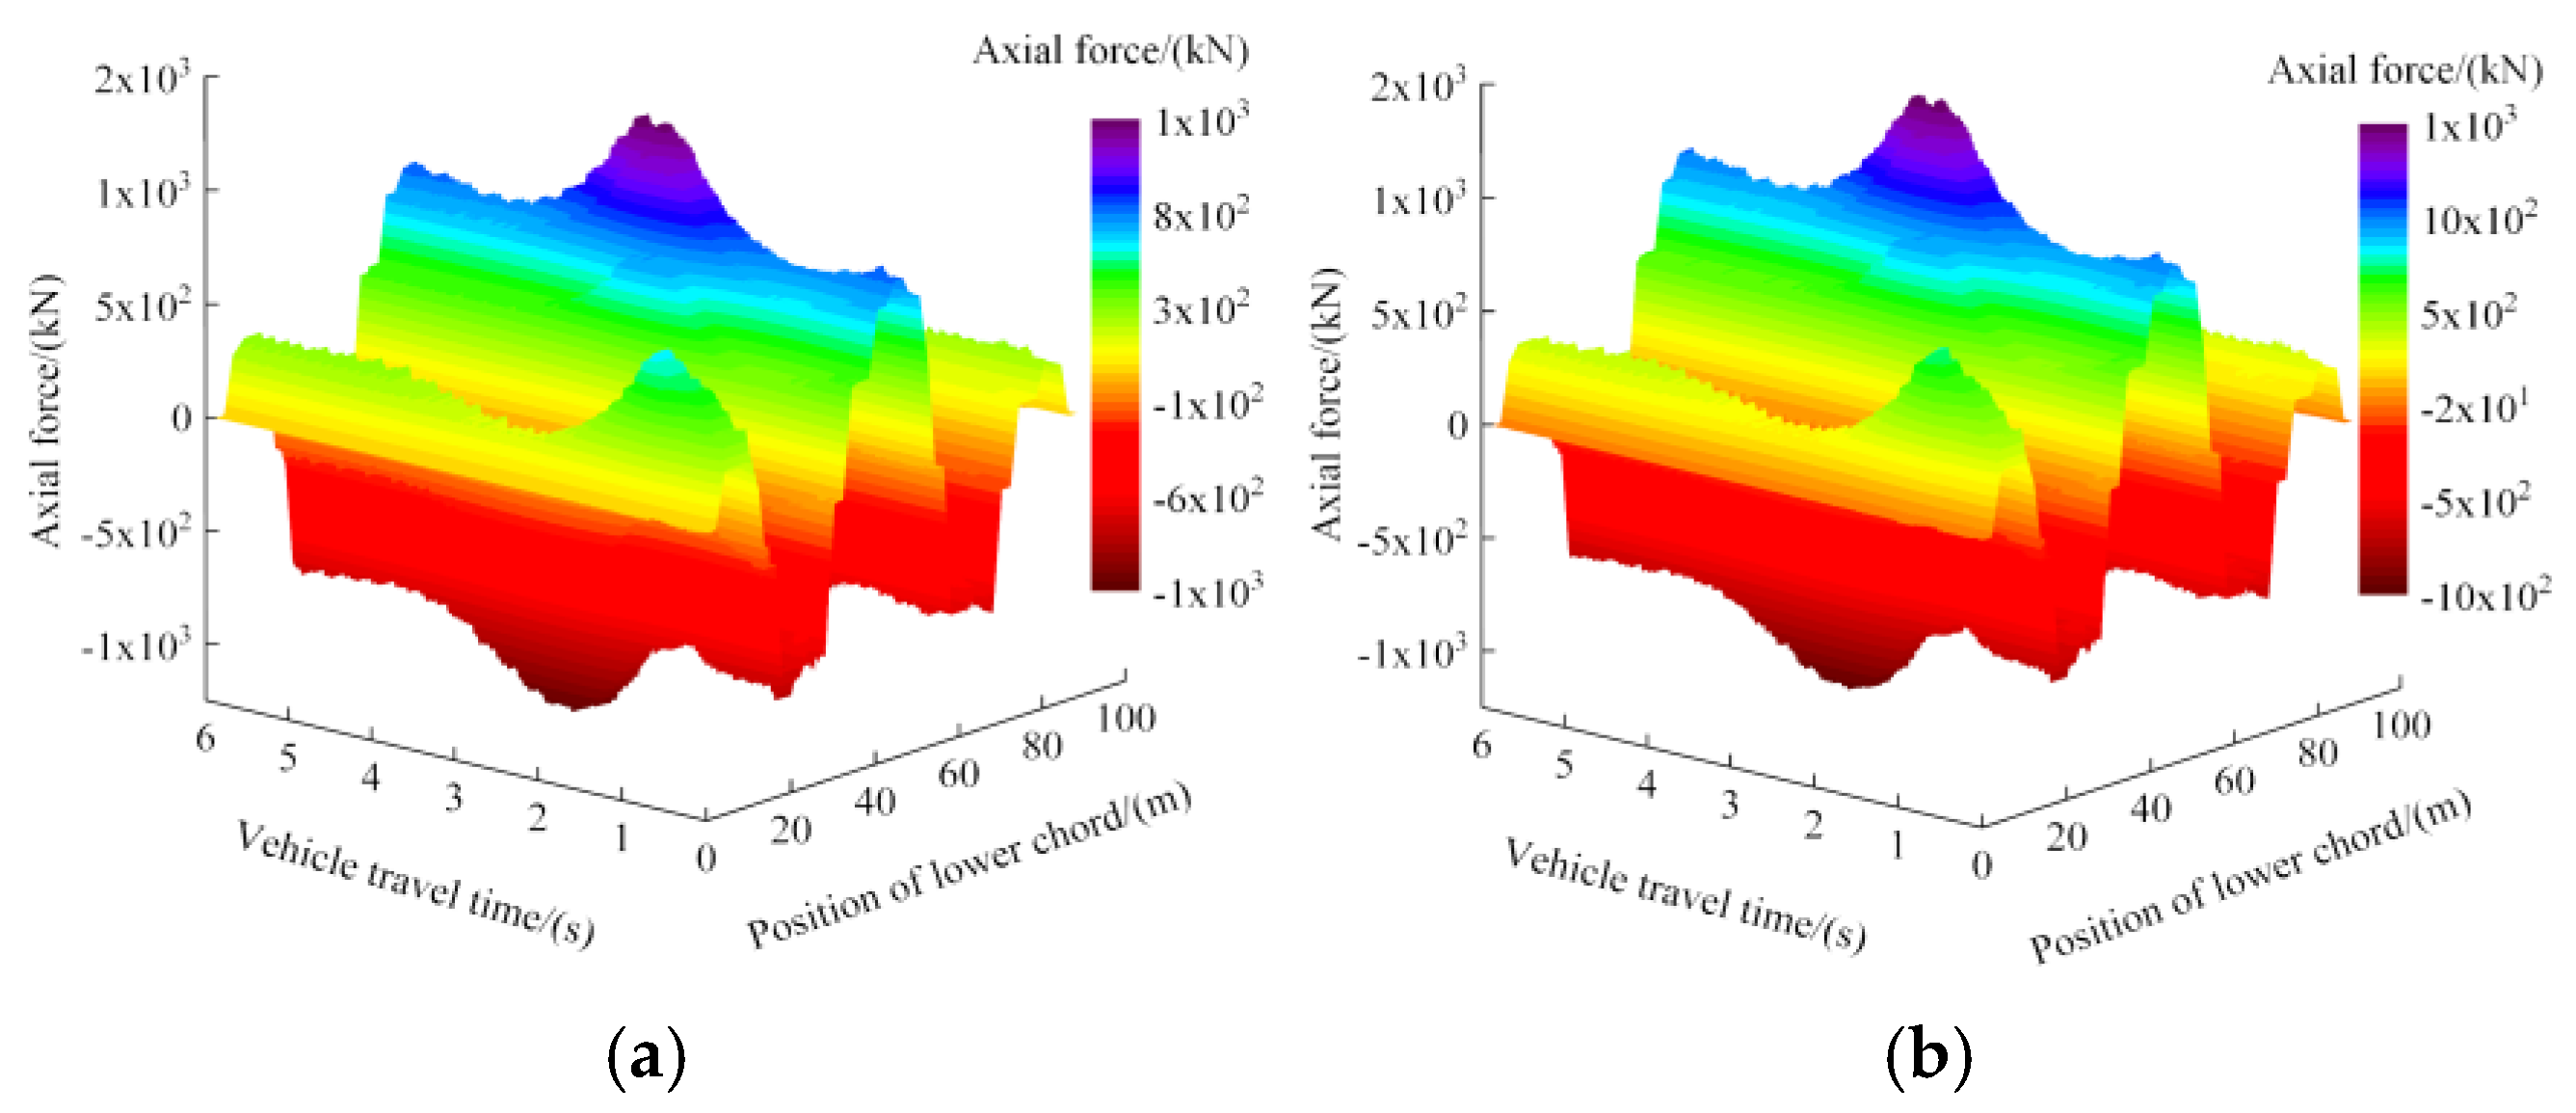
Figure 15.
Time history of vertical displacements of lower chords of main truss for the composite truss bridge under nine concrete filling coefficients(a)Midspan of middle-span(b)Midspan of side-span.
Figure 15.
Time history of vertical displacements of lower chords of main truss for the composite truss bridge under nine concrete filling coefficients(a)Midspan of middle-span(b)Midspan of side-span.
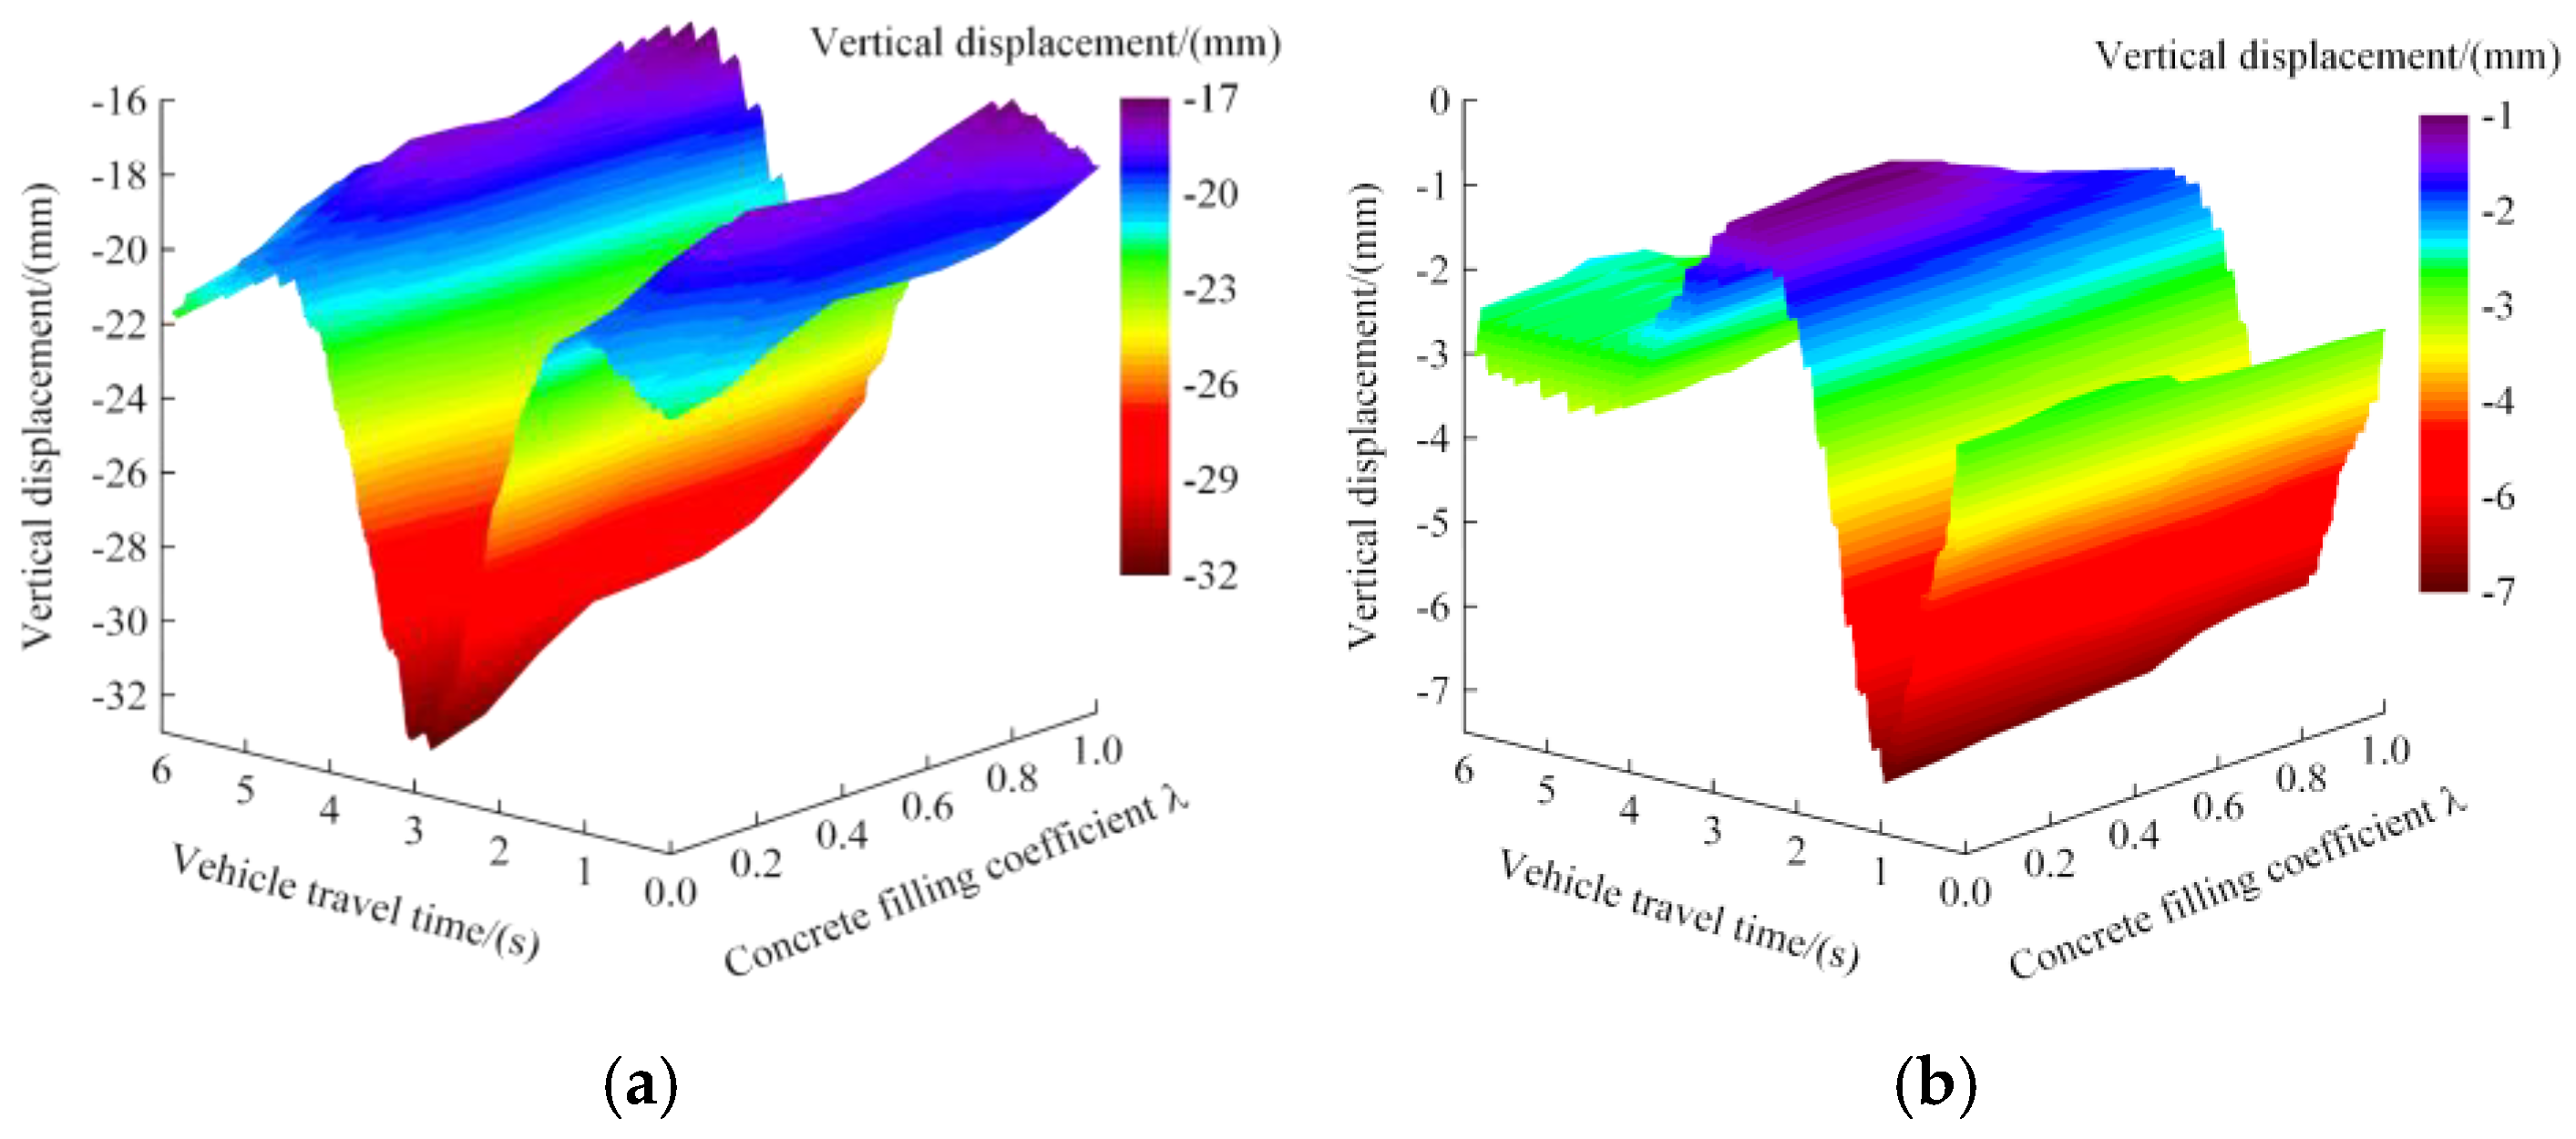
Figure 16.
Time history of axial forces of lower chords of main truss for the composite truss bridge under nine concrete filling coefficients(a)Midspan of middle-span(b)Midspan of side-span.
Figure 16.
Time history of axial forces of lower chords of main truss for the composite truss bridge under nine concrete filling coefficients(a)Midspan of middle-span(b)Midspan of side-span.
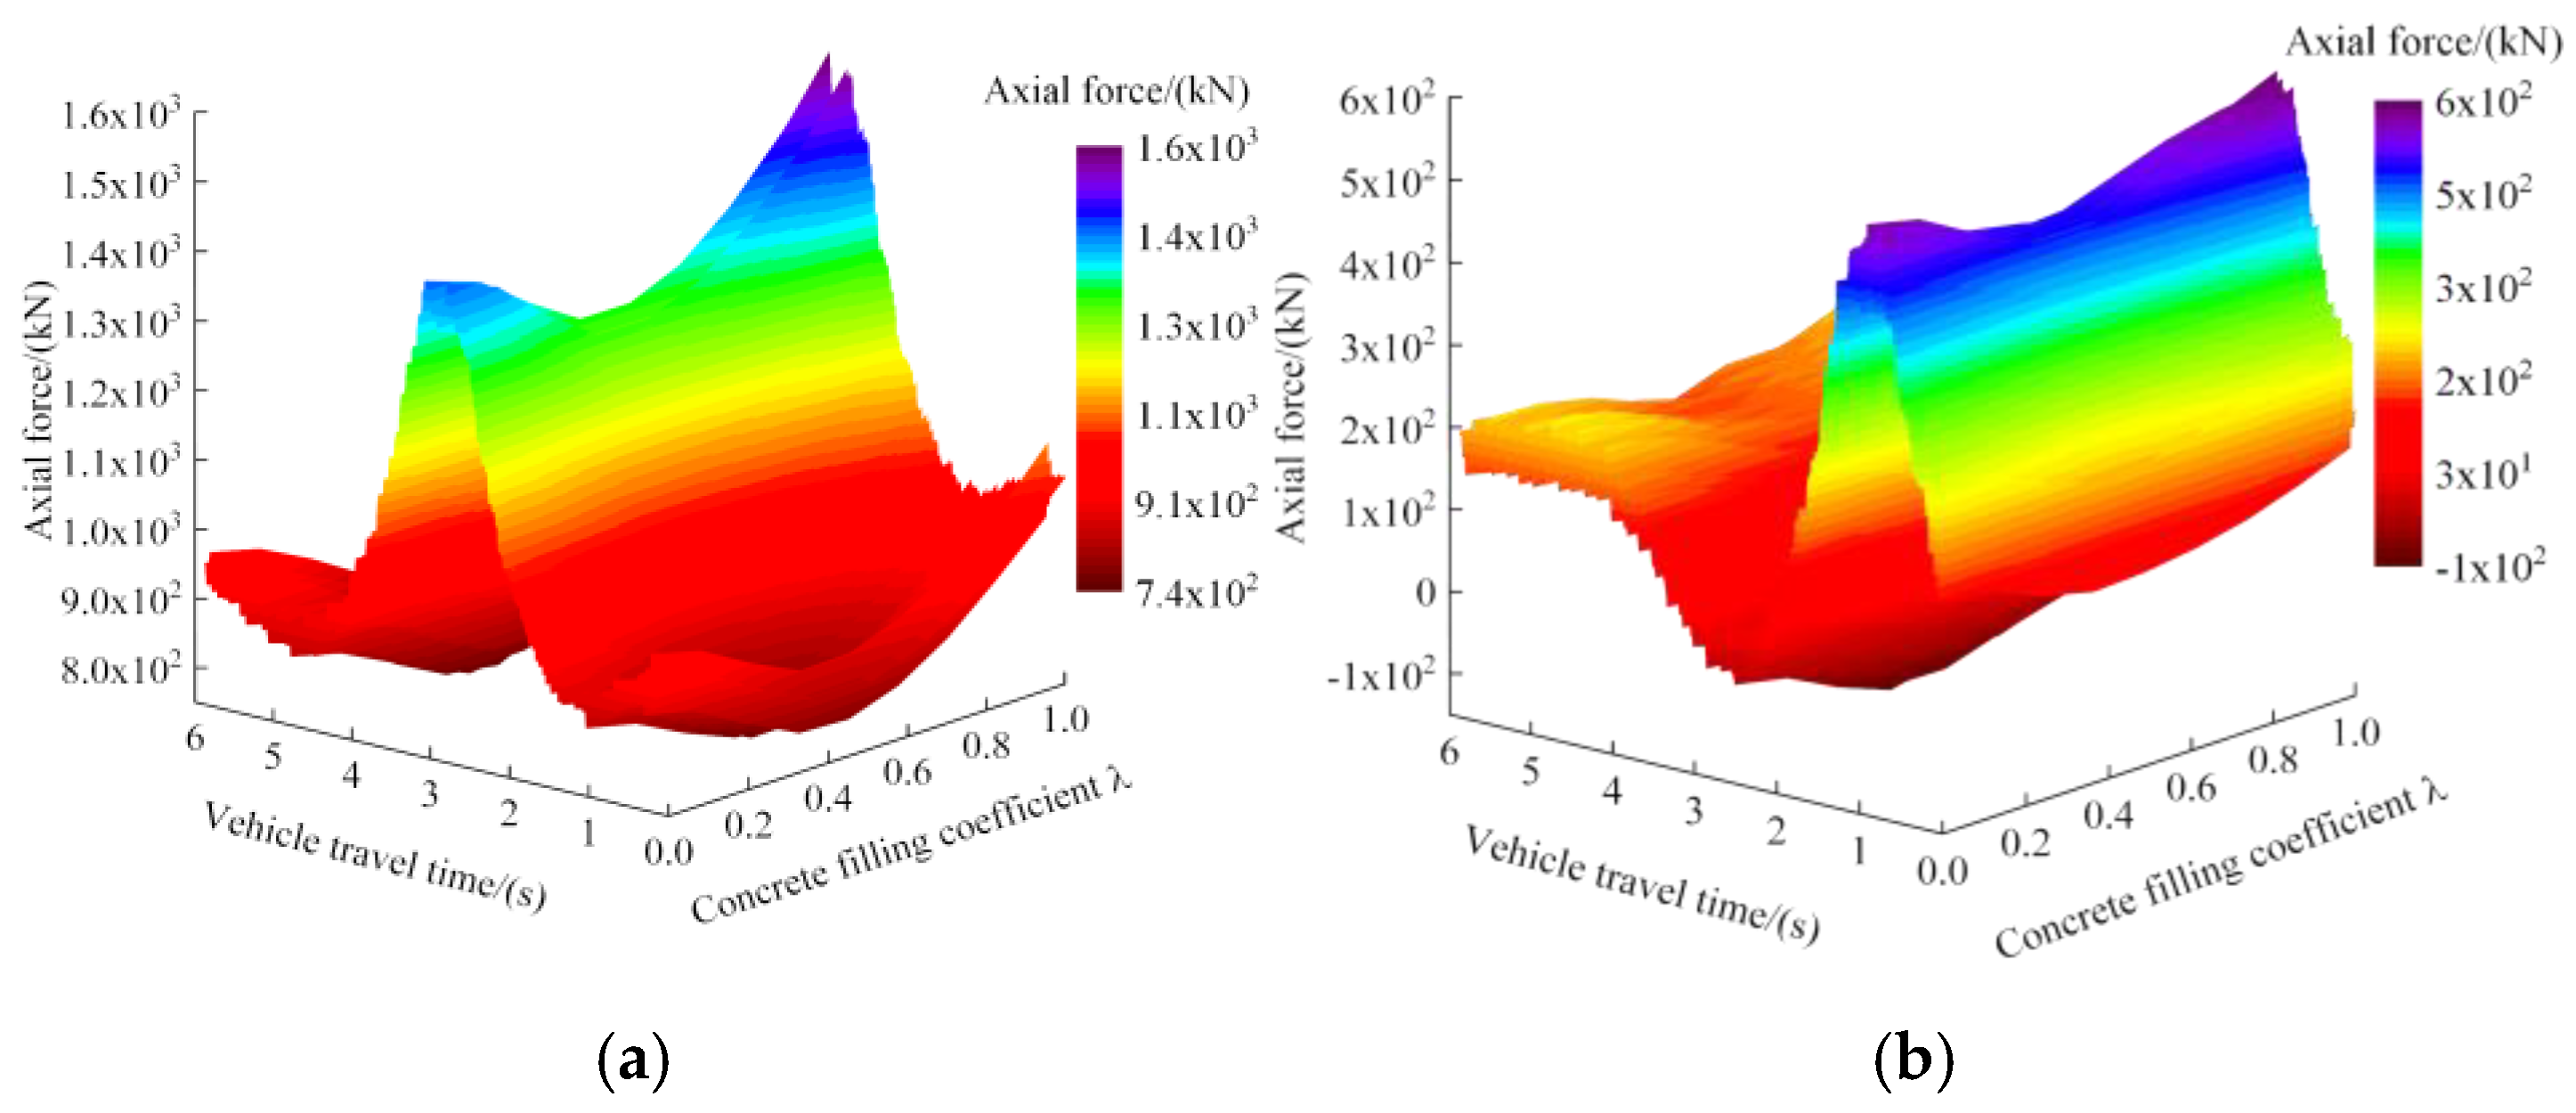
Figure 17.
The calculated values of impact coefficients of composite truss bridge under nine concrete filling coefficients(a)Deflection impact coefficient(b)Axial force impact coefficient.
Figure 17.
The calculated values of impact coefficients of composite truss bridge under nine concrete filling coefficients(a)Deflection impact coefficient(b)Axial force impact coefficient.
Figure 18.
Histogram of calculated values of impact coefficients of the bridge and fitting of extreme value distribution type-i.
Figure 18.
Histogram of calculated values of impact coefficients of the bridge and fitting of extreme value distribution type-i.
Figure 19.
Comparison of the impact coefficient values of five national specification under nine concrete filling coefficients.
Figure 19.
Comparison of the impact coefficient values of five national specification under nine concrete filling coefficients.

Table 1.
Element types and their options for components of the simplified vehicle model in ansys software.
Table 1.
Element types and their options for components of the simplified vehicle model in ansys software.
| Components of Vehicle | ANSYS element type | ANSYS element option |
|---|---|---|
| The vehicle body | MASS21 | KEYOPT(3)=0 |
| The wheel | MASS21 | KEYOPT(3)=2 |
| The suspension and wheel tire | COMBIN14 | KEYOPT(2)=2 |
| Rigid beam | MPC184 | KEYOPT(1)=1 |
Table 2.
Technical parameters of the two-axle vehicle.
| Technical parameters | Value |
|---|---|
| Mass of vehicle body /kg | 38500 |
| Rotational inertia /kg⸱m2 | 2446000 |
| Rotational inertia /kg⸱m2 | 1223000 |
| Mass of wheel /kg | 2165 |
| Tire stiffness /N⸱m-1 | 2140000 |
| Tire damping /kg⸱s-1 | 49000 |
| Suspension stiffness /N⸱m-1 | 1267500 |
| Suspension damping /kg⸱s-1 | 98000 |
| Wheel base /m | 8.4 |
| wheel track /m | 3.0 |
Table 3.
The maximum dynamic response of lower chords under two working conditions for composite truss bridge with rectangular steel tube members.
Table 3.
The maximum dynamic response of lower chords under two working conditions for composite truss bridge with rectangular steel tube members.
| Dynamic response | Partially concrete-filled | Non-filled |
|---|---|---|
| Vertical displacement/mm | -29.29 | -31.77 |
| Axial force/kN | 1 317.59 | 1 436.24 |
Table 4.
Dynamic increments of lower chords for composite truss bridge with rectangular steel tube members under two working conditions.
Table 4.
Dynamic increments of lower chords for composite truss bridge with rectangular steel tube members under two working conditions.
| Dynamic parameters | Partially concrete-filled | Non-filled | |
|---|---|---|---|
| Midspan of midddle-span | Increment of vertical displacement/mm |
-0.46 | -0.52 |
| Increment of axial force/kN | 41.93 | 46.80 | |
| Midspan of side-span | Increment of vertical isplacement/mm | -0.41 | -0.43 |
| Increment of axial force/kN | 57.85 | 58.58 | |
Table 5.
Concrete-filled segment length under nine concrete filling coefficients.
| Concrete-filled segment length/m | ||
| 0 | 0 | 0 |
| 0.125 | 2.5 | 3.0 |
| 0.216 | 2.5 | 7.0 |
| 0.352 | 2.5 | 13.0 |
| 0.489 | 2.5 | 19.0 |
| 0.625 | 2.5 | 25.0 |
| 0.761 | 2.5 | 31.0 |
| 0.852 | 2.5 | 35.0 |
| 1 | 2.5 | 41.5 |
Table 6.
Maximum dynamic response of lower chords of main truss for the composite truss bridge under nine different concrete filling coefficients.
Table 6.
Maximum dynamic response of lower chords of main truss for the composite truss bridge under nine different concrete filling coefficients.
| λ | Midspan of the middle-span | Midspan of the side-span | ||
|
Vertical displacement/ mm |
Axial force/kN | Vertical displacement/mm | Axial force/kN | |
| 0 | -31.77 | 1 436.24 | -6.91 | 561.26 |
| 0.125 | -31.27 | 1 411.08 | -6.86 | 547.60 |
| 0.216 | -30.43 | 1 374.70 | -6.78 | 520.56 |
| 0.352 | -29.29 | 1 317.59 | -6.76 | 505.30 |
| 0.489 | -29.11 | 1 311.89 | -6.68 | 494.17 |
| 0.625 | -28.99 | 1 346.27 | -6.63 | 518.68 |
| 0.761 | -28.45 | 1 413.48 | -6.30 | 542.53 |
| 0.852 | -27.79 | 1 470.96 | -6.25 | 555.55 |
| 1 | -26.33 | 1 588.02 | -6.19 | 589.54 |
Table 7.
Statistical parameters of impact coefficient of composite truss bridge.
| Statistical parameters | Value |
|---|---|
| Mean value | 0.114 |
| Standard deviation | 0.058 |
Table 8.
Impact coefficient values of chinese specification under nine concrete filling coefficients.
Table 8.
Impact coefficient values of chinese specification under nine concrete filling coefficients.
| Concrete filling coefficient | Fundamental frequency of bridge | Value of impact coefficient |
|---|---|---|
| 0 | 3.21 | 0.19 |
| 0.13 | 3.23 | 0.19 |
| 0.22 | 3.26 | 0.19 |
| 0.35 | 3.31 | 0.20 |
| 0.49 | 3.35 | 0.20 |
| 0.63 | 3.39 | 0.20 |
| 0.76 | 3.45 | 0.20 |
| 0.85 | 3.50 | 0.21 |
| 1 | 3.58 | 0.21 |
Disclaimer/Publisher’s Note: The statements, opinions and data contained in all publications are solely those of the individual author(s) and contributor(s) and not of MDPI and/or the editor(s). MDPI and/or the editor(s) disclaim responsibility for any injury to people or property resulting from any ideas, methods, instructions or products referred to in the content. |
© 2025 by the authors. Licensee MDPI, Basel, Switzerland. This article is an open access article distributed under the terms and conditions of the Creative Commons Attribution (CC BY) license (http://creativecommons.org/licenses/by/4.0/).
Copyright: This open access article is published under a Creative Commons CC BY 4.0 license, which permit the free download, distribution, and reuse, provided that the author and preprint are cited in any reuse.


