
Submitted:
23 April 2025
Posted:
27 April 2025
You are already at the latest version
Abstract
As an important aquaculture species, the marine snail Babylonia areolate is frequently subjected to fluctuation in dissolved oxygen concentration during farming and transportation processes. In the present study, we measured the oxygen consumption rate, ammonia excretion rate, metabolic enzyme activities, immune enzyme activities, as well as changes in gene expression of these enzymes under long-term stress (144 hours) on B. areolate at two hypoxia levels (2.0 and 0.5 mg O2/L). The findings indicated that the mortality rate of juvenile B. areolate was higher in the 0.5 mg O2/L group compared to the 2 mg O2/L group. During the hypoxic stress period, both oxygen consumption and ammonia excretion rates were observed to be lower in juvenile B. areolate than those in the control group. The group exposed to 0.5 mg O2/L exhibited lower oxygen consumption and ammonia excretion rates compared to the group exposed to 2 mg O2/L at most measurement time points. As stress duration prolonged, juvenile B. areolate demonstrated significantly elevated activities of PK and ACP, alongside reduced activities of LDH, ACP, and SOD. The expression levels of PK and LDH genes in juvenile B. areolate were significantly reduced during the early stages of hypoxic stress; however, a significant increase was observed in the later stages. The expression levels of ACP and AKP genes were significantly downregulated, while juvenile B. areolate exhibited elevated SOD gene expression levels under 0.5 mg O2/L. The results indicated that B. areolate may respond to hypoxic stress by reducing its metabolic rate and modulating the expression of metabolism-related enzymes. Furthermore, hypoxic stress was found to significantly impact the antioxidant capacity and immune function of B. areolate. Notably, the mortality rate of B. areolate can be substantially decreased by ensuring that transportation time does not exceed 48 hours.
Keywords:
hypoxia
; Babylonia areolate
; metabolic rates
; enzyme activities
; gene expression
1. Introduction
Dissolved oxygen (DO) is a critical environmental factor for most aquatic organisms. However, since the mid-20th century, the oxygen content in the ocean has decreased by approximately 2% [1]. The prevalence of hypoxic (<2 mg/L) and anoxic conditions in coastal and estuarine regions has risen since the mid-1900s. The formation of dead zones resulting from dissolved oxygen depletion in coastal waters poses significant consequences for the functioning of marine ecosystems [2].Marine shellfish primarily inhabit estuaries and coastal waters, where they are subjected to periodic fluctuations in dissolved oxygen concentrations due to natural factors. Additionally, they face low-oxygen environmental stresses resulting from global climate change and anthropogenic activities throughout their life cycle [3]. Many marine shellfish serve as significant aquaculture species. During the processes of farming and transportation, these organisms frequently encounter low-oxygen environments caused by high farming densities, degradation of substrate conditions, and transport without water.
In order to enhance the chances of survival in hypoxic or anoxic environments, marine organisms utilize a variety of coping strategies, among which metabolic regulation is a crucial mechanism for adapting to low-oxygen conditions [4]. The response pattern of respiratory metabolism under hypoxic conditions reflects the tolerance and adaptability of shellfish to such environments. A number of studies have investigated the effects of hypoxia stress on the respiratory metabolism of various marine shellfish, including the scallop Pecten maximus [4], the mussel Mytilus edulis [5,6], the oyster Crassostrea virginica [3], the thick-shelled mussel M. coruscus [7], and the snail Busycon contrarium [8]. The studies have demonstrated that marine shellfish can delay the depletion of stored energy reserves by adjusting their metabolic patterns and reducing metabolic rates, thereby aiding in the maintenance of energy homeostasis and survival under hypoxic conditions [4,9,10]. Energy metabolism requires the involvement of cellular metabolic enzymes. Research has indicated that shellfish can respond to hypoxic stress by modulating the expression of enzymes associated with glycolysis and anaerobic metabolism, such as lactate dehydrogenase (LDH) and pyruvate kinase (PK) [10,11,12]. In response to hypoxic stress, marine organisms typically prioritize their limited energy resources for sustaining essential life activities. This prioritization may impact immune functions, including both the activity and expression of lysosomal enzymes and antioxidant enzymes [7,10].
Babylonia areolate is mainly distributed in southeastern Asia, including Thailand, Vietnam, Malaysia, and the coastal zone of southern China. Because of its fast growth rate and rich unsaturated fatty acids content, it has become one of the major aquaculture shellfish species in the coastal areas of southern China, with an annual production value of 450 million - 550 million US dollars [13]. The farming of B. areolate requires the maintenance of a high DO level (>6 mg/L) [14]. However, under high-density farming conditions, dissolved oxygen in water is easily depleted, resulting in hypoxic stress. Combined with environmental changes such as elevated temperatures, dissolved oxygen (DO) levels can decrease by more than 90%, leading to significant mortality rates. Furthermore, B. areolate is likely to encounter hypoxic conditions during long-distance transportation. However, there is a lack of comprehensive studies examining the effects of hypoxic stress on the respiratory metabolism and immune function of B. areolate. To investigate the inherent responses of B. areolate to prolonged hypoxia, we analyzed the metabolic rates, associated enzyme activities, and gene expression levels in juvenile B. areolate under two different hypoxic conditions. This study offers valuable insights into the metabolic and immune responses to hypoxia in marine molluscs.
2. Materials and Methods
2.1. Experimental Snails
The snails were sourced from a B. areolate farm located in Qionghai City, Hainan Province, China, and were transported to the laboratory using a low-temperature incubator set at 4 - 10 ºC for acclimation in a 400 L tank. The bottom of the tank was covered with approximately 7 cm of fine sand. During the acclimation period, the snails were fed trash fish at about 30% of their total body mass daily. To prevent deterioration of water quality, 50% of the water was replaced and food residues were removed within one hour after feeding. The water temperature was maintained at 28 ± 1 ºC, with salinity levels at 28 and pH measured at 8.1. Seawater aeration was implemented to ensure that dissolved oxygen (DO) levels remained above or equal to 7.5 mg/L. After an acclimation period of thirty days, snails with similar sizes (shell height: 19.89 ± 1.36 mm; wet weight: 1.58 ± 0.37 g) were selected for the experiment.
2.2. Hypoxic Stress and Sample Collection
The experiment was conducted using nine plastic drums (diameter: 39 cm, height: 55 cm), with seawater filtered through a sand filtration system. A total of 540 snails were evenly distributed into three groups, each consisting of three replicates. The dissolved oxygen (DO) level was gradually adjusted to 2.0 mg/L within half an hour and subsequently to 0.5 mg/L within one hour by means of nitrogen bubbling. The fluctuation range of DO was maintained within ±0.1 mg/L. For the control group, the DO level was sustained at 7.5 mg/L throughout the experiment. The time at which the DO level reached the predetermined value was recorded as 0 hours, and the entire duration of the experiment spanned 144 hours. To mitigate any deterioration in water quality, seawater changes were performed every 72 hours; additionally, replaced seawater was pre-adjusted to match the experimental DO levels prior to introduction into the drums. Dead individuals were examined and removed every 24 hours. The dead state was defined as the absence of response to gentle pulling of the operculum with forceps, lack of contraction in the respiratory tube and ventral pedicle upon touch, or a distinct odor. Every 24 hours, four snails were collected from each replicate drum and placed into respiration chambers for metabolic rate determination. Simultaneously, two snails were taken from each replicate, and whole tissue samples were obtained and stored in a refrigerator at -80 ºC for subsequent enzyme activity and gene expression analyses.
2.3. Metabolic Rates Measurement
Oxygen consumption rate was measured in a glass respiration chamber with a volume of 0.56 L. The DO concentration was assessed using a Leici JPBJ-609L oxygen meter equipped with a DO-968-HC oxygen electrode. For each DO level, three replicates and one blank control were established. Juvenile snails were placed in a mesh bag and suspended in the respiration chamber to ensure their activities remained unaffected. A magnetic rotor was employed to achieve thorough mixing of the seawater within the chamber. The respiration chambers were sealed with rubber stoppers after being connected to the oxygen meter, allowing for continuous monitoring of DO concentrations over time. Measurements lasted for 1 hour, during which readings were recorded at 5-minute intervals, resulting in a total of 12 recordings per measurement session. Each measurement was conducted in triplicate, while an additional chamber without snails served as the blank control. At the conclusion of the experiment, water samples from the respiration chambers were collected for ammonia concentration analysis, which was performed using the phenol-hypochlorite method [15]. Additionally, the wet mass of snails contained within each respiration chamber was recorded.
The oxygen concentration was plotted as a function of time and represented by a linear regression line. The oxygen consumption rate (mg O2/g/h) was calculated using the formula: R = b × V / W, where b is the slope of the regression line, V is the water volume in respiration chamber (L), W is the wet mass of snails in respiration chamber (g). The ammonia excretion rate (μg/g/h) was determined using the equation: E = (Nt − N0) × V ÷ (m × t), where Nt and N0 are the NH4+-N concentrations in the experimental chamber and blank control chamber, respectively, at the end of the experiment (μg/L), V is the water volume in respiration chamber (L), W is the wet mass of snails in respiration chamber (g), t is the experiment duration (h).
2.4. Assay of Metabolic and Immune Enzymatic Activities
The tissue samples extracted from juvenile snails in each group were homogenized in an ice bath using 0.01 M phosphate-buffered saline (PBS, pH 7.4). The homogenates were then centrifuged at 12,000 r/min for 10 minutes at 4 ℃ to obtain the supernatants, which were stored in the same buffer at 4 ℃ for subsequent enzymatic activity analyses. The activities of pyruvate kinase (PK), lactate dehydrogenase (LDH), acid phosphatase (ACP), alkaline phosphatase (AKP), total superoxide dismutase (SOD) activity, and total protein (TP) content were measured using a microplate reader (SPARK 10M, Grodig, Austria) with assay kits provided by Suzhou Grace Biotechnology Co., Ltd., China, following the manufacturer’s instructions. All results obtained were standardized based on TP levels.
2.5. Assay of Gene Expression of Metabolic and Immune enzymes
The total RNA from juvenile snail tissue samples in each group was extracted using kits (Biospin, Hangzhou, China) following the manufacturer’s protocol. RNA degradation and contamination were assessed by 1% agarose gel electrophoresis. The concentration and integrity of the RNA were measured using a NanoDrop ND-2000C spectrophotometer (Thermo, MA, USA). Total cDNA synthesis was performed with Prime Script™ RT Master Mix kits (TaKaRa, Dalian, China) in a final volume of 20 μL according to the manufacturer’s instructions. Quantitative PCR (qPCR) was conducted on a QuantStudio Real-Time PCR system with a total reaction volume of 20 μL utilizing an Easy™ Mix-SYBR Green I kit (Foregene, Chengdu, China), adhering to the following thermal cycling program: initial denaturation at 95 °C for 5 minutes; followed by 35 cycles of amplification consisting of denaturation at 95 °C for 30 seconds, annealing at 55 °C for 30 seconds, and extension at 72 °C for one minute. The primer sequences for PK, LDH, ACP, AKP, and SOD genes were designed using Primer Premier 5 software (Table 1). Gene expression levels were analyzed employing the 2- △△CT method with β-actin serving as an internal control for qPCR analysis.
2.6. Statistical Analysis
The data are presented as means ± standard deviation (SD). One-way analysis of variance (ANOVA) and multiple comparisons were conducted for the results of all assays using SPSS version 20.0 statistical software. Levene’s test and Shapiro-Wilk test were employed to assess the homogeneity of variances and normality, respectively. A p-value less than 0.05 was considered to be statistically significant
3. Results
3.1. Metabolic Rates of B. Areolate During Prolonged Hypoxia
Mortality in the B. areolate group exposed to 2.0 mg O2/L occurred starting at 72 hours post-stress, with a cumulative mortality rate of 4.08% by the end of the experiment. In contrast, for the 0.5 mg O2/L group, mortality was observed from 48 hours onward, resulting in a cumulative mortality rate of 51.67% by the end of the experiment. No deaths were recorded in the control group.
Compared to the control group, the oxygen consumption rate of B. areolate was significantly lower (p < 0.05) in both the 2 mg/L and 0.5 mg/L treatment groups (Figure 1). Throughout the experimental period, no significant fluctuations were observed in the oxygen consumption rate of the 2 mg/L group. In contrast, the oxygen consumption rate of the 0.5 mg/L group exhibited an initial decrease, followed by an increase, and subsequently a significant reduction (p < 0.05). The oxygen consumption rate was significantly lower than that of the 2 mg/L group at time points of 0 h, 48 h, 96 h, 120 h, and 144 h (p < 0.05), respectively.
Compared to the control group, the ammonia excretion rate in the 2 mg/L group exhibited significant fluctuations and was significantly lower (p < 0.05) for most of the duration observed (Figure 2). The ammonia excretion rate in the 0.5 mg/L group first lower and then increased; it remained significantly lower than that of the control group (p < 0.05) and was also significantly lower (p < 0.05) than that of the 2 mg/L group at time points of 0 h, 24 h, and 120 h, respectively.
3.2. Metabolic and Immune Enzyme Activities of B. areolate Under Hypoxia Stress
Compared to the control group, the PK activity of B. areolate in the 2 mg O2/L treatment group was significantly lower (p < 0.05) at the onset of hypoxic stress (Figure 3). However, it exhibited a significant increase at 24 hours (p < 0.05), ultimately reaching its maximum value at 120 h. The PK activity in the 0.5 mg O2/L group displayed a similar trend, peaking at 144 h and being significantly higher (p < 0.05) than that of the 2 mg/L group at both 48 h and 72 h; conversely, it was significantly lower (p < 0.05) than that of the2 mg/L group at both 96 h and 120 h. In comparison with the control group, the LDH activity in the 2 mg/L treatment remained stable during initial hypoxic stress but showed a significant decrease after 48 h (p < 0.05) (Figure 3). In contrast, LDH activity in the 0.5 mg/L group was significantly higher (p < 0.05) at 0 h but subsequently demonstrated a marked decline compared to the control group. LDH activity was significantly lower (p < 0.05) than that of the 2 mg/L group at 24 h, 72 h, 96 h, and 144 h, and significantly higher (p < 0.05) at 96 h.
As shown in Figure 3, the ACP activity of B. areolate in the 2 mg O2/L group exhibited a gradual decline, which was significantly lower than that observed in the control group (p < 0.05), reaching its minimum at 144 h. In the 0.5 mg O2/L group, ACP activity was also significantly reduced (p < 0.05) compared to the control group and showed an increase after reaching its lowest point at 48 h. ACP activity was significantly lower (p < 0.05) in the 0.5 mg/L group than that in the 2 mg/L group at 24 h, 48 h, and 120 h. Compared with the control group, the AKP activity in the 2 mg/L group was significantly (p < 0.05) increased at 24 h, 96 h, 120 h, and 144 h, respectively, and there were no significant changes at other time points (Figure 3). The AKP activity in the 0.5 mg/L group was significantly higher (p < 0.05) at 0 h, 48 h, 96 h, and 120 h, but was significantly lower (p < 0.05) than that of the control group at 144 h and significantly higher (p < 0.05) than that of the 2 mg/L group at 0 h and 24 h. The SOD activity decreased significantly (p < 0.05) under hypoxic stress (Figure 3). With the extension of the stress, the SOD activity of the 2 mg/L group gradually increased, and that of the 0.5 mg/L group reached the lowest value at 48 h and then gradually increased. The SOD activity was significantly higher (p < 0.05) in the 0.5 mg/L group than in the 2 mg/L group at 0 h, 24 h, and 96 h, and significantly lower (p < 0.05) at 48 h and 144 h than in the 2 mg/L group.
3.3. Expression of Metabolic and Immune Enzyme Genes of B. Areolate Under Hypoxia Stress
Compared to the control group, the expression of the PK gene in B. areolate was significantly downregulated (p < 0.05) in the 2 mg O2/L treatment group at both 0 h and 96 h; however, it exhibited a significant upregulation at 144 h (Figure 4). In contrast, PK gene expression in the 0.5 mg/L group showed a significant increase (p < 0.05) at 48 h, 72 h, and 144 h. The PK gene expression level in the 0.5 mg O2/L group was significantly higher than that in the 2 mg/L group at 0 h, 48 h, 72 h, and 144 h but was significantly lower at both 24 h and 120 h (p < 0.05). Compared to the control group, LDH gene expression in the 2 mg/L treatment group was significantly downregulated (p < 0.05) at 24 h; however, it exhibited a significant upregulation (p < 0.05) at both 96 h and 144 h (Figure 4). LDH gene expression in the 0.5 mg/L group showed a significant upregulation (p < 0.05) at both 0 h and 120 h but was significantly downregulated (p < 0.05) at other time points. The LDH gene expression level in the 0.5 mg/L group was significantly higher than that in the 2 mg/L group at both 0 h and 120 h, while it was significantly lower at other time points (p < 0.05).
The expression level of the ACP gene in B. areolate at 2 mg O2/L was significantly lower than that in the control group after 24 hours (p < 0.05) (Figure 4). The ACP gene expression level in the 0.5 mg O2/L group was significantly reduced compared to the control group (p < 0.05), and it was also significantly lower (p < 0.05) than that of the 2 mg/L group at 48 h, 72 h, and 144 h, respectively. The expression level of the AKP gene in the 2 mg/L group did not show a significant difference compared to the control group (Figure 4). In contrast, the AKP gene expression level in the 0.5 mg/L group was significantly higher than that of the control group at 72 h, 96 h, and 120 h (p < 0.05). Compared with the control group, SOD gene expression in the 2 mg/L group was significantly downregulated (p < 0.05), except at 48 h (Figure 4). Similarly, SOD gene expression in the 0.5 mg/L group exhibited significant downregulation (p < 0.05), except at 0 h and 48 h. No significant differences were observed between the 2 mg/L and 0.5 mg/L groups except at 48 h.
4. Discussion
4.1. Effects of Prolonged Hypoxic Stress on Metabolism of B. areolate
In the present study, we elucidated the significant effects of prolonged hypoxic stress on the survival and physiological responses of juvenile B. areolate. The findings indicated that the mortality rate of B. areolate exhibited a negative correlation with dissolved oxygen concentration. Our previous acute experiment, in which dissolved oxygen levels were reduced to 6, 4, 2, 1, and 0.5 mg/L within 30 minutes, demonstrated that the oxygen consumption rate at 2 mg/L was not significantly different from those observed at both 4 mg/L and 6 mg/L. However, there was a significant decrease in the oxygen consumption rate when dissolved oxygen levels dropped to 1 mg/L. These findings suggest that 2 mg/L may represent the threshold for B. areolate to sustain aerobic metabolism; furthermore, mortality appears to occur when dissolved oxygen levels fall below this threshold. In addition, mortality was observed at 48 h and 72 h in the 0.5 mg/L and 2.0 mg/L groups, respectively, indicating that juvenile B. areolate exhibits a certain degree of tolerance to hypoxic stress for a limited duration. Similar findings have also been reported in the abalone Haliotis discus hannai [16]. However, the hypoxia tolerance of B. areolate is weaker than that of burrowing and attaching shellfish, such as clams and oysters. Ruditapes philippinarum has been shown to exhibit a high tolerance to hypoxia, with a 20-day LC50 value of 0.57 mg O2/L and a 422-hour LC50 at 0.5 mg O2/L [17]. In contrast, the oyster C. virginica began to show mortality by day 7 when exposed to 2 mg O2/L [18]. This difference in tolerance may be attributed to the relatively weak mobility of oysters and clams, which have evolved mechanisms to withstand low oxygen conditions; whereas B. areolate, being more mobile, can migrate towards more suitable habitats.
Measurements of oxygen consumption and the production of metabolic waste, such as ammonia excretion, in organisms provide an indirect approach for estimating the metabolism of aquatic animals [19]. In this study, we observed that both the oxygen consumption rate and ammonia excretion rate were generally negatively correlated with dissolved oxygen concentration. Furthermore, a significant decrease in both parameters was observed throughout the hypoxia exposure period. These findings suggest that hypoxic stress significantly impacts energy metabolism in B. areolate. Similar results have been documented in other marine shellfish, including the oyster C. hongkongensis, the hard-shelled mussel M. coruscus, the scallop Chlamys farreri, the Manila clam R. philippinarum, the clam Tegillarca granosa, and the abalone H. discus hannai [10,17,19,20,21,22]. When confronted with hypoxia, these shellfish exhibited reduced respiration and metabolic rates.
Lowering the metabolic rate is one of the most important strategies employed by shellfish to cope with hypoxic stress. This adaptation reduces ATP demand and prolongs the utilization of energy reserves stored in tissues [4]. According to Pörtner and Farrell [23], when organisms are exposed to extreme stress conditions, anaerobic metabolism is activated upon reaching a critical threshold of the stressors. Anaerobic respiration produces only 2 ATP molecules per molecule of glucose degraded, which is significantly lower than the 32 ATP molecules generated through the complete oxidation of glucose [24]. Liu et al. [25] observed that following exposure to hypoxia (1.5 mg O2/L), the concentrations of anaerobic metabolites, such as succinate, lactate, acetate, fumarate, and propionate, in the subtidal gastropod Nassarius conoidalis increased markedly. This finding suggests an enhancement in anaerobic metabolism as a means to conserve energy. The significant decline in oxygen consumption rate indicates that B. areolate may shift, at least partially, towards an anaerobic pathway to save energy under conditions of hypoxic stress.
4.2. Effects of Prolonged Hypoxic Stress on Enzymatic Activities and Gene Expression of B. Areolate
Energy metabolism is accomplished through a series of enzymatic reactions that are influenced by the activity and expression levels of the involved enzymes. PK serves as a key regulatory enzyme in glycolysis. In juvenile B. areolate, a significant increase in PK activity and gene expression levels was observed when dissolved oxygen concentrations decreased to 2 mg O2/L and 0.5 mg O2/L, indicating an elevated glycolytic rate during hypoxic conditions despite overall metabolic depression. Similarly, R. philippinarum exposed to 0.5 mg O2/L exhibited a significant increase in PK activity [17]. In the clam T. granosa, PK activity exhibited a significant increase when the dissolved oxygen concentration decreased to 0.5 mg/L [10]. Conversely, Moullac et al. [26] reported a notable reduction in both PK activity and gene expression in the oyster C. virginica when oxygen levels were lowered to 1.96 mg/L for a duration of 20 days. This discrepancy may be attributed to species-specific differences or could stem from variations in hypoxic stress treatments or responsive mechanisms; indeed, in this study, both PK enzyme activity and gene expression levels demonstrated considerable fluctuations during periods of hypoxic stress.
LDH is also a key enzyme in the anaerobic metabolic pathway, catalyzing the conversion of pyruvate to lactate for ATP production. In the present study, the significant increase in LDH activity observed in B. areolate exposed to 0.5 mg O2/L (0 h) indicates that hypoxic stress triggers anaerobic metabolism. Similarly, an increase in LDH activity was observed in the gills of R. philippinarum after exposure to 2 mg O2/L; however, a different trend was observed in the hepatopancreas [27]. Li et al. (2019) reported that LDH activity in the adductor muscle of R. philippinarum exhibited no significant change at 2 mg O2/L on day 10; however, it was significantly elevated compared to the control group on day 20. These findings suggest that both the sampled tissues and the timing of measurements may influence the results. It has been established that shellfish possess multiple pathways for energy metabolism, including the glucose-succinate pathway, pyruvate-lactate pathway, proline pathway, and opine pathway [4,17]. In the present study, B. areolate may utilize the pyruvate-lactate pathway as its primary respiratory metabolism pathway during the early stages of stress. To mitigate the effects of acid accumulation on cellular homeostasis in vivo during prolonged hypoxia, B. areolate may shift to alternative metabolic pathways that yield volatile or less acidic end products instead of lactate, thereby resulting in a decrease in LDH activity. Wang et al. [10] also observed a reduction in lactate content in the clam T. granosa following exposure to hypoxic stress. In the present study, the variation in LDH activities did not fully align with gene expression patterns, as the peak values were observed at different time points. This finding underscores the complexity of metabolic regulation in B. areolate under hypoxic stress. While there is generally a correlation between gene expression and phenotypic traits, this relationship does not reflect a direct one-to-one correspondence. Post-translational modifications of proteins, such as phosphorylation, acetylation, ubiquitination, methylation, and glycosylation, also play a significant role in determining the final phenotype [28,29].
Studies have demonstrated that hypoxia can physiologically and pathologically modulate immune activity in cells [30]. ACP serves as a marker enzyme for lysosomes and plays a crucial role in the killing and digestion of microbial pathogens during immune responses. Its activity can serve as an indicator of the immune status in molluscs [31]. In the present study, the ACP activity and gene expression in B. areolate significantly decreased following exposure to hypoxic stresses of 2 mg O2/L and 0.5 mg O2/L. This finding suggests that hypoxic stress inhibits the activity of hydrolytic enzymes involved in cellular immunization processes within B. areolate, which may be detrimental to the survival of juvenile individuals of B. areolate. In the scallop C. farreri, the ACP activity in the haemolymph significantly decreased 14 days after dissolved oxygen levels fell to 2.5 mg O₂/L [31]. This reduction in ACP activity and gene expression is likely a consequence of metabolic arrest induced by anaerobiosis, as well as alterations in lysosomal integrity resulting from hypoxic stress [31]. AKP is a multifunctional enzyme that plays a crucial role in phosphate metabolism and immune defense, including detoxification of lipopolysaccharides, and it functions as a transphosphorylase at alkaline pH [31,32]. In this study, the AKP activity and gene expression were found to be elevated after hypoxic stress, particularly in the group exposed to 0.5 mg O2/L. Similarly, AKP activity in the hepatopancreas of R. philippinarum significantly increased after five days of hypoxic stress at a concentration of 2.0 mg O2/L [27]. In this study, the ACP activity exhibited an opposite trend compared to that of AKP. Comparable findings have been reported in the scallop C. farreri [31]. The optimal pH for the functioning of these two enzymes differs; therefore, further investigations are warranted to ascertain whether the pH environment within B. areolate cells is altered as a result of anaerobic metabolism.
It has been demonstrated that reactive oxygen species (ROS), including superoxide, hydrogen peroxide, and hydroxyl radicals, are generated in cells under hypoxic conditions [33]. SOD plays a crucial role in protecting cells from ROS-induced damage and serves as an important biomarker for assessing immune responses in shellfish. In the present study, we observed a significant reduction in both SOD activity and gene expression under hypoxia. This finding suggests that hypoxic stress induces oxidative stress in B. areolate, potentially leading to cellular damage. The triangle sail mussel, Hyriopsis cumingii, exhibited a significant reduction in SOD activity under hypoxic conditions of 1 mg O2/L and 3 mg O2/L [34]. Similarly, a notable decrease in SOD activity was observed in the abalone H. discus hannai after two months of exposure to hypoxia at 2.5 mg O2/L [19]. In contrast, no significant changes were detected in SOD activity or gene expression in the mussel M. galloprovincialis following 24 hours of stress at 2 mg O2/L [35]. Conversely, the clam T. granosa demonstrated a significantly elevated SOD activity when subjected to hypoxic conditions of 0.5 mg O2/L [10]. These findings indicate that antioxidant defense to hypoxia varies considerably among different species.
5. Conclusions
The present study demonstrated that exposure to 2 mg O2/L and 0.5 mg O2/L significantly inhibited oxygen consumption and ammonia excretion, induced oxidative stress in juvenile B. areolate, and resulted in increased mortality rates. The mortality of B. areolate is closely associated with dissolved oxygen concentration and the duration of stress, and the mortality could be significantly mitigated by limiting transportation time to within 48 hours. This research indicates that reducing metabolic rate and modulating the activity and gene expression of enzymes involved in energy metabolism are crucial strategies for B. areolate to cope with hypoxic stress. These findings contribute to our understanding of the adaptive mechanisms employed by marine gastropods for hypoxic tolerance and provide valuable insights for minimizing hypoxic damage to B. areolate.
Author Contributions
Conceptualization, B.T., Z.D. and H.Z.; Investigation, X.R., Y.L. and T.W.; formal analysis, B.T. and X.R.; funding acquisition, B.T. and H.Z.; methodology, X.R., Y.L. and T.W.; writing—original draft preparation, B.T. and X.R.; writing—review and editing, B.T., Z.D. and H.Z.; All authors have read and agreed to the published version of the manuscript.
Funding
This research was funded by Hainan Province Science and Technology Special Fund (ZDYF2022XDNY351).
Institutional Review Board Statement
Not applicable.
Informed Consent Statement
Not applicable.
Data Availability Statement
Data are contained within the article.
Conflicts of Interest
The authors declare no conflicts of interest.
References
- Schmidtko, S.; Stramma, L.; Visbeck, M. Decline in global oceanic oxygen content during the past five decades. Nature 2017, 542, 335–339. [Google Scholar] [CrossRef] [PubMed]
- Altieri, A.H.; Gedan, K.B. Climate change and dead zones. Glob. Change Biol. 2015, 21, 1395–1406. [Google Scholar] [CrossRef] [PubMed]
- Porter, E.T.; Breitburg, D.L. Eastern oyster, Crassostrea virginica, valve gape behavior under diel-cycling hypoxia. Mar. Biol. 2016, 163, 1–12. [Google Scholar] [CrossRef]
- Larade, K.; Storey, K.B. A profile of the metabolic responses to anoxia in marine invertebrates. Cell Mol. Resp. Stress. 2002, 3, 27–46. [Google Scholar]
- Artigaud, S.; Lacroix, C.; Pichereau, V.; Flye-Sainte-Marie, J. Respiratory response to combined heat and hypoxia in the marine bivalves Pecten maximus and Mytilus spp. Comp. Biochem. Physiol. A Mol. Integr. Physiol. 2014, 175, 135–140. [Google Scholar] [CrossRef]
- Tang, B.J.; Riisgård, H.U. Relationship between oxygen concentration, respiration and filtration rate in blue mussel Mytilus edulis. J Oceanol. Limnol. 2018, 36, 395–404. [Google Scholar] [CrossRef]
- Khan, F.U.; Chen, H.; Gu, H.X.; Wang, T.; Dupont, S.; Kong, H.; Shang, Y.Y.; Wang, X.H.; Lu, W.Q.; Hu, M.H. Antioxidant responses of the mussel Mytilus coruscus co-exposed to ocean acidification, hypoxia and warming. Mar. Pollut. Bull. 2020, 162, 111869. [Google Scholar] [CrossRef]
- Ross Ellington, W. Energy metabolism during hypoxia in the isolated, perfused ventricle of the whelk,Busycon contrarium conrad. J. Comp. Physiol. B. 1981, 142, 457–464. [Google Scholar] [CrossRef]
- Haider, F.; Falfushynska, H.I.; Timm, S.; Sokolova, I.M. Effects of hypoxia and reoxygenation on intermediary metabolite homeostasis of marine bivalves Mytilus edulis and Crassostrea gigas. Comp. Biochem. Physiol. A Mol. Integr. Physiol. 2020, 242, 110657. [Google Scholar] [CrossRef]
- Wang, Y.H.; Jiang, P.Y.; Xia, F.Y.; Bai, Q.Q.; Zhang, X.M. Transcriptional and physiological profiles reveal the respiratory, antioxidant and metabolic adaption to intermittent hypoxia in the clam Tegillarca granosa. Comp. Biochem. Phys. D. 2024, 50, 101215. [Google Scholar] [CrossRef]
- Stickle, W.B.; Kapper, M.A.; Liu, L.L.; Gnaiger, E.; Wang, S.Y. Metabolic adaptations of several species of crustaceans and molluscs to hypoxia: tolerance and microcalorimetric studies. Biol. Bull. 1989, 177, 303–312. [Google Scholar] [CrossRef]
- Chen, J.Y.; Huang, J.; Peng, J.Q.; Yang, C.Y.; Liao, Y.S.; Li, J.H.; Deng, Y.W.; Du, X.D. Effects of hypoxic stress on the digestion, energy metabolism, oxidative stress regulation, and immune function of the pearl oyster (Pinctada fucata martensii). Aquacult. Rep. 2022, 25, 101246. [Google Scholar] [CrossRef]
- Zhong, M.C.; Liu, X.K.; Xu, R.; Liu, X.J.; Jiang, Q.C.; Song, X.Y.; Lu, Y.N.; Luo, X.L.; Yue, C.Y.; Qin, S.; Lü, W.G. Effects of light quality and intensity on the juvenile physiological metabolism of Babylonia areolate. Aquacult. Rep. 2023, 33, 101758. [Google Scholar]
- Chaitanawisuti, N.; Santhaweesuk, W.; Kritsanapuntu, S. Performance of the seaweeds Gracilaria salicornia and Caulerpa lentillifera as biofilters in a hatchery scale recirculating aquaculture system for juvenile spotted babylons (Babylonia areolata). Aquacult. Int. 2011, 19, 1139–1150. [Google Scholar] [CrossRef]
- Solorzano, L. Determination of ammonia in natural waters by the phenolhypochlorite method. Oceanol. Limnol. 1969, 14, 799–801. [Google Scholar]
- Dai, Y.; Shen, Y.W.; Liu, Y.B.; Xia, W.W.; Hong, J.W.; Gan, Y.; Huang, J.; Luo, X.; Ke, C.H.; You, W.W. A high throughput method to assess the hypoxia tolerance of abalone based on adhesion duration. Aquaculture. 2024, 590, 741004. [Google Scholar] [CrossRef]
- Li, Q.; Sun, S.; Zhang, F.; Wang, M.X.; Li, M.N. Effects of hypoxia on survival, behavior, metabolism and cellular damage of Manila clam (Ruditapes philippinarum). Plos One. 2019, 14, 1–21. [Google Scholar] [CrossRef]
- Davis, A.M.; Plough, L.; Paynter, K. Intraspecific patterns of mortality and cardiac response to hypoxia in the eastern oyster, Crassostrea virginica. J. Exp. Mar. Biol. Ecol. 2023, 566, 151921. [Google Scholar] [CrossRef]
- Nam, S.E.; Haque, N.; Lee, J.S.; Park, H.S.; Rhee, J.S. Prolonged exposure to hypoxia inhibits the growth of Pacific abalone by modulating innate immunity and oxidative status. Aquat. Toxicol. 2020, 227, 105596. [Google Scholar] [CrossRef]
- Sui, Y.M.; Kong, H.; Huang, X.Z.; Dupont, S.; Hu, M.H.; Storch, D.; Portner, H.O.; Lu, W.Q.; Wang, Y.J. Combined effects of short-term exposure to elevated CO2 and decreased O2 on the physiology and energy budget of the thick shell mussel Mytilus coruscus. Chemosphere. 2016, 155, 207–216. [Google Scholar] [CrossRef]
- Li, Q.; Zhang, F.; Wang, M.X.; Li, M.N.; Sun, S. Effects of hypoxia on survival, behavior, and metabolism of Zhikong scallop Chlamys farreri Jones et Preston 1904. J. Ocean. Limnol. 2020, 38, 351–363. [Google Scholar] [CrossRef]
- Meng, J.; Wang, T.; Li, L.; Zhang, G.F. Inducible variation in anaerobic energy metabolism reflects hypoxia tolerance across the intertidal and subtidal distribution of the Pacific oyster (Crassostrea gigas). Mar. Environ. Res. 2018, 138, 135–143. [Google Scholar] [CrossRef] [PubMed]
- Pörtner, H.O.; Farrell, A.P. Physiology and climate change. Science 2008, 322, 690–692. [Google Scholar] [CrossRef]
- de Zwaan, A.; Cortesi, P.; van den Thillart, G.; Roos, J.; Storey, K.B. Differential sensitivities to hypoxia by two anoxiatolerant marine molluscs: a biochemical analysis. Mar. Biol. 1991, 111, 343–351. [Google Scholar] [CrossRef]
- Liu, C.C.; Shin, P.K.S.; Cheung, S.G. Comparisons of the metabolic responses of two subtidal nassariid gastropods to hypoxia and re-oxygenation. Mar. Pollut. Bull. 2014, 82, 109–116. [Google Scholar] [CrossRef]
- Moullac, G.L.; Bacca, H.; Huvet, A.; Moal, J.; Pouvreau, S.; Wormhoudt, A.V. Transcriptional regulation of pyruvate kinase and phosphoenolpyruvate carboxykinase in the adductor muscle of the oyster Crassostrea gigas during prolonged hypoxia. J. Exp. Zool. Part A. 2007, 307, 371–382. [Google Scholar] [CrossRef]
- Nie, H.T.; Wang, H.M.; Jiang, K.Y.; Yan, X.W. Transcriptome analysis reveals differential immune related genes expression in Ruditapes philippinarum under hypoxia stress: potential HIF and NF-κB crosstalk in immune responses in clam. BMC Genomics 2020, 21, 318. [Google Scholar] [CrossRef]
- Xu, D.X.; Wang, X. Lysine acetylation is an important post-translational modification that modulates heat shock response in the sea cucumber Apostichopus japonicus. Int. J. Mol. Sci. 2019, 20, 4423. [Google Scholar] [CrossRef]
- Yang, Y.H.; Wen, R.; Yang, N.; Zhang, T.N.; Liu, C.F. Roles of protein post-translational modifications in glucose and lipid metabolism: mechanisms and perspectives. Mol. Med. 2023, 29, 93. [Google Scholar] [CrossRef]
- Taylor, C.T.; Colgan, S.P. Regulation of immunity and inflammation by hypoxia in immunological niches. Nat. Rev. Immunol. 2017, 17, 774–785. [Google Scholar] [CrossRef]
- Chen, J.H.; Mai, K.S.; Ma, H.M.; Wang, X.J.; Deng, D.; Liu, X.W.; Xu, W.; Liufu, Z.G.; Zhang, W.B.; Tan, B.P.; Ai, Q.H. Effects of dissolved oxygen on survival and immune responses of scallop (Chlamys farreri Jones et Preston). Fish Shellfish Immun. 2007, 22, 272–281. [Google Scholar] [CrossRef] [PubMed]
- Li, Q.; Zhang, F.; Sun, S. The survival and responses of blue mussel Mytilus edulis to 16-day sustained hypoxia stress. Mar. Environ. Res. 2022, 176, 105601. [Google Scholar] [CrossRef] [PubMed]
- Chandel, N.S.; McClintock, D.S.; Feliciano, C.E.; Wood, T.M.; Melendez, J.A.; Rodriguez, A.M.; Schumacker, P.T. Reactive oxygen species generated at mitochondrial complex III stabilize hypoxia-inducible factor-1α during hypoxia: a mechanism of O2 sensing. J. Biol. Chem. 2000, 275, 25130–25138. [Google Scholar] [CrossRef] [PubMed]
- Hu, M.H.; Wu, F.L.; Yuan, M.Z.; Li, Q.Z.; Gu, Y.D.; Wang, Y.J. Antioxidant responses of triangle sail mussel Hyriopsis cumingii exposed to harmful algae Microcystis aeruginosa and hypoxia. Chemosphere 2015, 139, 541–549. [Google Scholar] [CrossRef]
- Woo, S.; Denis, V.; Won, H.K.; Shin, K.S.; Lee, G.S.; Lee, T.K.; Yum, S.S. Expressions of oxidative stress-related genes and antioxidant enzyme activities in Mytilus galloprovincialis (bivalvia, mollusca) exposed to hypoxia. Zool. Stud. 2013, 52, 15. [Google Scholar] [CrossRef]
Figure 1.
Oxygen consumption rate of B. areolata exposed to different concentrations of dissolved oxygen (0.5, 2.0 and 7.5 mg O2/L). A significant difference (p < 0.05) compared with the control values is indicated by different lowercase letters on the data bars.
Figure 1.
Oxygen consumption rate of B. areolata exposed to different concentrations of dissolved oxygen (0.5, 2.0 and 7.5 mg O2/L). A significant difference (p < 0.05) compared with the control values is indicated by different lowercase letters on the data bars.
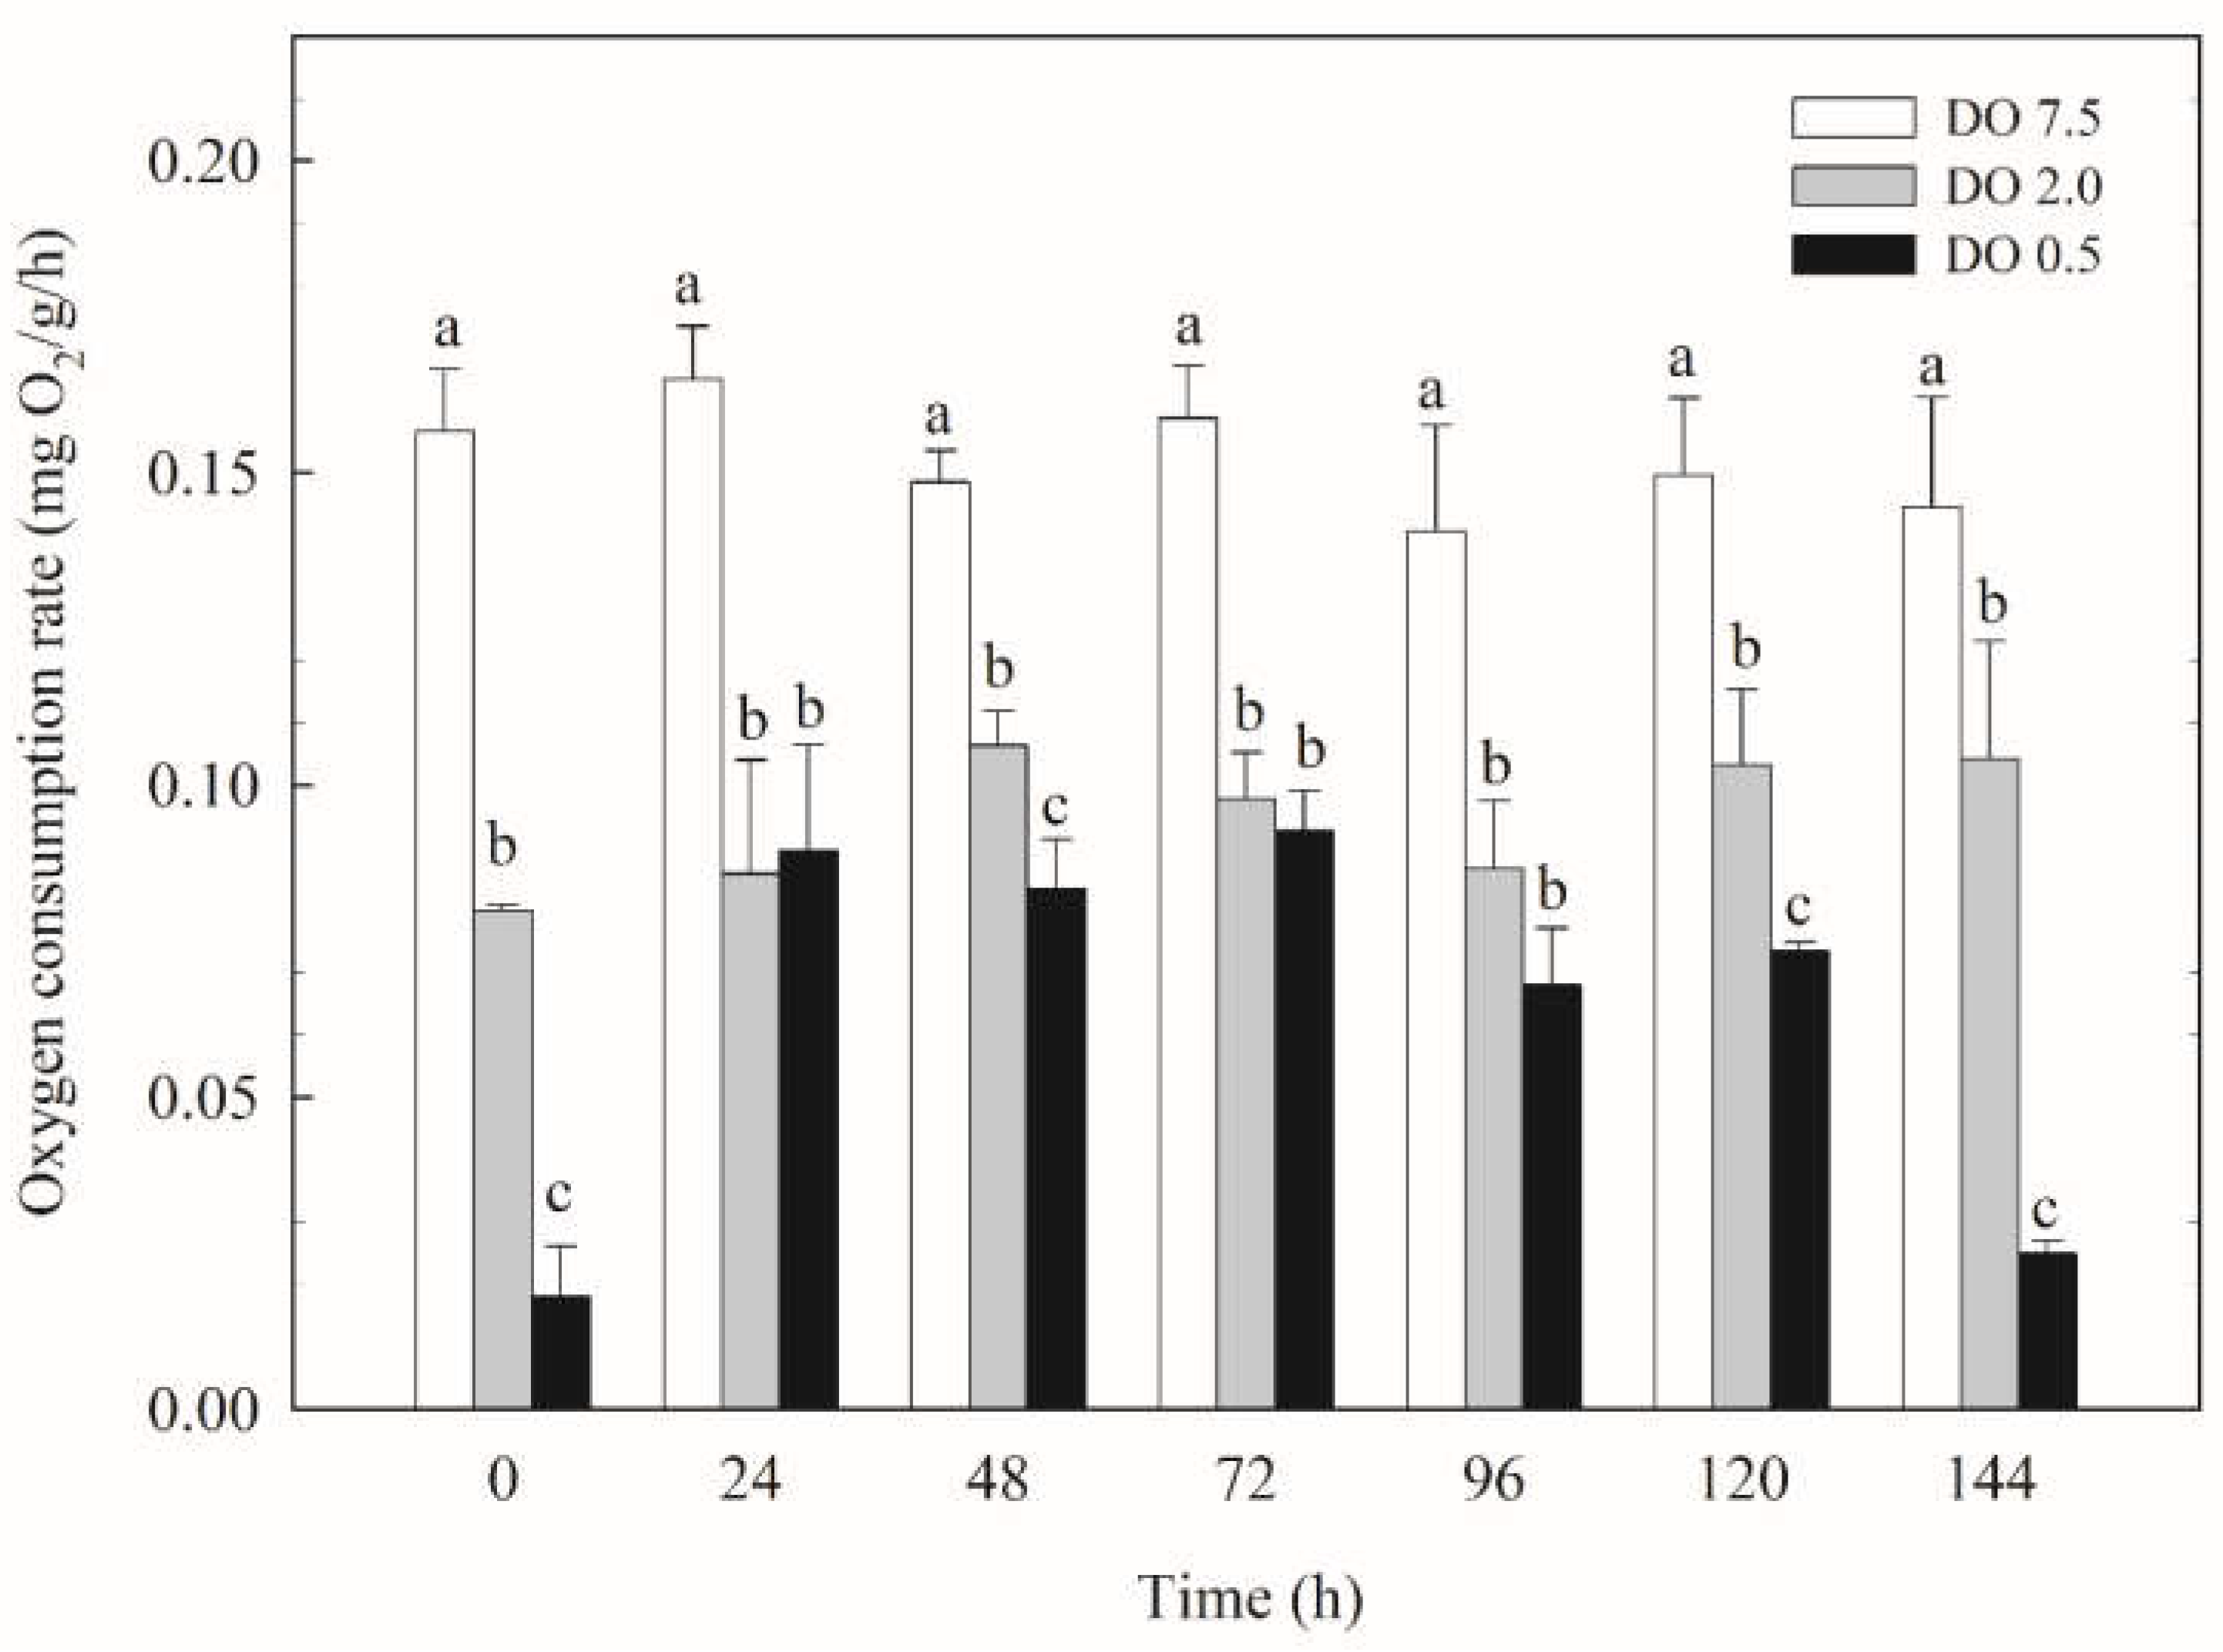
Figure 2.
Ammonia excretion rate of B. areolata exposed to different concentrations of dissolved oxygen (0.5, 2.0 and 7.5 mg O2/L). A significant difference (p < 0.05) compared with the control values is indicated by different lowercase letters on the data bars.
Figure 2.
Ammonia excretion rate of B. areolata exposed to different concentrations of dissolved oxygen (0.5, 2.0 and 7.5 mg O2/L). A significant difference (p < 0.05) compared with the control values is indicated by different lowercase letters on the data bars.
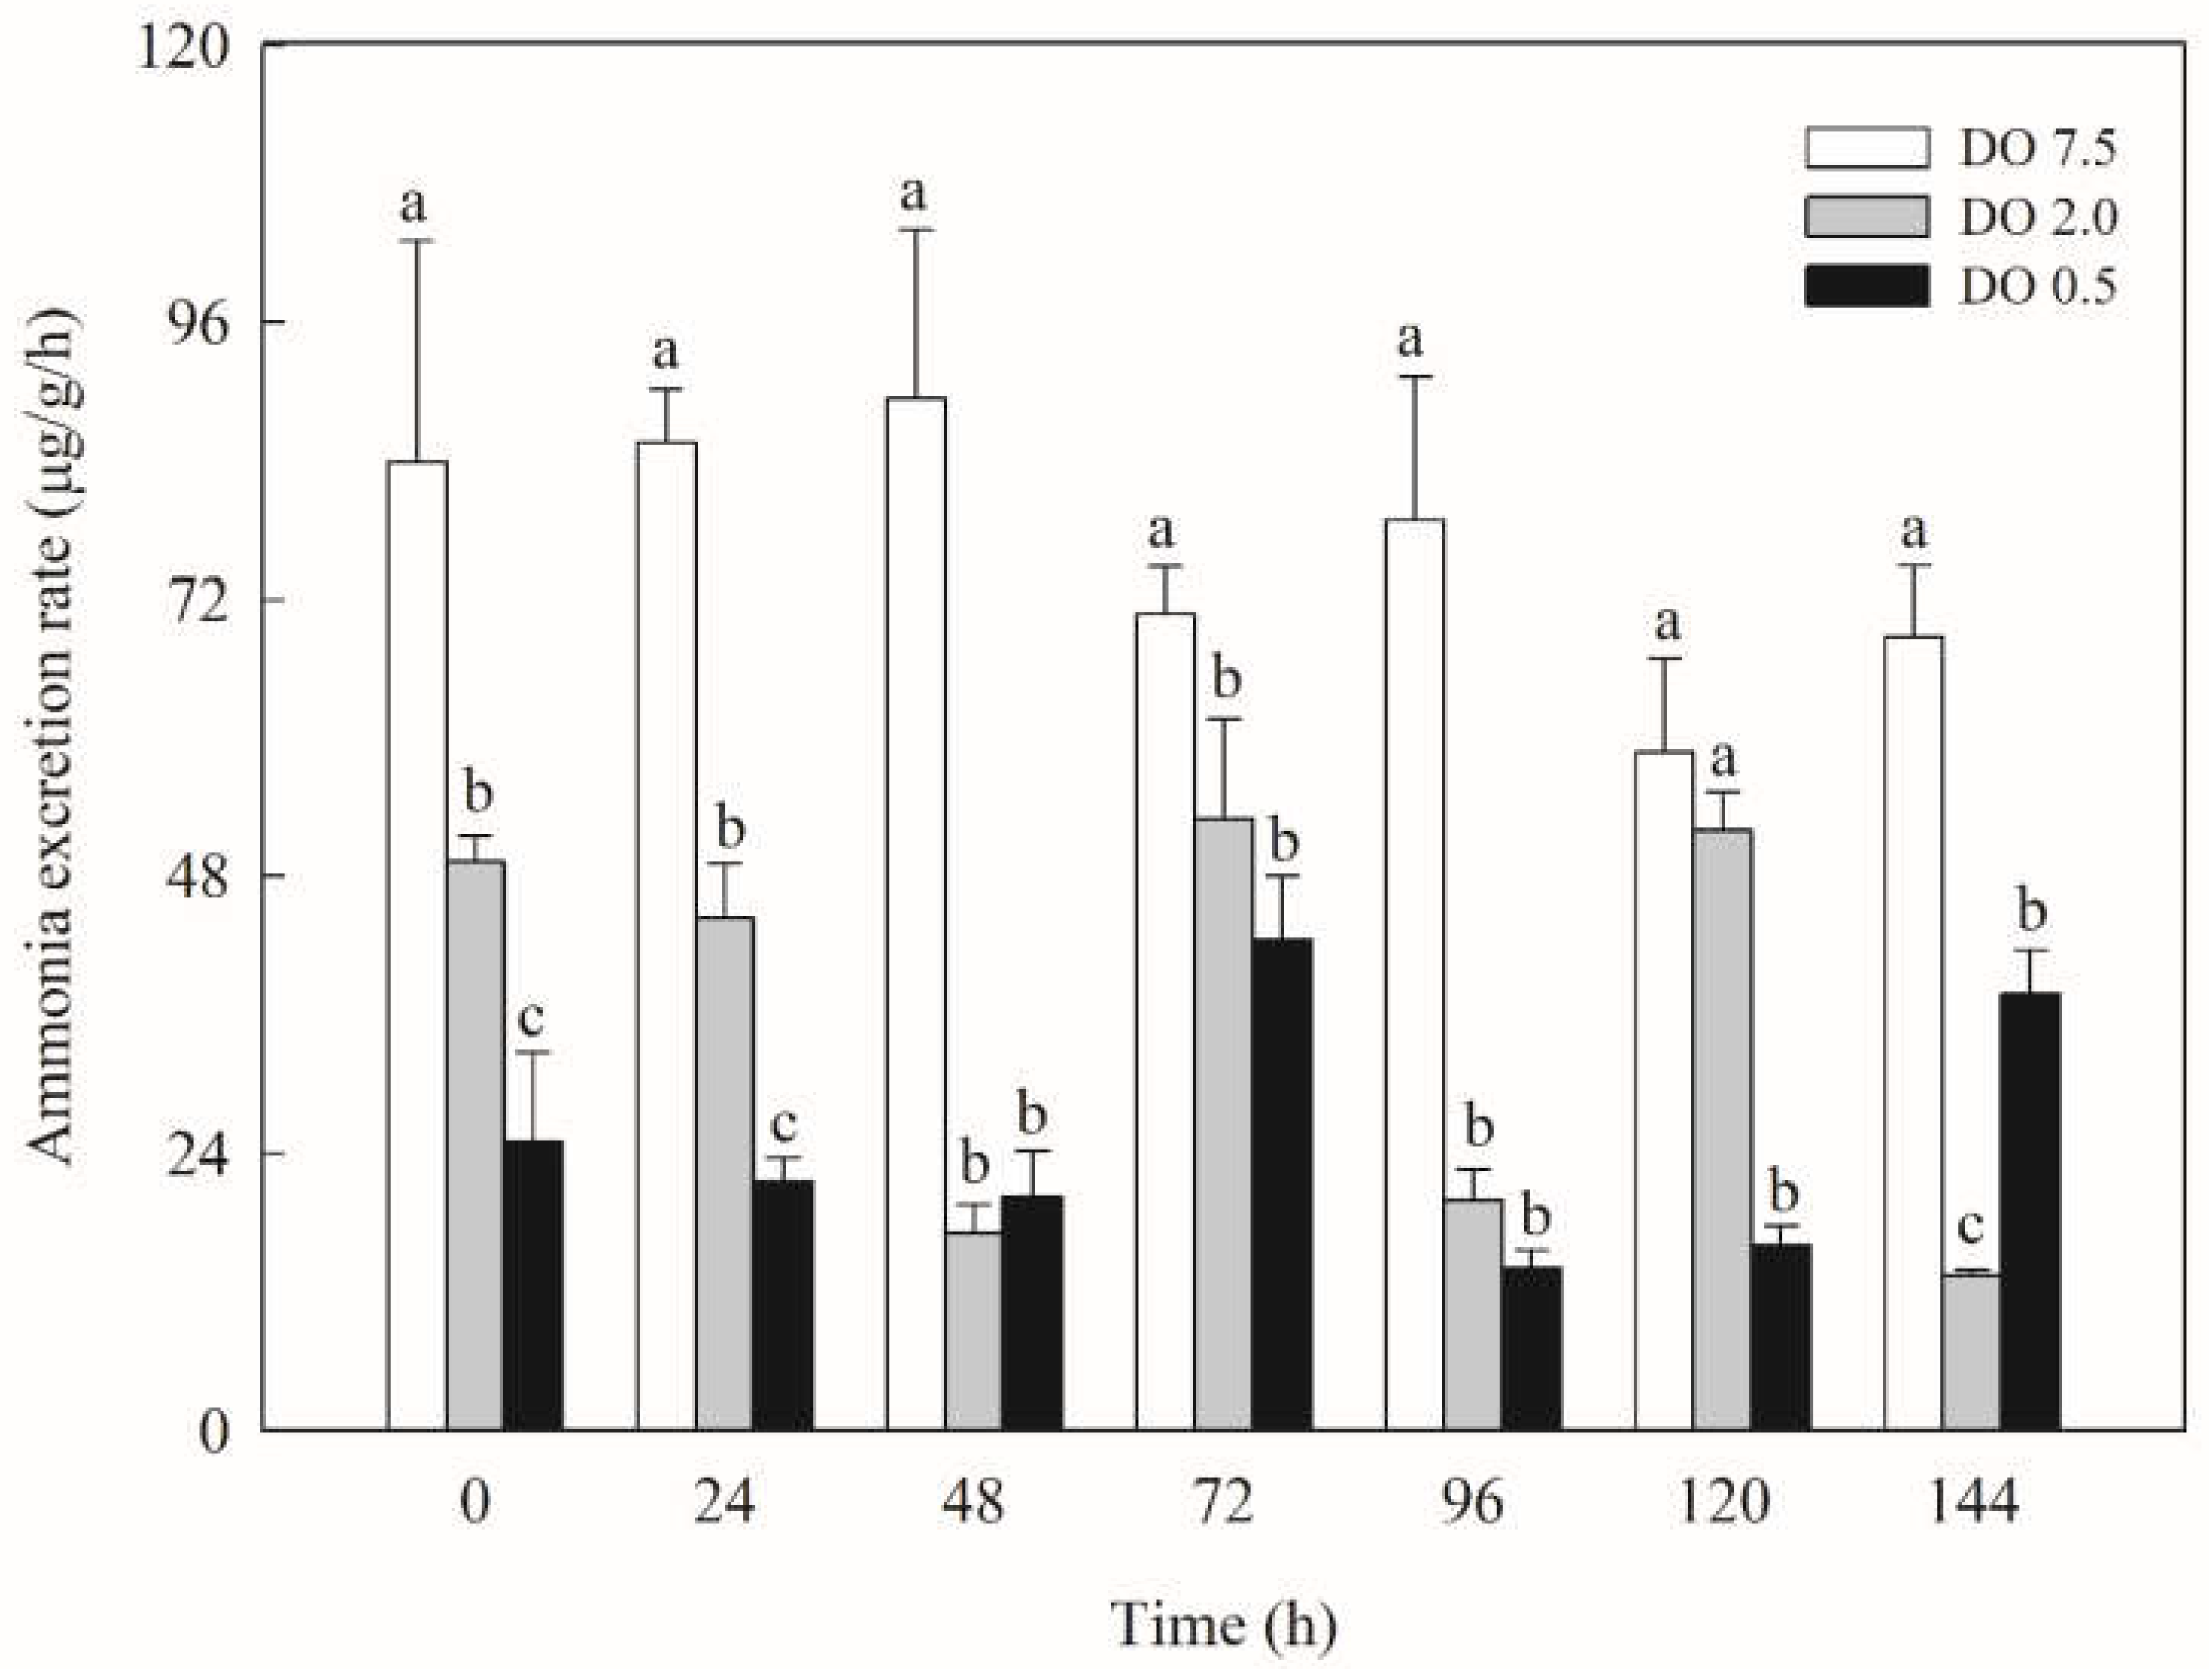
Figure 3.
Metabolic and immune enzyme activities of B. areolata exposed to different concentrations of dissolved oxygen (0.5, 2.0 and 7.5 mg O2/L). A significant difference (p < 0.05) compared with the control values is indicated by different lowercase letters on the data bars.
Figure 3.
Metabolic and immune enzyme activities of B. areolata exposed to different concentrations of dissolved oxygen (0.5, 2.0 and 7.5 mg O2/L). A significant difference (p < 0.05) compared with the control values is indicated by different lowercase letters on the data bars.
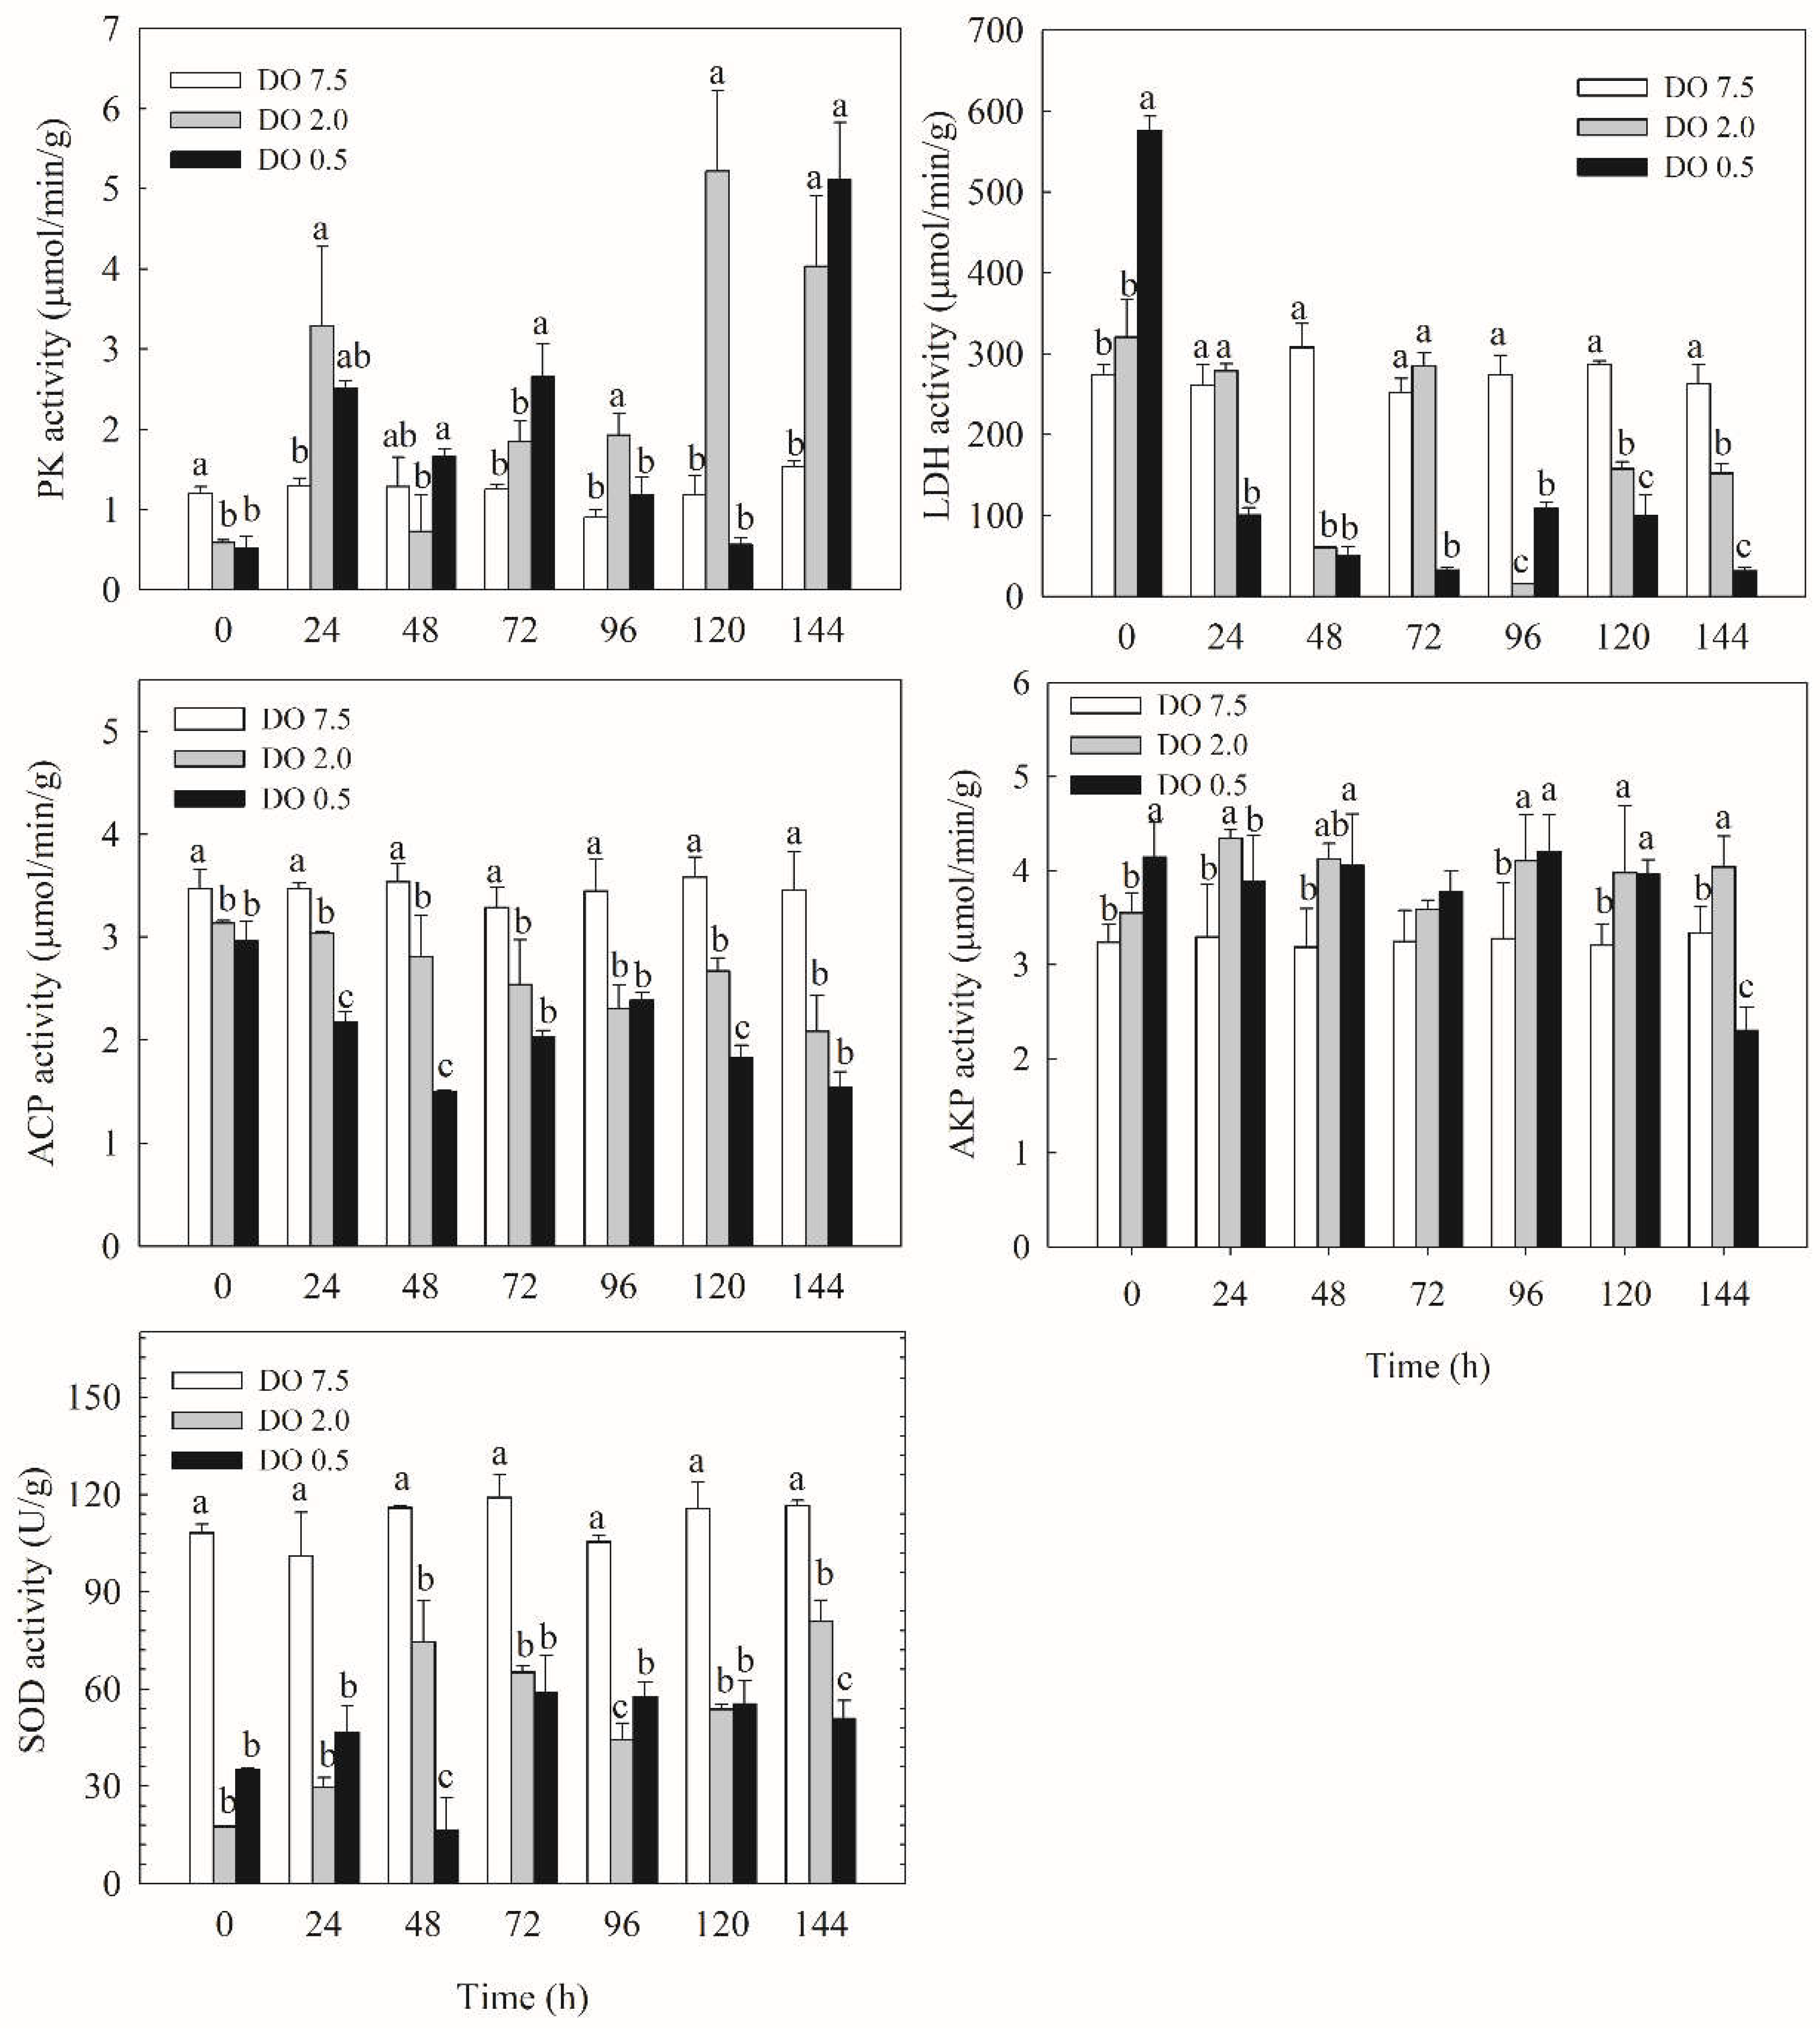
Figure 4.
Relative gene expression of metabolic and immune enzymes of B. areolata exposed to different concentrations of dissolved oxygen (0.5, 2.0 and 7.5 mg O2/L). A significant difference (p < 0.05) compared with the control values is indicated by different lowercase letters on the data bars.
Figure 4.
Relative gene expression of metabolic and immune enzymes of B. areolata exposed to different concentrations of dissolved oxygen (0.5, 2.0 and 7.5 mg O2/L). A significant difference (p < 0.05) compared with the control values is indicated by different lowercase letters on the data bars.
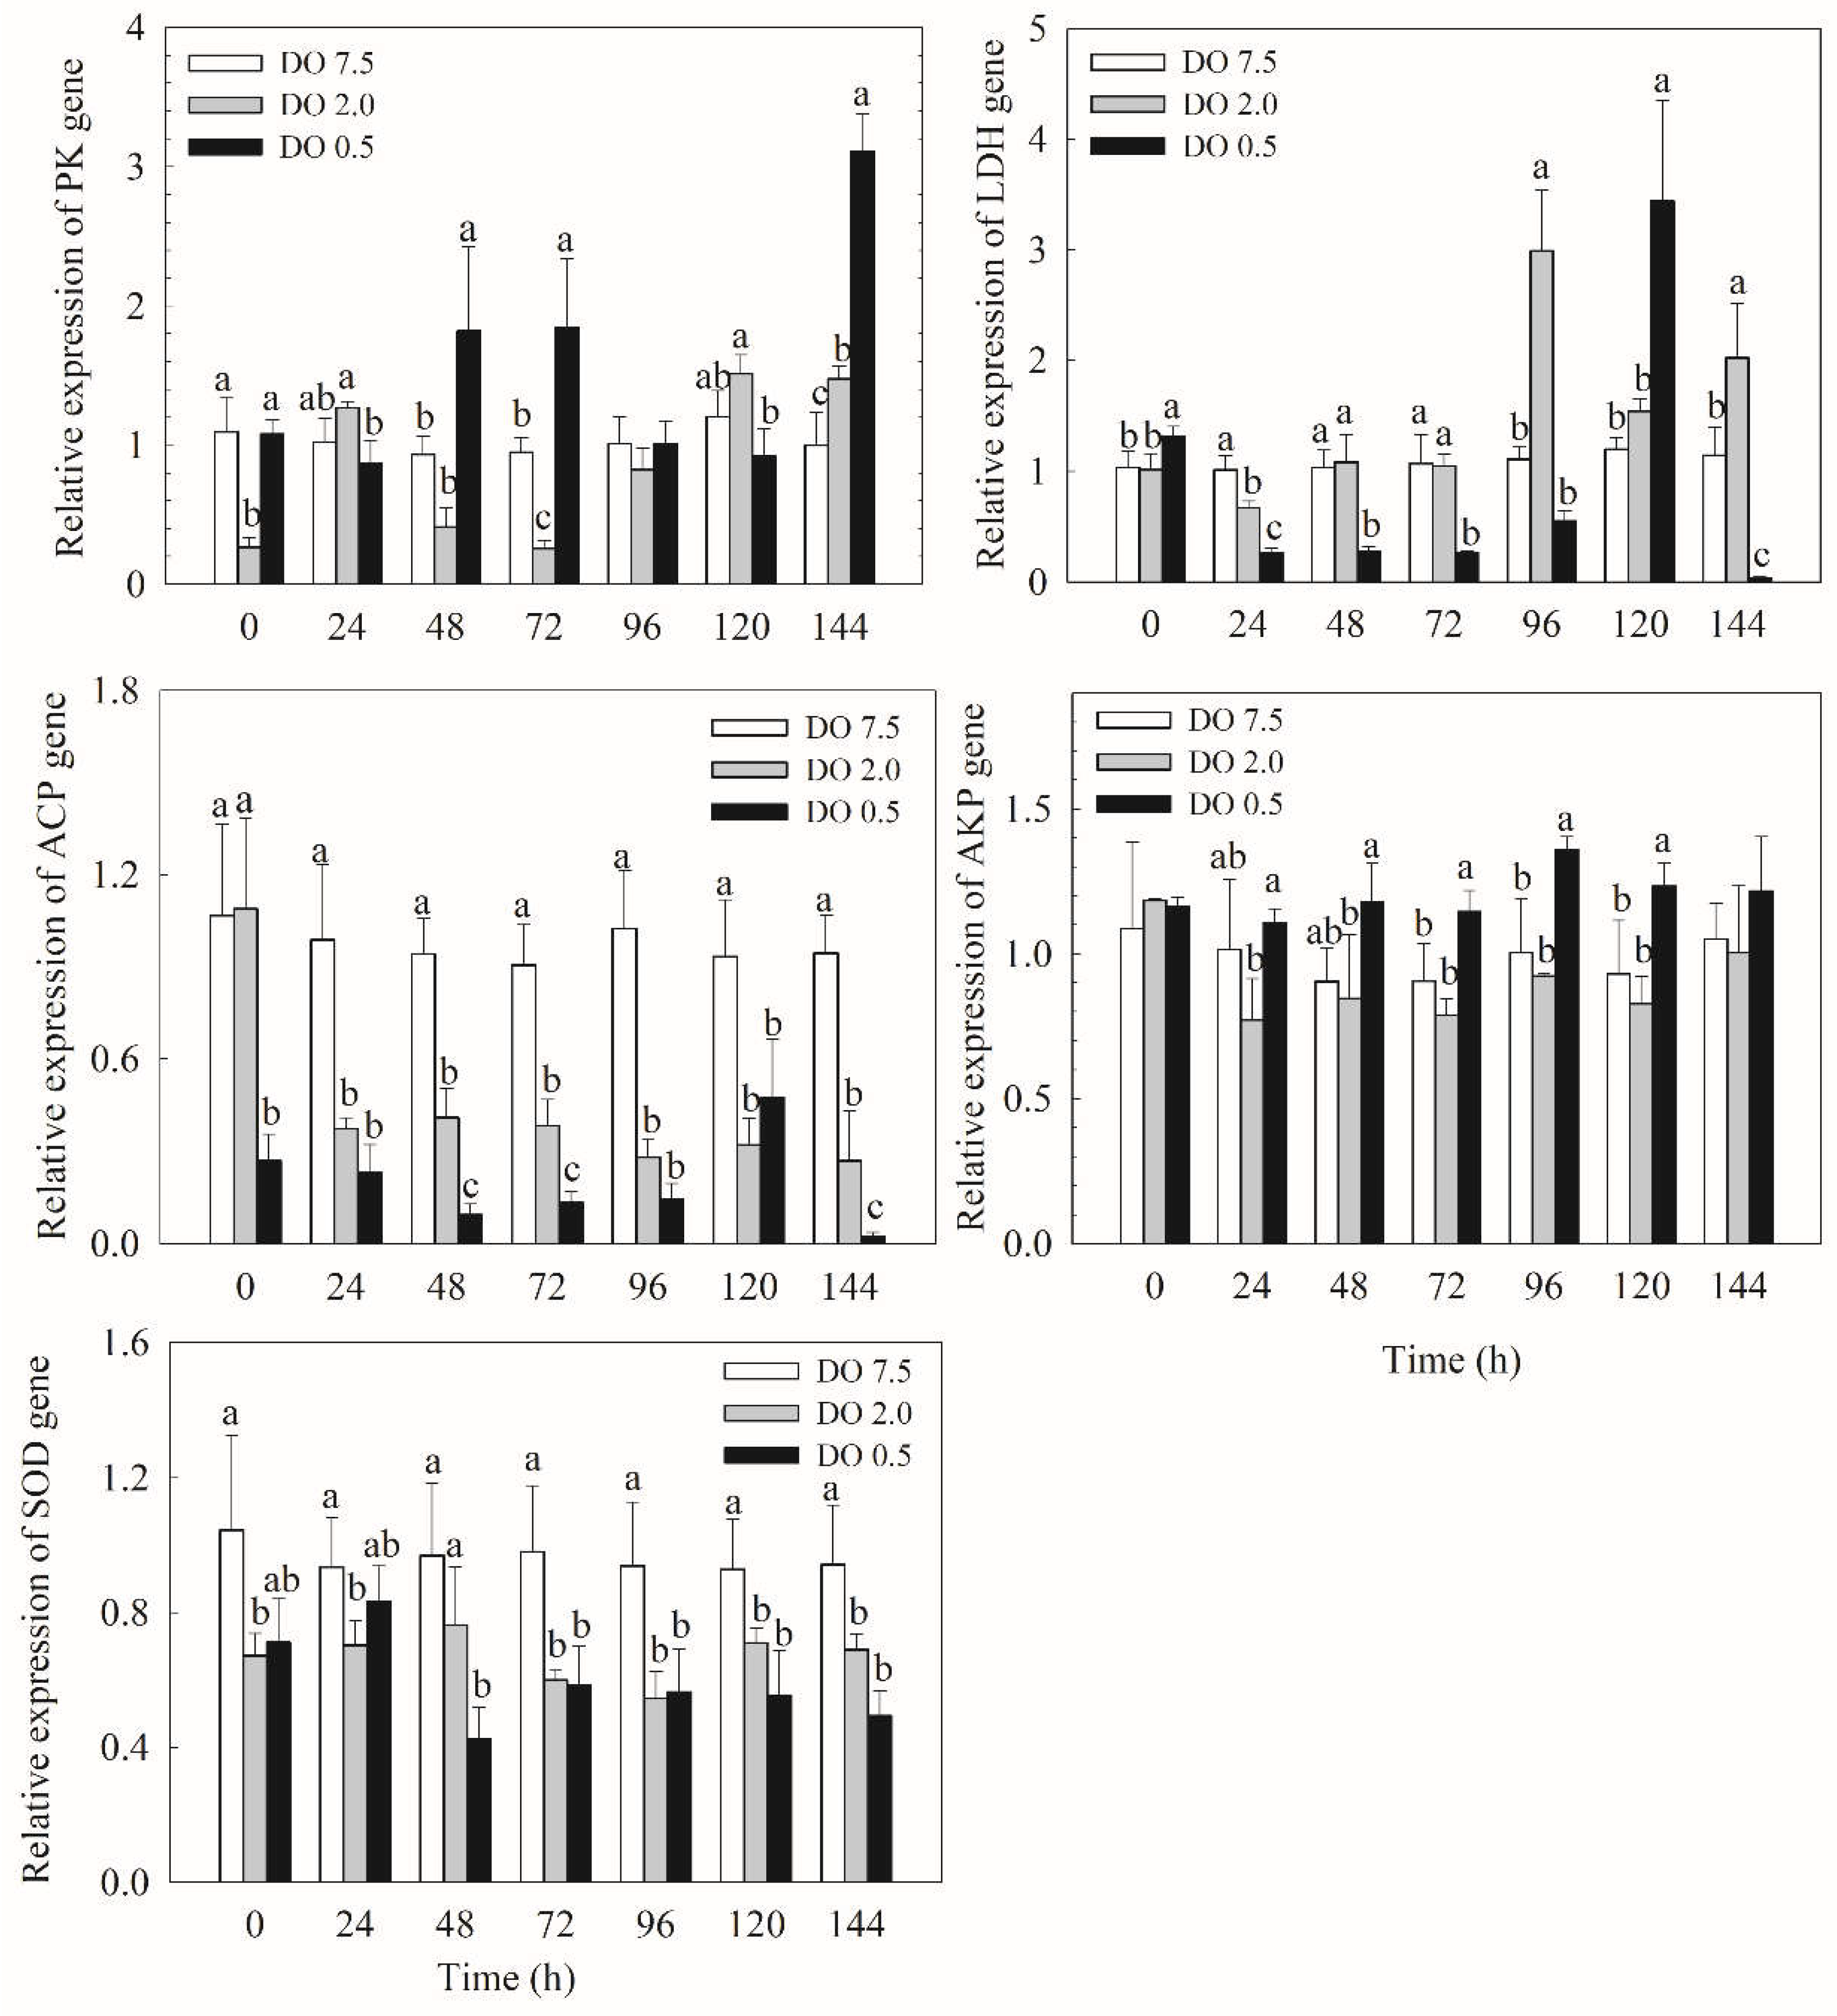

Table 1.
Primer sequences and internal reference used for qPCR.
| Gene names | Forward/reverse sequence (5′ to 3′) |
|---|---|
| LDH-F | GAGGTCGAGTCTTGGTCGTT |
| LDH-R | ACCGCTCTGCCAGTCTTCA |
| PK-F | GCATTTGTGCCATCTTGTA |
| PK-R | GCCATACCGTGTCCTCTAC |
| SOD-F | TGCCAAGGTCACATCAATC |
| SOD-R | ATGCCTACCGCACTCGTTT |
| ACP-F | AGCGTAGACACTGCTCGTA |
| ACP-R | GATGCTGGGAAACTGGGAC |
| AKP-F | GTTGTTGCTGGTAAAGATGA |
| AKP-R | CAAGTTTGGGCTGATGAAG |
| β-actin-F | GGTTCACCATCCCTCAAGTACCC |
| β-actin-R | GGGTCATCTTTTCACGGTTGG |
Disclaimer/Publisher’s Note: The statements, opinions and data contained in all publications are solely those of the individual author(s) and contributor(s) and not of MDPI and/or the editor(s). MDPI and/or the editor(s) disclaim responsibility for any injury to people or property resulting from any ideas, methods, instructions or products referred to in the content. |
© 2025 by the authors. Licensee MDPI, Basel, Switzerland. This article is an open access article distributed under the terms and conditions of the Creative Commons Attribution (CC BY) license (http://creativecommons.org/licenses/by/4.0/).
Copyright: This open access article is published under a Creative Commons CC BY 4.0 license, which permit the free download, distribution, and reuse, provided that the author and preprint are cited in any reuse.


