
Submitted:
23 April 2025
Posted:
25 April 2025
You are already at the latest version
Abstract
Natural sand and high OPC utilization in the concrete industry have affected our environment and caused climate change. This study developed a novel methodology to prepare modified sand by adding (50% R-Sand + 50% M-Sand) to replace 100% natural sand. The two SCMs (5-20% of FA) and 10% of optimized SF) were added to the four newly developed concrete mixes. The developed sustainable design mix concrete achieved the design and target strength after a curing period of 28 days. The findings for flexural strength showed comparable trends. Significant strength improvement was also seen at later curing ages till 182 days. The water absorption and sulphuric acid attacks of design mix concrete at the hardened stage were also measured. The analysis reveals that water absorption percentages tend to decline as the curing age progresses. The developed mixes show better resistance against sulphuric acid attacks than the reference mix NAC*. A mass loss of around 5% was discovered, much closer to the published studies. The developed mix 15FASFRSC showed consistent results when the modified sand (50%R-Sand+50%M-Sand) was combined with the SCMs of (15%FA+10%SF). Hence, the mix 15FASFRSC is the best sustainable mix for the concrete industry.
Keywords:
Silica fume
; fly ash
; recycled sand
; sustainable concrete
; concrete industry
1. Introduction
Sand used in the construction industry comes from regional quarries and rivers, but those sources are now depleted. River sand is a vital ingredient in concrete. The worldwide demand for river sand is much higher than the arability [1]. The construction activities are removing sand from the natural habitat, threatening the environment and the ecosystem. For instance, sand extraction has significantly impacted rivers over the past decade [2]. The severe floods experienced in India, Bangladesh, and China in recent decades have been linked to extensive sand mining, as reported by [2]. This practice can lead to accelerated riverbed and bank scouring, widening channel areas, and weakening nearby bridge foundations. Therefore, exploring alternative sources of natural sand is crucial to protect the environment and preserve the ecosystem.
Nonetheless, the worldwide increase in construction waste production is occurring at a worrisome pace. Annually, China generates approximately 1.5 billion tons of concrete waste from demolitions. The waste production is about 900 yearly by the European Union (EU) [3,4]. In response to this challenge, the EU has aimed to recycle 70% of concrete waste from building demolitions. [3,5]. Studies have shown that incorporating recycled aggregates from waste concrete into new concrete formulations can enhance their engineering properties and yield environmental benefits [6,7]. A study by [8] demonstrated that natural coarse aggregate (NCA) replacing 30% with recycled coarse aggregate (RCA) showed improvement in the hardened concrete strength. Research by [9] found that incorporating higher proportions (50-100%) of RCA in newly designed concrete mixes results in a slower rate of strength development during the initial curing days. When RCA is used in concrete, it has been observed that longer curing durations are required to reach the intended design strength. As a result, numerous published studies do not recommend substituting higher amounts of RCA for NCA in structural concrete. The development of modified recycled aggregate concrete introduced the higher replacement of RCA in new concrete [10]. Concrete’s strength, such as compressive and tensile, was reduced when higher replacement recycled aggregates were added. However, adding silica fume (SF) with recycled aggregates in new concrete found an increment in strength characteristics, especially at later ages, as reported by [11,12]. Recycled sand was introduced in the design mix concrete instead of natural sand [13]. Recycled sand was used to replace traditional sand in proportions of 30%, 50%, and 100%. The study results indicate that a strength nearly equivalent to the original was achieved at a 30% level. When the replacement reached 50%, the outcomes were deemed satisfactory, although a decrease in strength was noted. A recent study by [14] reported that incorporating up to 60% recycled sand in concrete mix designs can yield satisfactory results comparable to those achieved with natural aggregate-based reference mixes.
Utilizing alternative cementitious materials like fly ash (FA) and SF in place of cement can contribute to conserving limestone and other natural resources, as highlighted by [15]. By incorporating Supplementary Cementitious Material (SCM) such as FA and SF, the construction sector has reduced its reliance on cement. Additionally, including FA and SF in concrete manufacturing has enhanced the material’s strength and longevity [16,17,18]. In a recent study [19], researchers investigated the properties of design mix concrete when substituting 10% of Ordinary Portland Cement (OPC) with SF. Similar results were observed in other studies [19,20], which noted enhancements in strength properties when the optimal amount of SF was substituted for OPC. Consistent with these findings, a recent study [21] reported that incorporating SCMs such as SF and FA with marble powder notably boosts strength properties.
The literature survey shows that recycled fine aggregate can adequately substitute river sand. Furthermore, incorporating SF can significantly improve the engineering properties. The studies have indicated that recycled materials, including sand, can substitute river sand in concrete. Utilizing these waste materials promotes recycling, reuse, and recovery efforts in the construction industry. Moreover, incorporating recycled sand and additional cementitious components such as SF and FA can enhance the strength and longevity of the resulting concrete. This study explores the feasibility of utilizing recycled sand, SF, and FA as alternatives to river sand and OPC to develop novel concrete mix designs for the concrete industry.
2. Experimental Program
2.1. Materials
2.1.1. Binders
In this study, OPC, FA, and SF are the binding materials, as depicted in Figure 1 (a-c). In the current research, FA and SF were sourced from Abdin Construction Company in Tabuk, Saudi Arabia, and from Elkem Pvt. Ltd. Microsilica is the most revolutionary concrete additive discovered recently.
2.1.2. M-Sand and R-Sand
The manufactured sand (M-Sand) of size (≤ 5 mm) was obtained from Abdin Construction Company, Tabuk Saudia Arabia. The residue materials generated in the crushing plant while crushing the naturally crushed rocks for natural coarse aggregate (NCA) were collected and sieved in the laboratory to produce the M-Sand. The M-Sand is the waste material from the crushing plant that replaces natural river sand, which is considered sustainable sand.
The second fine aggregate, recycled sand (R-Sand), was developed from demolished concrete samples from multiple sites. These chosen samples of demolished concrete must comply with the strength standards specified by [21]. The concrete samples that fulfilled the specified criteria in [21] were collected and subsequently crushed at the aggregate processing facility of Abdin Construction Company. In Figure 2, part (a) displays M-Sand, while part (b) presents R-Sand.
2.1.3. Coarse Aggregate
This study focused on developing sustainable modified concrete by incorporating natural coarse aggregate (NCA) of particle sizes 19 mm, 12.5 mm, and 9.5 mm, blended in a proportion of 3:2:1, as shown in Figure 3(a–c).
2.1.4. Admixture
2.2. Experimental Methodologies
2.2.1. Developed Methodology for Recycled Sand Preparation
Demolished concrete primarily consists of aggregate and cement dust. This type of waste is enormous since concrete is the second most used material in the world [23]. In the initial stage of processing aggregates from concrete that has been demolished, selective demolition plays a crucial role by enabling the sorting of waste materials according to their characteristics, type, and composition [24]. Even once other materials are separated from the use of machinery, the future of demolished concrete (DC) remains uncertain. Landfills require a lot of space to dispose of concrete waste. Consequently, reusing is deemed the most viable option for handling this type of waste.
The most common method for processing demolished concrete waste is crushing, which produces aggregates of varying sizes. This method employs jaw and secondary impact crushers [25]. Jaw crushers break the concrete material along the central tension plane of compression; impact crushers work by hurling. Secondary crushing is achieved using both jaw and impact crushers [25]. Around 100 kg of sample was taken from the primary stockpile for laboratory analysis to investigate the physicochemical characteristics. In the lab, samples were screened using sieves with openings of 12.5 mm or larger. As depicted in Figure 5, any material exceeding 12.5 mm was designated for use as coarse aggregate. The crushing proceeded until 95% of the particles could pass through a 12.5 mm sieve, achieving a P95 value of 95%. In this research, the fine aggregate was sorted into three size categories: coarse recycled sand that fits through a 4.75 mm sieve, medium recycled sand that passes through a 4.75 mm sieve but is held by a 2.36 mm sieve, and fine recycled sand that goes through a 2.36 mm sieve but is retained by a 1.18 mm sieve.
2.2.2. Properties of Concrete Ingredient
The cement characteristics incorporated into this study’s design mix are within the prescribed limits. Table 1 illustrates the detailed physio-chemical attributes of the OPC employed in this research. This research involved partially replacing OPC with FA and SF. Table 1 shows that the specific gravity of FA is approximately 2.1, and that of SF is around 2.3, which is lower than the specific gravity of ordinary Portland cement (OPC). Neither fly ash nor silica fume meets the requirements for being classified as hazardous. Wherein microsilica may contain small amounts of crystalline quartz (< 0.5%).
The evaluation of water absorption and specific gravity for R-Sand and M-Sand was performed in accordance with the standard [27]. All the modified sand samples, including R-Sand and M-Sand, exhibited specific gravity values within the acceptable limits. In every sample, R-Sand (composed entirely of recycled sand) exhibited a notably higher water absorption rate than M-Sand. The enhanced absorption in R-Sand is due to its higher porosity. Table 1 presents the sand equivalent values of 92% for R-Sand and 95% for M-Sand, both of which fall within the permissible limits. A specimen is considered appropriate for concrete production if its sand equivalent value exceeds 75%.
Codes and regulations limit total dissolved solids (TDS), a key contaminant in water used for concrete, as this contaminant can influence the characteristics of concrete [28]. The water used for mixing concrete must not contain substances that could notably impact the hydration of ordinary Portland cement (OPC) or interfere with the expected reactions during mixing, placing, and curing. Water that is safe for drinking can be used to mix concrete ingredients. However, consistently relying on drinking water is not feasible due to resource limitations and costs. Studies have also shown that water not intended for drinking can be used if it complies with standard criteria [29]. This study examined the different chemical characteristics of mixing water in relation to the maximum allowable limits established by the British Standard [30]. Table 1 presents key chemical parameters such as pH, TDS, sulfate, chloride, and salinity, which are essential for assessing the strength and longevity of hardened concrete. As shown in Table 1, all the chemical properties of the mixing water are within the permissible range.
2.2.3. Optimization of Materials and Design Mixes
2.2.3.1. Silica Fume Optimization
To find the optimal SF content for the concrete mix design, various amounts of SF were used to substitute OPC in the standard mix. Based on previous studies, the dosages were set at 2.5%, 5%, 7.5%, 10%, 12.5%, and 15%. Incorporating these dosages enhanced compressive strength, with a 10% replacement of SF with OPC being identified as the threshold. Consequently, it was decided to incorporate 10% SF into the mixes formulated for this study.
2.2.3.2. Sand Optimization
Recycled sand (R-sand) contains numerous fine particles, notably impacting the fineness modulus (FM). To address this, manufactured sand (M-sand) was utilized to enhance the R-sand, ensuring it meets the FM requirements specified by the design mix using the absolute volume method [31]. Four distinct proportions of R-sand and M-sand were employed to refine the sand composition in the concrete mix design. These varying proportions were selected to assess the FM of the composite sand mixture (R-sand + M-sand). According to the standard [32], a sieve analysis of the selected sand combination was carried out to determine its fineness modulus. As detailed in Table 2, R-Sand was substituted with 20, 30, 40, and 50% of M-Sand. Fineness modulus values showed a continuous enhancement with the incorporation of 20, 30, 40, and 50% M-sand, with the most favorable outcome occurring when 50% R-sand was mixed with 50% M-sand.
2.2.3.3. Design Mix
In this research, various trail mixes were prepared to assess the strength and longevity of modified sustainable concrete. A reference mix, natural aggregate concrete (NAC*), used entirely natural components with 100% OPC to benchmark against the sustainable concrete developed in this study. Four distinct concrete mixtures were developed, incorporating fly ash, silica fume, and recycled sand (FASFRSC). Each mix contained different amounts of fly ash (ranging from 5% to 20%), silica fume (10%), and a combination of recycled and manufactured sand (50%R-sand+50%M-sand). These mixes were labeled as 5FASFRSC, 10FASFRSC, 15FASFRSC, 20FASFRSC, and 25FASFRSC, respectively. The study involved replacing river sand entirely with the 50%R-sand+50%M-sand blend. Table 3 presents the designations for sustainable concrete mixes and specifies the quantities employed for each mix. Each trail mix’s fresh characteristics were assessed to ensure they aligned with the standard requirements of the absolute volume method [33]. Dosages of superplasticizer were added to the concrete mixes to maintain 100 slumps, as presented in Table 3.
2.2.3.4. Ingradient of Design Mixes
In Figure 6, a comprehensive flow chart is presented detailing the methodology employed in this research study. To perform the mixing of ingredients listed in Table 3, the absolute volume method [33] was employed. Specimens were formulated using the standard procedure described in [34]. The strength of cylindrical specimens under both compression and tension was measured using a compression machine with a capacity of two thousand kN and a universal tensile testing machine with a capacity of one hundred kN.
3. Discussion on the Results of the Study
3.1. Strength Properties
3.1.1. Analysis of Compressive Strength Results
Concrete’s compressive strength at the 28-day is often regarded commonly as a benchmark in standard codes of practice for assessment. Past studies reveal that SCMs such as FA, SF, and R-Sand gain strength over time [17,35,36,37]. The published studies recommended evaluating the compressive strength at 28, 56, and 182 days. For this reason, in this study, the compressive was measured at 28, 56, and 182 days. In the mix, NAC*, containing 100% M-sand, was marked as a reference mix of the study. The newly prepared mixes 5FASFRSC, 10FASFRSC, 15FASFRSC, and 20FASFRSC, with varying percentages of (5-20% of fly ash), optimized (10% of silica fume), and 100% substitution of natural sand, were made with modified sand (50%R-sand+50%M-sand) respectively. Figure 7 illustrates the arrangement used to determine the compressive strength of concrete formulations. The process of preparing the samples with a sulfur cap is depicted in Figure 7 (a). The prepared samples and the samples under testing are displayed in Figure 7 (b) and (c), respectively.
In the mixtures labeled NAC*, 5FASFRSC, 10FASFRSC, 15FASFRSC, and 20FASFRSC, the compressive strength values recorded after a 28-day curing period were 38.304, 43.125, 46.041, 47.595, and 44.255 MPa, respectively. In the mixtures 5FASFRSC, 10FASFRSC, 15FASFRSC, and 20FASFRSC, the increase compared to the conventional concrete mixt NAC* was observed to be 12.59%, 20.19%, 24.26%, and 15.54%, as illustrated in Figure 7. The design and target strength f’c and f’cr of the mixes 5FASFRSC, 10FASFRSC, 15FASFRSC, and 20FASFRSC conform 30 and 38 MPa as detailed in [21,38]. The findings indicated that these concrete mixtures performed effectively, satisfying the design strength standards at 28 days [21,38]. During the 28-day curing period, the prepared mixes 5FASFRSC, 10FASFRSC, 15FASFRSC, and 20FASFRSC met all standard design and target strength criteria.
By the time 56 days of curing have passed, the compressive strengths of the formulations NAC*, 5FASFRSC, 10FASFRSC, 15FASFRSC, and 20FASFRSC were recorded as 40.014, 45.695, 48.981, 51.899, and 46.915 MPa, respectively. Each mix exceeded the target strength (f’cr) of 38 MPa at the 56-days. Figure 7 illustrates the percentage increases in the mixes 5FASFRSC, 10FASFRSC, 15FASFRSC, and 20FASFRSC after a curing period of 56 days relative to the reference mix NAC*. These increases were recorded as 14.19%, 22.41%, 29.7%, and 18.91%, respectively. The mix 15FASFRSC exhibited the most significant percentage increase at 56 days, reaching approximately 29.7% compared to the reference blend NAC*. The combination of modified sand, consisting of 50% R-Sand and 50% M-Sand, along with a mix of 15% FA and 10% SF, demonstrates good performance for up to 56 days in the 15FASFRSC mix.
Following a curing interval of 182 days, the compressive strengths for the mixes NAC*, 5FASFRSC, 10FASFRSC, 15FASFRSC, and 20FASFRSC were recorded as 43.104, 50.985, 53.941, 56.517, and 51.255 MPa, respectively. The data indicated a consistent increase in strength as time progressed. Figure 7 illustrates the percentage increments in compressive strength for the formulations 5FASFRSC, 10FASFRSC, 15FASFRSC, and 20FASFRSC at 182 days compared to the reference mix NAC, which were 18.28%, 25.14%, 31.12%, and 17.25%, respectively. At the 182 days, the percentage increases for the mixes 10FASFRSC and 15FASFRSC surpassed those of 5FASFRSC and 20FASFRSC. It suggests that the optimal percentage of SCMs was between 10-15% FA and 10% optimized SF. Additionally, it has been noted that compressive strength continues to rise at later stages.
Figure 7 clearly illustrates that the compressive strength of the 5FASFRSC, 10FASFRSC, 15FASFRSC, and 20FASFRSC mixtures was improved by substituting OPC with a blend of FA and SF. The study’s findings indicate a consistent enhancement in the compressive strength of the mixtures, as mentioned above. The mix labeled 15FASFRSC exhibited the highest level of compressive strength., which included modified sand with a composition of 50% R-Sand and 50% M-Sand, along with SCMs (15% FA + 10% SF). A decline in compressive strength was observed when the mixture was composed of 20% FA and 10% SF. The analysis has concluded that the optimal strength is attained when 25% of the overall OPC content is replaced with SCMs, comprising 15% FA and 10% SF, in the 15FASFRSC mixture.
Another factor in increasing strength was the precise percentage of R-Sand utilization. When the optimized R-Sand was mixed with cement, a large surface area of finely ground particles of R-Sand was created, ultimately increasing the cement-sand bond. As a result, the mixtures’ compressive strength was increased. Additionally, the increase in strength in the mixture might be attributed to the continued hydration of the remaining cement particles within the R-Sand. Initially, the amended R-Sand within the mixtures surrounding the aggregates remains weak. This also relies on the amount of R-Sand that still contains the visible cement matrix from the old concrete. Over time, the gel interacts with the cement that remains non-hydrated from the previous layer. This secondary hydration of R-Sand could occur due to the combination of (FA+SF) with R-Sand. Ultimately, it can be concluded that the mix 15FASFRSC, which combines SCMs (15%FA+10%SF) with 100% natural sand replaced by (50%R-Sand+50%M-Sand), exhibited the highest strength at all curing stages compared to the other mixes.
3.1.2. Flexural Strength Evaluation
The term „tensile strength” refers to the capacity of concrete to resist breaking or fracturing when subjected to tension. These forces exert a „pulling” effect that opens the transition zones in the concrete, including the binder that inhibits the dispersion of aggregates. Cracks form when the tensile forces surpass the material’s tensile strength. Regular concrete exhibits a much higher compressive strength compared to its tensile strength. Because directly testing concrete for tensile strength is complex, indirect methods such as flexural strength (FS) tests are used [39]. The experimental setup is presented in Figure 9. Figure 9 (a) and (b) show the beam sample in testing and the dimension of the sample as per the standard requirement of [39].
This research study examined the FS of the designated mixtures NAC*, 5FASFRSC, 10FASFRSC, 15FASFRSC, and 20FASFRSC over curing intervals of 28, 56, and 182 days. The procedure described in [39] assessed each mixture’s FS. The requirement of FS was (10-15%) of (f’c = 30MPa), as suggested by [39]. For this criterion, the sustainable concrete developed should have an average FS ranging from 3 to 4.5 MPa. To assess the average FS value for each specified mix NAC*, 5FASFRSC, 10FASFRSC, 15FASFRSC, and 20FASFRSC, the peak load (P) of each sample was measured. As depicted in Figure 9, samples are tested to determine the maximum load (P) for each. For each mixture, the FS value was determined by applying the maximum load (P) as specified in Eq. 1. The FS outcomes are expressed in MPa, with the maximum load (P) measured in Newtons and the length (L) in millimeters, and both failure width (b) and failure depth (d) in millimeters, as outlined in Eq. 1.
As illustrated in Figure 10, following a 28-day curing period, the FS values for the mixtures NAC*, 5FASFRSC, 10FASFRSC, 15FASFRSC, and 20FASFRSC were recorded as 4.12, 4.90, 5.56, 6.42, and 5.85 MPa, respectively. The developed mixes NAC*, 5FASFRSC, 10FASFRSC, 15FASFRSC, and 20FASFRSC FS values were recorded at 13.7%, 16.3%, 18.5%, 21.4%, and 19.5% of the concrete’s design capacity (f’c). The FS findings for the mixtures labeled 5FASFRSC, 10FASFRSC, and 15FASFRSC showed a steady increase, whereas a sudden decrease was observed in the mix 20FASFRSC. Hence, all samples at 28 days of the curing period successfully passed the criterion of (10-15%) design strength (f’c) of developed concrete.
Following a 56-day curing period, the FS results for the mixes NAC*, 5FASFRSC, 10FASFRSC, 15FASFRSC, and 20FASFRSC were 4.56, 5.65, 6.39, 7.23, and 6.31 MPa, respectively. These FS values corresponded to 15.2%, 18.8%, 21.3%, 24.1%, and 21% of the concrete’s f’c. A consistent increase in FS values was observed for the 5FASFRSC, 10FASFRSC, and 15FASFRSC mixes, while a sudden decrease was noted in the 20FASFRSC mix. Nevertheless, all samples exceeded the design strength criterion of (10-15%) (f’c) for concrete after 56 days of curing.
Following a curing period of 182 days, the FS outcomes for the mixtures NAC*, 5FASFRSC, 10FASFRSC, 15FASFRSC, and 20FASFRSC were 4.98, 6.19, 6.98, 7.76 and 6.65 MPa. The mixes NAC*, 5FASFRSC, 10FASFRSC, 15FASFRSC, and 20FASFRSC STS values were recorded at 16.6%, 20.6%, 23.2%, 25.8%, and 22.1% of concrete’s design mix (f’c). The FS outcomes for the mixtures 5FASFRSC, 10FASFRSC, and 15FASFRSC showed a steady increase, whereas a sudden decrease was observed in the mix 20FASFRSC. However, all samples surpassed the criterion of (10-15%) concrete design capacity (f’c) at an interval of 182 days curing period compared to 56 days.
The analysis of the results of the study has revealed several interesting observations. It has been reported that the FS results improve with time. Adding SCM materials (FA+SF) combined with R-Sand gains strength at later stages. The inert materials present in FA, SF, and R-Sand react later, forming extra calcium silicate hydrate gel in the paste and refining paste quality at later ages, such as 56 and 182 days, and ultimately, FS strength values increased. By integrating the FA and SF mixture with a 50% blend of R-Sand and M-Sand in the compositions 5FASFRSC, 10FASFRSC, 15FASFRSC, and 20FASFRSC, the mixes exhibit ductile characteristics, which subsequently improve the interfacial transition zone (ITZ) that FS relies on. Combining 50% R-Sand with 50% M-Sand and adding FA and SF also contributed to the development of elastic behavior in these mixes. Consequently, the beam samples exhibited increased strength in these mixtures. The study’s refined sand technique, combined with FA and SF, successfully enhances the cracking load and diminishes the brittleness of the 5FASFRSC, 10FASFRSC, 15FASFRSC, and 20FASFRSC mixes, respectively. Therefore, it was concluded that this effect was most pronounced in the mix 15FASFRSC, where the combination of SCMs (15%FA+10%SF) with 100% natural sand replaced by (50%R-Sand+50%M-Sand) achieved the highest performance at all curing stages compared to the other mixes.
3.1.3. Stress-Strain Characteristics Under Compression
The stress-strain curves are present in Figure 11. All specimens show almost the same initial slope, representing the elasticity modulus of concrete (Ec), except for 5FASFRSC. It is believed to be due to a testing glitch and not due to sample properties. The modulus of elasticity of the NAC* is about 27GPa, which coincides with the value (4700sqrt (fc’)) obtained by the America Concrete Institute (ACI) code of practice. The modulus of elasticity for 10FASFRSC 15FASFRSC is found from the graphs to be about 28.5 GPa, below the expected value of about 31.1GPa according to the ACI formula. For 20FASFRSC, while the strength of the sample is lower than the 15FASFRSC sample, the modulus of elasticity is higher. This indicates a significant change in the mix’s properties and diverges from the ACI equation’s predictions regarding the modulus of elasticity. Considering the failure strain, excluding sample 5FASFRSC due to the testing issue and sample 20FASFRSC, which shows low failure strain, all other three specimens showed a typical failure strain of 0.16%. However, all samples have different failure strain values, which are reported to be close to acceptable limits.
3.2. Characteristics of Durability Properties
3.2.1. Absorption of Water in Hardened Concrete
Figure 11 illustrates the water absorption levels for the prepared mixes NAC*, 5FASFRSC, 10FASFRSC, 15FASFRSC, and 20FASFRSC. The increase in water absorption was more pronounced in the mixtures 5FASFRSC, 10FASFRSC, 15FASFRSC, and 20FASFRSC when the combination of (FA+SF) was used with (50%R-Sand+50%M-Sand) compared to the reference mix NAC*.
In the mixes labeled NAC*, 5FASFRSC, 10FASFRSC, 15FASFRSC, and 20FASFRSC, water absorption rates were measured after 28 days of curing, showing values of 2.55%, 2.75%, 2.89%, 2.85%, and 2.96%, respectively. At the 56 days, these rates were recorded as 2.28%, 2.61%, 2.76%, 2.68%, and 2.98%, respectively. Additionally, at 182 days of curing, the water absorption percentages were 2.07%, 2.38%, 2.62%, 2.58%, and 2.79%. The trend observed indicates that as the curing period extended, there was a noticeable reduction in water absorption levels. The reactive silica found in FA and SF interacts with the byproducts of hydration produced by OPC, forming additional CSH gel at later curing stages. This results in a denser concrete matrix, which inhibits further water absorption. The pozzolanic activity of microsilica contributes to blocking the pores in the concrete, and by filling these pores, it reduces their size, making it more difficult for water to penetrate, thereby decreasing water absorption and improving durability. The findings of this study align with those reported in recent publications [7,17,37,40].
Decreasing pattern of water absorption was observed in mixtures 5FASFRSC, 10FASFRSC, 15FASFRSC, and 20FASFRSC with the combination of SCM (FS+SF) with modified sand composition (50%R-sand+50%M-sand) at intervals of 28, 56, and 182 days. As discussed earlier, the straightforward reason for this decline is the production of extra CSH gel. The threshold of this phenomenon was reached in the mix 15FASFRSC by adding 15% FA and 10% SF, combined with a sand mixture that was adjusted to consist of 50% R-Sand and 50% M-Sand. Once the sample testing was reached in the mix, a 20FASFRCC slight increase in the water absorption was recorded. This is because the fine particles in the mix reach the maximum value, and from this point on, the mix starts absorbing water in empty pores created by losing the fine particles from the mix. Hence, it can be concluded from the discussion that the maximum amount of fine particles in the concrete mix is also essential to deciding the durability of concrete mix with SCMs.
3.2.2. Sulphuric Acid Attack
Concrete’s response to acid must be examined as part of any research on the material’s durability characteristics. It is essential to assess how resistant concrete is against acid attacks. Extensive chemical exposure can cause acid corrosion to concrete used in manufacturing. Because of air pollution, rain also contains acids. Rain causes chemical processes that increase the acidity of the air and raise the atmospheric concentrations of nitrogen dioxide and sulphur dioxide. Nitric, sulphuric, and carboxylic acids make up most of the rain. It must be tested in various acid solutions to determine how resistant and vulnerable hardened concrete is. Concrete deteriorates when the acids and bases in the mixture mix to create salts that dissolve in water. In the current study, the ability of modified sand (50%R-Sand+50%M-Sand) with varying percentages (5-20%) of FA and 10% optimized SF in newly developed concrete was examined to withstand in 5% sulphuric acid (H2SO4) solution.
The silica fume (SF) has a sulphate ion charge which showed resistance against the (H2SO4) attack. The published studies define the deterioration of concrete samples by the reaction shown in Eq. 1, 2, and 3 (Khodabakhshian et al., 2018; Thomas, Gupta, & Panicker, 2016). Eq. 2 shows that the hydroxide compound of calcium found in the concrete reacts with sulphuric acid and turns into hydrated salt of calcium sulphate, also known as gypsum. However, Eq. 3 exhibits the hydrated calcium silicate reaction with sulphuric acid, which forms calcium sulphate and silicon tetra hydroxide with water. Also, calcium aluminate reacts with the hydrated salt of calcium; it changes into calcium-aluminum sulphate and water, as shown in Eq. 4.

The pH of the sulfuric acid solution was determined using a pH meter. H2SO4, with a purity level of 97%, was obtained from Sigma-Aldrich and utilized to create a 5% sulfuric acid solution. A 5% H2SO4 solution was introduced each week to ensure the pH remained within the target range of 1.04 ± 0.1. The sulphuric acid concentrations in the solution container were stirred thrice weekly to avoid the changes.
The sulphuric acid resistance was evaluated by measuring the mass loss after immersion in a H2SO4 solution for 28, 56, 91, and 182 days. The time interval for mass loss was extended as the mass loss values differed slightly. Four mass loss observation intervals were taken to determine the actual results. The residual compressive strength of the developed mixes was assessed in the same manner as the compressive strength for standard curing periods of 28, 56, and 182 days following immersion in a 5% H2SO4 solution. This approach ensured consistency in the results and allowed for comparison with compressive strength under normal conditions. Following 28 days of standard curing, the specimens were extracted. The original mass of each sample was calculated at a saturated surface dry (SSD) state after 28 days of normal curing. Each mix produced three concrete cylinders, measuring 75 mm in diameter and 150 mm in height, which were placed in a 5% H2SO4 solution for submersion. Figure 13 (a) shows the sample in the container with 5% sulphuric acid solution in an incubator. The samples were taken out after completing the immersion time and exposure to room temperature until they reached the saturated surface dry (SSD) state shown in Figure 13 (b), and finally, Figure 13 (c) shows the samples under compressive strength testing.
3.2.2.1. Change of Mass of Concrete Samples in Sulphuric Acid Solution
The mass measurements were retaken after 28, 56, 91, and 182 days of sulphuric acid immersion. The percentage of mass loss after 28, 56, 91, and 182 days of sulphuric acid immersion was calculated according to Eq. 5.
Mass before immersion is donated by β1, and mass after immersion is donated by β2. Figure 14 reported the change of mass of the developed concrete mixes after an immersion time of 28, 56, 91, and 182 days. The reference mix NAC* exhibited mass losses of 4.68%, 4.73%, 4.93%, and 4.88% at 28, 56, and 182 days, respectively. The mass loss in the mixes 5FASFRSC, 10FASFRSC, 15FASFRSC, and 20FASFRSC at 28, 56, 91, and 182 days was found (4.43, 4.47, 4.78, and 4.67%), (4.32, 4.59, 4.66, and 4.56%), (4.24, 4.51, 4.57, 4.49%) and (4.36, 4.64, 4.69, 4.62%) respectively.
The results showed maximum deterioration occurred when specimens were submerged in a 5% H2SO4 solution for 28 days. The reaction between H2SO4 and calcium hydroxide in the samples results in the formation of hydrated calcium sulfate, known as gypsum, which precipitates in the solution. This could explain why the samples experienced the most significant mass loss after being immersed for up to 28 days. This trend was seen in all the mixes; when the immersion time increases beyond 28 days, the neutralization reaction slows down due to the slight variation in the pH of the solution. Consequently, only slight differences in mass loss were observed at the later intervals of 56, 91, and 182 days.
The mixes containing 10% SF show better resistance against sulphuric acid attacks than the reference mix NAC* without SF. The decrease in mass loss observed with the addition of SF is due to the reaction between SF and calcium hydroxide in the samples, which forms calcium silicate. When FA and SF are combined with water, they undergo a silicate reaction that produces extra C-S-H gel. The C-S-H gel obtained and combined with sulphuric acid, formed hydrated calcium sulphate (gypsum) and silica gel presented in Eq. 5.
Furthermore, the fine particles of (FA+SF) filled the concrete’s micropores, consequently reducing permeability and porosity, thus helping to improve its ability to resist sulphuric acid attack. The deterioration of concrete decreases with the addition of (FA+SF). The microsilica fume lowers the amount of calcium hydroxide in the binder matrix. It changes chemical composition into C-S-H gel through a pozzolanic reaction, as shown in the above Eq. 5. When exposed to an acidic environment, (FA+SF) concrete experiences a reduction in the formation of water-soluble salts compared to regular concrete, resulting in a lower degree of mass loss. It makes the acid resistance stronger.
The present study is based on newly developed concrete, so the direct comparison is invalid. However, the present study’s findings closely match the published study’s (Khodabakhshian et al., 2018). In the study (Khodabakhshian et al., 2018), 10% SF was partially replaced by OPC in the concrete mix design and immersed in a 5% sulphuric acid solution. A mass loss of around 5% was discovered, as in our study of developed mixes 5FASFRSC, 10FASFRSC, 15FASFRSC, and 20FASFRSC, respectively.
3.3.2.2. Variation in the Compressive Strength of Concrete Exposed to a Sulfuric Acid Solution
Samples were taken out to perform a compressive strength test after being incubated for 28, 56, and 182 days in a 5% sulphuric acid solution. The mean value derived from three identical specimens was used to assess the decrease in compressive strength for each formulated mix. Figure 15 illustrates the percentage decrease in compressive strength following 28, 56, and 182 days of exposure to 5% sulfuric acid. Figure 15 showcases the graphs for the NAC*mixes labeled as 5FASFRSC, 10FASFRSC, 15FASFRSC, and 20FASFRSC, respectively. Over 28, 56, and 182 days, the reference mix NAC* experienced a reduction in compressive strength by 6.55%, 7.2%, and 7.69%, respectively. The percentage reduction of compressive strength in the mixes 5FASFRSC, 10FASFRSC, 15FASFRSC, and 20FASFRSC at 28, 56, and 182 days was found (4.79, 5.37, and 5.99%), (4.09, 4.67, and 5.54%), (3.34, 3.88, and 4.4%) and (3.95, 4.23, and 4.44%) respectively. When 10% of OPC is substituted with SF and varying amounts of FA (ranging from 5% to 20%) in the mixes 5FASFRSC, 10FASFRSC, 15FASFRSC, and 20FASFRSC, the decrease in compressive strength is less pronounced compared to the reference mix NAC*.
As previously mentioned, the combination of (FA+SF) notably enhanced the compressive strength and reduced the newly developed concrete’s porosity when mixed with the modified sand blend (50%R-Sand+50%M-Sand). It has been discovered that developed modified sand with (FA+SF) content enhances the resistance against sulphuric acid attack. However, the present study is based on newly developed modified sand concrete, so the direct comparison is invalid. The findings of the current study are consistent with existing research that employs 10%SF as a partial substitute in concrete to resist sulphuric acid damage (Hewayde, Nehdi, Allouche, & Nakhla, 2007; Khodabakhshian et al., 2018; Thomas et al., 2016).
4. Conclusions
This study studied four mixes containing varying amounts of fly ash ranging from 5% to 20%, 10% of optimal SF, and a modified sand blend of 50% R-sand and 50% M-sand. This investigation sought to integrate waste materials into concrete design mixtures to advance sustainability in the concrete industry. The study’s key conclusions are as follows:
- Concrete from fly ash, silica fume, and recycled sand exhibited better mechanical properties and maintained adequate durability.
- The four sustainable concrete formulations, including fly ash, silica fume, and recycled sand, successfully met the 30 MPa and 38 MPa compressive strength requirements, as ACI 318-19 outlined.
- 3. At the intervals of 28, 56, and 182 days, the compressive strength of the developed mixes 5FASFRSC, 10FASFRSC, 15FASFRSC, and 20FASFRSC consistently outperformed the reference mix NAC*.
- At 28 days, the flexural strength of the 5FASFRSC, 10FASFRSC, 15FASFRSC, and 20FASFRSC formulations was found to be 16.3%, 18.5%, 21.4%, and 19.5% of the concrete’s design strength (f’c), respectively. These values comply with the ASTM-C496/C496M-11 standard, which requires them to be between 10% and 15% of the (f’c).
- The absorption of water at 28, 56, and 182 days in the mixes 5FASFRSC, 10FASFRSC, 15FASFRSC, and 20FASFRSC with the combination of SCMs (FS+SF) along with modified sand combination (50%R-Sand+50%M-Sand) found decreasing pattern. The threshold was reached in the mix 15FASFRSC with the combination of (15%FA+10%SF) and a modified sand combination (50%R-Sand+50%M-Sand).
- The developed mixes 5FASFRSC, 10FASFRSC, 15FASFRSC, and 20FASFRSC show better resistance against sulphuric acid attacks than the reference mix NAC*. The mixture labeled 15FASFRSC yielded consistent results when the fine aggregate was optimally balanced with a 50/50 combination of R-Sand and M-Sand and supplemented with cementitious materials comprising 15% FA and 10% SF.
- It is concluded that up to 25% OPC with optimized SCMs (15%FA+10%SF) and 100% river sand with (50%R-Sand+50%M-Sand) could be replaced in the formulation of concrete mixtures for the building sector.
Acknowledgments
We highly acknowledge the help extended to the FBSU Laboratory.
Abbreviations
| Flyash | FA |
| Silica Fume | SF |
| R-Sand | Recycled Sand |
| M-Sand | Manufactured Sand |
| Supplementary Cementitious Materials | SCMs |
| Natural Coarse Aggregate | NCA |
| Ordinary Portland Cement | OPC |
| Compressive strength | CS |
| Flexural Strength | FS |
References
- H. Song, G. Gu, and Y. Cheng, „Experimental Study on River Sand Replacement in Concrete,” in IOP Conference Series: Earth and Environmental Science, 2020, vol. 567, no. 1: IOP Publishing, p. 012013.
- M. Bendixen, J. Best, C. Hackney, and L. L. Iversen, „Time is running out for sand,” ed: Nature Publishing Group, 2019.
- P. V. Sáez, M. Merino, and C. Porras-Amores, „Managing construction and demolition (C&D) waste–a European perspective,” in International Conference on Petroleum and Sustainable Development, 2011, vol. 26, pp. 27-31.
- C. Fischer, M. Werge, and A. Reichel, „EU as a Recycling Society,” European Topic Centre on Resource Waste Management, Working Paper 2/2009, 2009.
- V. Monier, S. Mudgal, M. Hestin, M. Trarieux, and S. Mimid, „Service contract on management of construction and Demolition Waste–SR1,” Final Report Task, vol. 2, p. 240, 2011.
- Mistri, A.; Bhattacharyya, S.K.; Dhami, N.; Mukherjee, A.; Barai, S.V. A review on different treatment methods for enhancing the properties of recycled aggregates for sustainable construction materials. Constr. Build. Mater. 2020, 233. [Google Scholar] [CrossRef]
- J. Akhtar and M. Akhtar, „Enhancement in properties of concrete with demolished waste aggregate,” GE-International Journal of Engineering Research, vol. 2, no. 9, pp. 73-83, 2014.
- M. Monish, V. M. Monish, V. Srivastava, V. Agarwal, P. Mehta, and R. Kumar, „Demolished waste as coarse aggregate in concrete,” J. Acad. Indus. Res, vol. 1, no. 9, pp. 540-542, 2013.
- Tripura, D.D.; Raj, S.; Mohammad, S.; Das, R. Suitability of Recycled Aggregate as a Replacement for Natural Aggregate in Construction. SP-326: Durability and Sustainability of Concrete Structures (DSCS-2018). LOCATION OF CONFERENCE, COUNTRYDATE OF CONFERENCE; pp. 37.1–37.10.
- Feng, W.; Wang, Y.; Sun, J.; Tang, Y.; Wu, D.; Jiang, Z.; Wang, J.; Wang, X. Prediction of thermo-mechanical properties of rubber-modified recycled aggregate concrete. Constr. Build. Mater. 2022, 318. [Google Scholar] [CrossRef]
- Yunchao, T.; Zheng, C.; Wanhui, F.; Yumei, N.; Cong, L.; Jieming, C. Combined effects of nano-silica and silica fume on the mechanical behavior of recycled aggregate concrete. Nanotechnol. Rev. 2021, 10, 819–838. [Google Scholar] [CrossRef]
- Feng, W.; Tang, Y.; Zhang, Y.; Qi, C.; Ma, L.; Li, L. Partially fly ash and nano-silica incorporated recycled coarse aggregate based concrete: Constitutive model and enhancement mechanism. J. Mater. Res. Technol. 2022, 17, 192–210. [Google Scholar] [CrossRef]
- Ju, M.; Jeong, J.-G.; Palou, M.; Park, K. Mechanical Behavior of Fine Recycled Concrete Aggregate Concrete with the Mineral Admixtures. Materials 2020, 13, 2264. [Google Scholar] [CrossRef] [PubMed]
- M. N. Akhtar, Z. Ibrahim, N. M. Bunnori, M. Jameel, N. Tarannum, and J. Akhtar, „Performance of sustainable sand concrete at ambient and elevated temperature,” ed: Elsevier, 2021.
- K. C. Williams and P. Partheeban, „An experimental and numerical approach in strength prediction of reclaimed rubber concrete,” Advances in concrete construction, vol. 6, no. 1, p. 87, 2018.
- Akhtar, J.N.; Khan, R.A.; Akhtar, M.N.; Thomas, B.S. A comparative study of strength and durability characteristics of concrete and mortar admixture by bacterial calcite precipitation: A review. Mater. Today: Proc. 2023. [Google Scholar] [CrossRef]
- Akhtar, M.N.; Jameel, M.; Ibrahim, Z.; Bunnori, N.M. Incorporation of recycled aggregates and silica fume in concrete: an environmental savior-a systematic review. J. Mater. Res. Technol. 2022, 20, 4525–4544. [Google Scholar] [CrossRef]
- Alhajiri, A.M.; Akhtar, M.N. Enhancing Sustainability and Economics of Concrete Production through Silica Fume: A Systematic Review. Civ. Eng. J. 2023, 9, 2612–2629. [Google Scholar] [CrossRef]
- Mehta, A.; Kar, D.; Ashish, K. Silica fume and waste glass in cement concrete production: A review. J. Build. Eng. 2020, 29, 100888. [Google Scholar] [CrossRef]
- Ashish, D.K.; Verma, S.K. An overview on mixture design of self-compacting concrete. Struct. Concr. 2018, 20, 371–395. [Google Scholar] [CrossRef]
- ACI-318, „Building code requirements for structural concrete (ACI 318-08) and commentary,” 2008: American Concrete Institute.
- High-Range, G Water-Reducing and Retarding Admixture, ASTM-C-494/C-494M, 2005.
- Klee, H.; Coles, E. The cement sustainability initiative – implementing change across a global industry. Corp. Soc. Responsib. Environ. Manag. 2004, 11, 114–120. [Google Scholar] [CrossRef]
- Coelho and, J. de Brito, „Economic analysis of conventional versus selective demolition—A case study,” Resources, Conservation and Recycling, vol. 55, no. 3, pp. 382-392, 2011.
- Ulsen, C.; Tseng, E.; Angulo, S.C.; Landmann, M.; Contessotto, R.; Balbo, J.T.; Kahn, H. Concrete aggregates properties crushed by jaw and impact secondary crushing. J. Mater. Res. Technol. 2019, 8, 494–502. [Google Scholar] [CrossRef]
- Gebremariam, A.T.; Di Maio, F.; Vahidi, A.; Rem, P. Innovative technologies for recycling End-of-Life concrete waste in the built environment. Resour. Conserv. Recycl. 2020, 163. [Google Scholar] [CrossRef]
- Standard Test Method for Density, Relative Density (specific gravity), and Absorption of Fine Aggregates,” ed,, ASTM-C128-88, 2001.
- Aldossary, M.H.A.; Ahmad, S.; Bahraq, A.A. Effect of total dissolved solids-contaminated water on the properties of concrete. J. Build. Eng. 2020, 32. [Google Scholar] [CrossRef]
- Su, N.; Miao, B.; Liu, F.-S. Effect of wash water and underground water on properties of concrete. Cem. Concr. Res. 2002, 32, 777–782. [Google Scholar] [CrossRef]
- BS-3148, „Method for test for water for making concrete. London: British standard institute.,” 1980.
- ACI-211.1, „Standard practice for selecting proportions for normal, heavyweight, and mass concrete,” in American Concrete Institute, 1991.
- ASTM-C136-06, „Standard Test Method for Sieve Analysis of Fine and Coarse Aggregates,” 2006.
- Standard practice for selecting proportions for normal, heavyweight, and mass concrete, ACI-211.1-91, Nov. 1, 1991 1991.
- Standard Practice for Making and Curing Concrete Test Specimens, ASTM-C31/C31M-19a, 2019.
- Akhtar, M.N.; Bani-Hani, K.A.; Malkawi, D.A.; Albatayneh, O. Suitability of sustainable sand for concrete manufacturing - A complete review of recycled and desert sand substitution. Results Eng. 2024, 23. [Google Scholar] [CrossRef]
- M. Akhtar and J. Akhtar, „Suitability of Class F Flyash for Construction Industry: An Indian Scenario,” International Journal of Structural and Construction Engineering, vol. 12, no. 9, pp. 892-897, 2018.
- Akhtar, M.N.; Jameel, M.; Ibrahim, Z.; Bunnori, N.M.; Bani-Hani, K.A. Development of sustainable modified sand concrete: An experimental study. Ain Shams Eng. J. 2023, 15. [Google Scholar] [CrossRef]
- ACI-214R-11, „Guide to evaluation of strength test results of concrete,” 2011: American Concrete Institute.
- C. ASTM, „C293, Standard test method for flexural strength of concrete (using a simple beam with centre-point loading), ASTM Int,” West Conshohocken, 2016.
- Rais, M.S.; Khan, R.A. Strength and durability characteristics of binary blended recycled coarse aggregate concrete containing microsilica and metakaolin. Innov. Infrastruct. Solutions 2020, 5, 1–13. [Google Scholar] [CrossRef]
Figure 1.
(a) Cement, (b) flyash, and (c) silica fume.
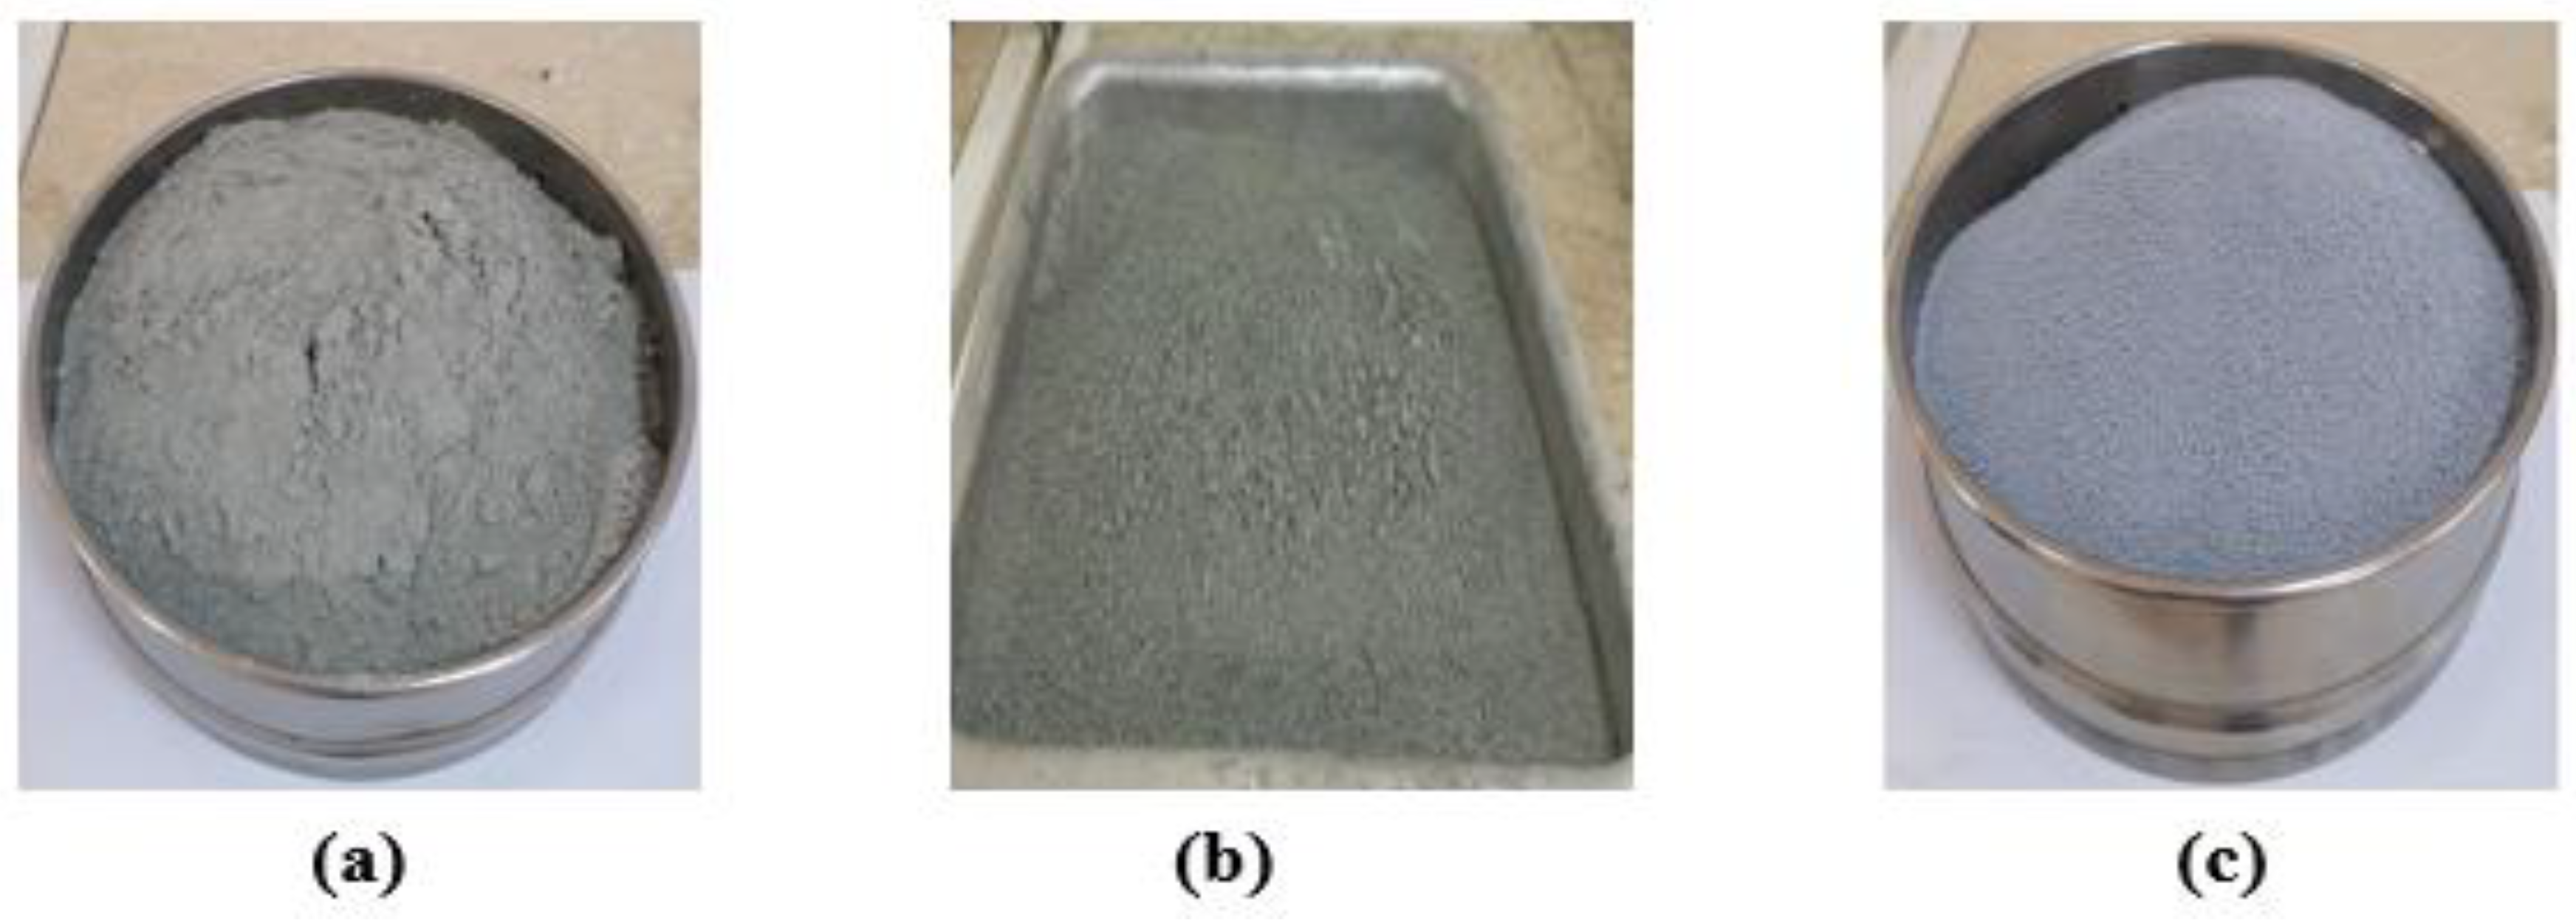
Figure 2.
(a) M-Sand and (b) R-Sand replaced river sand.
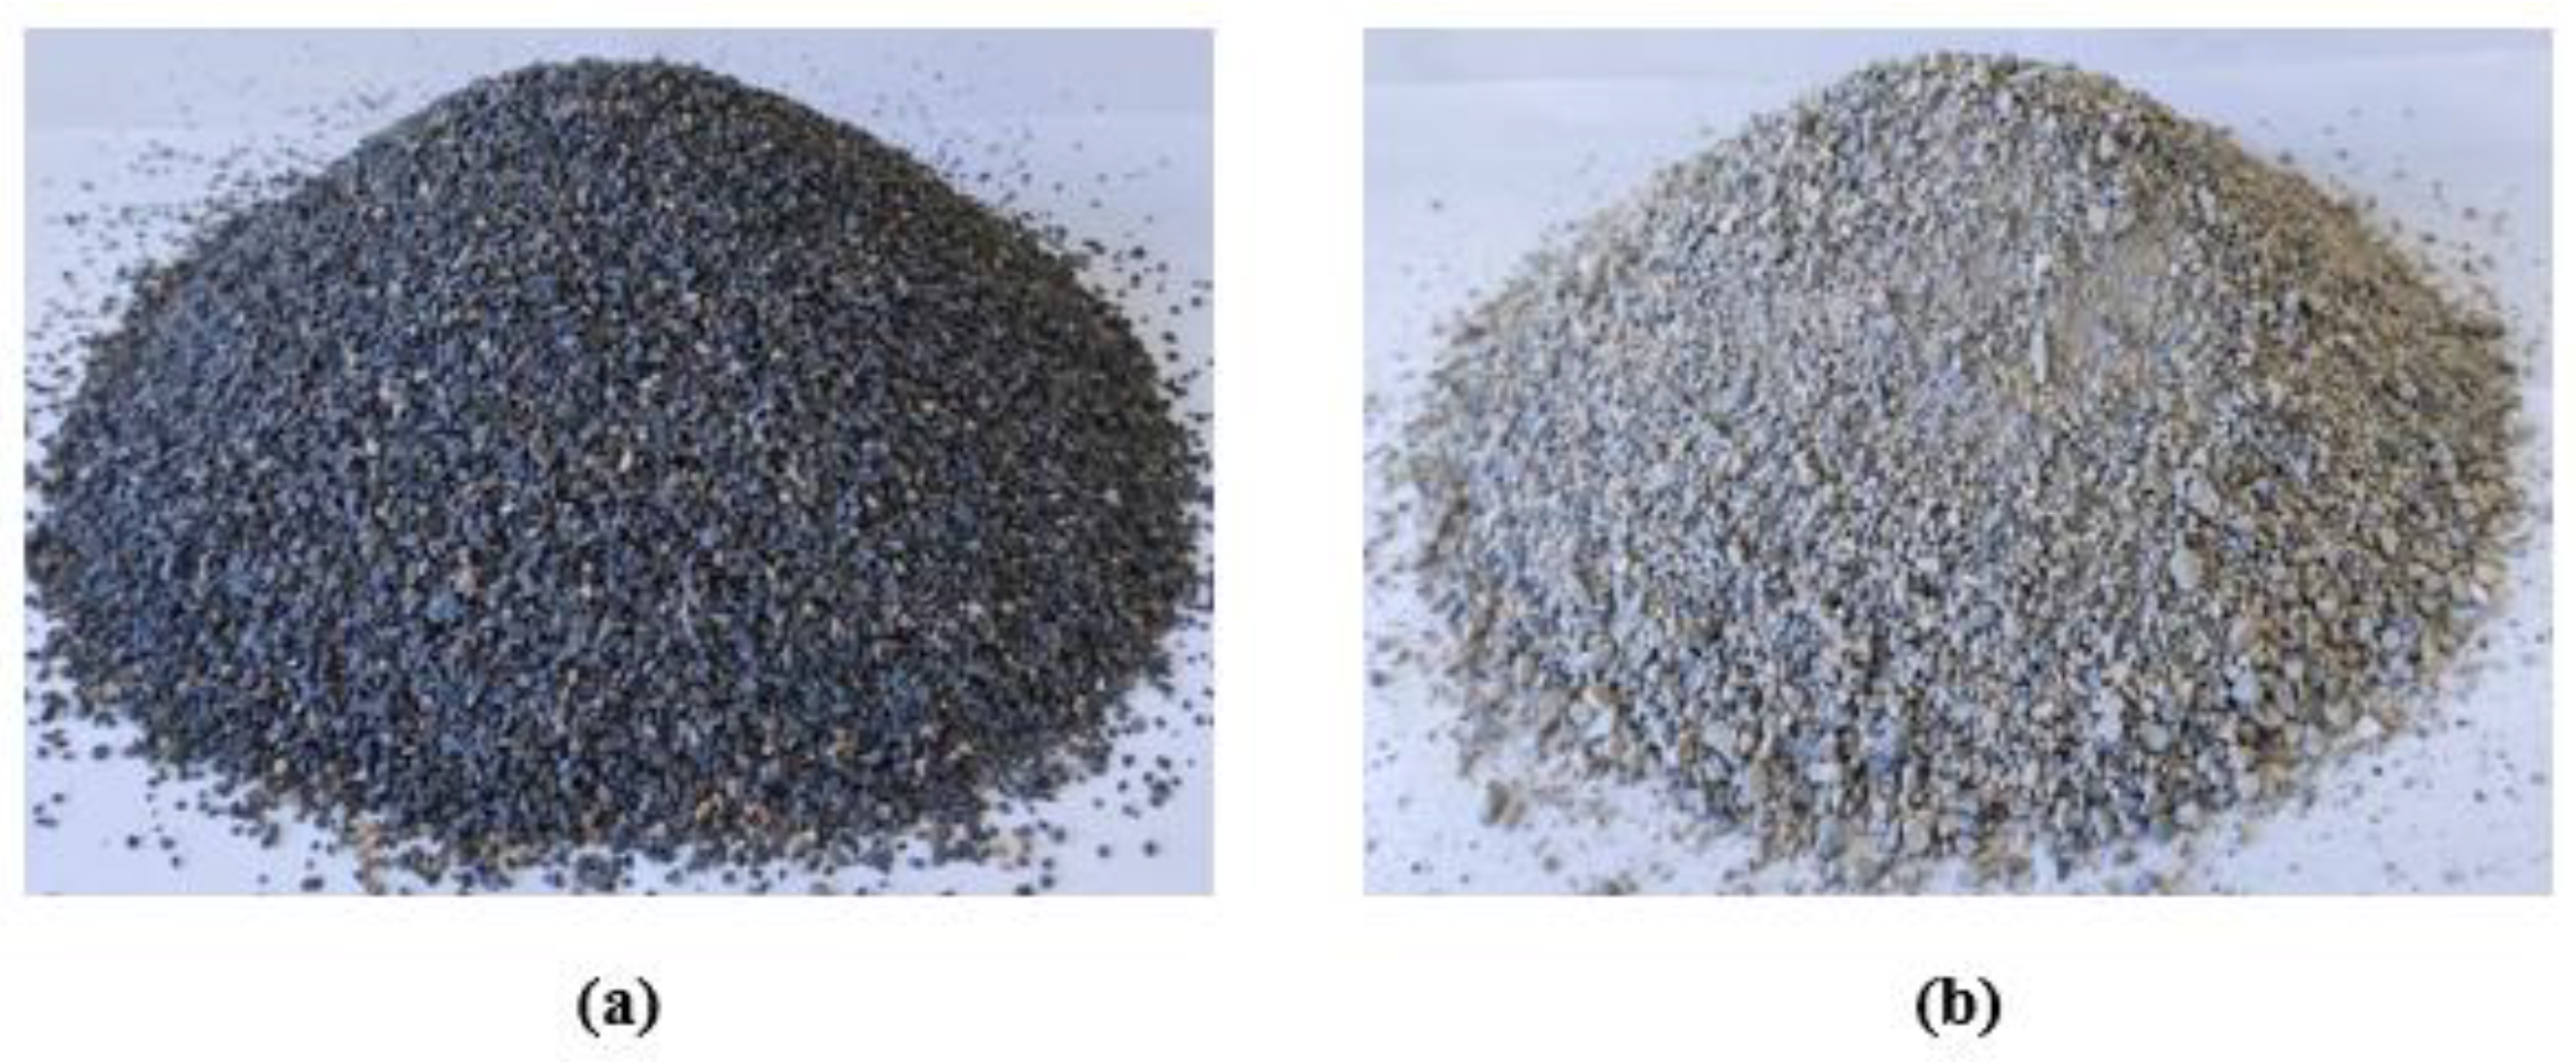
Figure 3.
Natural coarse aggregate (a) 19 mm (b) 12.5 mm (c) 9.5mm.
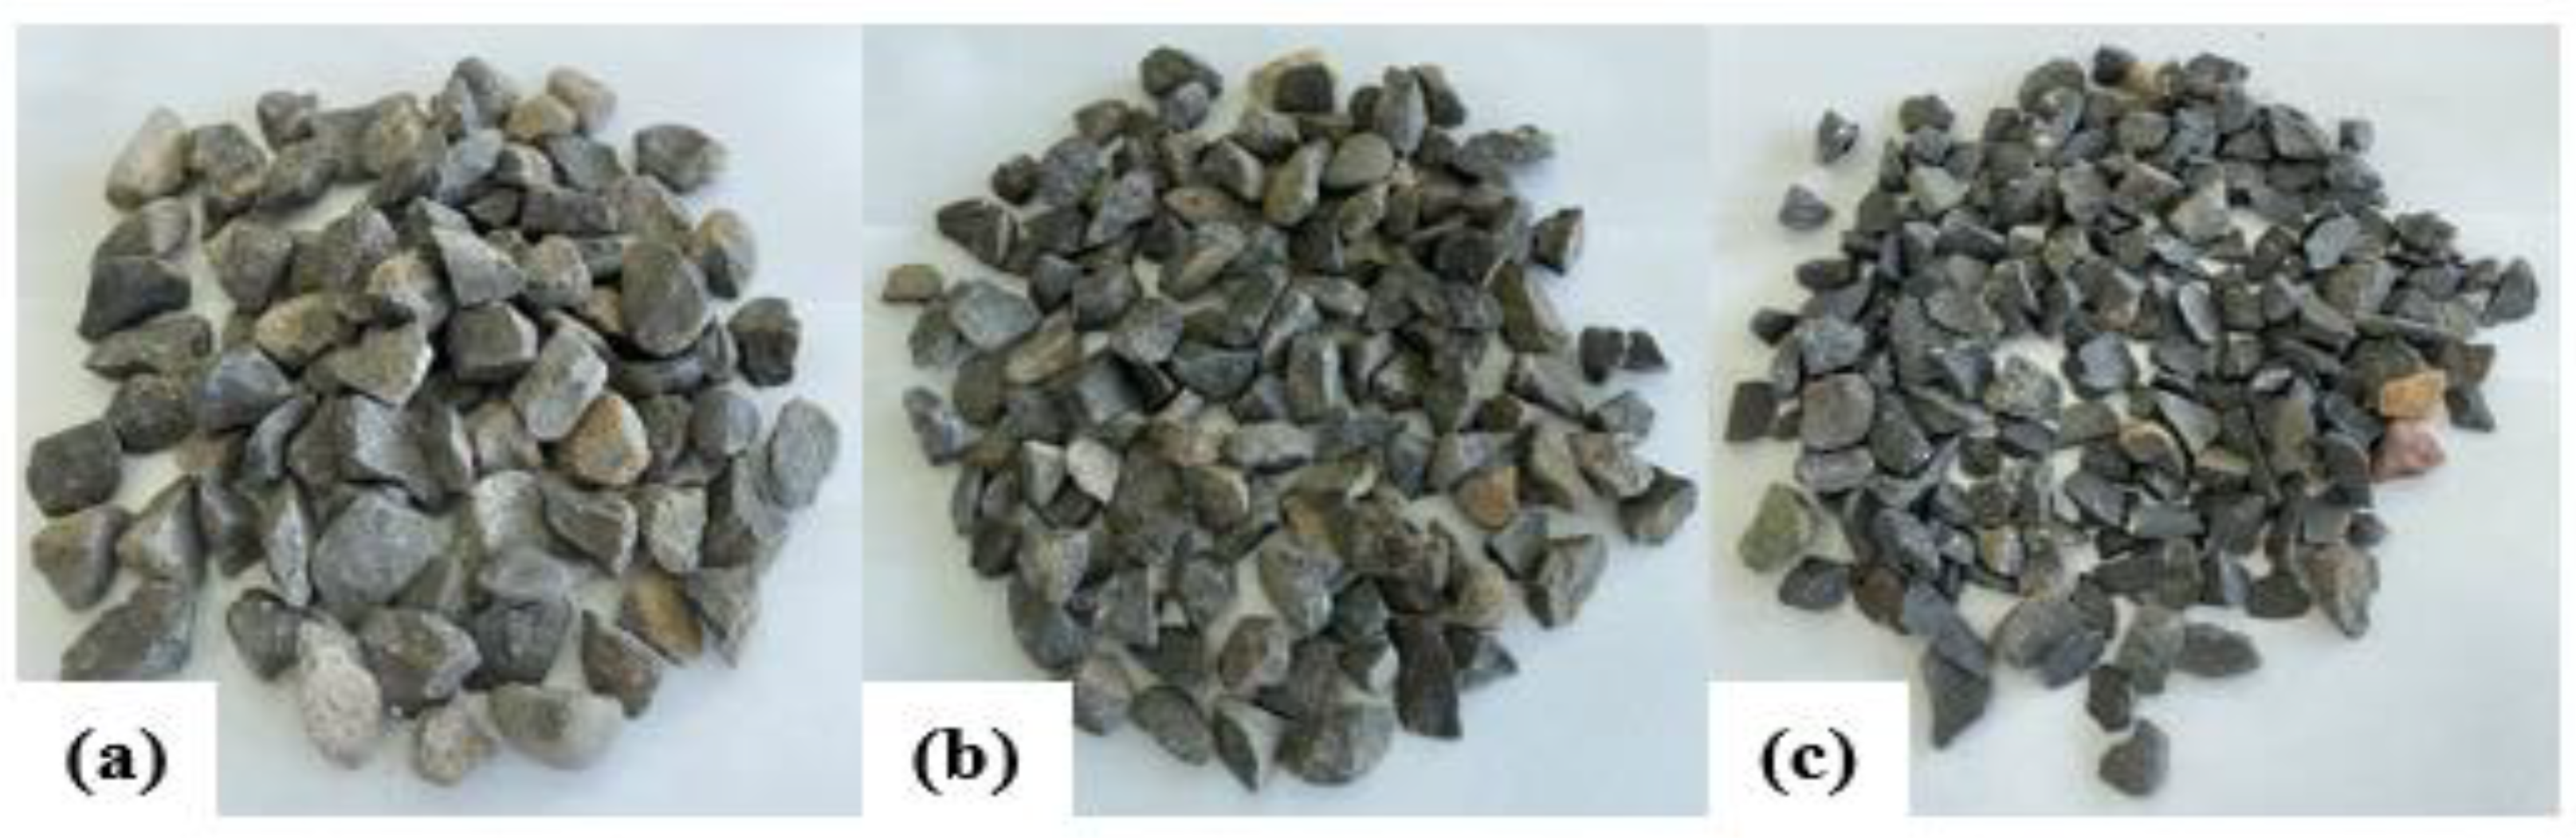
Figure 4.
(a) Slump-retaining concrete admixture and (b) sample.
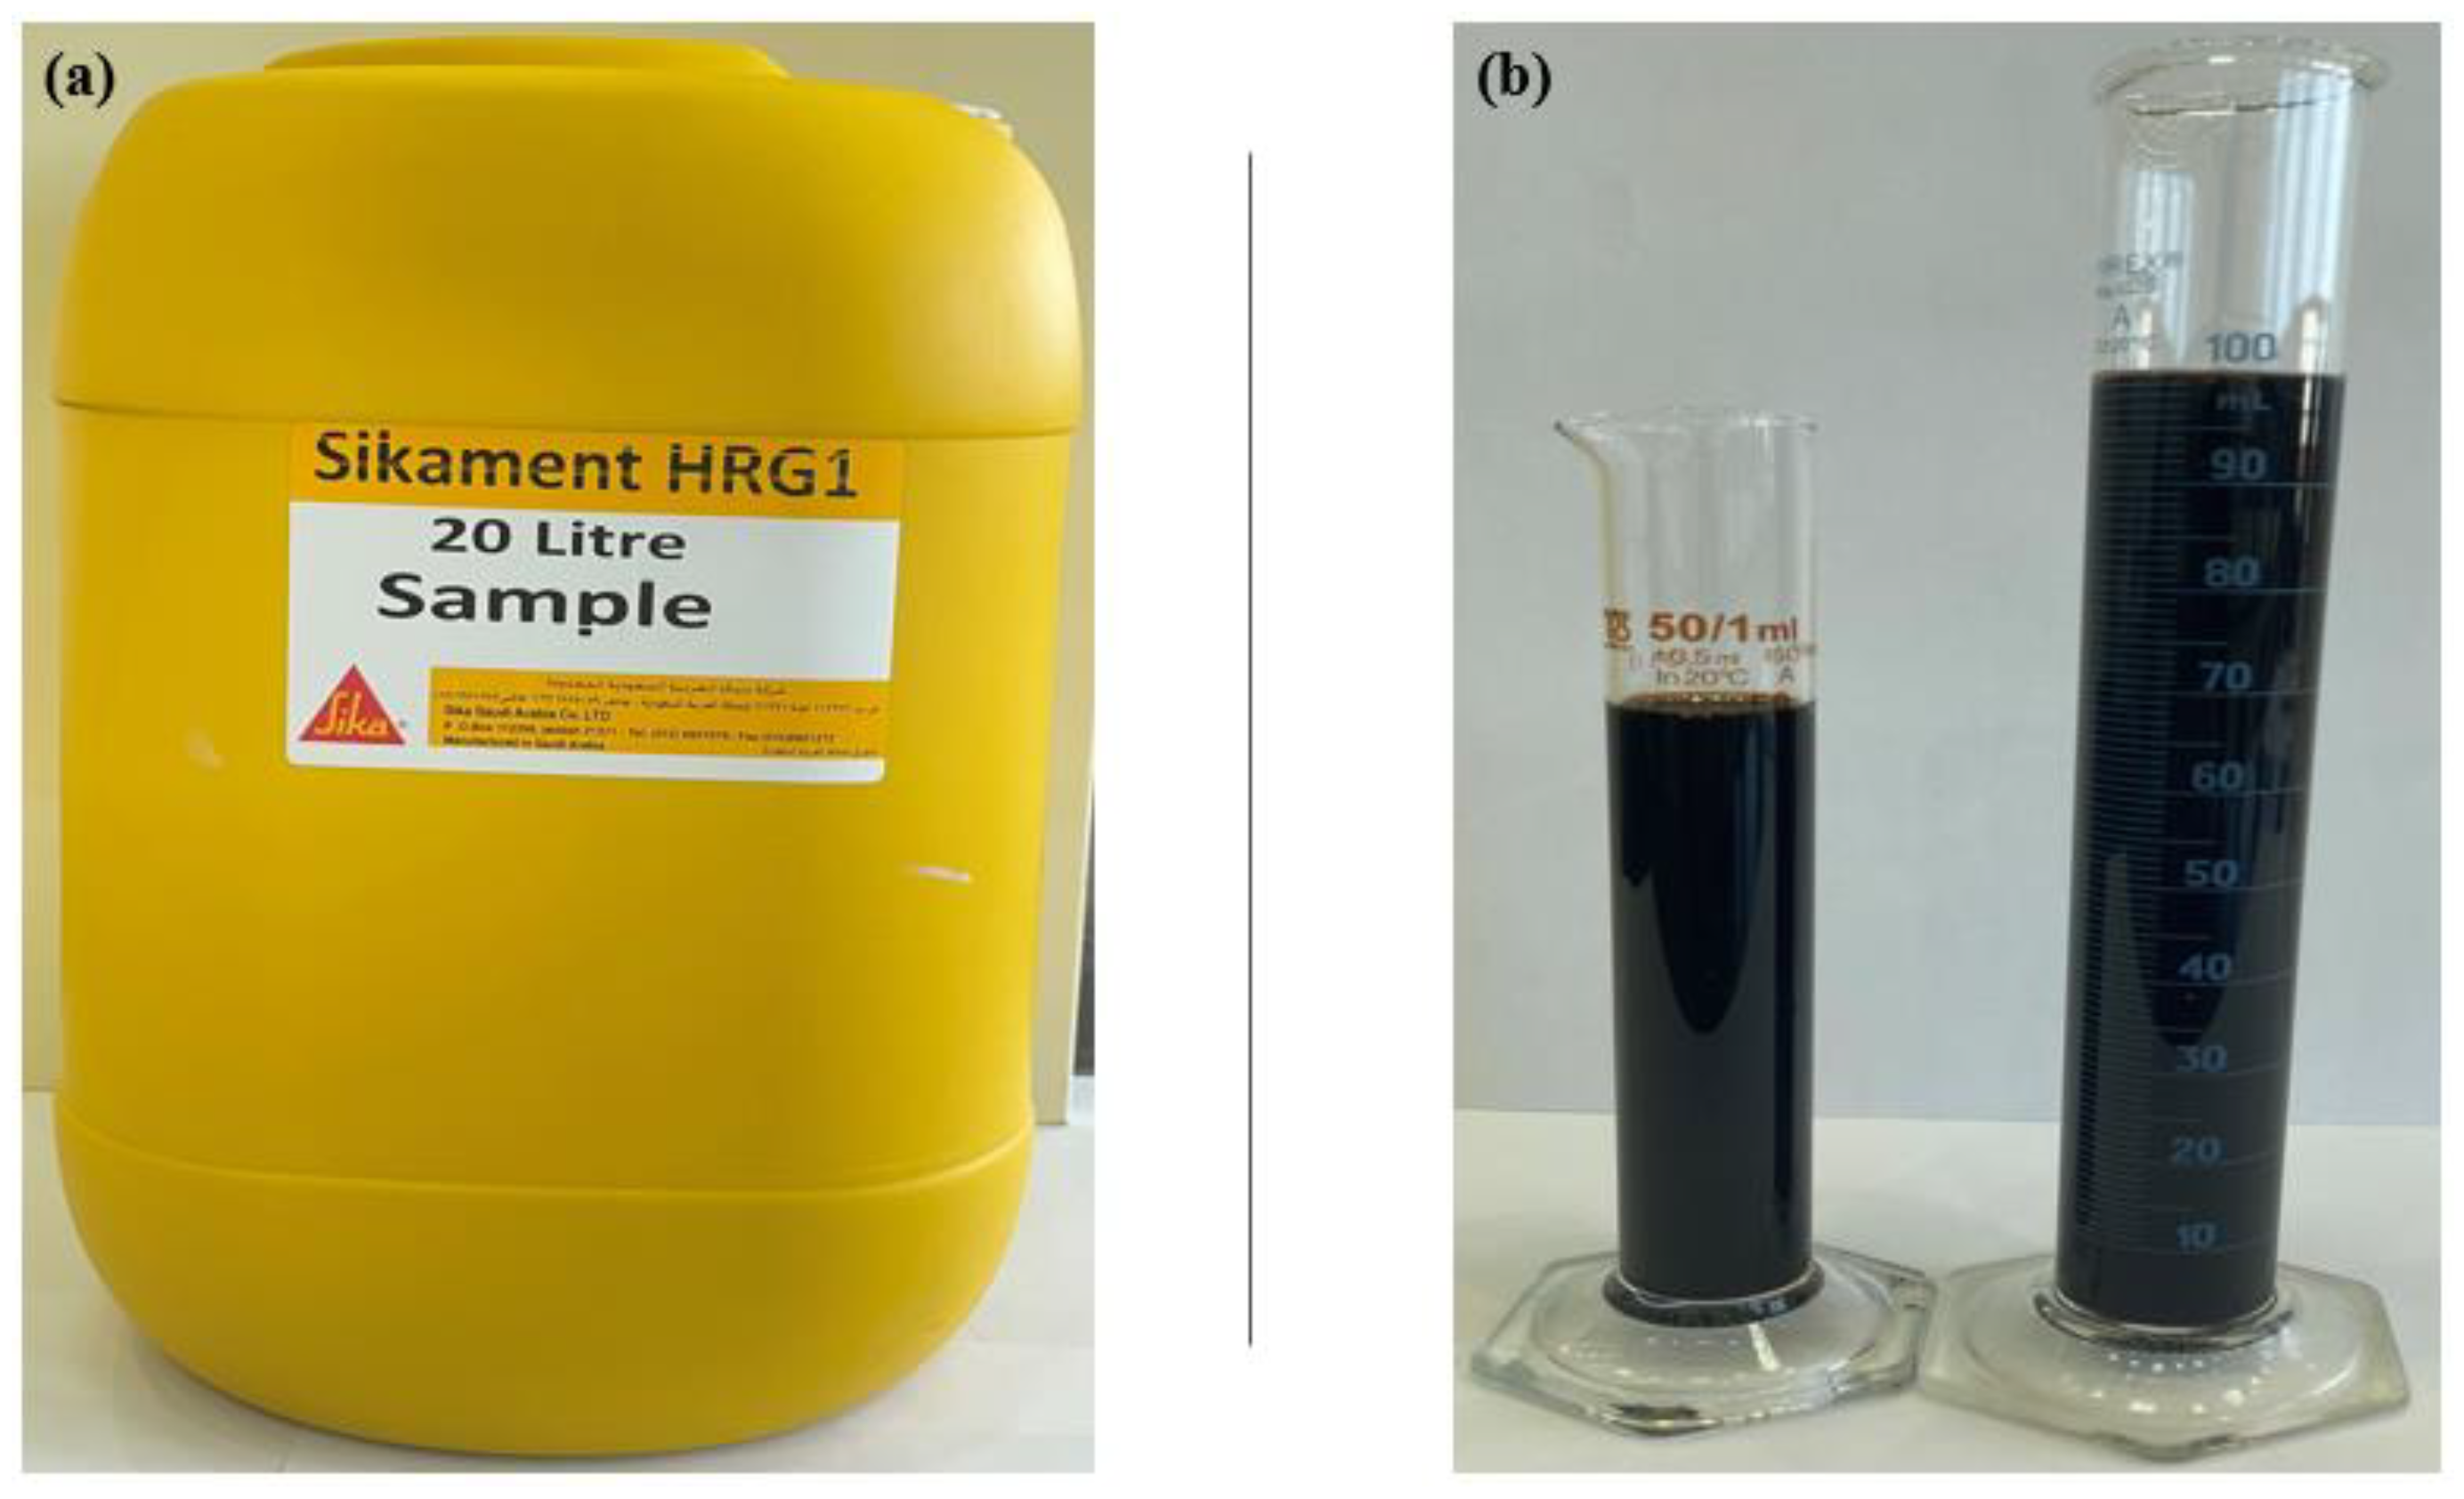
Figure 5.
Preparation methodology of R-sand.
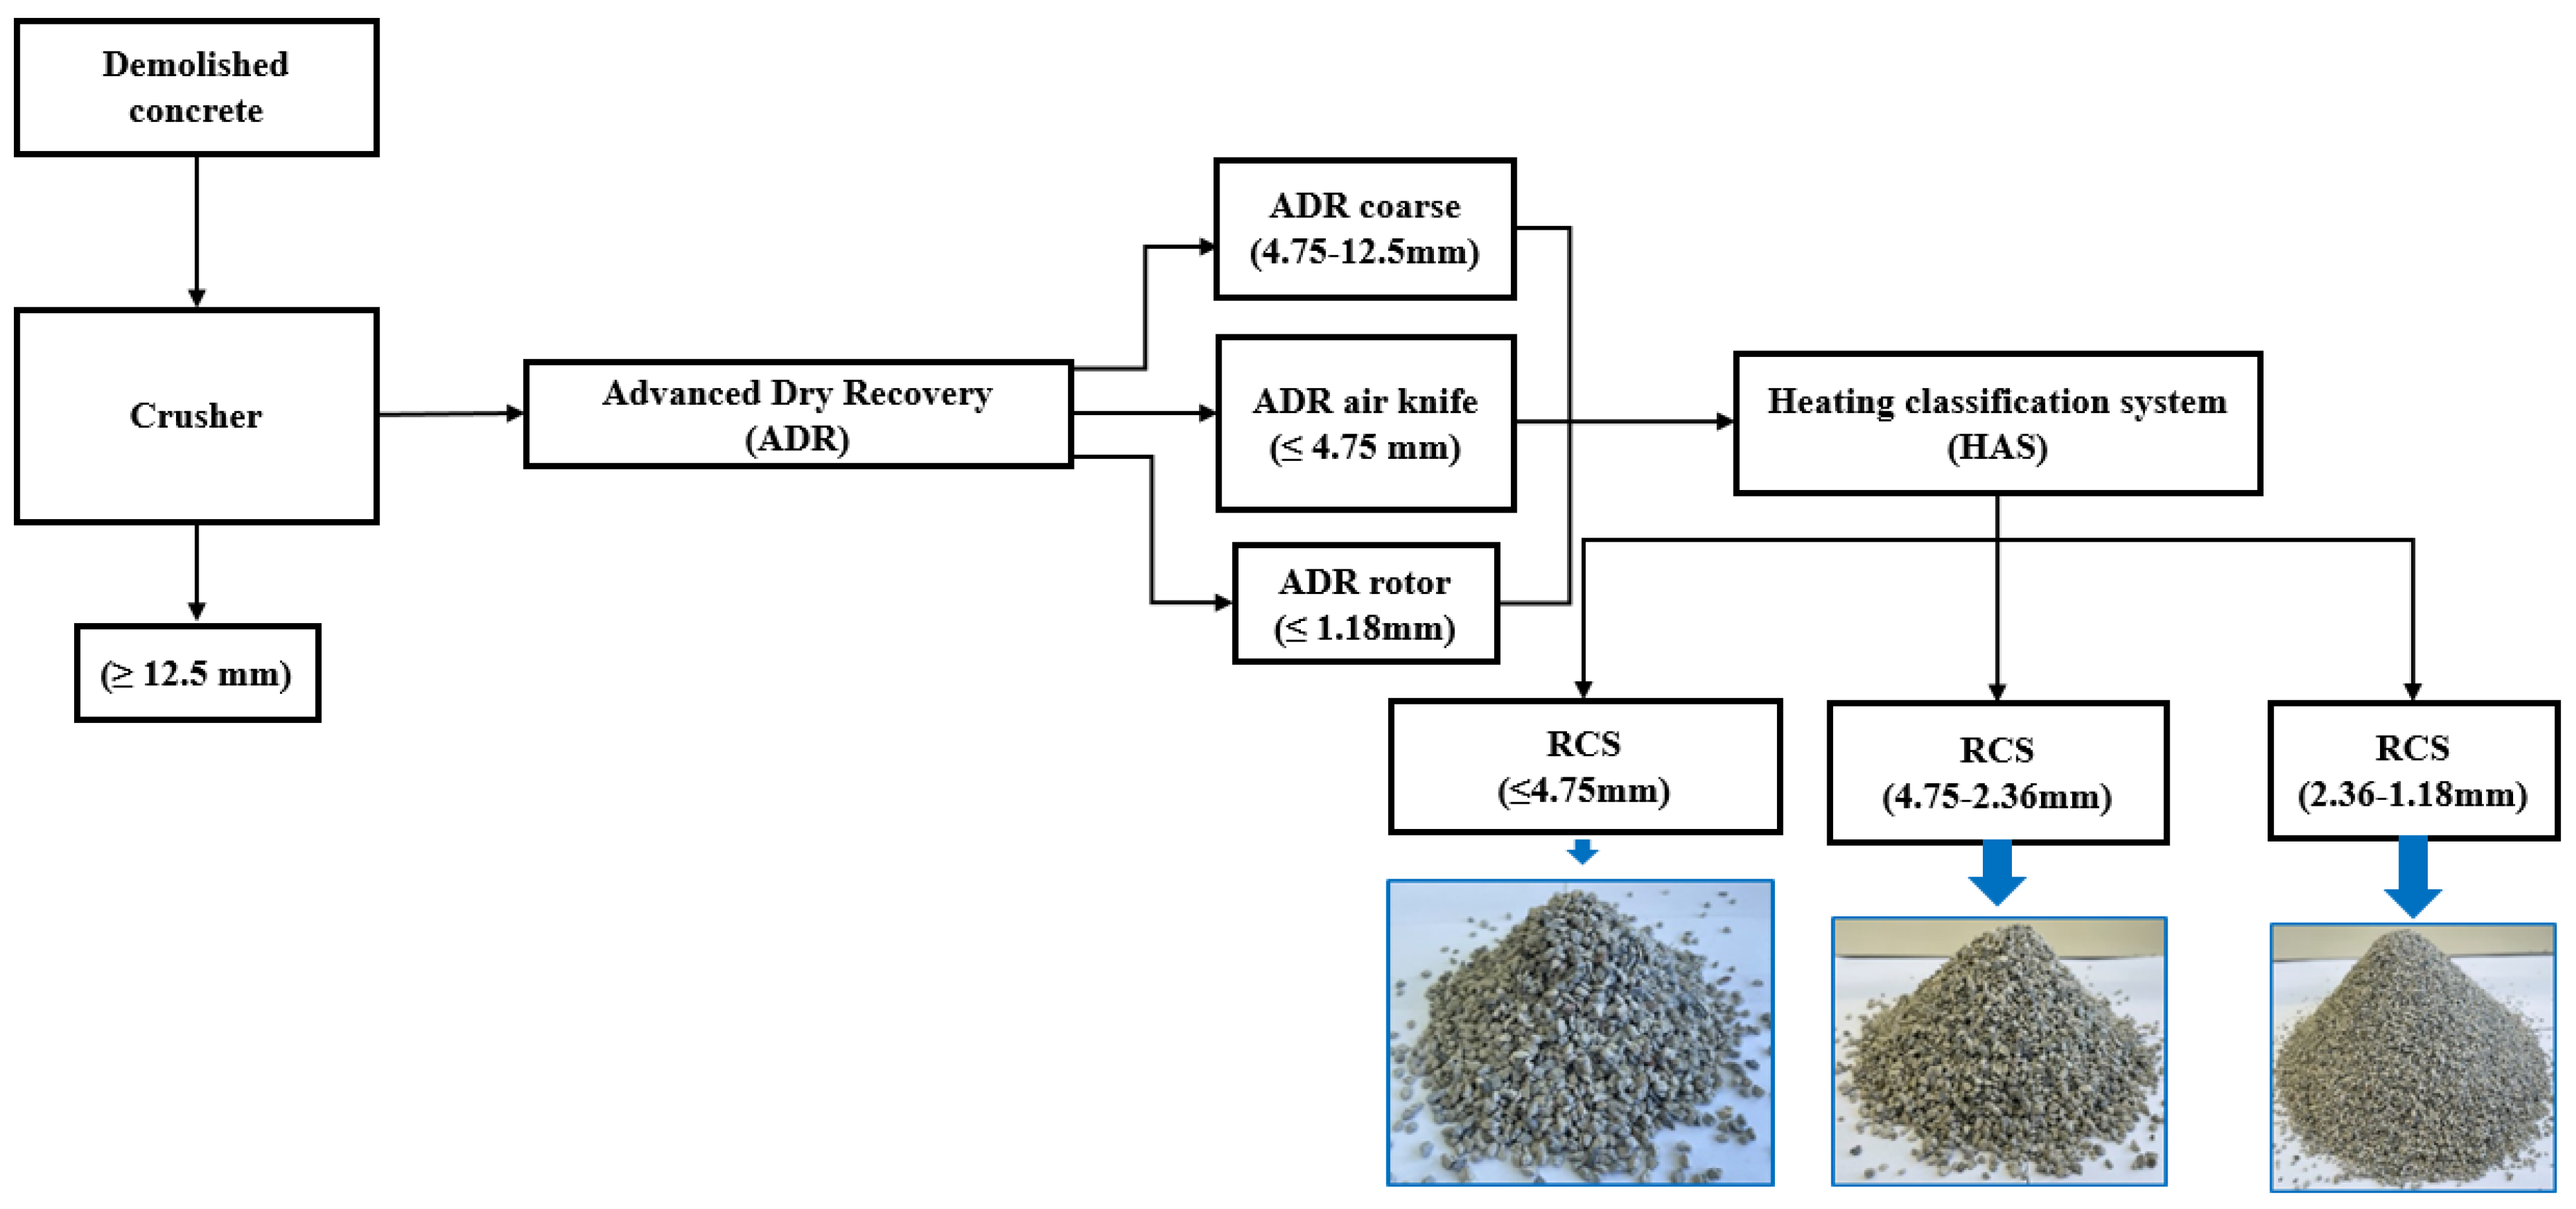
Figure 6.
Detailed methodology of the study.
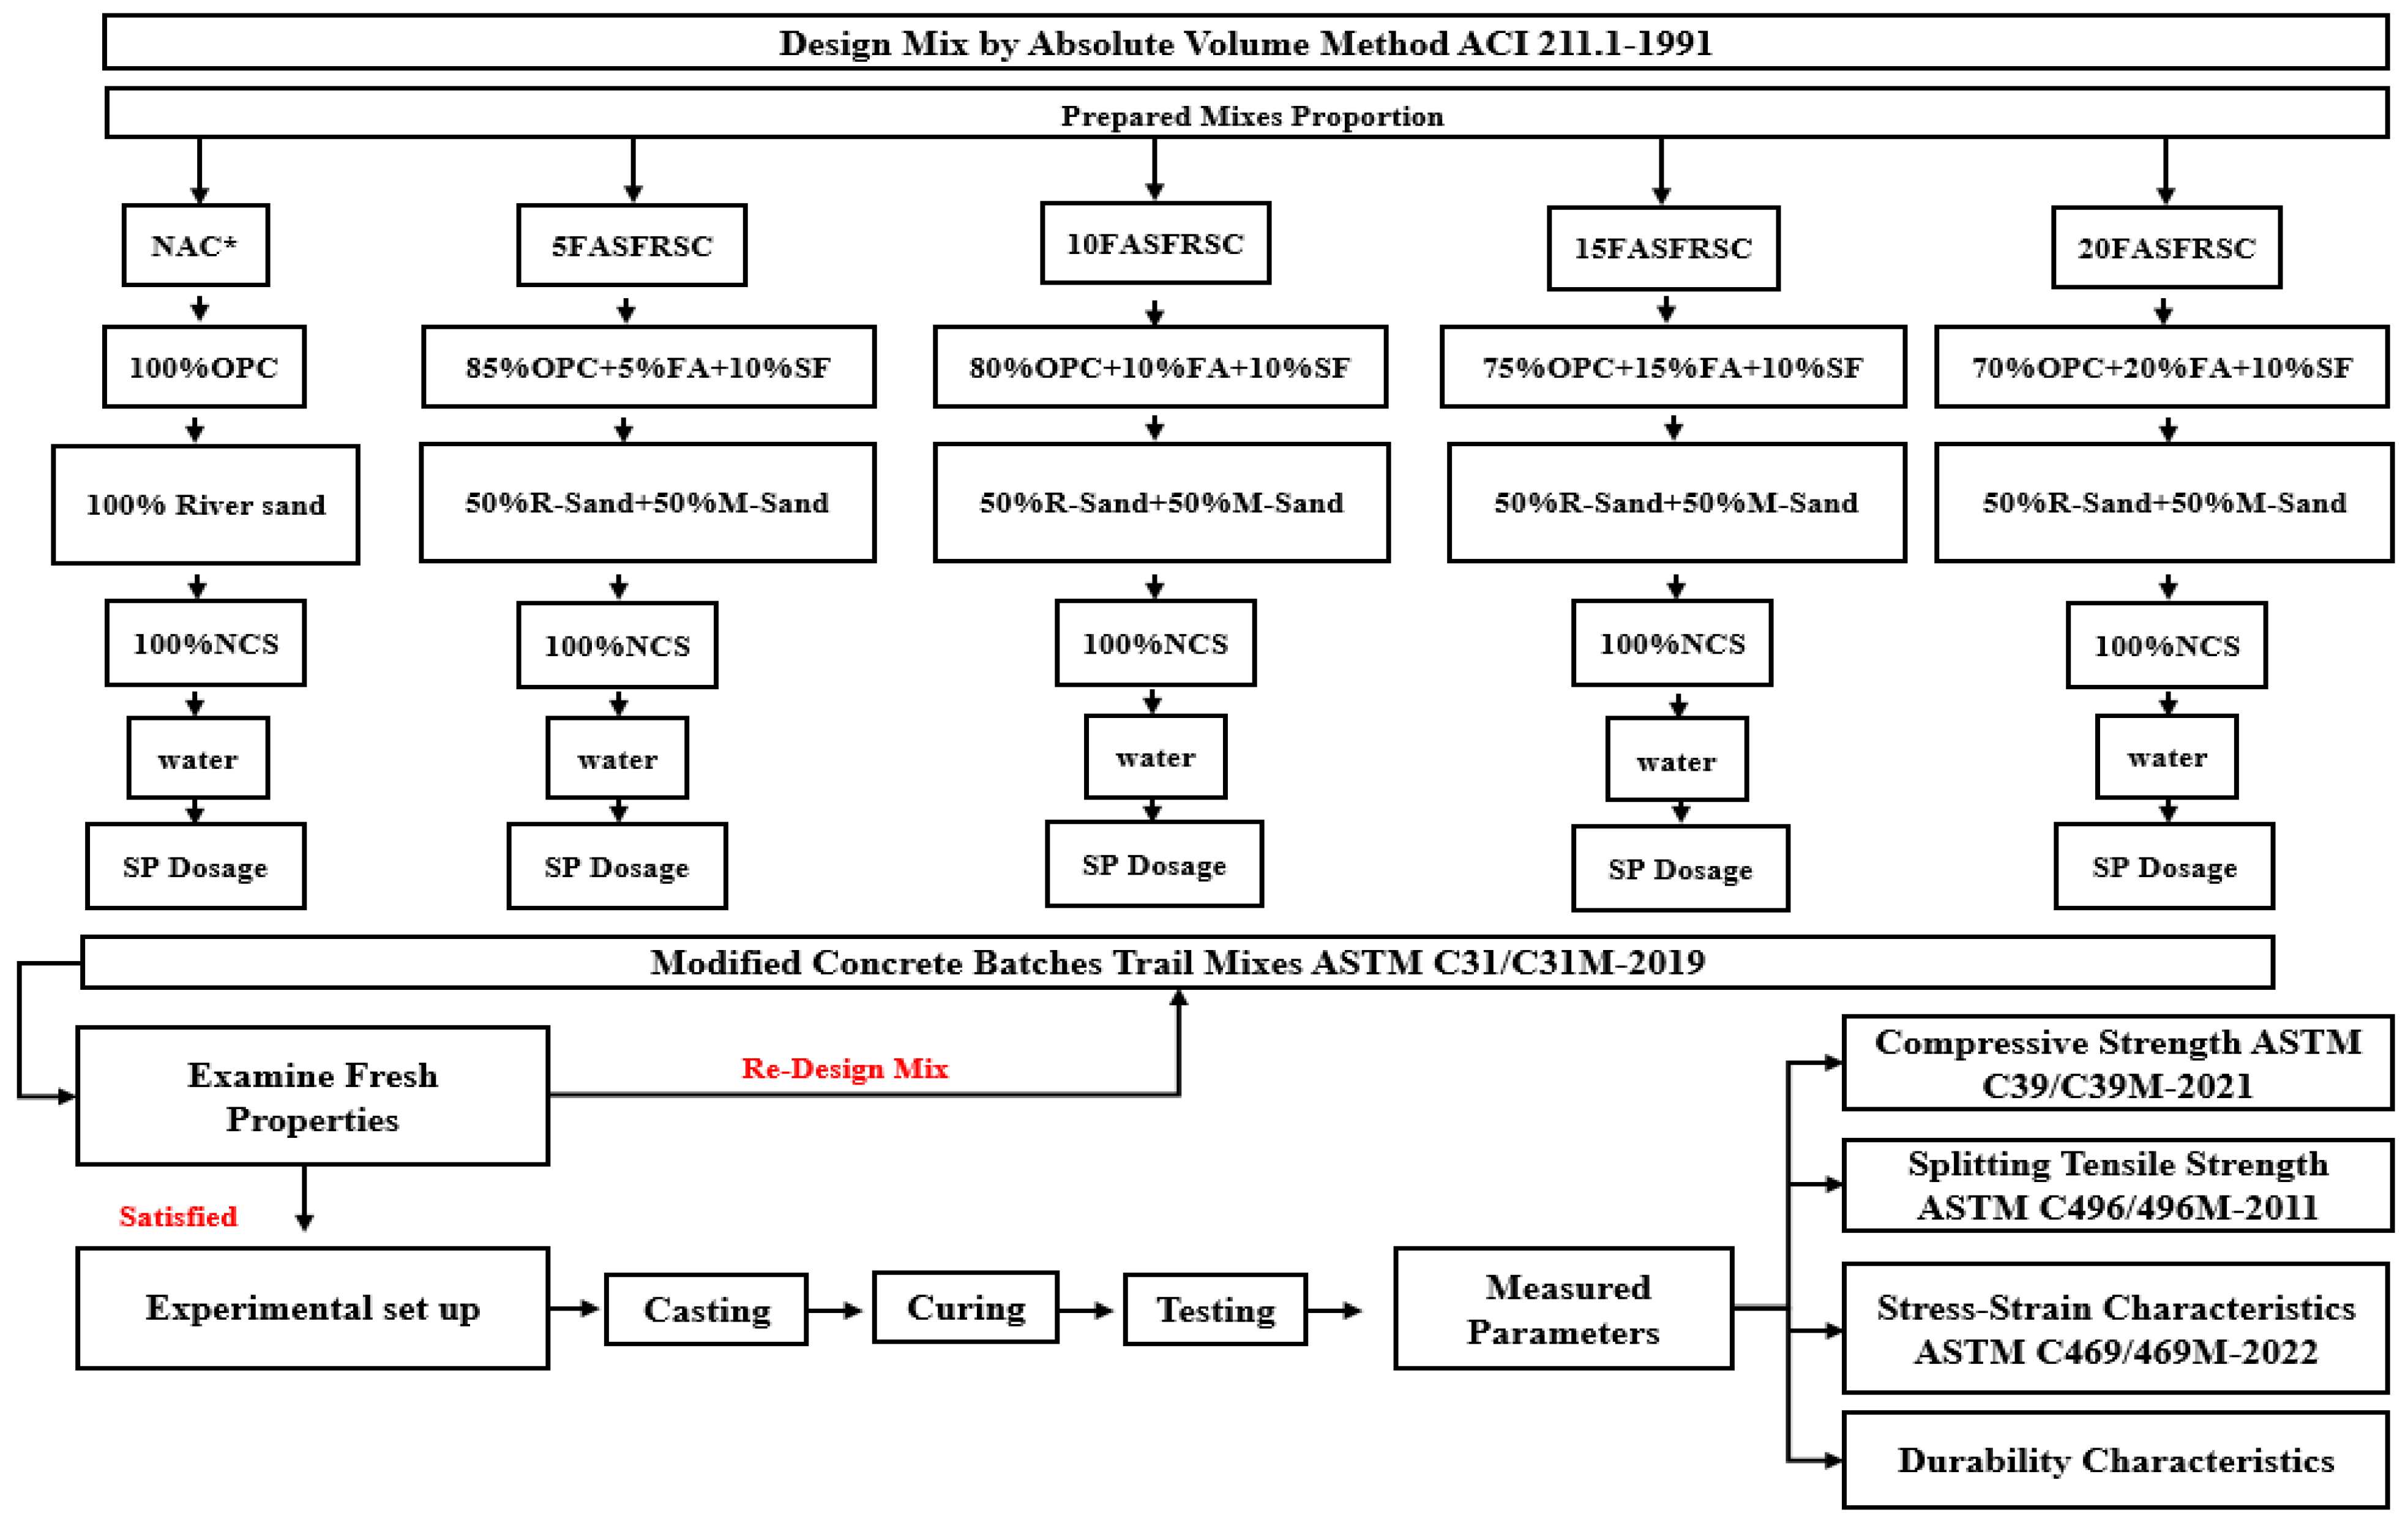
Figure 7.
Samples under testing of compressive strength.
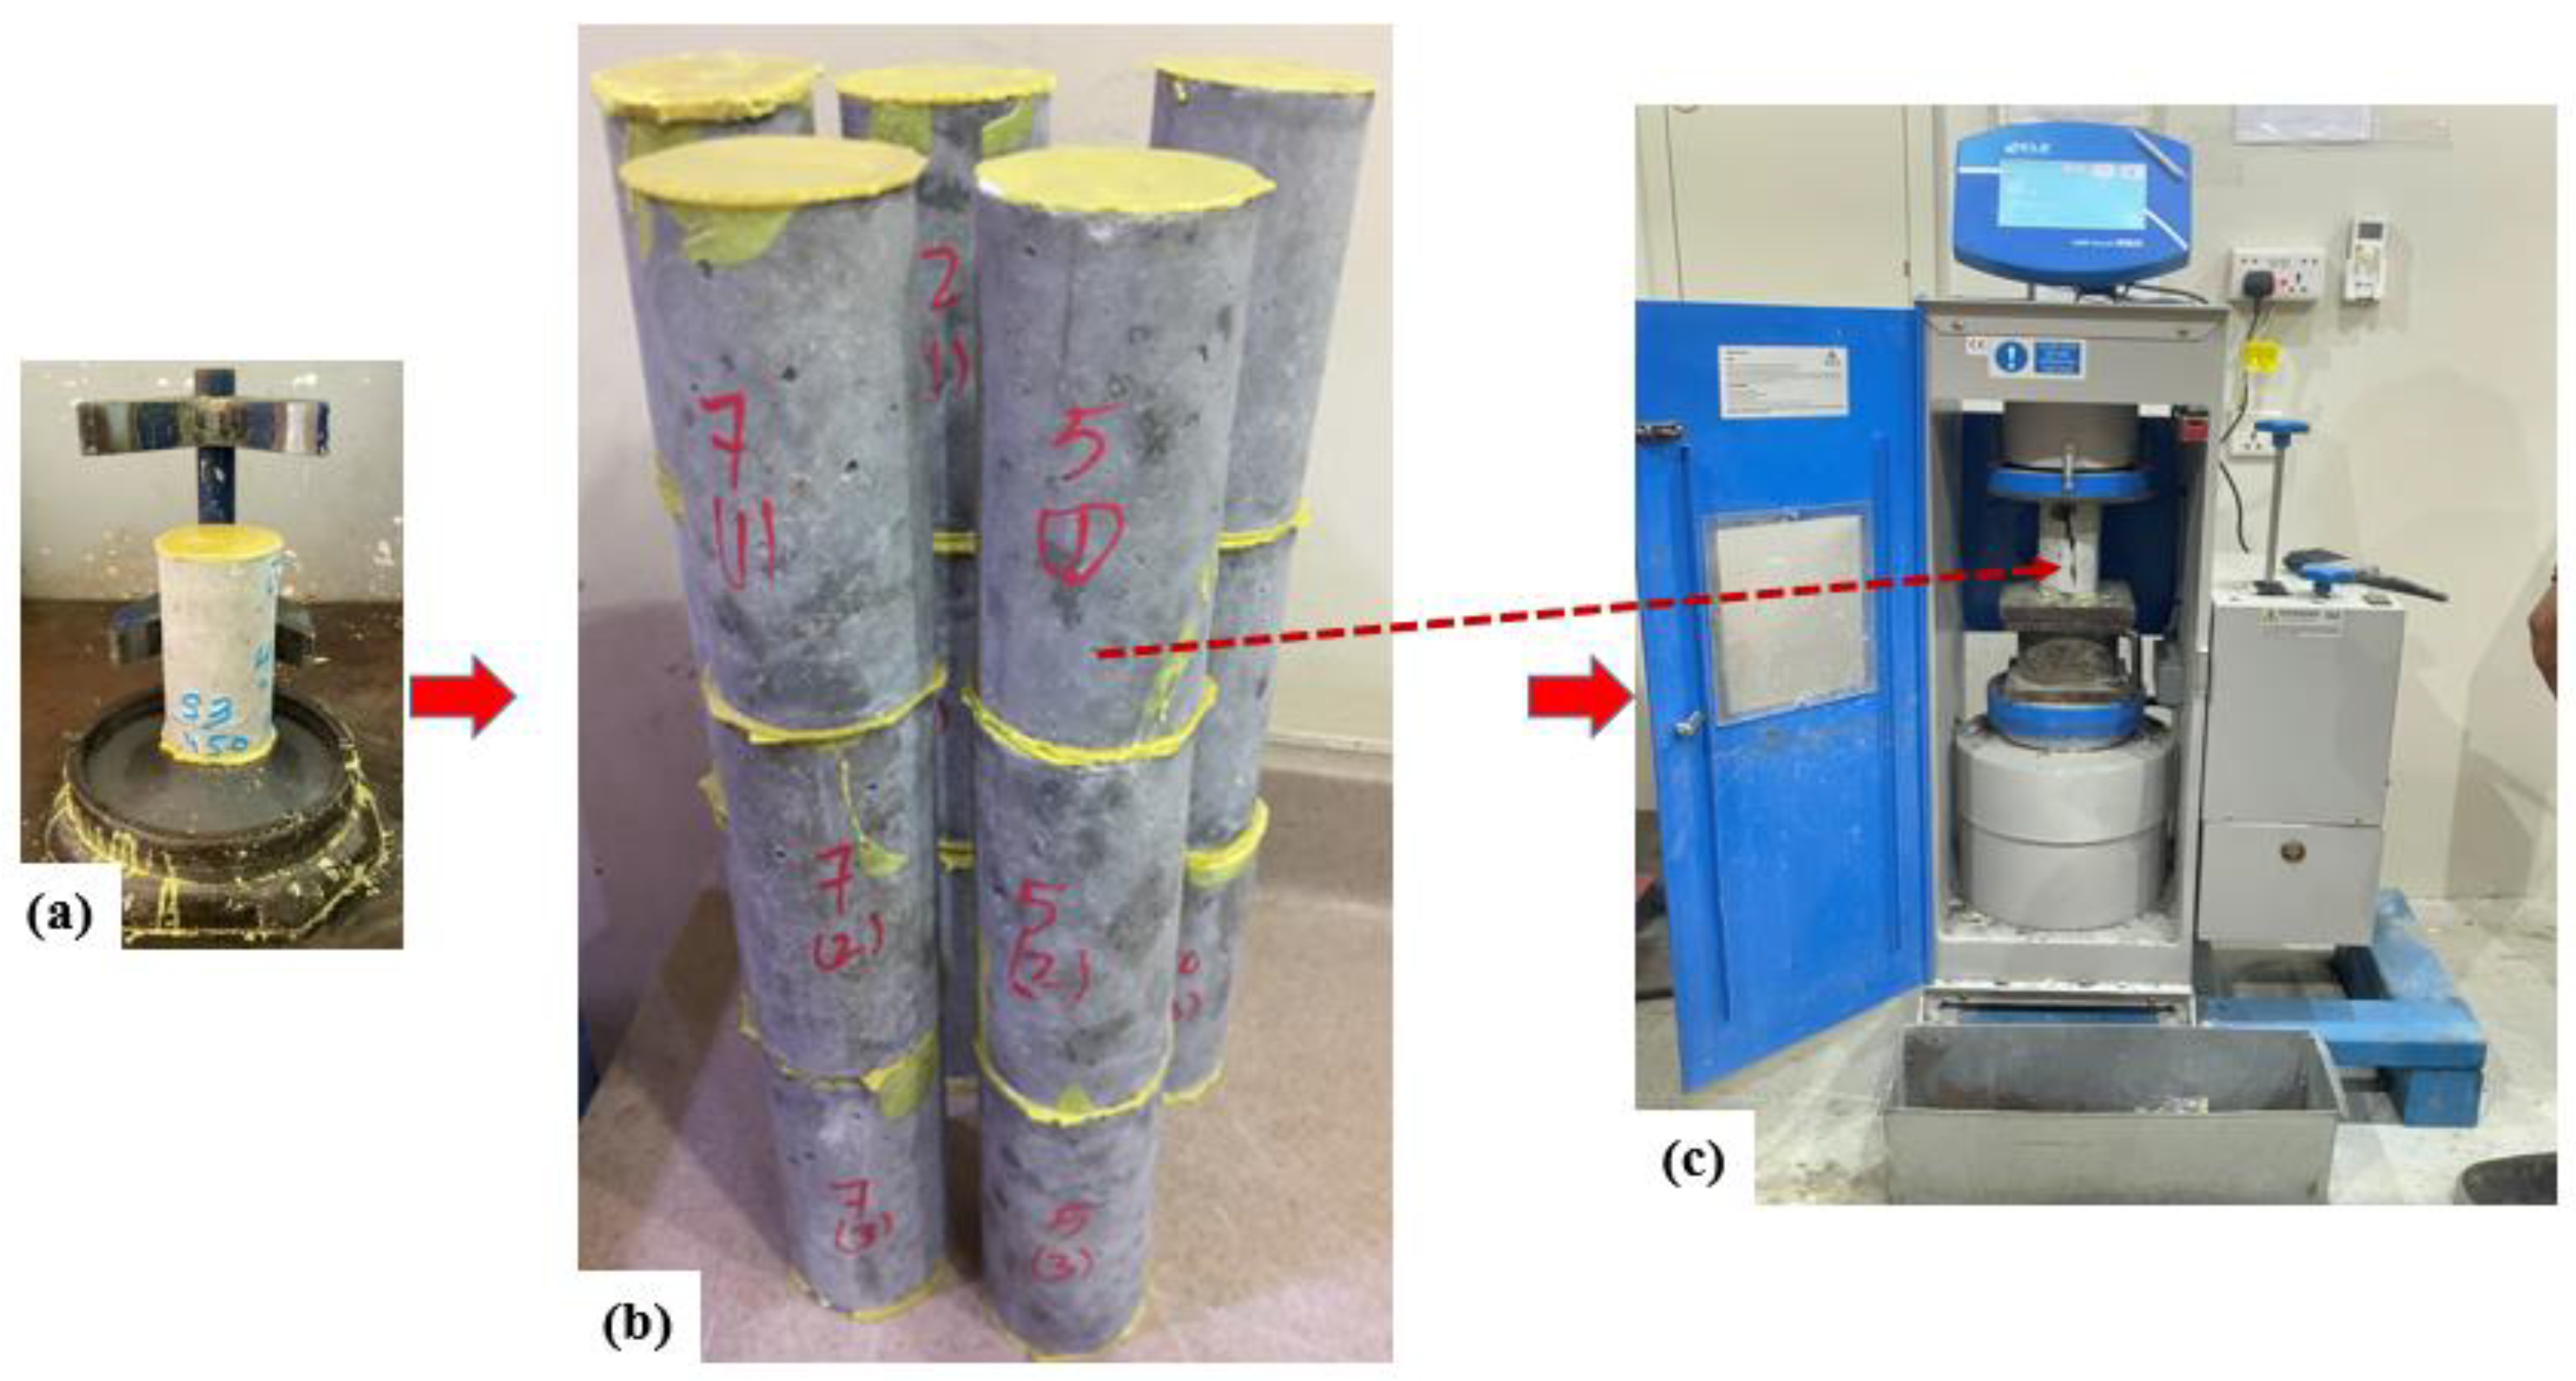
Figure 8.
Evaluation of compressive strength.
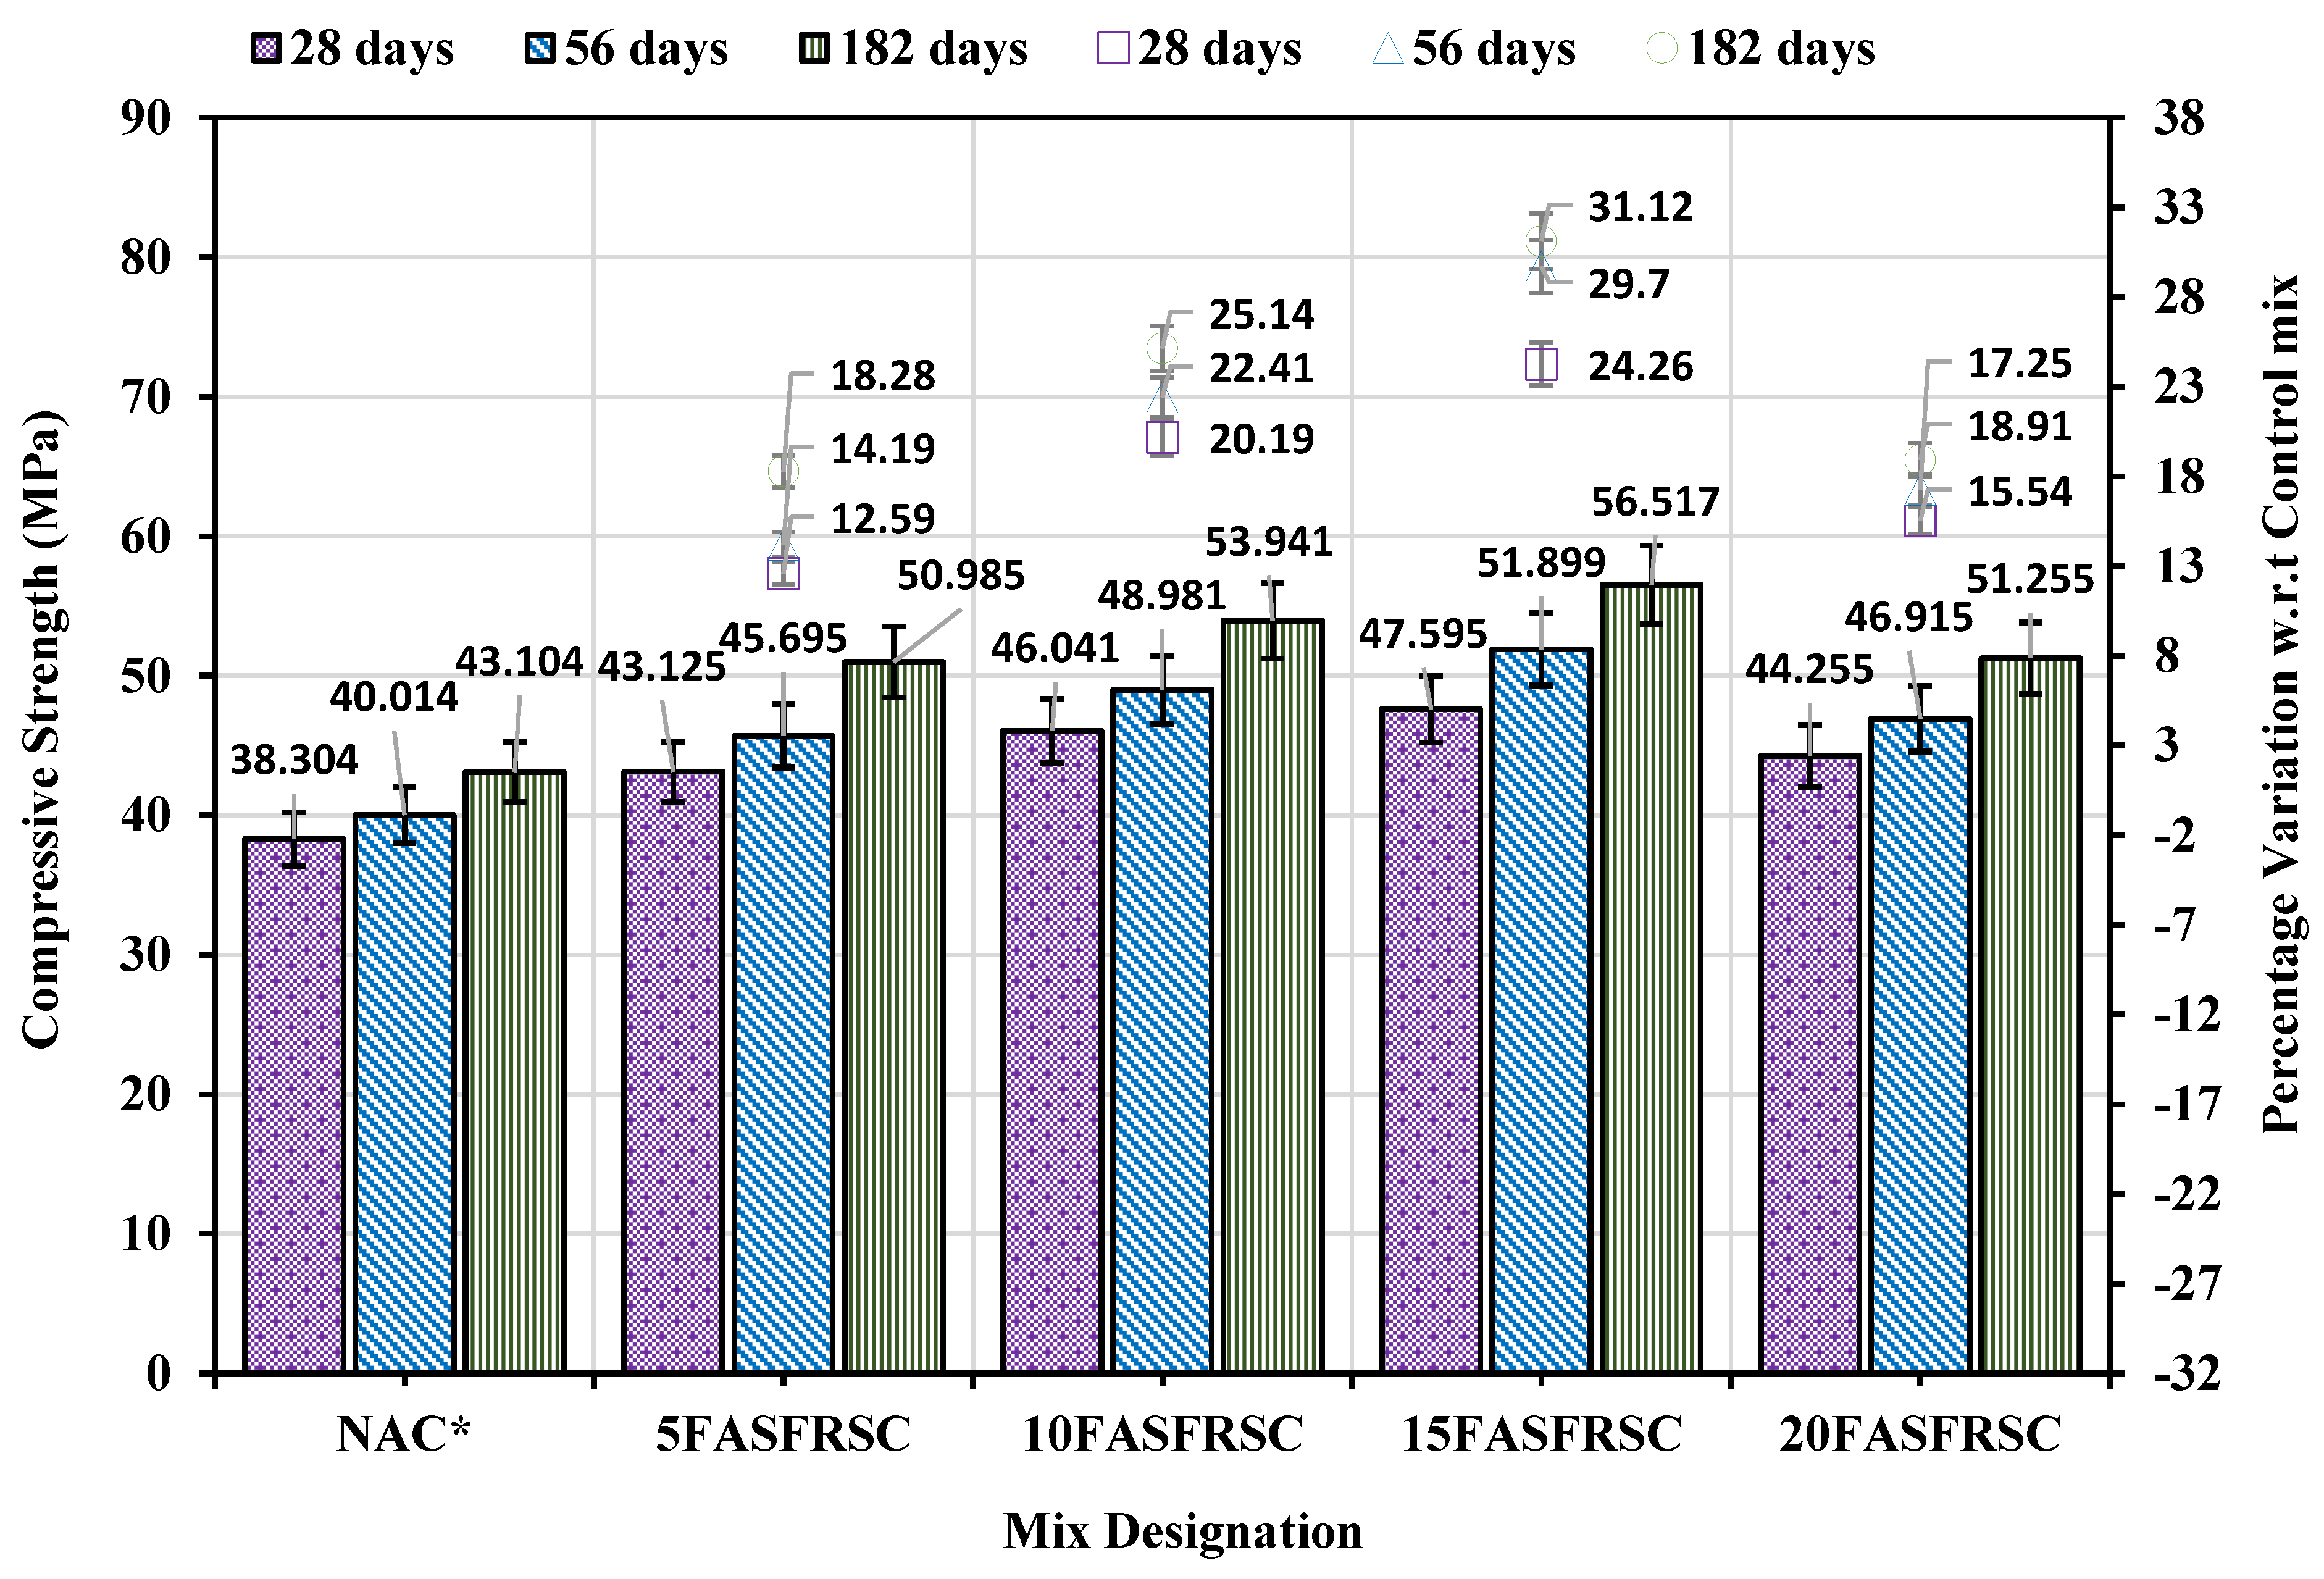
Figure 9.
Experimental setup of evaluating flexural strength.
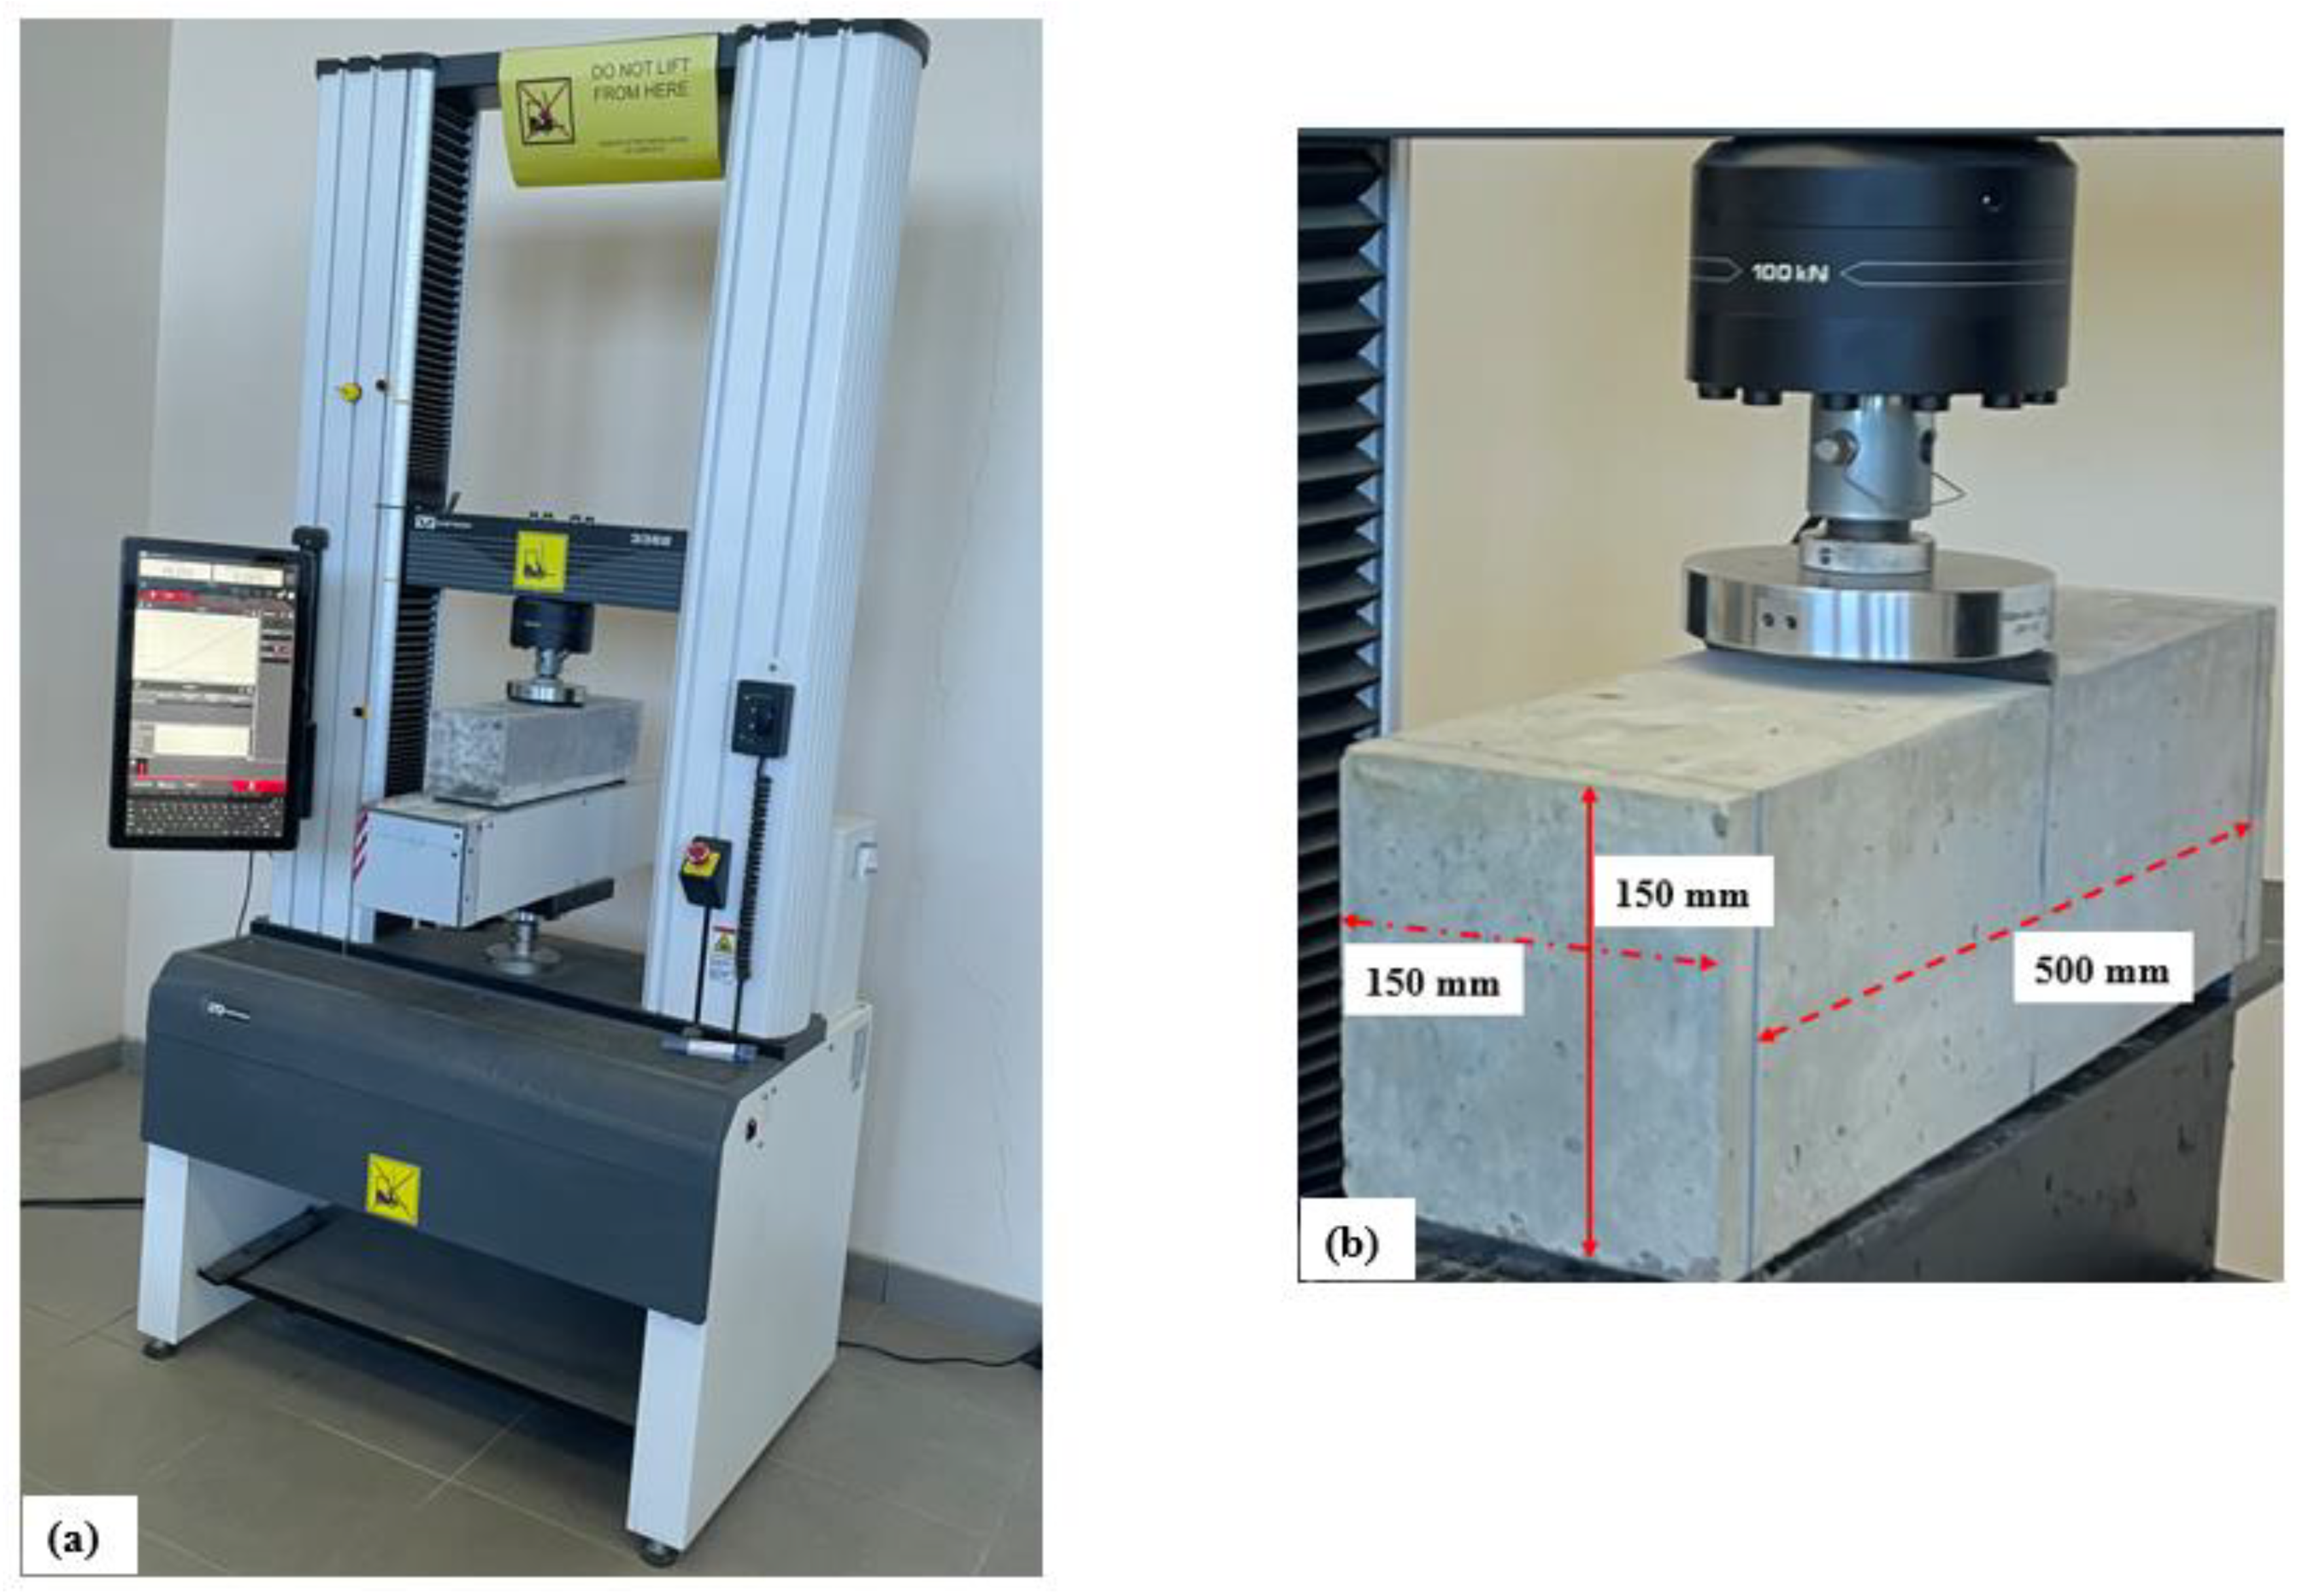
Figure 10.
Evaluation of splitting tensile strength.
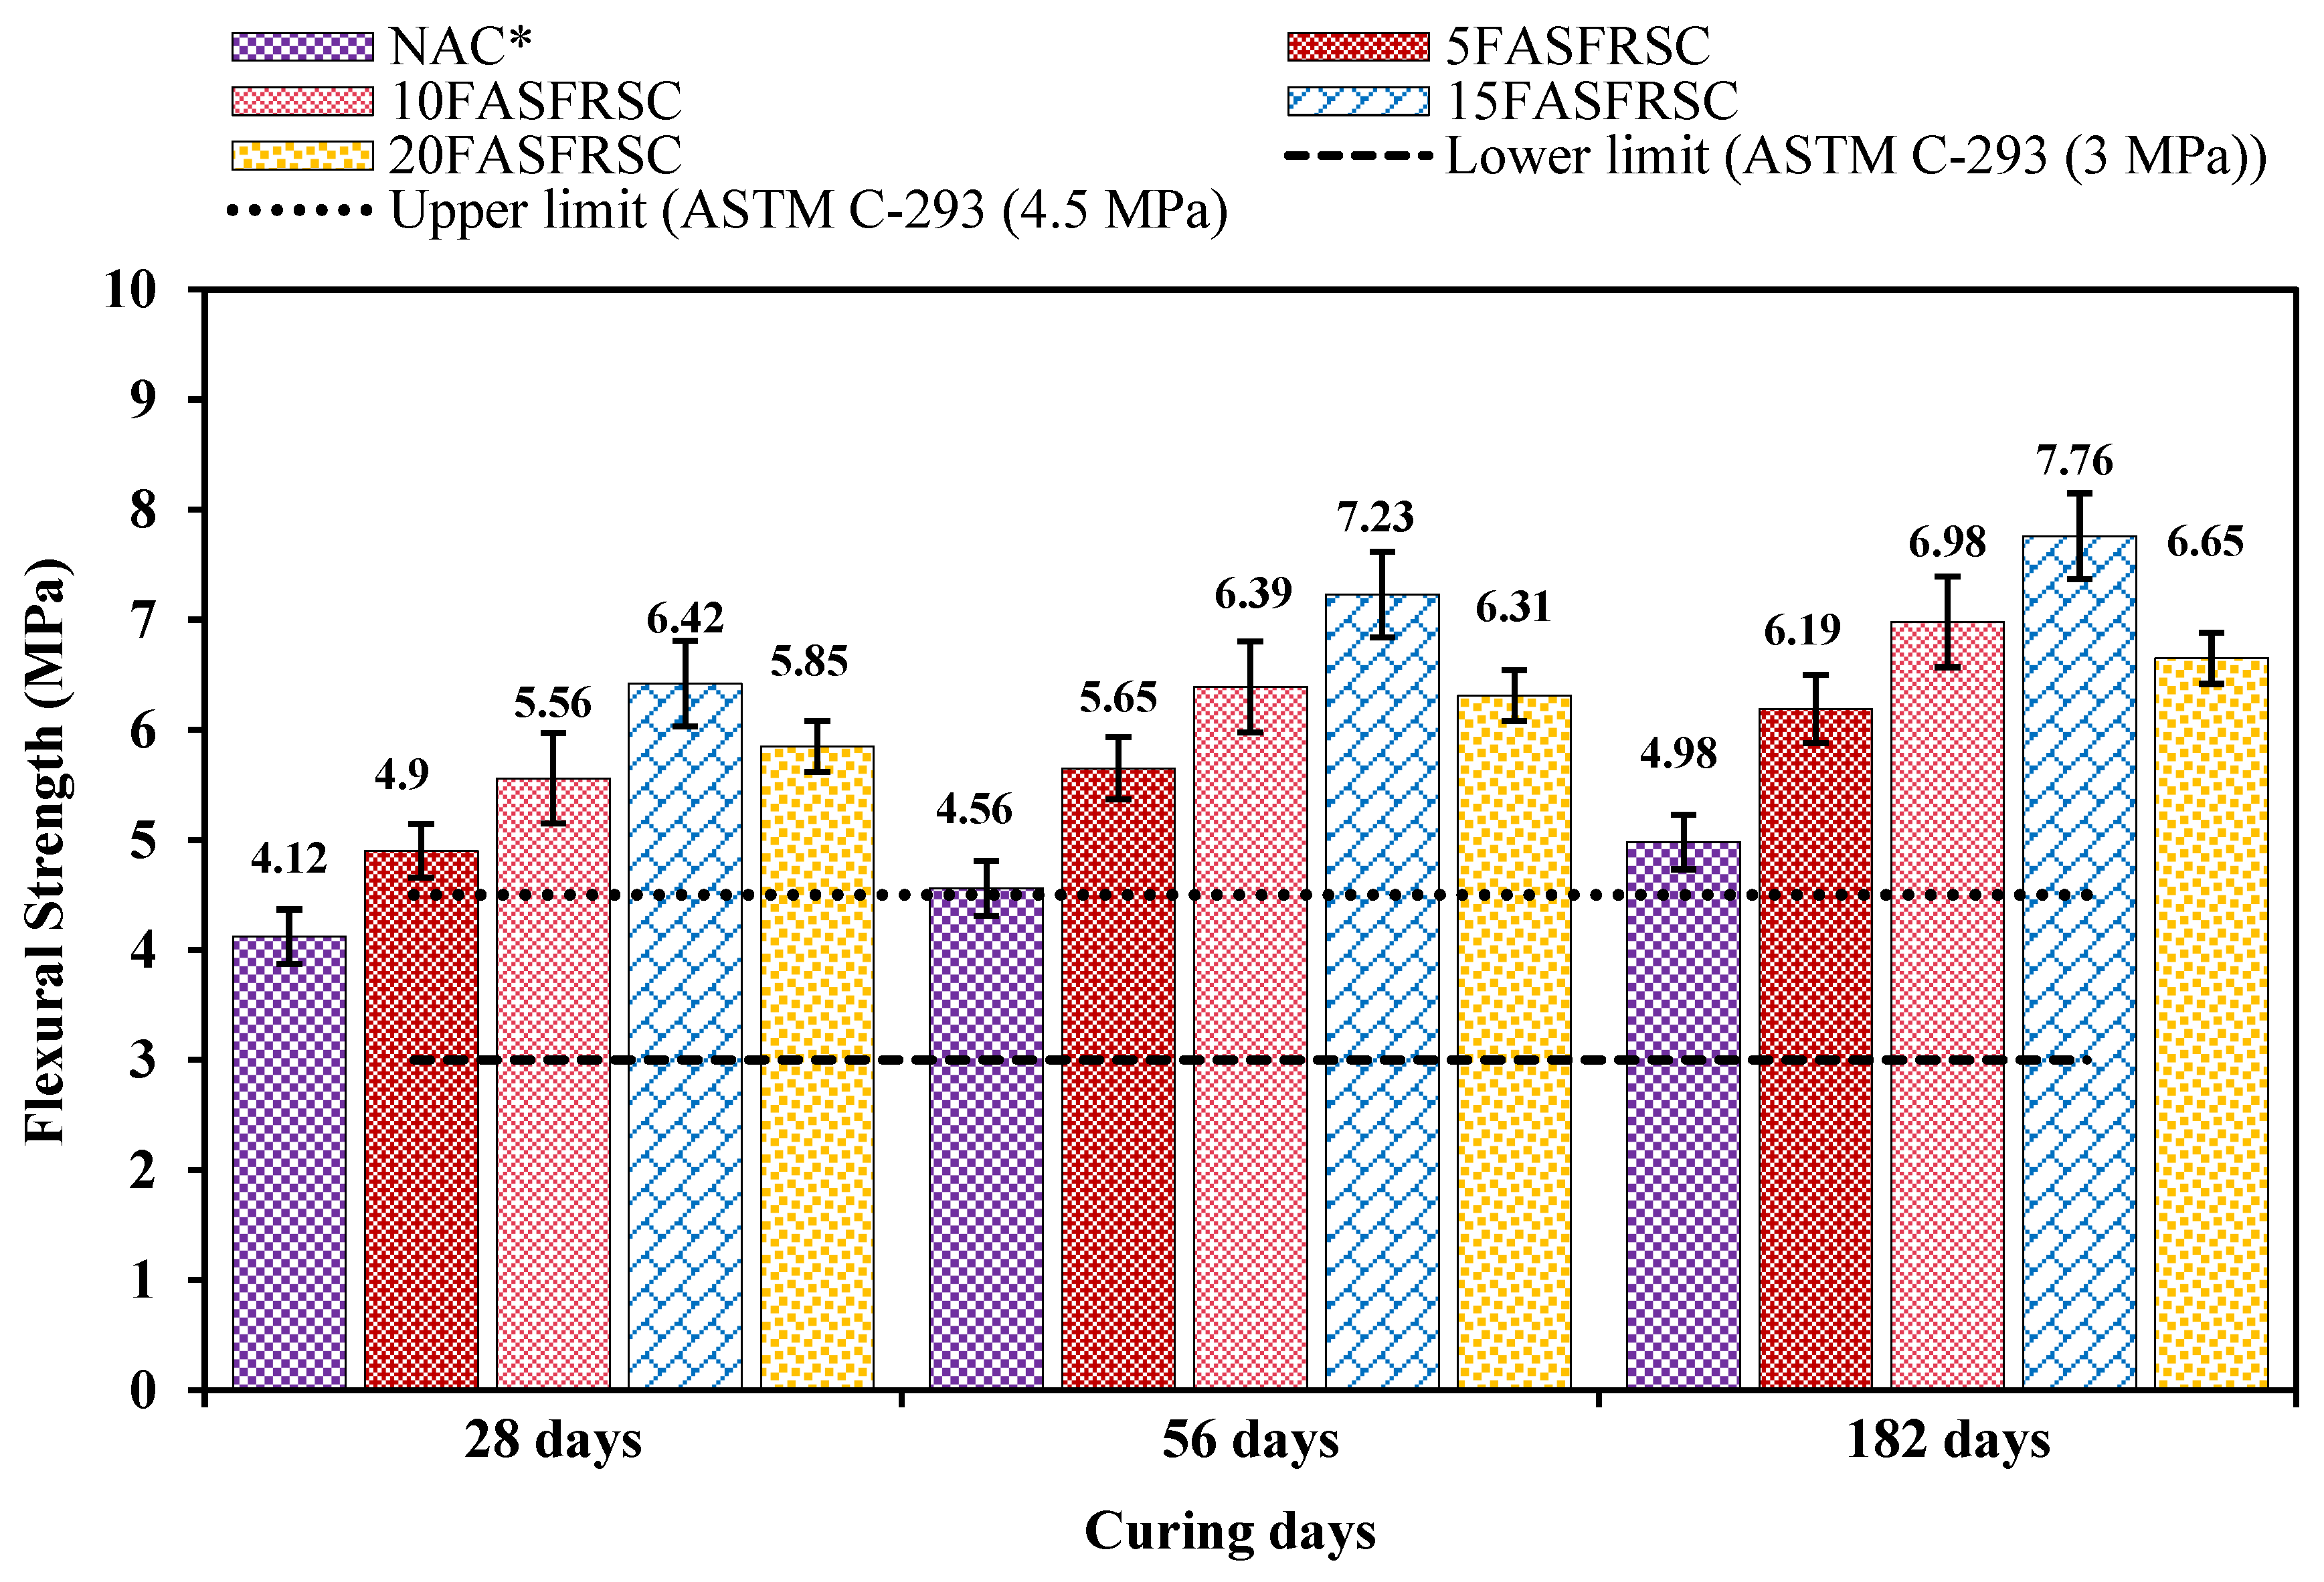
Figure 11.
Compressive stress-strain curves of the tested specimens.
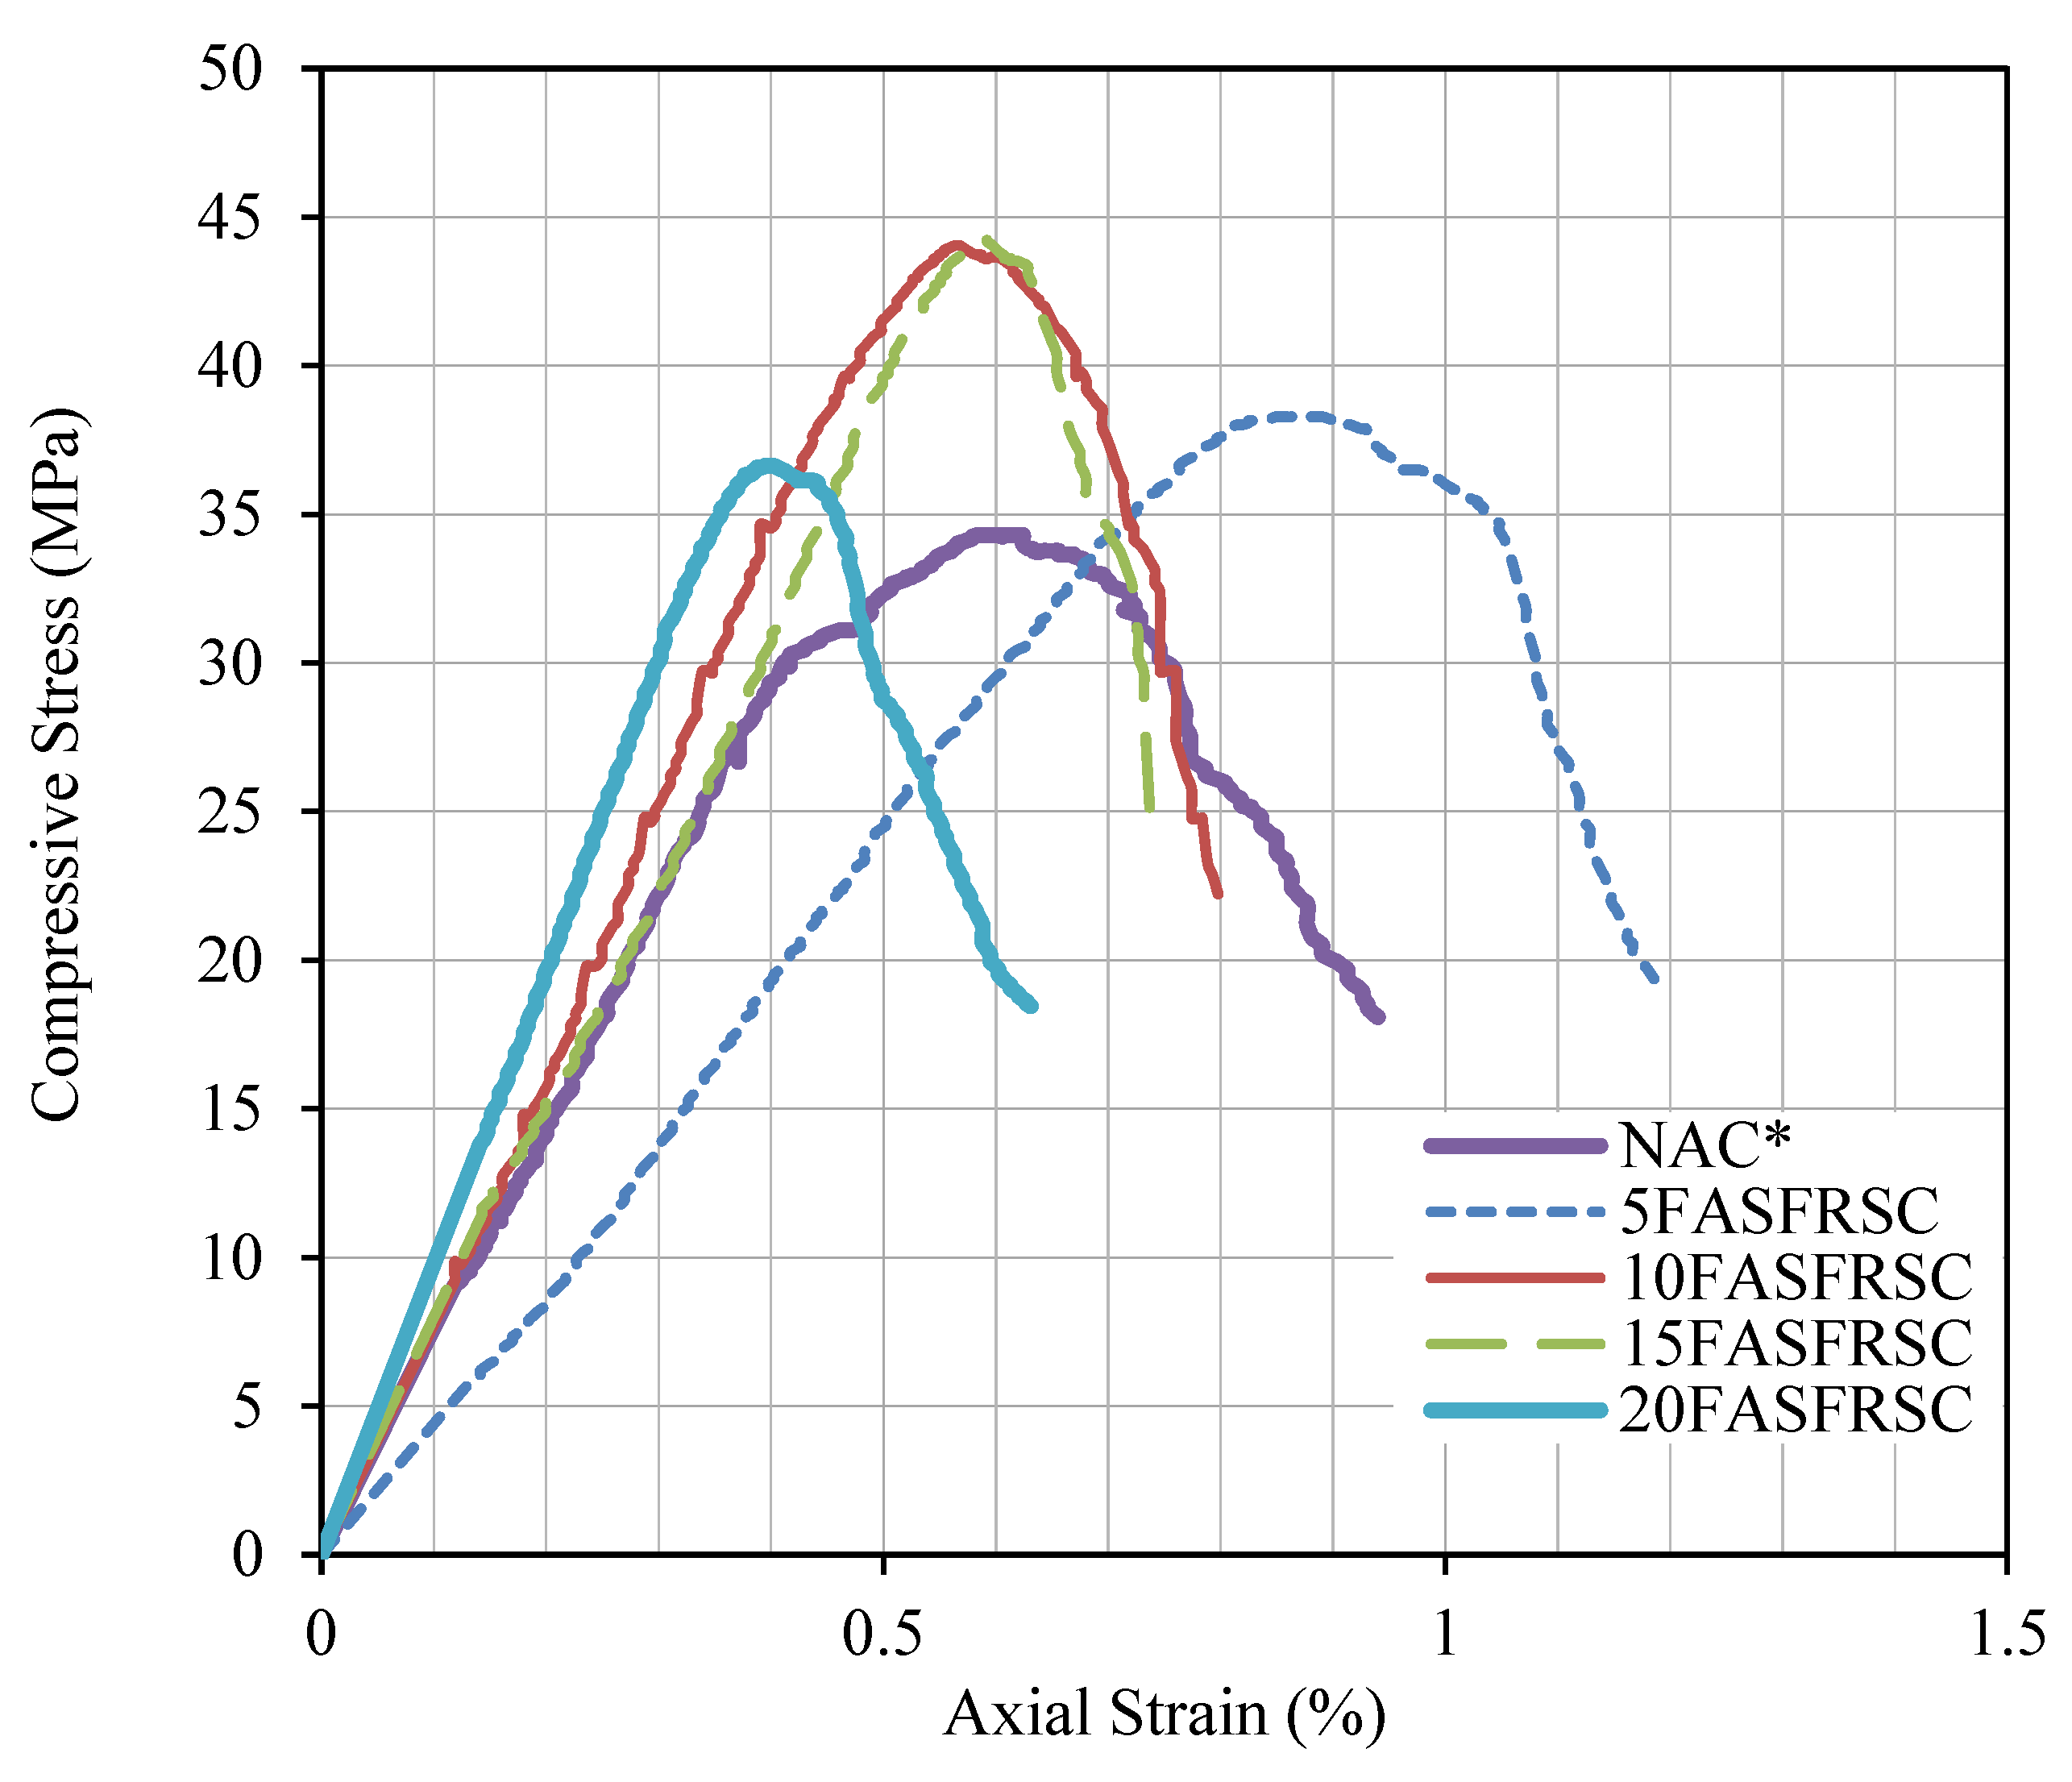
Figure 12.
Water absorption of tested specimens.
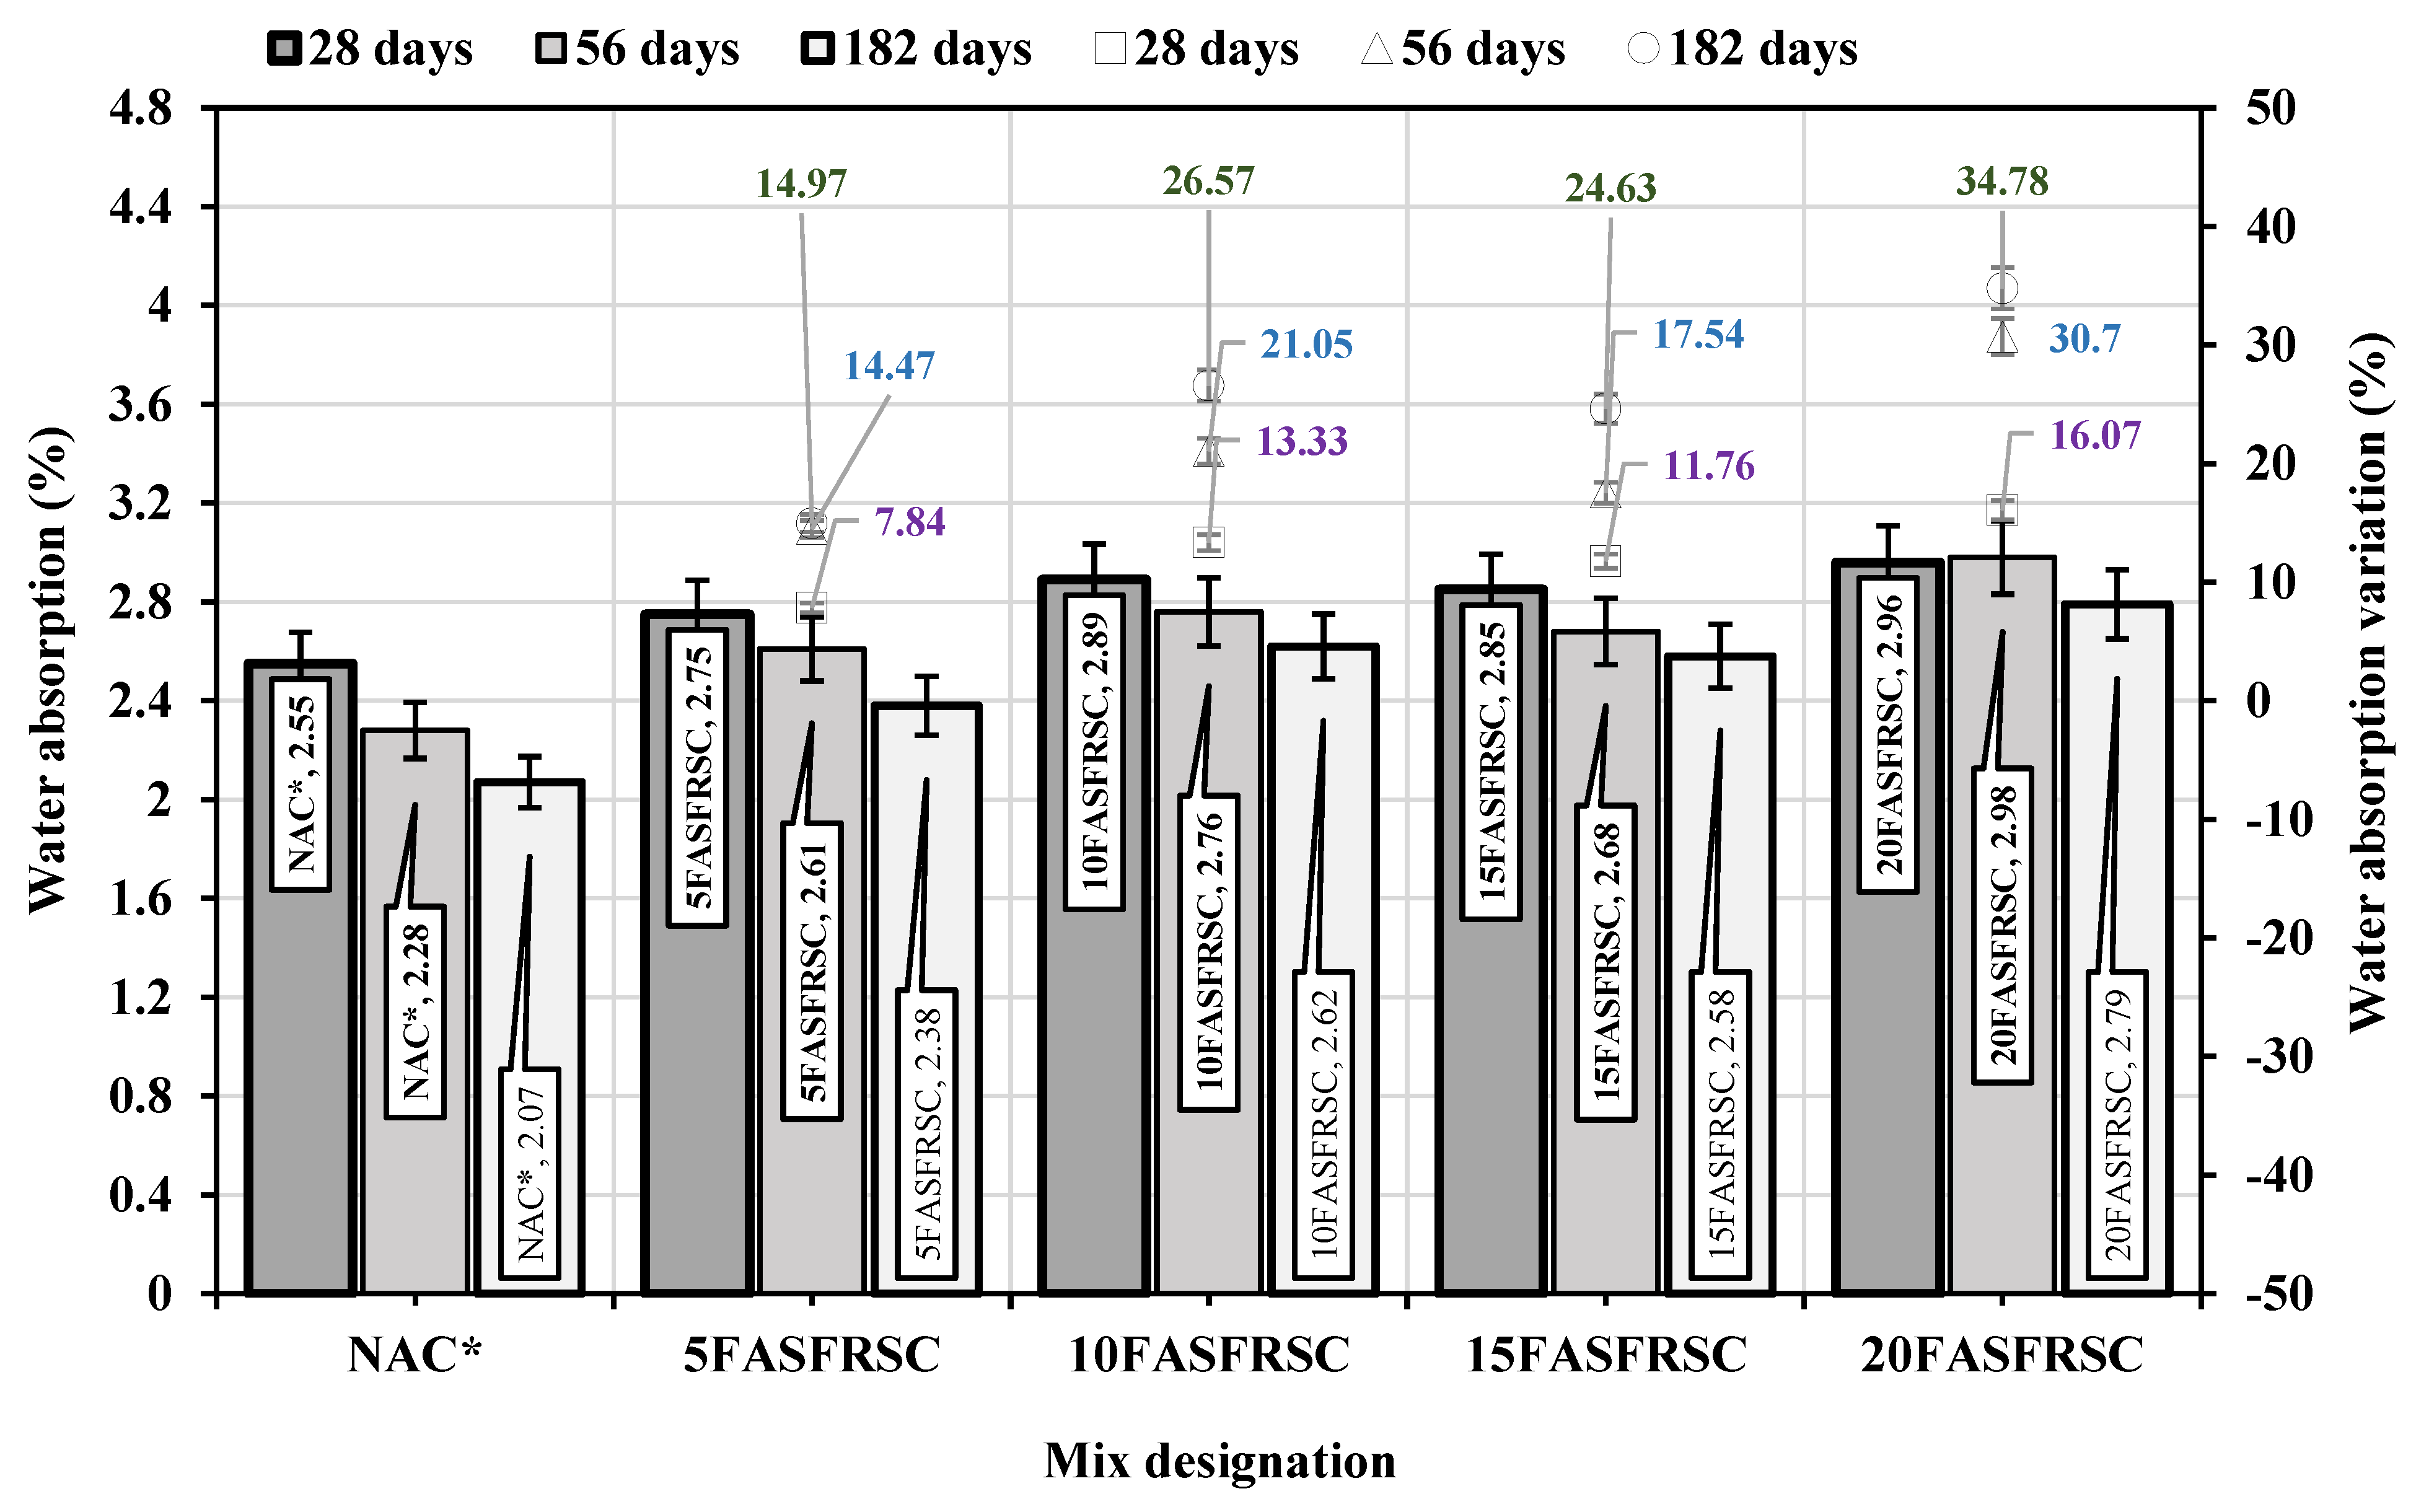
Figure 13.
Setup of sulphuric acid (H2SO4) attack on developed concrete mixes.
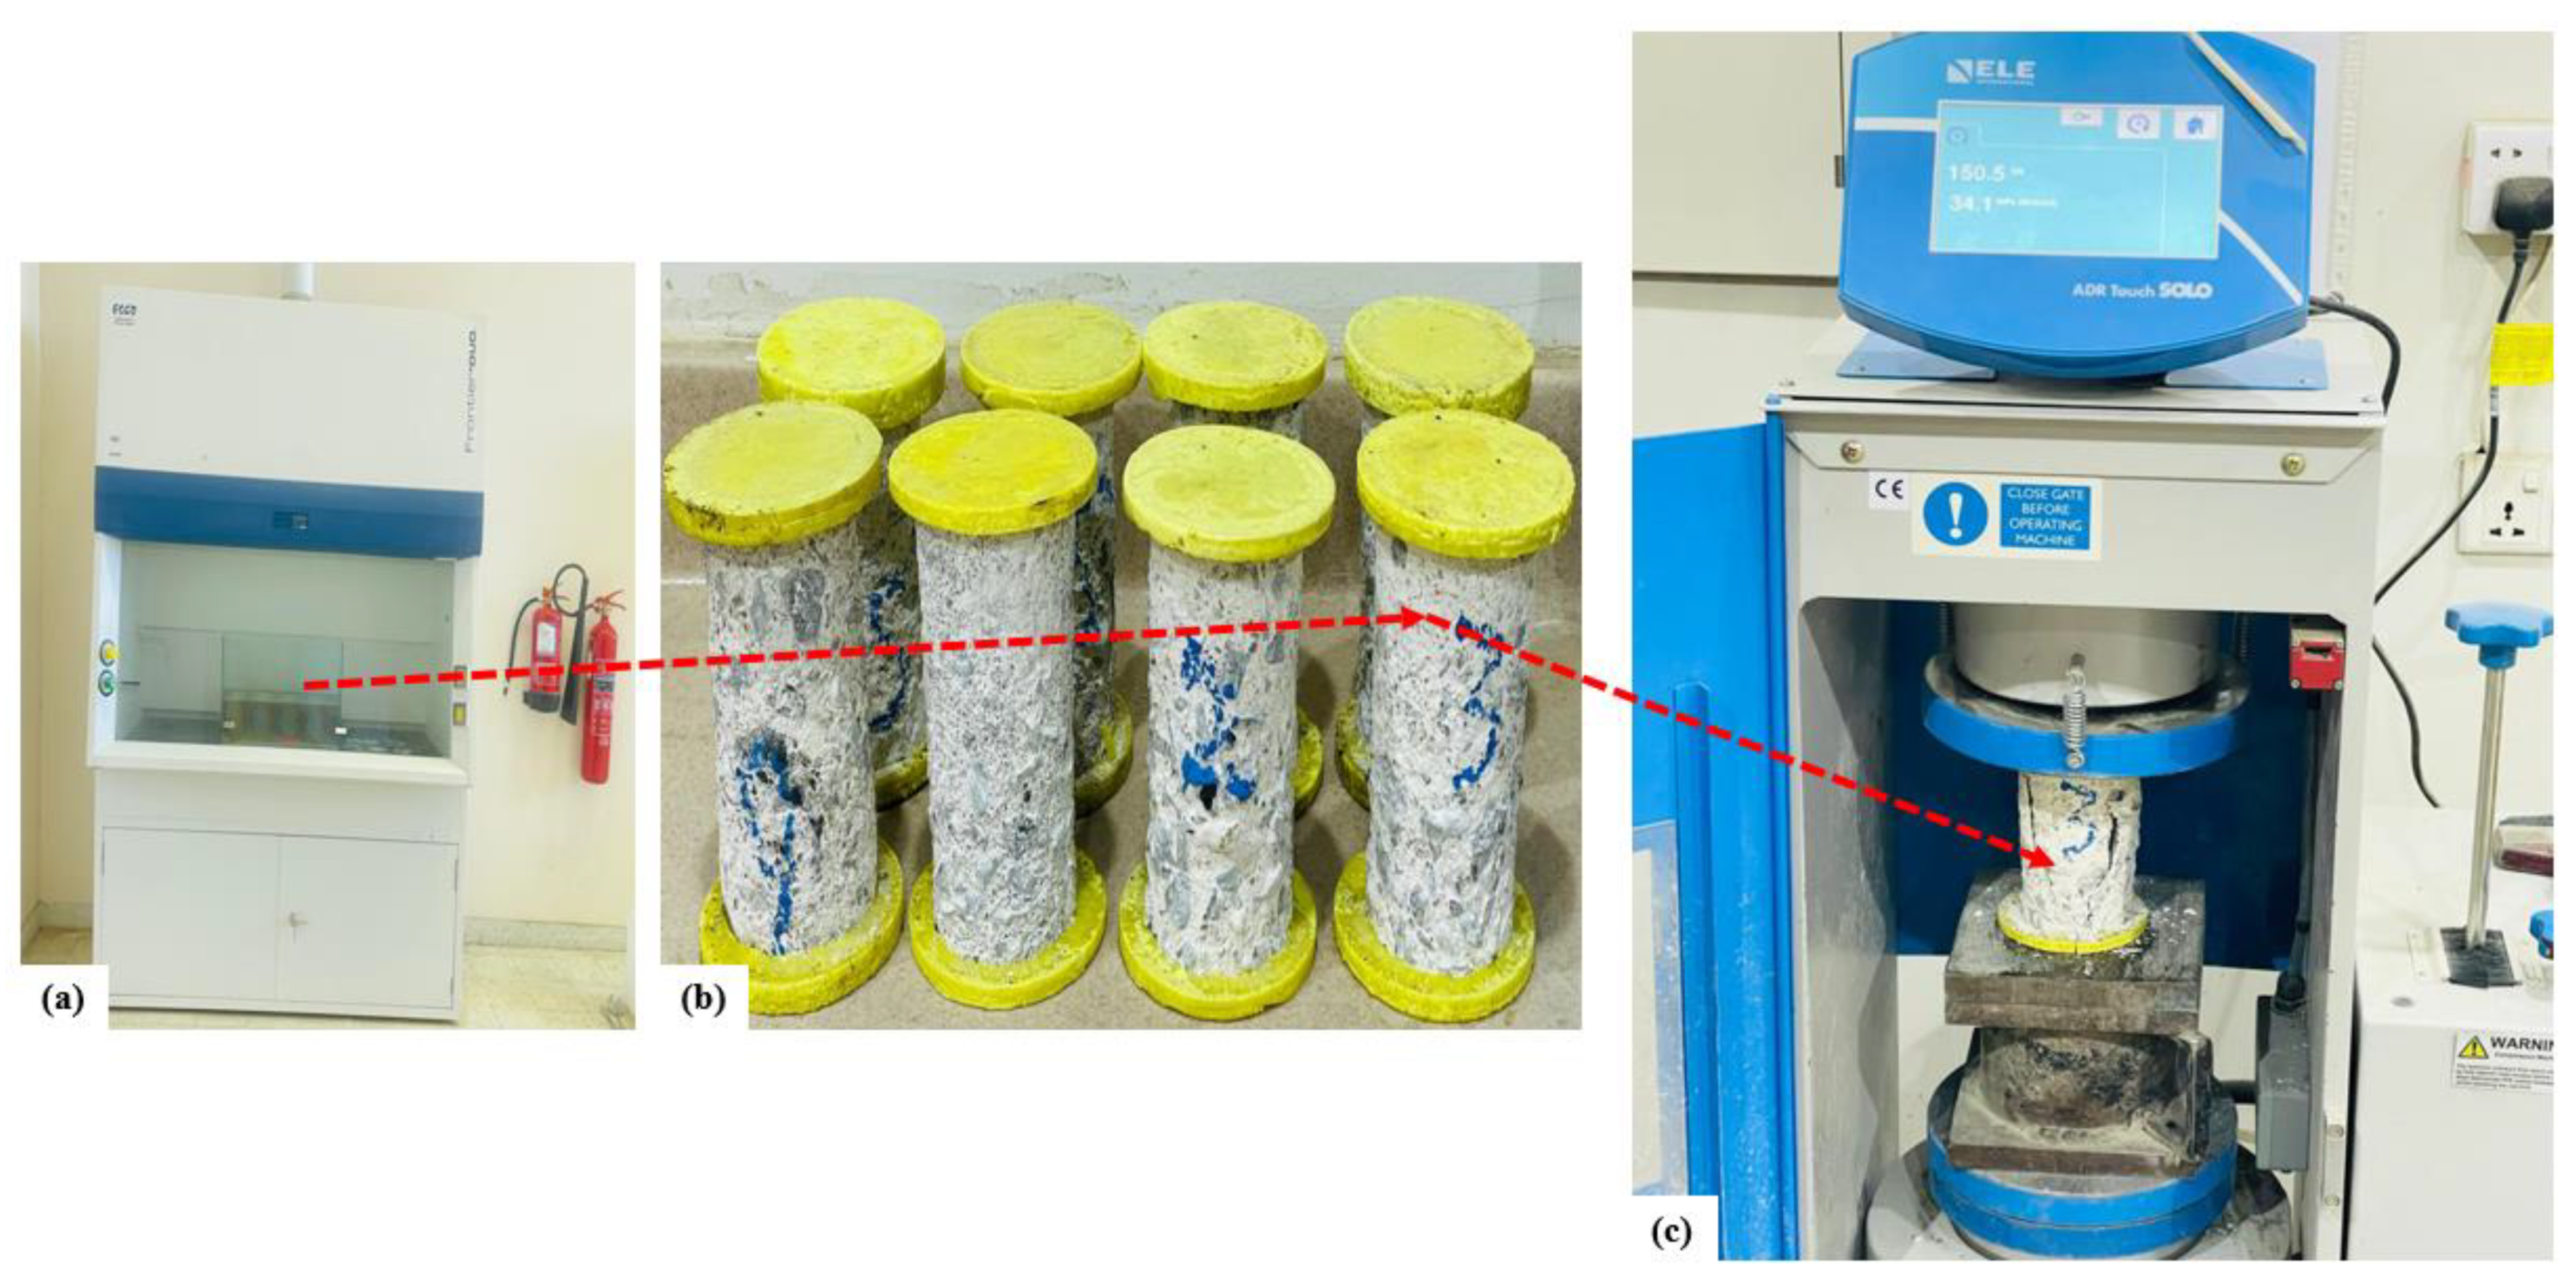
Figure 14.
Change in concrete mass exposed to 5% sulphuric acid solution.
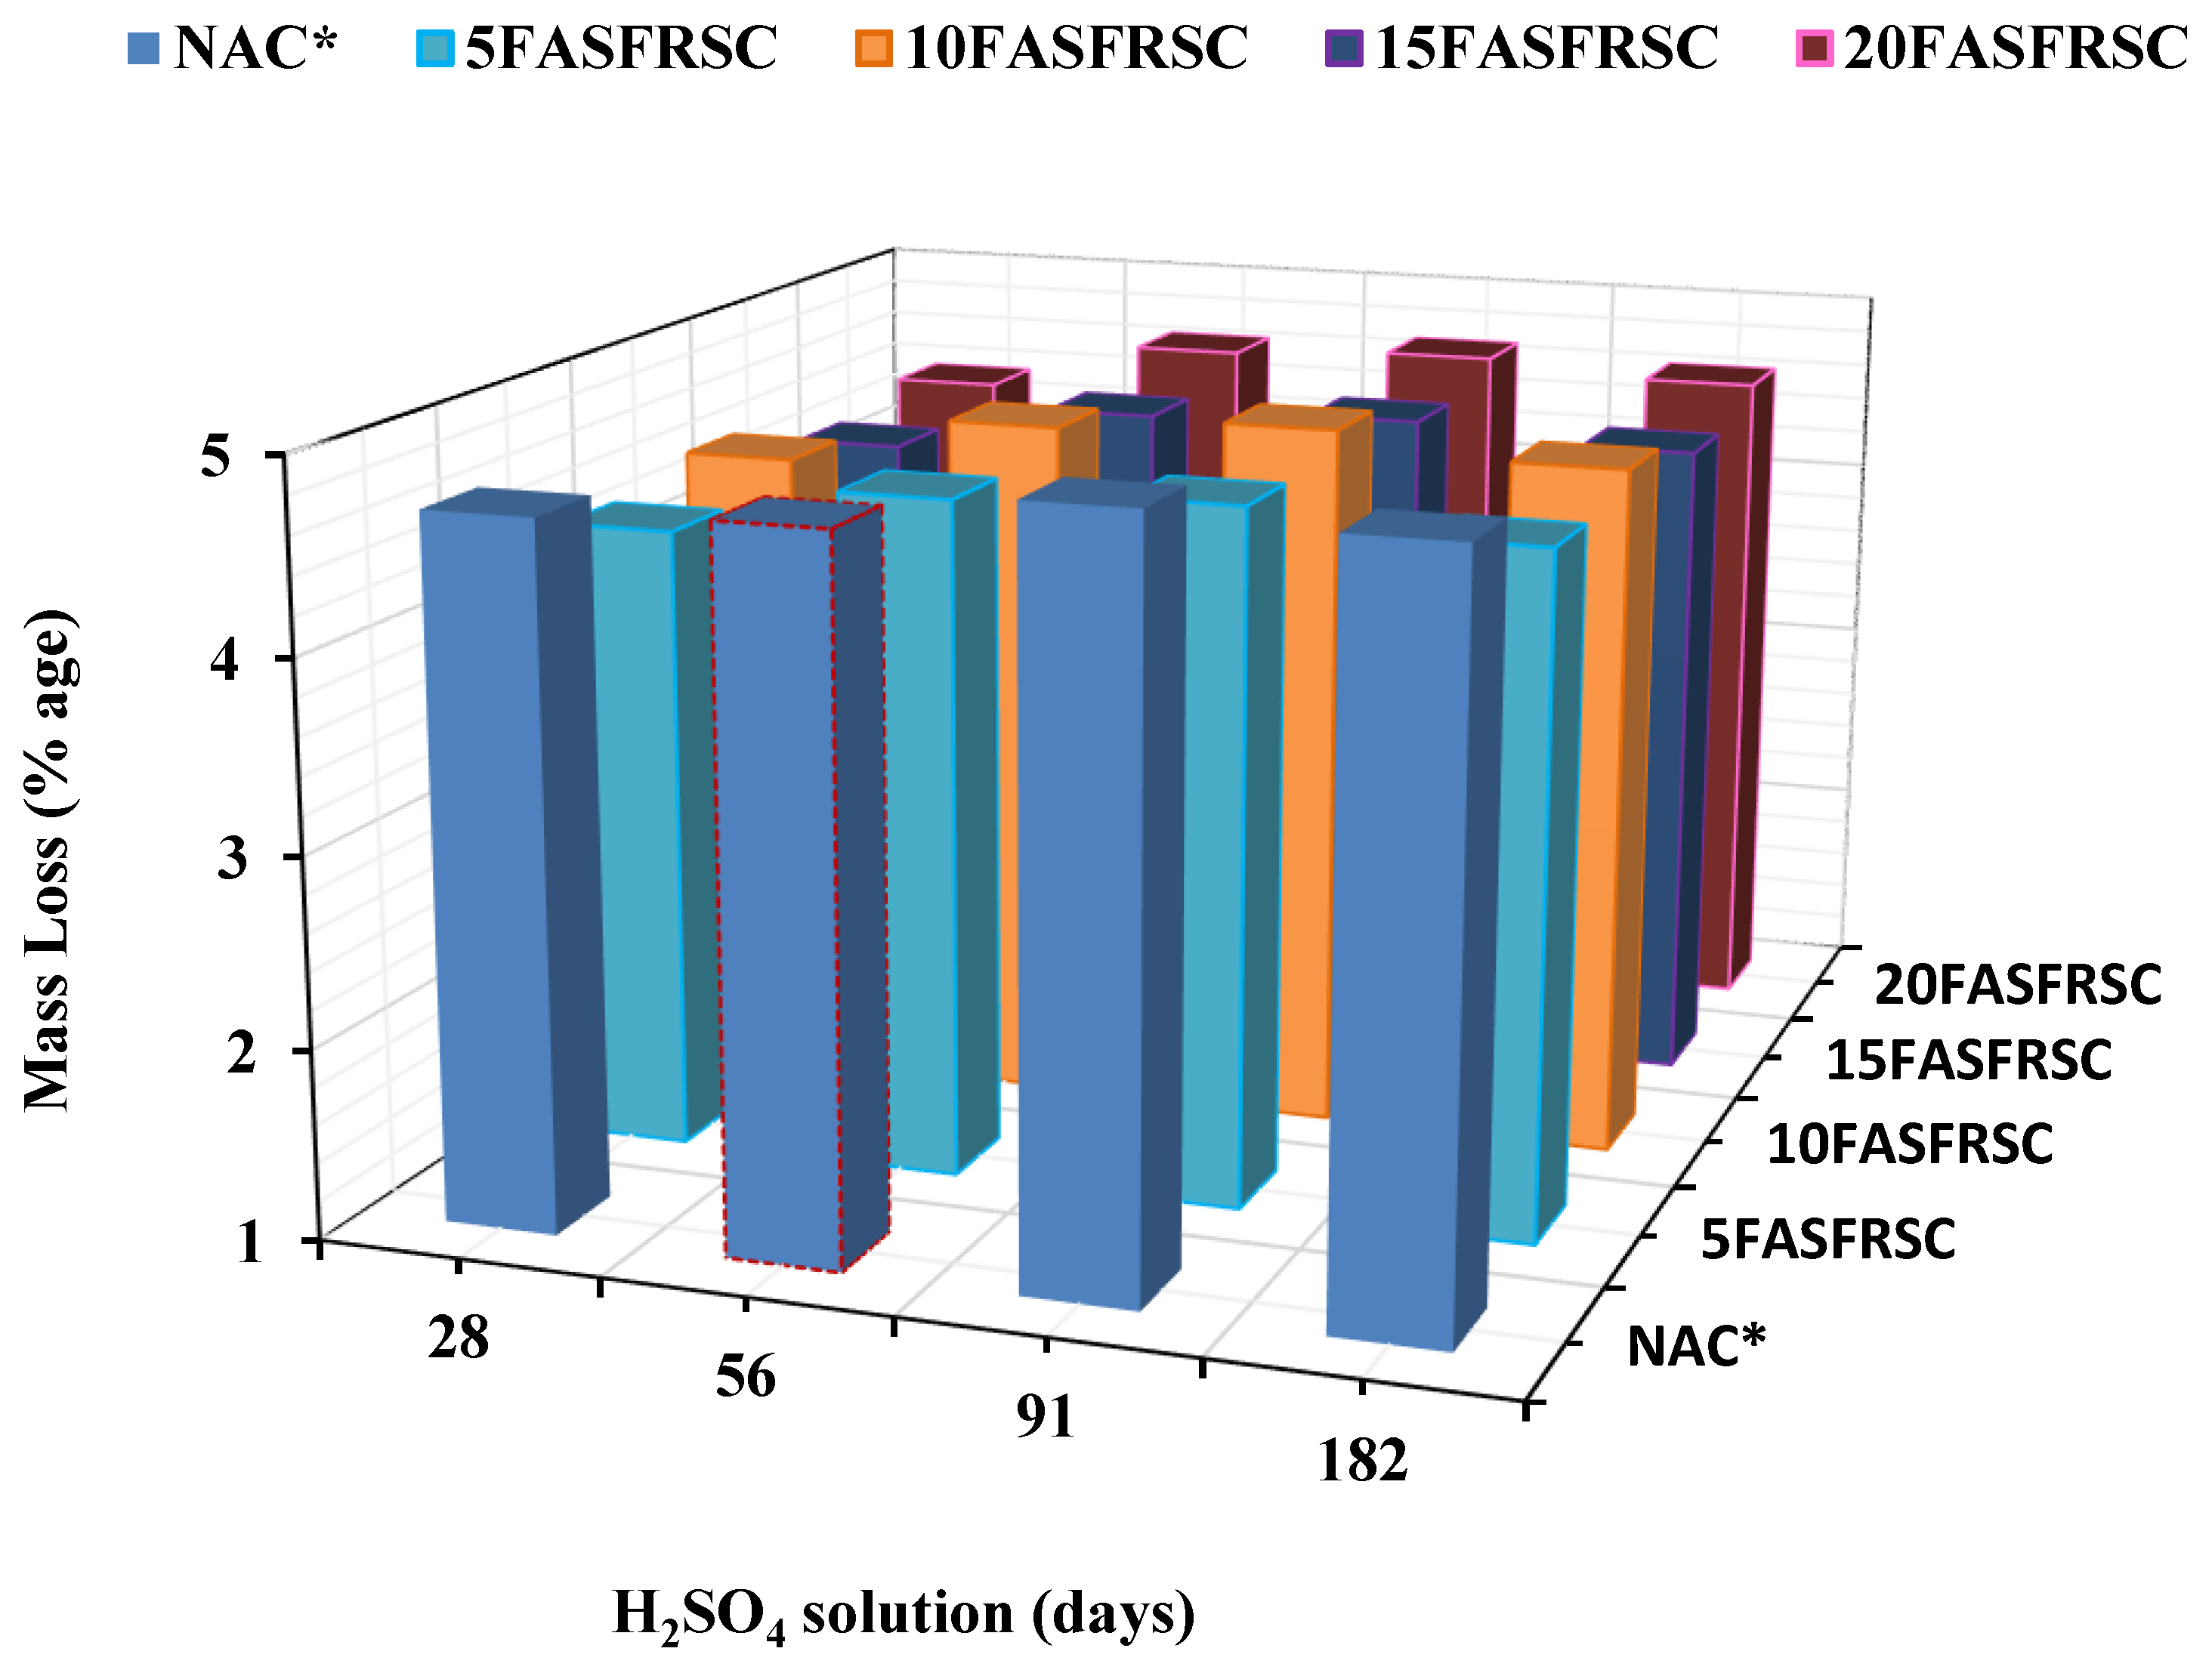
Figure 15.
Reduction in compressive strength of concrete exposed to 5% sulphuric acid solution.
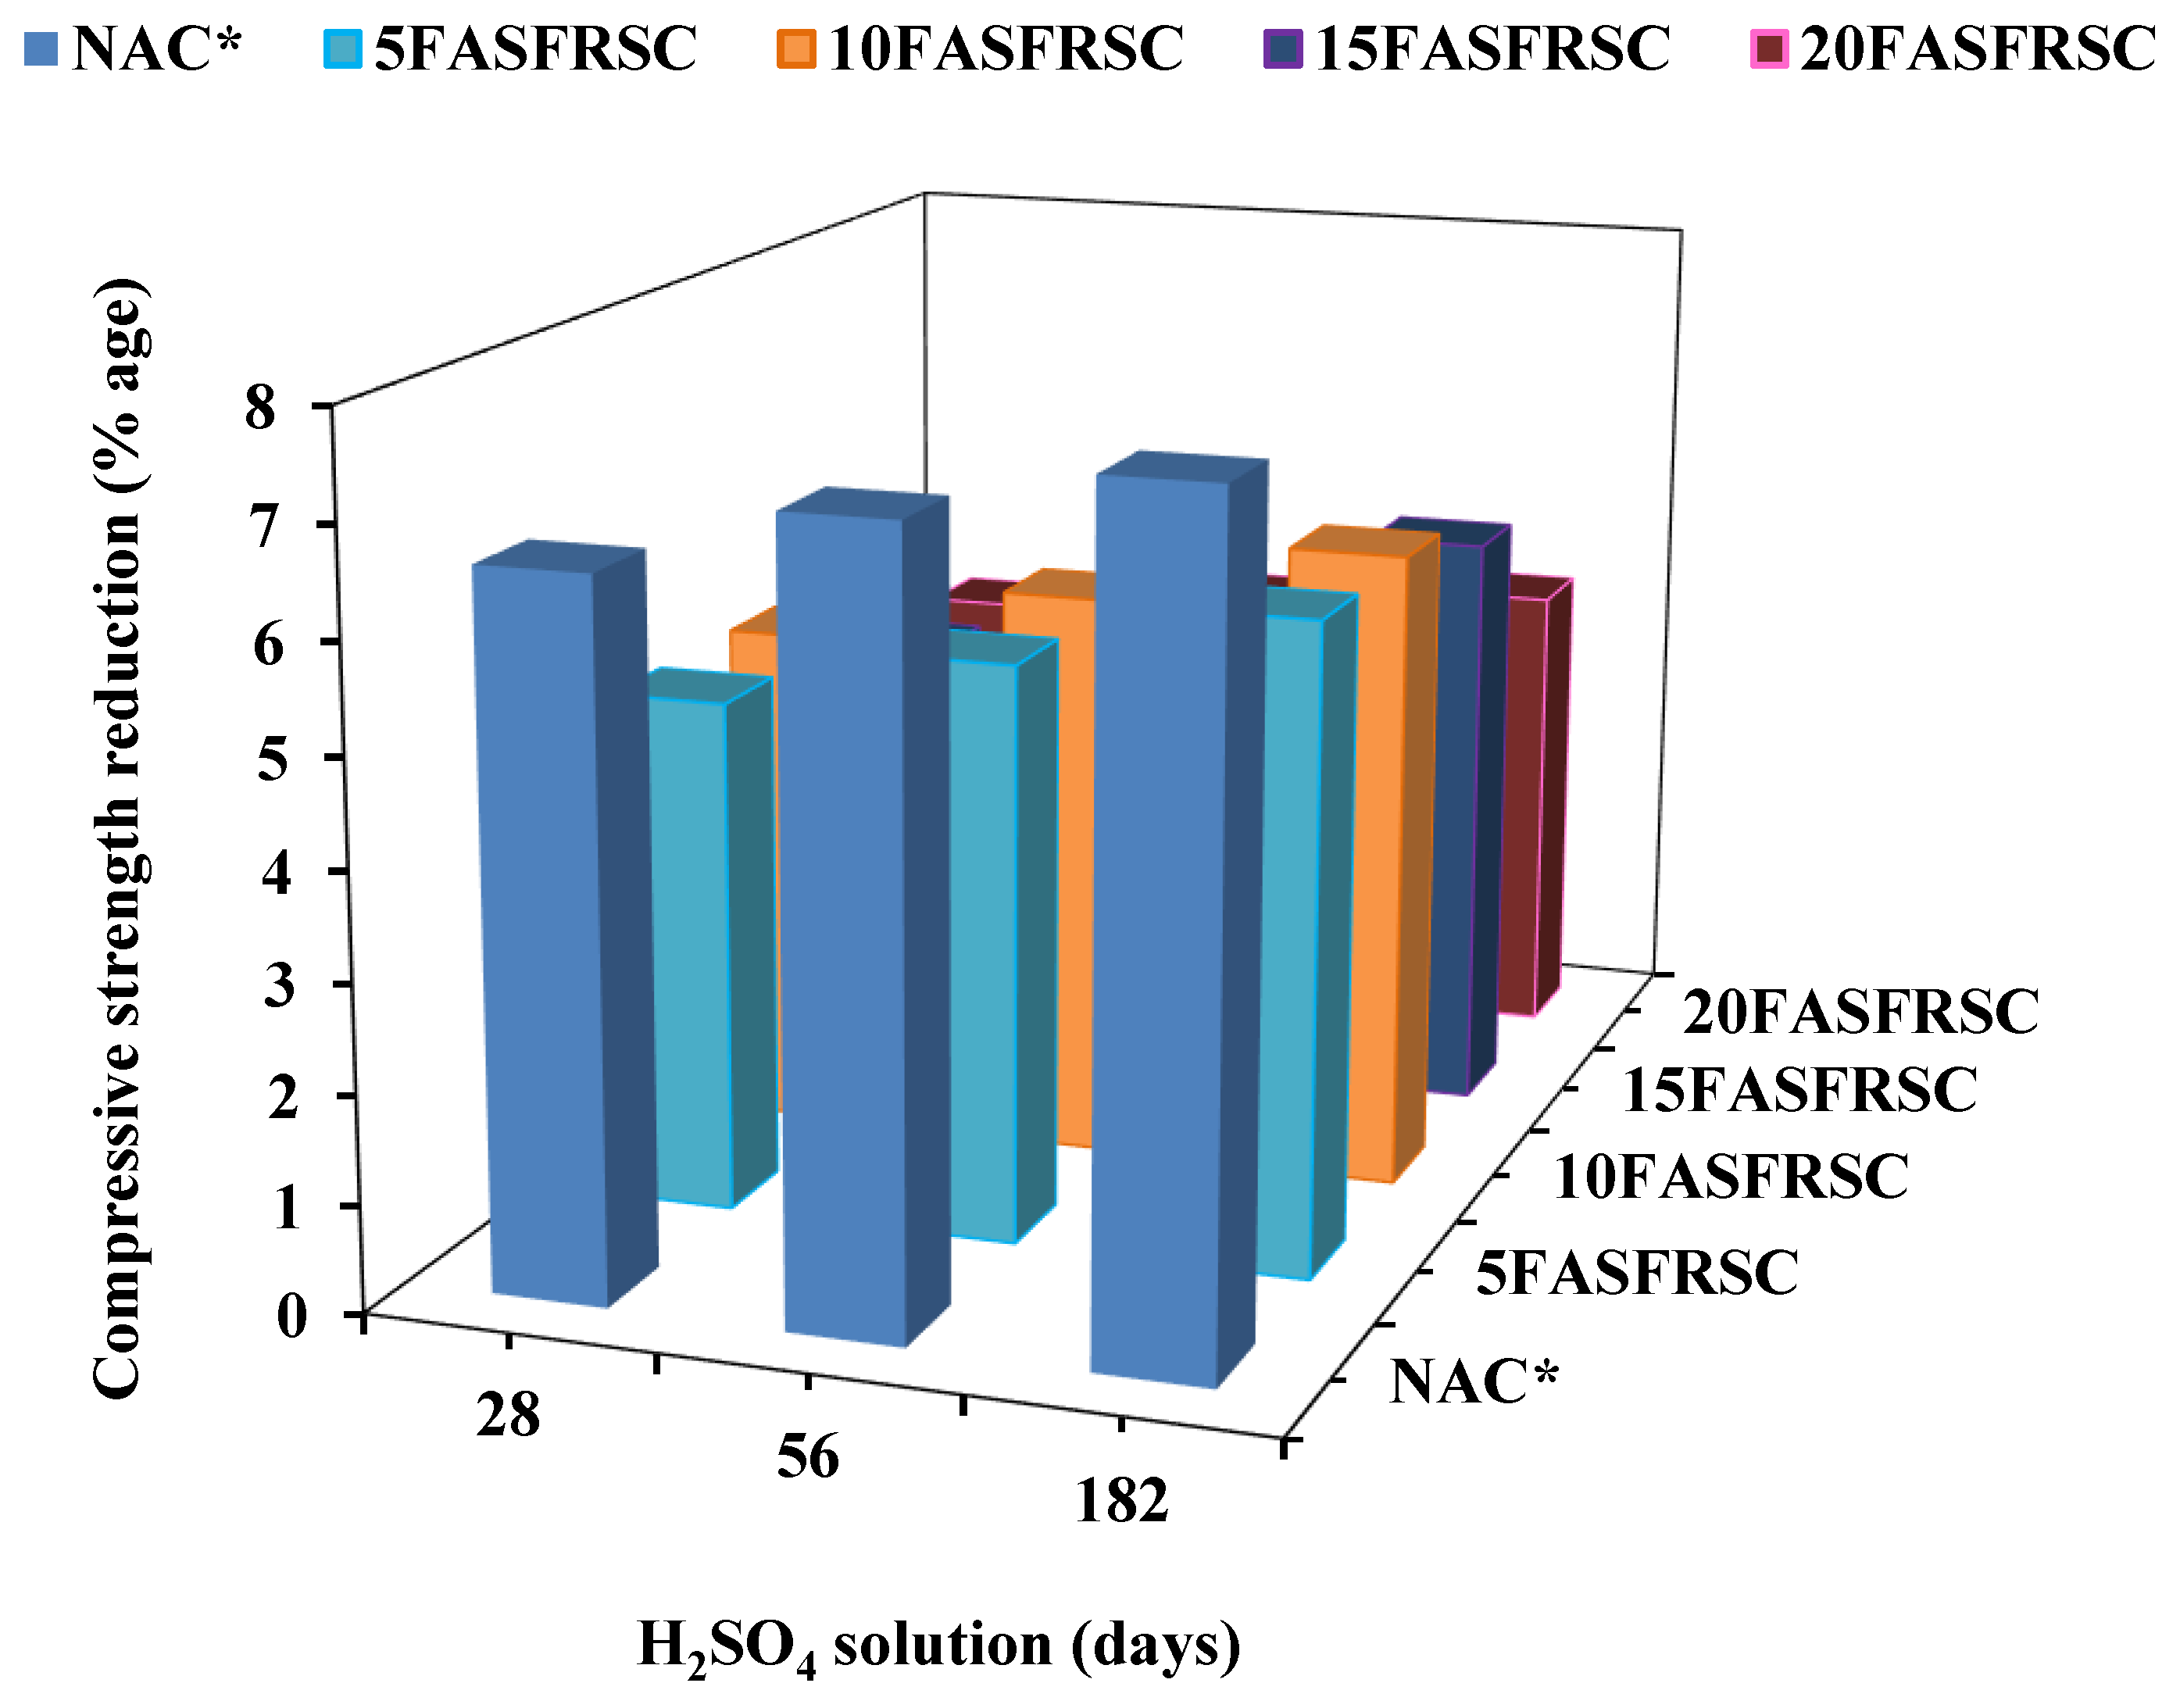

Table 1.
Physico-chemical properties of concrete ingredients.
| Parameters | Ingredient results | ||||||
| Cement | Flyash | Silica fume | R-Sand | M-Sand | Coarse aggregate | Water for mixing concrete ingrideint | |
| Bulk specific gravity | 3.15 | 2.10 | 2.30 | 2.56 | 2.66 | 2.80 | - |
| Absorption (%) | - | - | - | 2.88 | 1.32 | 0.92 | - |
| Sand equivalent values | - | - | - | 94 | 98 | - | - |
| Fineness modulus (FM) | - | - | - | 2.6 | 3.0 | 7.0 | - |
| pH | - | - | - | 7.8 | 7.2 | 7.1 | |
| Sulfate (ppm) | - | - | - | 950 | 268 | 170 | 28 |
| TDS (ppm) | - | - | - | 680 | |||
| Chloride (ppm) | - | - | - | 1010 | 160 | 94 | 40 |
| Organic impurities | - | Nil | Nil | Nil | Nil | Nil | - |
| Salinity | 478 | ||||||
Table 3.
Details of ingredients in different concrete mixes.
| Mix Designation | Cementitious materials % | Fine aggregate % | NCA % |
Admixture by weight of cement (%) | Mix temperature (°C) | Mix Air temperature (°C) | Mix Air content (%) |
||||
| OPC | FA | SF | Total | R-sand | M-sand | ||||||
| NAC* | 100 | 0 | 0 | 100 | 0 | 100 | 100 | 0.0 | 27 | 20 | 2.5 |
| 5FASFRSC | 85 | 5 | 10 | 100 | 50 | 50 | 100 | 0.8 | 26 | 20 | 2.4 |
| 10FASFRSC | 80 | 10 | 10 | 100 | 50 | 50 | 100 | 1.2 | 25 | 20 | 2.5 |
| 15FASFRSC | 75 | 15 | 10 | 100 | 50 | 50 | 100 | 1.6 | 25 | 20 | 2.5 |
| 20FASFRSC | 70 | 20 | 10 | 100 | 50 | 50 | 100 | 2.0 | 25 | 20 | 2.6 |
| NAC* = Natural aggregate concrete (reference mix*) | |||||||||||
| 5FASFRSC = (5%FA+10%SF+(50%R-Sand+50%M-Sand)) | |||||||||||
| 10FASFRSC = (10%FA+10%SF+(50%R-Sand+50%M-Sand)) | |||||||||||
| 15FASFRSC = (15%FA+10%SF+(50%R-Sand+50%M-Sand)) | |||||||||||
| 20FASFRSC = (20%FA+10%SF+(50%R-Sand+50%M-Sand)) | |||||||||||
Disclaimer/Publisher’s Note: The statements, opinions and data contained in all publications are solely those of the individual author(s) and contributor(s) and not of MDPI and/or the editor(s). MDPI and/or the editor(s) disclaim responsibility for any injury to people or property resulting from any ideas, methods, instructions or products referred to in the content. |
© 2025 by the authors. Licensee MDPI, Basel, Switzerland. This article is an open access article distributed under the terms and conditions of the Creative Commons Attribution (CC BY) license (https://creativecommons.org/licenses/by/4.0/).
Copyright: This open access article is published under a Creative Commons CC BY 4.0 license, which permit the free download, distribution, and reuse, provided that the author and preprint are cited in any reuse.


