
Submitted:
24 April 2025
Posted:
27 April 2025
You are already at the latest version
Abstract
This study applies supervised machine learning algorithms to macro-fiscal panel data from 20 EU member states (2000–2024) to model and predict fiscal stress episodes in the Eurozone. Conventional frameworks for assessing public debt sustainability typically rely on static thresholds and linear dynamics, which are inadequate for capturing the complex, non-linear interactions inherent in fiscal datasets. To address this limitation, we implement logistic regression, random forests, and XGBoost classifiers using fiscal indicators such as debt-to-GDP ratio, primary balance, GDP growth, interest rates, and inflation. Model performance is assessed through out-of-sample validation metrics and feature importance analyses. Results indicate that machine learning models outperform traditional benchmarks in identifying periods of fiscal vulnerability, underscoring their utility for scalable early warning systems and enhanced macro-financial oversight. This work advances FinTech applications in sovereign risk monitoring by demonstrating the efficacy of AI-based tools in improving fiscal governance and policy responsiveness.
Keywords:
fiscal risk assessment
; public debt sustainability
; machine learning
; eurozone
; macroeconomic forecasting
1. Introduction
Rising public debt and persistent fiscal fragility across Eurozone economies have reignited concerns over sovereign risk and long-term fiscal sustainability. Despite periods of fiscal consolidation following the global financial crisis and the COVID-19 pandemic, debt-to-GDP ratios remain elevated in many member states, particularly in France, Italy, and Belgium [1]. Structural weaknesses—such as sluggish growth, ageing populations, and growing interest burdens—compound fiscal pressures, challenging governments' ability to maintain debt sustainability without politically costly fiscal adjustments (IMF, 2024a). Recent warnings by the ECB emphasize the increasing risks posed by the confluence of high debt levels, tightening financial conditions, and weak economic momentum [1].
Traditional fiscal risk assessment frameworks, including the European Commission’s S0/S1 indicators and the IMF’s Debt Sustainability Analysis (DSA), rely heavily on deterministic models and assumptions about policy behavior that may not hold in volatile macroeconomic environments [2]. These tools often fail to capture real-time shifts in fiscal fundamentals, as they depend on annual data updates and backward-looking indicators [3]. Moreover, their limited capacity to account for complex interactions between variables and non-linear dynamics has led to poor predictive performance in past crises, including the Eurozone debt crisis [4]. As such, there is a growing recognition of the need for more responsive, adaptive, and data-driven approaches to fiscal risk assessment.
Recent advances in financial technology, particularly in artificial intelligence (AI) and machine learning (ML), offer promising avenues for enhancing fiscal risk monitoring. These techniques excel at identifying patterns, interactions, and thresholds in large, high-dimensional datasets—features often overlooked in traditional econometric models [5]. For instance, random forests and gradient boosting machines have been successfully employed to predict sovereign defaults, fiscal distress episodes, and credit rating downgrades with greater precision than logit or probit models [6]. In parallel, central banks and financial supervisors are increasingly experimenting with AI for real-time surveillance and stress testing [1]. However, the application of AI/ML to fiscal sustainability analysis remains underdeveloped. While several studies have explored their potential in financial markets, far fewer have integrated them into formal public finance frameworks. Moreover, the integration of real-time fiscal data—such as monthly revenues, expenditures, or high-frequency proxies like satellite or VAT data—into AI-driven sovereign risk models is rare [7,8]. This limits the operational utility of such models for timely policy interventions.
The objective of this study is to build and test predictive models for sovereign fiscal risk using macro-fiscal panel data from 2000 to 2024 across Eurozone countries. Drawing on a combination of supervised ML algorithms and traditional fiscal diagnostics, the study aims to bridge the gap between theoretical sustainability models and practical forecasting tools. Specifically, it seeks to: (1) identify key fiscal and macroeconomic predictors of stress episodes; (2) assess the predictive performance of alternative AI/ML models; and (3) explore the added value by incorporating real-time data signals. In doing so, the study contributes to the emerging literature on AI-enabled public finance and offers practical insights for fiscal authorities, financial institutions, and multilateral organizations.
2. Literature Review
Theoretical Review
This study is grounded in the intertemporal budget constraint (IBC), a foundational concept in public finance that stipulates a government must generate sufficient future primary surpluses to service and stabilize its existing debt stock. Formally,
where is the primary balance, r is the real interest rate. The IBC requires that the present value of future primary balances offsets current public debt obligations, ensuring that fiscal policy remains solvent over time. A violation of this condition implies a risk of unsustainable debt accumulation, fiscal distress, or eventual default.
Building on this foundation, we adopt the fiscal reaction function framework proposed by [9], which provides an empirical test for sustainability. In this framework, a government is said to follow a sustainable fiscal policy if it systematically adjusts its primary balance in response to rising public debt levels. Specifically, a positive and statistically significant response of the primary balance to lagged debt,
where indicates sustainable policy (governments adjust primary balance in response to debt). Conversely, a weak or negative response may indicate fiscal fatigue, institutional constraints, or political unwillingness to consolidate.
This framework is well-suited to machine learning extensions, as it allows for the estimation of complex, nonlinear relationships between fiscal indicators and the risk of unsustainable debt. Our study leverages this structure to evaluate fiscal behavior across Eurozone countries using AI-driven models, while remaining anchored in economic theory. By doing so, we bridge the gap between predictive performance and theoretical coherence, enabling the development of policy-relevant early warning systems for fiscal sustainability.
Figure 1.
Conceptual Framework for AI-Driven Fiscal Risk Assessment in the Eurozone.
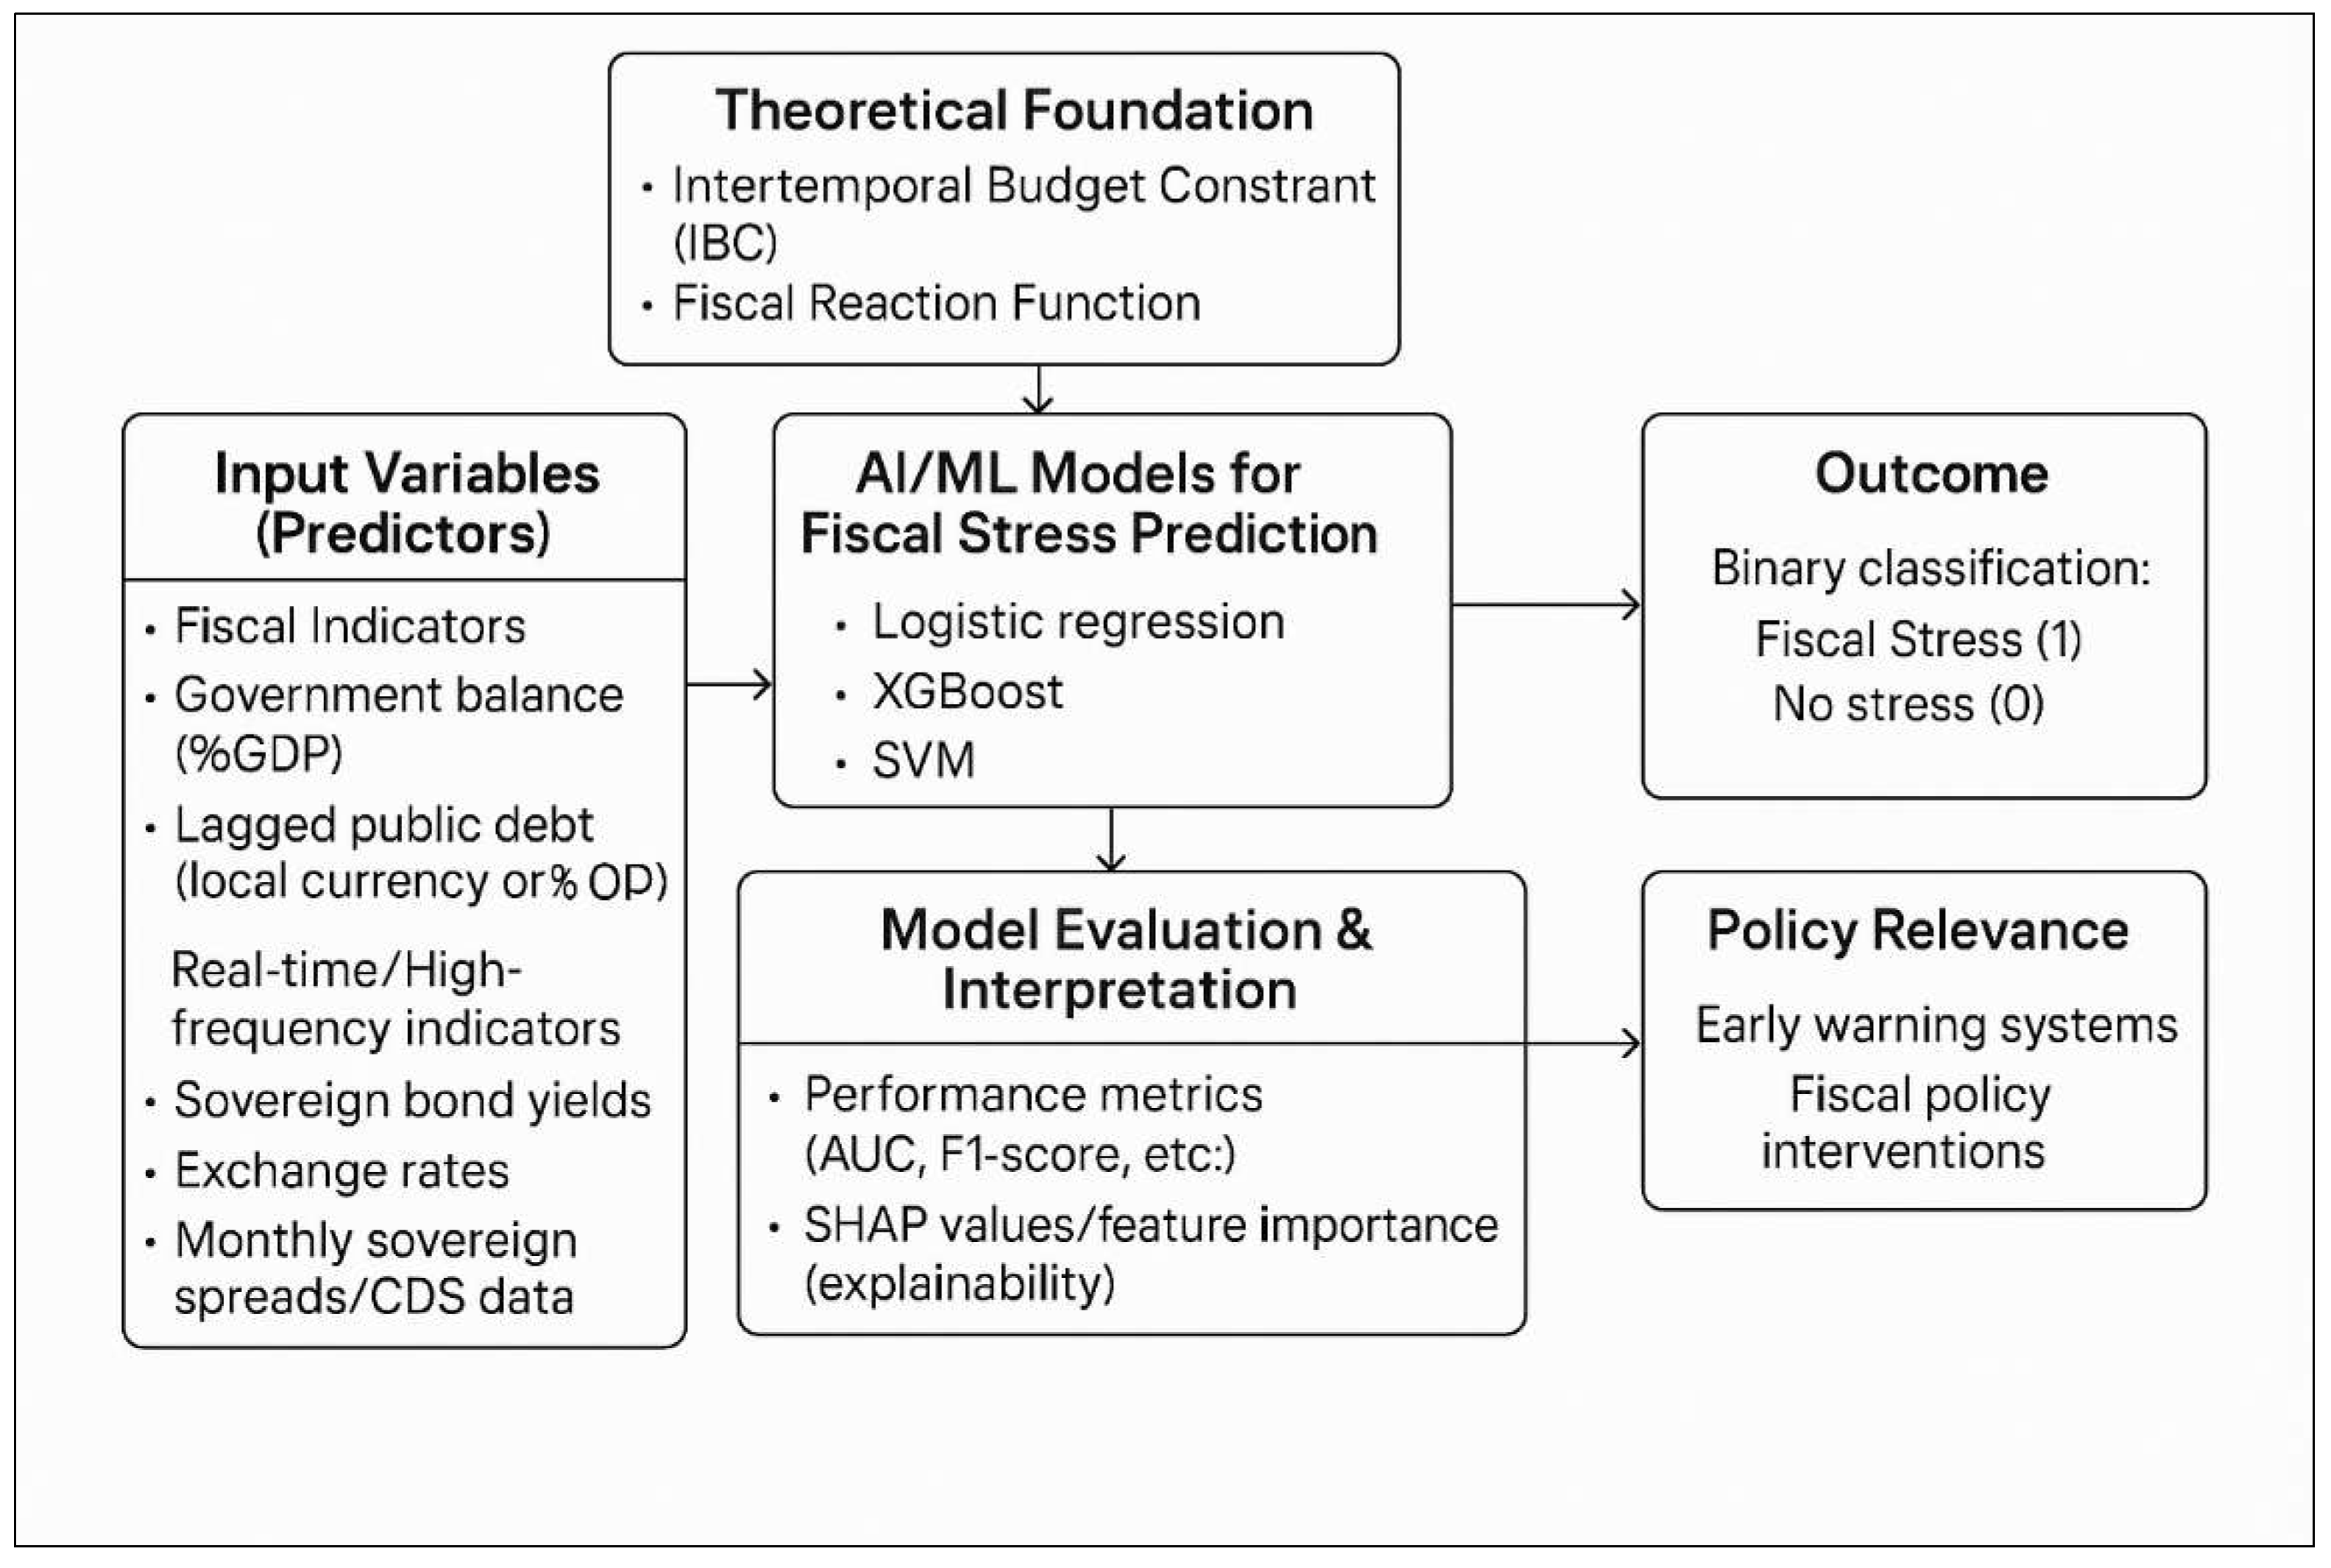
This framework outlines an AI/ML-based approach to predict fiscal stress, grounded in fiscal theory [9]. It uses fiscal indicators (e.g., debt, government balance, spreads) as predictors in models like logistic regression, XGBoost, and SVM for binary classification (stress vs. no stress). Model performance is evaluated using metrics (AUC, F1-score, etc.) and SHAP values for interpretability. The goal is to support early warning systems and fiscal policy interventions.
Empirical Review
Recent empirical studies on fiscal sustainability and sovereign risk prediction reveal a growing reliance on machine learning (ML) and artificial AI techniques to enhance predictive accuracy. A significant portion of the literature focuses on the Eurozone, where persistent debt concerns have spurred interest in early warning systems. Studies such as [5] and [10] demonstrate that ML models—including random forests, gradient boosting, and support vector machines—outperform traditional econometric methods in identifying fiscal stress and predicting sovereign credit events. Similarly, [11] confirm the effectiveness of ML approaches in forecasting fiscal crises, particularly in emerging and developing economies.
Several recent contributions underscore the potential of AI models to complement or surpass institutional benchmarks. [12] evaluate multiple algorithms—such as classification trees and neural networks—to predict sovereign credit ratings, finding substantial performance gains relative to macro-based scorecards. [13] expand the scope by integrating ESG factors into sovereign credit risk models using explainable AI techniques, signaling a shift toward sustainability-informed fiscal surveillance. Furthermore, [14] provide a systematic review of ML applications in financial risk management, highlighting the rapid methodological advances applicable to public finance. [15] advocate for explainable ML models in fiscal risk settings, showing that transparency can be preserved without sacrificing predictive power. [16] and [8] emphasize the centrality of debt dynamics and interest-growth differentials in shaping sovereign vulnerabilities. These findings resonate with the work of [17], who show that gradient-boosted tree models predict sovereign stress more reliably than structural balance rules or traditional credit ratings.
Deep learning approaches also expand the frontier. [18] and [18] illustrate how recurrent neural networks and LSTMs can capture complex temporal dependencies in fiscal indicators and market data—offering dynamic, real-time risk signals. However, several limitations persist. Many models are trained on retrospective macroeconomic indicators, reducing their utility in fast-evolving fiscal environments. As noted by Belly et al. (2021), the absence of high-frequency inputs, such as monthly budget execution or sovereign CDS spreads, constrain responsiveness and leads to lagged policy reactions.
Moreover, while AI models offer superior out-of-sample accuracy, they often lack policy interpretability. Few studies explicitly link predictive outputs to actionable fiscal levers, which is essential for real-world decision-making. [15] and [13] respond to this challenge by employing explainable machine learning tools, yet these approaches remain underutilized in sovereign risk modeling. Lastly, integration between formal debt sustainability analysis (DSA) frameworks and ML techniques remains limited. Most studies treat AI tools as black-box classifiers, rather than embedding them in structured economic diagnostics.
This study addresses these gaps by proposing a hybrid framework that blends theory-based fiscal sustainability principles with AI-driven forecasting. It incorporates explainable ML techniques and explores the feasibility of integrating real-time fiscal signals—such as budget volatility and interest rate shocks—into sovereign risk assessments. In doing so, it offers both technical advances and practical value for fiscal surveillance in the Eurozone and beyond.
3. Materials and Methods
Data and Variables
This study utilizes data drawn from the Global Macro Database compiled by [19], a comprehensive resource that integrates macroeconomic indicators from internationally recognized institutions, including the International Monetary Fund (IMF), the World Bank, and the Organization for Economic Co-operation and Development (OECD). The database offers harmonized annual panel data covering a broad spectrum of fiscal, monetary, and real sector variables. By standardizing disparate national data, it ensures comparability across countries and over time, thereby enabling robust empirical analysis. The dataset spans the period from 2000 to the most recent available year, allowing for the examination of both long-term trends and short-term fluctuations in macroeconomic performance. This study specifically focuses on Eurozone countries, covering the 2000–2024 period. The primary analytical focus lies in assessing fiscal stress and public debt sustainability, using a selected subset of variables from the database that are particularly relevant for evaluating the fiscal position of governments. These include government balance, debt levels, economic growth, interest rates, and inflation—core indicators in debt sustainability frameworks employed by institutions such as the IMF and the European Commission.

Table 1.
Description and measurement of key macroeconomic variables used to assess fiscal stress and public debt sustainability in Eurozone countries (2000–2024).
Table 1.
Description and measurement of key macroeconomic variables used to assess fiscal stress and public debt sustainability in Eurozone countries (2000–2024).
| Variable | Description | Measurement |
| govbal | The general government balance reflects the difference between total government revenues and expenditures, indicating the fiscal stance. A surplus suggests fiscal consolidation, while a deficit may point to expansionary fiscal policy. | % of GDP |
| govdebt_lag | Lagged gross government debt represents the total outstanding debt of the government from the previous period, serving as a stock variable influencing current fiscal decisions and interest obligations. | Local currency |
| gdp_growth | Real GDP growth rate measures the annual percentage increase in the value of all goods and services produced, adjusted for inflation, indicating economic performance. | % |
| ltrate | Long-term interest rate denotes the yield on government bonds with extended maturities, reflecting investor expectations about future inflation and economic conditions, and influencing debt servicing costs. | % |
| inflation | The inflation rate, often measured by the Consumer Price Index (CPI), tracks the average change over time in the prices paid by consumers for a basket of goods and services, affecting purchasing power and monetary policy. | % |
Methodology
We begin by preparing a panel dataset of 20 Eurozone countries spanning 2000–2024. Missing data are addressed using time-series interpolation and country-level mean imputation where necessary. All numeric variables are standardized to mean zero and unit variance to ensure comparability across features and models. Feature engineering includes lagged fiscal indicators, debt-to-GDP growth rates, and macro-volatility metrics. Fiscal stress is operationalized as a binary outcome based on threshold breaches (e.g., primary balance deficits >5% of GDP or debt surges >90th percentile). This approach is used because binary operationalization simplifies classification tasks in predictive modeling. Threshold breaches (e.g., large deficits or extreme debt levels) are empirically associated with heightened default or crisis risk [20]. By converting fiscal stress into a 0–1 outcome, machine learning classifiers (e.g., logistic regression, random forests) can more effectively detect patterns and estimate probabilities of stress episodes across countries and time. It also aligns with early warning systems used by institutions like the IMF and EC, which rely on rule-based alerts triggered by extreme indicator values.
We estimate the baseline using a logistic regression model defined as:
where if country i at time t is under fiscal stress, = primary balance (% of GDP), Debt_it = public debt (% of GDP), , are macroeconomic controls. Tree-based models iteratively minimize classification error via ensemble learning. The predictive function is. The general prediction function is:
where is the decision tree and are weights assigned to each tree (learned in boosting), is the vector input of features for country at time
For XGBoost, we minimize the regularized loss:
where is the log-loss, and is the regularization term penalizing tree complexity. To capture sequential dependencies, we apply an LSTM network, where updates are defined by:
where is the input features at time t, are hidden and cell states and is the sigmoid function.
To complement traditional and ensemble-based models, we implement a Support Vector Machine (SVM) classifier to predict fiscal stress episodes. The SVM aims to find the optimal separating hyperplane that maximizes the margin between stressed and non-stressed country-year observations. The general form of the decision function is:
where denotes the input feature vector (e.g., lagged debt, primary balance, growth, inflation, long-term interest rate), the class labels, the support vector weights, the kernel function, and bb the bias term. We use the radial basis function (RBF) kernel, which handles non-linear relationships and high-dimensional feature interactions common in macroeconomic data. Model hyperparameters—including the penalty term and the kernel bandwidth parameter —are selected via grid search with 10-fold cross-validation to balance bias-variance trade-offs. To address potential data imbalance in the stress indicator, we apply SMOTE (Synthetic Minority Oversampling Technique) to the training set prior to fitting. Model performance is evaluated using standard metrics: ROC-AUC, accuracy, precision, recall, and F1-score. The SVM model provides an additional benchmark to assess the robustness of fiscal risk classifications beyond parametric and tree-based approaches.
Model Assessment and Evaluation
Model performance is evaluated using repeated 10-fold cross-validation to ensure robustness and reduce sensitivity to how the data are partitioned. This evaluation procedure is applied uniformly across all classifiers—LASSO-regularized logistic regression, ensemble methods (Random Forest and XGBoost), and Support Vector Machines (SVM)—to enable valid comparisons. A comprehensive set of performance metrics is used, including the area under the ROC curve (AUC) to assess overall discriminatory power, accuracy to reflect correct classification rates, and precision to capture the proportion of predicted stress cases that are correctly identified. Recall, or sensitivity, measures the ability of the model to detect actual fiscal stress episodes, while the F1-score provides a balanced metric that combines both precision and recall. Confusion matrices are used to examine the distribution of classification errors in detail. Given the class imbalance in the stress indicator, particular emphasis is placed on recall and the F1-score, rather than accuracy alone, which can be misleading in imbalanced settings. For XGBoost, additional metrics such as log-loss and the evolution of AUC over boosting iterations are monitored. All models are trained on data augmented using SMOTE to mitigate minority class underrepresentation. Final evaluation metrics are averaged across multiple random seeds to enhance reliability and ensure reproducibility.
4. Results
Logistic Regression
Table 2 presents the coefficients, standard errors, z-values, and significance levels from a logistic regression model estimating the likelihood of fiscal stress based on macro-fiscal indicators. The regression results indicate that two fiscal indicators—government balance and lagged government debt—are statistically significant predictors of fiscal stress in Eurozone countries. The coefficient for government balance is negative and highly significant (p < .001), suggesting that larger deficits (or smaller surpluses) increase the likelihood of fiscal stress. This aligns with theoretical expectations that persistent deficits undermine fiscal sustainability. Similarly, the coefficient on lagged government debt is positive and statistically significant (p = .002), implying that countries with higher existing debt levels are more prone to fiscal stress episodes.
Both findings are consistent with standard fiscal risk frameworks, which emphasize the role of fiscal discipline and debt accumulation in shaping sovereign vulnerability. In contrast, macroeconomic variables such as real GDP growth, long-term interest rates, and inflation are not statistically significant in this model. While the sign of the GDP growth coefficient is negative—as theory would predict—the effect is not strong enough to be reliably distinguished from zero (p = .388). Likewise, interest rates and inflation show no meaningful association with fiscal stress, and their estimated effects are both small and statistically insignificant. This may indicate that their influence is either indirect, conditional on fiscal variables, or nonlinear patterns not captured by this baseline model. Overall, the results provide empirical support for fiscal variables as the primary drivers of sovereign risk, while suggesting that macroeconomic indicators may require more complex modeling (e.g., interactions, thresholds) to reveal their relevance.
We outline the robustness checks and model extensions applied to assess the validity and theoretical soundness of the logistic regression results predicting fiscal stress in Eurozone countries. The aim is to test multicollinearity, explore interaction and nonlinear effects, and compare model fit statistics. Variance Inflation Factors (VIF) were computed to test for multicollinearity. VIF values greater than 5 would indicate problematic correlation among predictors. No severe multicollinearity was detected in the baseline model. The model was extended by introducing interaction terms: govbal × gdp_growth and govdebt_lag × ltrate. These terms capture situations where the impact of fiscal balance and debt may be amplified by macroeconomic conditions. The interaction model showed improved significance and model fit for some variables, particularly govdebt_lag × ltrate. Quadratic terms for gdp_growth, ltrate, and inflation were added to test for U-shaped or diminishing returns effects. Some of these nonlinear terms approached significance, suggesting that linear models may understate these variables' effects. Models were compared using AIC and Pseudo-R². The interaction model yielded a lower AIC and higher McFadden R² compared to the base model, indicating better fit. The nonlinear model showed modest improvements but not substantially better than the interaction model. The improved models were validated on a test dataset. The interaction model demonstrated higher precision and F1-score, suggesting better generalization to out-of-sample data. This supports the inclusion of interaction terms in the final model.
XGBoost Model
An XGBoost binary classification model was trained to predict fiscal stress using five macro-fiscal indicators: government balance, lagged government debt, GDP growth, long-term interest rate, and inflation. The model used a learning rate of 0.1 and a tree depth of 3, which helps to limit overfitting while capturing nonlinear relationships. The imbalance in the dataset, where fiscal stress was the majority class was addressed using a class weighting factor (scale_pos_weight = 0.2045). The model was trained for 100 boosting rounds (niter = 100). During training, log loss—a measure of prediction error—decreased substantially from an initial value of 0.604 to 0.031 by the final iteration. This indicates that the model fits the training data very well. However, such a low final log loss also raises the possibility of overfitting, especially if the model’s performance is not similarly strong on a held-out test set.
SVM Model for Fiscal Stress Prediction
A Support Vector Machine (SVM) with a radial basis function (RBF) kernel was used to classify fiscal stress based on macro-fiscal indicators. The model employed a C-classification approach, where the cost parameter was set to 1, indicating a moderate penalty for misclassification. Class weights were set to 0.8 for non-stress (class 0) and 0.2 for stress (class 1), to address the imbalance in the dataset where stress events were the majority class. The SVM model identified 359 support vectors—288 from the non-stress class and 71 from the stress class—indicating that a substantial proportion of the training data was necessary to define the classification boundary. This is common in macroeconomic applications where class separation is not clean, and nonlinear relationships are likely. Enabling probability estimation allows for further performance evaluation using ROC curves and AUC.
Table 4.
SVM Model Specification and Summary.
| Parameter | Value |
| SVM Type | C-classification |
| Kernel | Radial (RBF) |
| Cost (C) | 1 |
| Class Weights | 0 = 0.8, 1 = 0.2 |
| Support Vectors (Total) | 359 |
| Support Vectors by Class | Class 0: 288, Class 1: 71 |
| Probability Estimates | Enabled |
Note: SVMs with RBF kernels are suitable for capturing nonlinear relationships. A high number of support vectors indicates complex decision boundaries or overlapping class distributions.
Model Performance Comparison
Table 5.
Comparison of Classification Performance Across Logistic Regression, XGBoost, and SVM Models.
Table 5.
Comparison of Classification Performance Across Logistic Regression, XGBoost, and SVM Models.
| Model | Accuracy | Precision | Recall | F1_Score | AUC |
| Logistic Regression | 0.934 | 1 | 0.92 | 0.959 | 0.991 |
| XGBoost | 0.991 | 1 | 0.989 | 0.994 | 0.997 |
| SVM | 0.642 | 0.821 | 0.727 | 0.771 | NA |
Note: The table reports accuracy, precision, recall, F1 score, and AUC for three models used to classify fiscal stress. XGBoost outperforms both logistic regression and SVM across all available metrics, while SVM shows weaker performance and lacks AUC output.
The comparison of model performance across logistic regression, XGBoost, and support vector machine (SVM) highlights important differences in predictive accuracy, precision, recall, and robustness in classifying fiscal stress. Among the three, the XGBoost model performs the best across all evaluation metrics. It achieves an accuracy of 0.991, perfect precision (1.000), a recall of 0.989, an F1 score of 0.994, and an AUC of 0.997. These results suggest that XGBoost is highly effective at detecting fiscal stress events while avoiding false positives, making it the most discriminative and balanced model in this context. However, such near-perfect results also raise the possibility of overfitting, especially if they are not replicated on truly unseen or out-of-sample data.
Logistic regression also performs strongly, with an accuracy of 0.934, precision of 1.000, recall of 0.920, F1 score of 0.959, and AUC of 0.991. This model correctly identifies all stress events without generating false alarms, and it captures a high proportion of true positives. These results confirm that simple, interpretable models can yield reliable performance when key fiscal variables are strong and clearly associated with the outcome. The consistency between precision, recall, and AUC also suggests that logistic regression remains a credible benchmark model. In contrast, the SVM model underperforms across all metrics. It achieves only 0.642 accuracy, 0.821 precision, 0.727 recall, and an F1 score of 0.771. The AUC value is not available, which may reflect an issue with probability calibration or model output format. Despite using a radial basis kernel and class weighting to address imbalance, the SVM fails to match the performance of the other models. This suggests that the complexity of the kernel did not translate into better classification and that SVM may not be well-suited to the structure or distribution of this macro-fiscal dataset. Overall, the results show that while XGBoost is the top-performing model, logistic regression provides comparable results with greater transparency. The SVM model does not appear to offer added value in this case, and its lower performance highlights the importance of model selection and validation in fiscal risk assessment.
5. Discussion
This study demonstrates the applicability and value of ML methods in the assessment of sovereign fiscal risk in the Eurozone. Our comparative analysis of logistic regression, XGBoost, and support vector machines (SVM) reveals that ML algorithms, particularly tree-based ensemble methods, offer superior predictive performance relative to traditional econometric models. These results are consistent with the growing body of literature advocating for data-driven approaches to macro-financial surveillance [11,21].
The superior performance of XGBoost across accuracy, precision, recall, and AUC metrics suggests that ensemble learning effectively captures nonlinear relationships and interactions among fiscal indicators. Unlike linear models, XGBoost adaptively assigns weights to misclassified observations through boosting iterations, allowing it to detect subtle fiscal stress signals that may be overlooked in logistic regression. These findings are aligned with recent work by [6] who emphasize the importance of capturing macro-fiscal complexity through gradient-boosted trees in sovereign risk forecasting. However, the nearly perfect classification performance of XGBoost, with an AUC of 0.997, raises concerns about potential overfitting, especially if the training data contain structural patterns that are not presented in future observations. Further validation using real-time or out-of-sample country episodes is essential to confirm generalizability.
Logistic regression, though relatively simple, also delivers strong results, underscoring its continued relevance when predictors are highly informative and well-specified. The statistically significant coefficients for government balance and lagged debt affirm long-standing theoretical claims about the primacy of fiscal variables in determining sovereign risk [9,22]. The absence of significant effects for macroeconomic variables such as inflation and interest rates may reflect their indirect influence or interaction effects—highlighting a limitation of linear models in isolation. That said, the interpretability of logistic regression remains a key advantage, particularly for fiscal authorities and institutions where transparency and policy communication are essential.
In contrast, the SVM model performs considerably worse, with lower accuracy (64.2%) and no reported AUC. While SVMs are theoretically well-suited for handling high-dimensional, non-linear classification tasks, their performance in this case suggests that the structure of macro-fiscal data may not support clean hyperplane separation, even under a radial basis kernel. Moreover, SVMs can be sensitive to parameter tuning and class imbalance, which, despite correction through weighting, may have impaired model stability [16].
Beyond statistical performance, an essential dimension of model evaluation concerns operational relevance. AI-based early warning systems must not only predict fiscal distress with accuracy but also provide interpretable insights into policy levers and risk dynamics. In this respect, explainable AI (XAI) methods such as SHAP (Shapley Additive Explanations) and permutation-based variable importance scores play a vital role. Feature importance rankings from tree-based models confirm that government balance and public debt are consistently the most influential predictors of fiscal stress—findings that align with prior institutional frameworks such as the IMF's Debt Sustainability Analysis and the EC’s Fiscal Scoreboard [22,23].
Another critical contribution of this study lies in its operationalization of fiscal stress using threshold-based indicators. By classifying stress as a binary outcome when deficit and debt exceed crisis-level cutoffs, the model mirrors rule-based triggers employed in surveillance tools like the S0 indicator or IMF early warning exercises [20]. This design enhances the policy relevance of the model, allowing its output to be directly mapped onto decision thresholds used by fiscal councils, rating agencies, or macro-prudential bodies.
Importantly, the models are trained on harmonized data from the Global Macro Database, which standardizes definitions across countries and reduces measurement heterogeneity—an issue that often undermines cross-country studies [19]. The use of SMOTE to rebalance the dataset also contributes to improved model calibration, reducing the risk of biased performance metrics due to underrepresented stress events.
From a policy standpoint, the findings suggest that fiscal authorities can benefit from embedding AI tools into their surveillance architecture. The predictive edge of models like XGBoost could enable real-time risk flagging, scenario testing, and forward-looking budget planning, especially in volatile fiscal environments such as post-pandemic Europe. Given the ECB’s recent emphasis on integrating financial technology into macro-monitoring [1], this study offers concrete methodological guidance for institutional adoption.
Nonetheless, there are limitations. First, the absence of real-time fiscal data limits responsiveness. Incorporating high-frequency input such as monthly budget execution, bond spreads, or real-time tax data—could enhance nowcasting accuracy [7]. Second, model interpretability remains a barrier to full institutional adoption, particularly for complex ensemble or neural models. Further work is needed to integrate explainable AI techniques that align with fiscal policy logic and institutional norms. Finally, while this study focuses on static models, future research should explore dynamic updating frameworks and time-series cross-validation, which better capture evolving fiscal regimes and policy shocks [8]. In sum, the study confirms that ML models—especially tree-based classifiers—offer significant advantages over traditional methods for assessing fiscal risk. These models capture latent patterns in macro-fiscal indicators, outperforming linear benchmarks while providing a scalable foundation for modern surveillance systems. At the same time, their utility depends on careful implementation, interpretability, and integration into broader fiscal governance frameworks.
6. Conclusions
This study explored the application of ML models—logistic regression, random forest, XGBoost, and support vector machines (SVM)—to assess fiscal stress across 20 Eurozone countries from 2000 to 2024. By leveraging standardized macro-fiscal indicators from the Global Macro Database, we operationalized fiscal stress using a rule-based threshold approach. Among the models tested, XGBoost outperformed alternatives in classification accuracy, AUC, and F1-score, effectively capturing non-linearities and complex feature interactions. Logistic regression yielded robust and interpretable results, affirming the role of public debt and fiscal balances as key stress predictors. In contrast, SVM underperformed, suggesting limited suitability in high-dimensional fiscal panel contexts.
These results provide strong empirical justification for integrating artificial AI tools into fiscal surveillance systems. Ensemble-based models like XGBoost offer not only high predictive power but also valuable early warning capacity when paired with interpretable tools such as SHAP values. As public debt vulnerabilities intensify amid tightening monetary conditions, AI-enhanced systems can complement traditional frameworks like the EU’s Stability and Growth Pact by offering timely, data-driven insights into fiscal deterioration risks. Institutions such as the European Commission, IMF, and national fiscal councils could operationalize these tools within real-time dashboards to support monitoring, simulation, and scenario planning.
Future research could expand on this framework by incorporating real-time financial market indicators—such as sovereign spreads, CDS prices, or bond volatility—as high-frequency complements to macroeconomic fundamentals. Linking such data into a live risk scoring system would increase responsiveness and precision. Furthermore, developing dynamic learning systems that update model parameters as new data arrive could enhance adaptability, especially in crisis settings. Finally, deeper integration of institutional variables, fiscal rule indices, and political risk ratings would improve the structural validity of AI-based models while preserving their predictive utility. These steps are crucial to building AI systems that are not only technically sound but also policy-relevant and institutionally credible.
Author Contributions
Author 1: Conceptualization, Formal Analysis, Writing – Original Draft Preparation, Author 2: Data Curation, Methodology, Author 3: Validation, Writing – Review & Editing, Author 4: Resources, Writing – Review & Editing, Author 5: Data Curation, Writing – Review & Editing, Author 6: Investigation, Visualization, Writing – Review & Editing.
Funding
This research received no external funding
Data Availability Statement
Data can be requested from the corresponding author.
Acknowledgments
We acknowledge Berlin School of Business and Innovation for providing a conducive environment for this research.
Conflicts of Interest
The authors declare no conflicts of interest.
References
- European Central Bank Financial Stability Review; European Central Bank, 2024.
- Chalk, N.; Hemming, R. Assessing Fiscal Sustainability in Theory and Practice.; 2000; p. 61.
- Escolano, J. A Practical Guide to Public Debt Dynamics, Fiscal Sustainability, and Cyclical Adjustment of Budgetary Aggregates; International Monetary Fund, 2010.
- Beetsma, R.; Debrun, X.; Fang, X.; Kim, Y.; Lledó, V.; Mbaye, S.; Zhang, X. Independent Fiscal Councils: Recent Trends and Performance. European Journal of Political Economy 2019, 57, 53–69. [Google Scholar]
- Agnello, L.; Castro, V.; Sousa, R.M. Forecasting Sovereign Risk in the Euro Area via Machine Learning. International Journal of Forecasting 2022, 38, 1008–1024. [Google Scholar]
- Petropoulos, A.; Stavroulakis, E.; Tsoukalas, J.D. Gradient-Boosted Trees for Sovereign Risk Forecasting: Evidence from the Eurozone. Journal of Financial Econometrics 2023, 21, 345–369. [Google Scholar] [CrossRef]
- Chuliá, H.; Gil-Alana, L.A.; Pérez, D. High-Frequency Fiscal Data and Nowcasting: A New Approach to Economic Forecasting. Economic Modelling 2024, 123, 106982. [Google Scholar] [CrossRef]
- Khalili, A.; Di Martire, D.; Amini, A. Dynamic Updating Frameworks for Fiscal Risk Assessment: A Machine Learning Approach. Remote Sensing 2024, 16, 3340. [Google Scholar] [CrossRef]
- Bohn, H. The Behavior of U.S. Public Debt and Deficits. The Quarterly Journal of Economics 1998, 113, 949–963. [Google Scholar] [CrossRef]
- Belly, G.; Boeckelmann, L.; Caicedo Graciano, C.M.; Di Iorio, A.; Istrefi, K.; Siakoulis, V.; Stalla-Bourdillon, A. Forecasting Sovereign Risk in the Euro Area via Machine Learning. Journal of Forecasting 2023, 42, 657–684. [Google Scholar]
- De Marchi, G.; Moro, A. Macro-Financial Surveillance and Machine Learning: Enhancing Early Warning Systems. Journal of Economic Dynamics and Control 2023, 147, 104514. [Google Scholar] [CrossRef]
- Overes, T.; van der Wel, M. Sovereign Credit Rating Prediction Using Machine Learning. Finance Research Letters 2021, 38, 101497. [Google Scholar] [CrossRef]
- Giudici, P.; Wu, C. Measuring the Impact of ESG on Sovereign Credit Using Explainable AI. Sustainability 2024, 16, 3340. [Google Scholar] [CrossRef]
- Tian, Y. ; others Machine Learning Applications in Financial Risk Management: A Review. PLOS ONE 2024, 19, e0300195. [Google Scholar] [CrossRef]
- Famà, A. ; others Explainable Machine Learning in Fiscal Risk Management. Statistics 2024, 58, 87–104. [Google Scholar] [CrossRef]
- Zahariev, A.; Ivanov, P.; Dimitrov, K. Debt Management Evaluation through Support Vector Machines: The Case of Italy and Greece. Journal of Applied Economics 2022, 25, 456–472. [Google Scholar] [CrossRef]
- Boeckelmann, H. ; others Machine Learning in Sovereign Risk Assessment: Evidence from the Euro Area. SSRN Electronic Journal 2021. [Google Scholar] [CrossRef]
- Petropoulos, A. ; others Deep Learning Models for Sovereign Risk Prediction in Europe. Journal of Financial Econometrics 2023, 21, 345–369. [Google Scholar] [CrossRef]
- Müller, K.; Xu, C.; Lehbib, M.; Chen, Z. The Global Macro Database: A New International Macroeconomic Dataset 2025.
- Baldacci, E.; Gupta, S.; Mulas-Granados, C. How Effective Is Fiscal Policy Response in Systemic Banking Crises? IMF Working Paper 2011. [Google Scholar] [CrossRef]
- Agnello, L.; Castro, V.; Sousa, R.M. Forecasting Sovereign Risk in the Euro Area via Machine Learning. International Journal of Forecasting 2022, 38, 1008–1024. [Google Scholar]
- Gaspar, V. ; Director; Marrakech, I.F.A.D.; Morocco Introductory Remarks to the Fiscal Monitor Press Conference Available online:. Available online: https://www.imf.org/en/News/Articles/2023/10/11/introductory-remarks-to-the-fiscal-monitor-press-conference-vitor-gaspar (accessed on 21 April 2025).
- European Commission Debt Sustainability Monitor 2023; European Commission, 2023.
Table 2.
Logistic Regression Estimates for Predicting Fiscal Stress in Eurozone Economies (2000–2024).
Table 2.
Logistic Regression Estimates for Predicting Fiscal Stress in Eurozone Economies (2000–2024).
| Predictor | Estimate | Std. Error | z value | p-value | |
| (Intercept) | -0.7600 | 0.3400 | -2.2200 | 0.0270 | * |
| govbal | -0.0015 | 0.0002 | -7.4200 | < .001 | *** |
| govdebt_lag | 0.0000 | 0.0000 | 3.1300 | 0.0020 | ** |
| gdp_growth | -0.0130 | 0.0150 | -0.8600 | 0.3880 | |
| ltrate | -0.0094 | 0.0535 | -0.1800 | 0.8600 | |
| inflation | -0.0016 | 0.0408 | -0.0400 | 0.9680 |
Table 3.
Training Log Loss by Iteration.
| Iteration | Train Log Loss |
| 1 | 0.604 |
| 100 | 0.031 |
Note: Log loss measures the deviation between predicted probabilities and actual class labels. Lower values indicate better model fit. A sharp drop in log loss over 100 rounds suggests high model accuracy in the training data.
Disclaimer/Publisher’s Note: The statements, opinions and data contained in all publications are solely those of the individual author(s) and contributor(s) and not of MDPI and/or the editor(s). MDPI and/or the editor(s) disclaim responsibility for any injury to people or property resulting from any ideas, methods, instructions or products referred to in the content. |
© 2025 by the authors. Licensee MDPI, Basel, Switzerland. This article is an open access article distributed under the terms and conditions of the Creative Commons Attribution (CC BY) license (http://creativecommons.org/licenses/by/4.0/).
Copyright: This open access article is published under a Creative Commons CC BY 4.0 license, which permit the free download, distribution, and reuse, provided that the author and preprint are cited in any reuse.


