Submitted:
13 January 2026
Posted:
13 January 2026
You are already at the latest version
Abstract
Urban curbside loading and unloading zones are increasingly affected by competing non logistics uses, such as outdoor terraces or resident parking, leading to reductions in effective curbside length. These design decisions can significantly alter service capacity and generate environmental externalities in urban freight operations that are rarely quantified. This study introduces the Factor of Occupancy (Fo) as a space–time design indicator for curbside unloading zones, defined as the product of effective curbside length and the maximum authorised dwell time. Using direct observational data from an urban block in Zaragoza (Spain), the analysis focuses on a loading and unloading zone whose effective length was reduced by approximately 6 m due to the installation of a restaurant terrace. Two curbside configurations are compared: a reduced configuration (8 m) and a restored configuration (14 m), keeping demand and temporal constraints constant. Fo is integrated into a loss based queueing model (M/M/1/1) to estimate blocking probabilities and the number of served and rejected freight operations. To capture the environmental implications of curbside capacity loss, the paper proposes the Hidden Carbon Emissions (HCE) indicator, which quantifies the additional CO₂ emissions generated by rejected vehicles through block recirculation and idling during illegal occupancy, based on observed behaviour and publicly available emission factors. Results show that restoring curbside length substantially increases effective service capacity and reduces rejected vehicles, leading to a marked decrease in hidden CO₂ emissions per operation. The findings highlight that minor curbside design decisions can produce measurable impacts on both urban freight efficiency and environmental performance.
Keywords:
urban freight logistics
; curbside capacity
; loading and unloading zones
; carbon emissions
; last mile delivery
; urban sustainability
1. Introduction
Urban freight transport relies on a scarce and increasingly contested resource: curbside space, Valença et al. 2021 [1]. Loading and unloading zones (LUZs) are designed to provide short term access for commercial vehicles, enabling deliveries and pickups close to their final destination while reducing double parking, cruising for parking, and the associated negative externalities. However, in many cities, these zones coexist and compete with a wide range of non logistics uses, including outdoor hospitality terraces, resident parking, general parking, micromobility infrastructure, and passenger pick-up and drop off areas. As a result, even small reallocations of curbside length away from logistics can have a disproportionate impact on the performance of urban freight systems and on their environmental footprint, Castrellon et al. 2024 [2].
In this context, the primary constraint affecting urban mobility is increasingly the limited physical capacity of streets, rather than the propulsion technology of vehicles, Petzer et al. 2021 [3]. Recent research on freight curbside management highlights that conflicts over curb access and allocation play a central role in determining operational efficiency and sustainability outcomes, often outweighing vehicle level technological considerations in dense urban environments Palacios-Argüello et al. 2025 [4]. As private cars progressively lose their central role in urban circulation, freight distribution must adapt to a fundamentally reconfigured mobility model in which access to curbside space becomes a critical operational bottleneck, Pinto et al. 2019 [5].
Previous studies have shown that LUZs often operate with low levels of efficiency due to unauthorised parking, excessive dwell times, and delivery practices misaligned with regulatory frameworks, Aiura et al. 2005 [6]. Empirical analyses of driver behaviour reveal that parking availability and curbside design strongly influence delivery strategies, including cruising, illegal stopping, and route adaptation Amaya et al. 2023 [7] and Saki et al. 2024 [8]. In this regard, recent work has demonstrated that insufficient or poorly managed curbside capacity leads to increased circulation in search of legal spaces, amplifying congestion and environmental impacts that are not captured by traditional performance indicators Dalla Chiara et al. 2022 [9].
Despite these advances, the design dimension of curbside loading zones remains comparatively underexplored, Ezquerro et al. [10]. While operational indicators describe how a given space is used, they do not explicitly quantify how the physical configuration of the curbside, expressed in metres and minutes, conditions system performance. In practice, municipalities frequently reassign small portions of curbside space from logistics to other uses, such as the extension of outdoor terraces, often without a quantitative assessment of how these decisions affect the number of freight operations that can be accommodated or the externalities generated when vehicles are forced to seek alternatives Castrellon et al. 2024 [11].
At the same time, urban freight distribution is undergoing a structural transformation. Home delivery, traditionally treated as a low cost commodity, is increasingly evolving into a premium service, Vishnoi et al. 2025 [12] , reflecting the growing scarcity of urban space and the rising expectations placed on last mile operations, Viu-Roig et al. 2020 [13] and Visser et al. 2014 [14]. This shift reinforces the need to prioritise curbside access for freight activities that are essential to urban functioning and to evaluate curbside design decisions not only in operational terms but also through their environmental consequences.
To address these gaps, this paper introduces and operationalises the Factor of Occupancy (Fo) as a space time design indicator for urban loading and unloading zones. Fo is defined as the product of the effective curbside length allocated to freight operations and the maximum authorised dwell time. Expressed in metre–minutes, Fo captures the design capacity of a loading zone in a single metric and can be directly linked to the number of vehicles that can be served under a given demand profile. By integrating Fo into a loss based queueing framework, it becomes possible to quantify how changes in curbside length, while keeping temporal constraints constant, translate into variations in blocking probability and in the number of served and rejected freight operations.
In addition, the paper proposes the HCE indicator to assess the environmental implications of curbside capacity loss. When loading zones are shortened, rejected vehicles tend to recirculate around the block in search of alternative legal spaces or resort to illegal stopping, generating additional travelled distance and idling time. HCE captures the CO₂ emissions induced by these behaviours and quantifies the difference between emissions generated under the observed curbside configuration and those that would occur under a restored design scenario, holding demand and regulatory conditions constant. Similar approaches have been identified as necessary to reveal externalities that remain invisible in conventional assessments of urban freight performance Castrellon el al. 2024 [2] and Dalla Chiara et al. 2022 [9].
Based on the identified research gap and the empirical context described above, this study pursues two main objectives:
(i) to assess how small reductions in effective curbside length affect the operational capacity of urban loading and unloading zones, and
(ii) to quantify the environmental externalities induced by curbside capacity loss in urban freight operations.
To address these objectives, the following research hypotheses are formulated:
H1. Reductions in the effective length of curbside loading zones lead to a disproportionate increase in the number of freight vehicles that cannot be legally served and are rejected from the system.
H2. Vehicles rejected due to curbside capacity constraints generate additional CO₂ emissions through recirculation and idling behaviours that are not captured by conventional traffic or logistics performance indicators.
H3. Restoring a limited amount of curbside space to logistics use significantly reduces both operational inefficiencies and the associated HCE, even when demand and regulatory conditions remain unchanged.
These hypotheses are tested through the integration of a space–time curbside design indicator, loss based queueing modelling, and an empirical estimation of emissions derived from observed vehicle behaviour.
The empirical analysis focuses on a real urban block in Zaragoza (Spain), where one loading zone (Z5) experienced a reduction of approximately 6 m in effective curbside length to accommodate a restaurant terrace. Using detailed observational data on arrivals, dwell times, vehicle types, recirculation patterns, and idling behaviour, two design configurations are compared: a reduced configuration (8 m) and a restored configuration (14 m), both under the same time limit. The paper makes three main contributions: (i) it formalises Fo as a curbside design indicator linked to loss based performance metrics; (ii) it quantifies the operational impact of reallocating a small amount of curbside space away from logistics; and (iii) it introduces HCE as a practical tool to translate curbside design decisions into measurable environmental externalities.
The article is organised as follows: section 2 analyzes the existing literature, section 3 describes the study area, section 4 addresses the methodology used in the calculations of hidden carbon capacity and emissions, section 5 analyses the results of applying the model in all its aspects and possibilities for analysis and section 6 interprets the results. Finally, Section 7 presents the conclusions and possible future lines of research.
2. Literature Review
Urban freight transport has increasingly been recognised as a critical component of sustainable urban mobility, with curbside space emerging as one of its most constrained and contested resources. The growing demand for last mile deliveries, driven by e-commerce and service oriented consumption patterns, has intensified competition for curb access among freight vehicles, private cars, passenger pick up and drop off activities, micromobility, and non transport uses such as outdoor hospitality terraces. Recent research consistently identifies curbside scarcity as a structural bottleneck in dense urban environments, with direct implications for operational efficiency, congestion, and environmental performance, Alho et al. 2018 [15], Dalla Chiara et al. 2022 [9] and Palacios-Argüello et al. 2025 [4].
A substantial body of literature has focused on the operational inefficiencies associated with loading and unloading zones (LUZs), Comi et al. 2017 [16] . Empirical studies show that these facilities frequently suffer from unauthorised parking, excessive dwell times, and high variability in arrivals and service durations, leading to frequent blocking events and illegal stopping behaviours, Castrellon et al. 2024 [2], Kalahasti et al. 2022 [17] and Diehl et al. 2021 [18]. Analyses of delivery driver behaviour further reveal that curbside availability strongly conditions routing decisions, parking search strategies, and the propensity to double park or circulate around the block when legal spaces are unavailable, Les et al. [19] Castrellon et al. 2024 [2], Saki et al. 2024 [8] and Amaya et al. 2023 [7]. These behaviours generate additional vehicle kilometres travºelled and idle time, exacerbating congestion and emissions in ways that are often invisible to conventional traffic metrics.
To address these challenges, a growing stream of research has proposed analytical and simulation based approaches to improve the design and management of LUZs, Comi et al. 2022 [20]. Early optimisation models focused on determining the optimal number and spatial distribution of loading bays to minimise freight related delays and traffic disruption, Alho et al. [15]. More recent contributions have incorporated stochastic arrival processes and dwell time distributions, using queueing theory and loss systems to capture the intrinsic uncertainty and capacity constraints of curbside operations, Kalahasti et al. 2022 [17] and Wilson et al. 2022 [21]. In particular, M/M/1/1 type models have proven effective in representing situations where waiting is not possible and vehicles are either served immediately or rejected, a condition frequently observed in urban curbside contexts.
Beyond static design, several studies have explored dynamic and information based interventions aimed at improving curbside performance, Ochoa-Olán et al. 2021 [22]. Smart loading zones, reservation systems, and real time curb availability information have been shown to reduce cruising for parking and improve compliance, especially when combined with enforcement or pricing mechanisms, Dalla Chiara et al. 2022 [9], Kalahasti et al. 2022 [17], Burns et al. 2024 [23] and Yu et al. 2021 [24]. Field experiments and controlled trials demonstrate that providing delivery drivers with reliable information about curb availability can significantly reduce search time and circulation, thereby lowering congestion and emissions, Dalla Chiara et al. 2022 [9] and Castrellon et al. 2024 [11]. Complementary work has examined pricing and regulatory strategies, highlighting how differentiated tariffs or time based access rules can influence driver behaviour and better align demand with limited curbside supply, Tao et al. 2024 [25], Liu et al. 2023 [26] and Vishnoi ey al. 2025 [12].
Despite these advances, several authors note that many curbside management initiatives remain at the pilot stage and face challenges when transitioning to permanent policy frameworks, Palacios-Argüello et al. 2025 [4] and Diehl et al. 2021 [18]. Governance issues, institutional fragmentation, and the coexistence of multiple curbside users complicate the scaling of technically sound solutions. As a result, municipalities often continue to make incremental curbside reallocation decisions, such as converting loading zones into terraces or parking, without a robust quantitative assessment of their operational and environmental consequences, Dalla Chiara et al. 2022 [27] and Palacios-Argüello et al. 2025 [4].
Another relevant strand of the literature addresses the environmental impacts of urban freight and curbside related behaviours. Studies on cruising for parking and double parking consistently show that these phenomena contribute non negligibly to local congestion and emissions, particularly in high density areas, Castrellon et al. 2024 [11], Saki et al. 2024 [8] and Nourinejad et al. 2020 [28]. Survival analysis and empirical tracking of parking search behaviour reveal that even short additional circulation loops can accumulate into significant system wide impacts when repeated across many vehicles and days, Kalahasti et al. 2022 [17]. However, most environmental assessments of urban freight focus on vehicle technology, fuel type, or route optimisation, while treating curbside capacity constraints as exogenous or secondary factors, Allen et al. 2018 [29].
This emphasis on vehicle level characteristics has been increasingly questioned in recent work, which argues that spatial constraints and curbside governance may play a more decisive role in shaping real world emissions than propulsion technologies alone, especially in the short to medium term, Alho et al. 2018 [15], Dalla Chiara et al. 2022 [27] and Marsden et al. 2020 [30]. From this perspective, emissions generated by rejected vehicles, those unable to access designated loading zones and forced to recirculate or stop illegally, constitute a form of externality that is rarely captured in standard evaluations of urban freight performance.
A notable gap in the literature concerns the explicit linkage between curbside design parameters and both operational and environmental outcomes. While existing studies provide valuable insights into usage patterns, enforcement strategies, and behavioural responses, Letnik et al. 2018 [31], they seldom formalise how the physical configuration of the curbside, expressed in terms of available length and authorised dwell time, conditions system capacity, which is one of the issues addressed in this article. Similarly, although emissions from cruising and idling are acknowledged, there is a lack of parsimonious indicators that translate curbside design decisions into quantifiable and decision relevant environmental impacts.
Recent contributions calling for integrated curbside management frameworks emphasise the need for metrics that are simultaneously interpretable by engineers, planners, and policymakers, Burns et al. 2024 [23], Palacios-Argüello et al. 2025 [4] and Diehl et al. 2021 [18]. Such metrics should allow decision makers to assess trade offs between competing curbside uses and to understand the consequences of reallocating limited space away from freight activities. In this context, the literature increasingly recognises that las mile delivery is transitioning from a low cost commodity to a differentiated service, where reliability, access, and spatial prioritisation become central considerations, Marsden et al. 2020 [30] and Vishnoi et al. 2025 [12].
Against this background, the present study positions itself at the intersection of curbside design, loss based operational modelling, and environmental assessment resulting from the loss of space dedicated to tasks initially defined by city governance and subsequently reassigned. By focusing on the space–time configuration of loading zones and on the emissions induced by capacity related rejections, it responds directly to calls for more integrative and design oriented approaches to curbside management. The proposed framework complements existing operational and policy oriented studies by providing a quantitative link between small scale curbside reallocation decisions and their broader implications for urban freight efficiency and sustainability.
3. Study Area and Data Collection
3.1. Study Area and Curbside Configuration
The empirical analysis is conducted in a consolidated central urban area of Zaragoza. The study area consists of a closed urban block composed of four streets forming a loop of approximately 384 m in total length. Traffic conditions correspond to an urban main street environment, with a posted speed limit of 30 km/h, two signalised intersections, and two pedestrian crossings, one of which includes a bicycle crossing. Traffic flow during the observation period was generally fluid, with no recurrent congestion.
Within the studied urban block, several loading and unloading zones (Z1-Z4) operate under the same regulatory framework and are subject to similar demand, Gil Gallego et al. 2025 [32]. However, these zones differ in their geometric configuration, surrounding land uses, and exposure to competing curbside functions. The block therefore provides a controlled yet heterogeneous environment in which multiple curbside configurations coexist under comparable traffic and regulatory conditions.
Zone Z5 was selected for detailed analysis because it represents a critical and illustrative case of curbside capacity loss. Unlike other zones in the block, Z5 experienced an exogenous and clearly identifiable reduction in effective curbside length, resulting from the installation of an outdoor hospitality terrace. This intervention reduced the usable loading space from 14 m to 8 m while keeping all other factors constant, including authorised dwell time, access rules, traffic conditions, and demand characteristics. As a result, Z5 provides a natural quasi experimental setting to isolate the operational and environmental effects of curbside length reallocation.
In addition, Z5 is located on a one way, single lane street where double parking along the curb is not feasible. This configuration makes the consequences of curbside capacity loss particularly visible, as rejected vehicles are forced either to recirculate around the block or to stop illegally in adjacent intersection areas. This combination of geometric constraint, observed behavioural response, and clear before–after curbside configuration makes Z5 especially suitable for the objectives of this study.
Figure 1.
Study Area: Z5 (1), terrace (2), preferred area for illegal occupation (3), remaining areas of the block outside this study (4).
Figure 1.
Study Area: Z5 (1), terrace (2), preferred area for illegal occupation (3), remaining areas of the block outside this study (4).
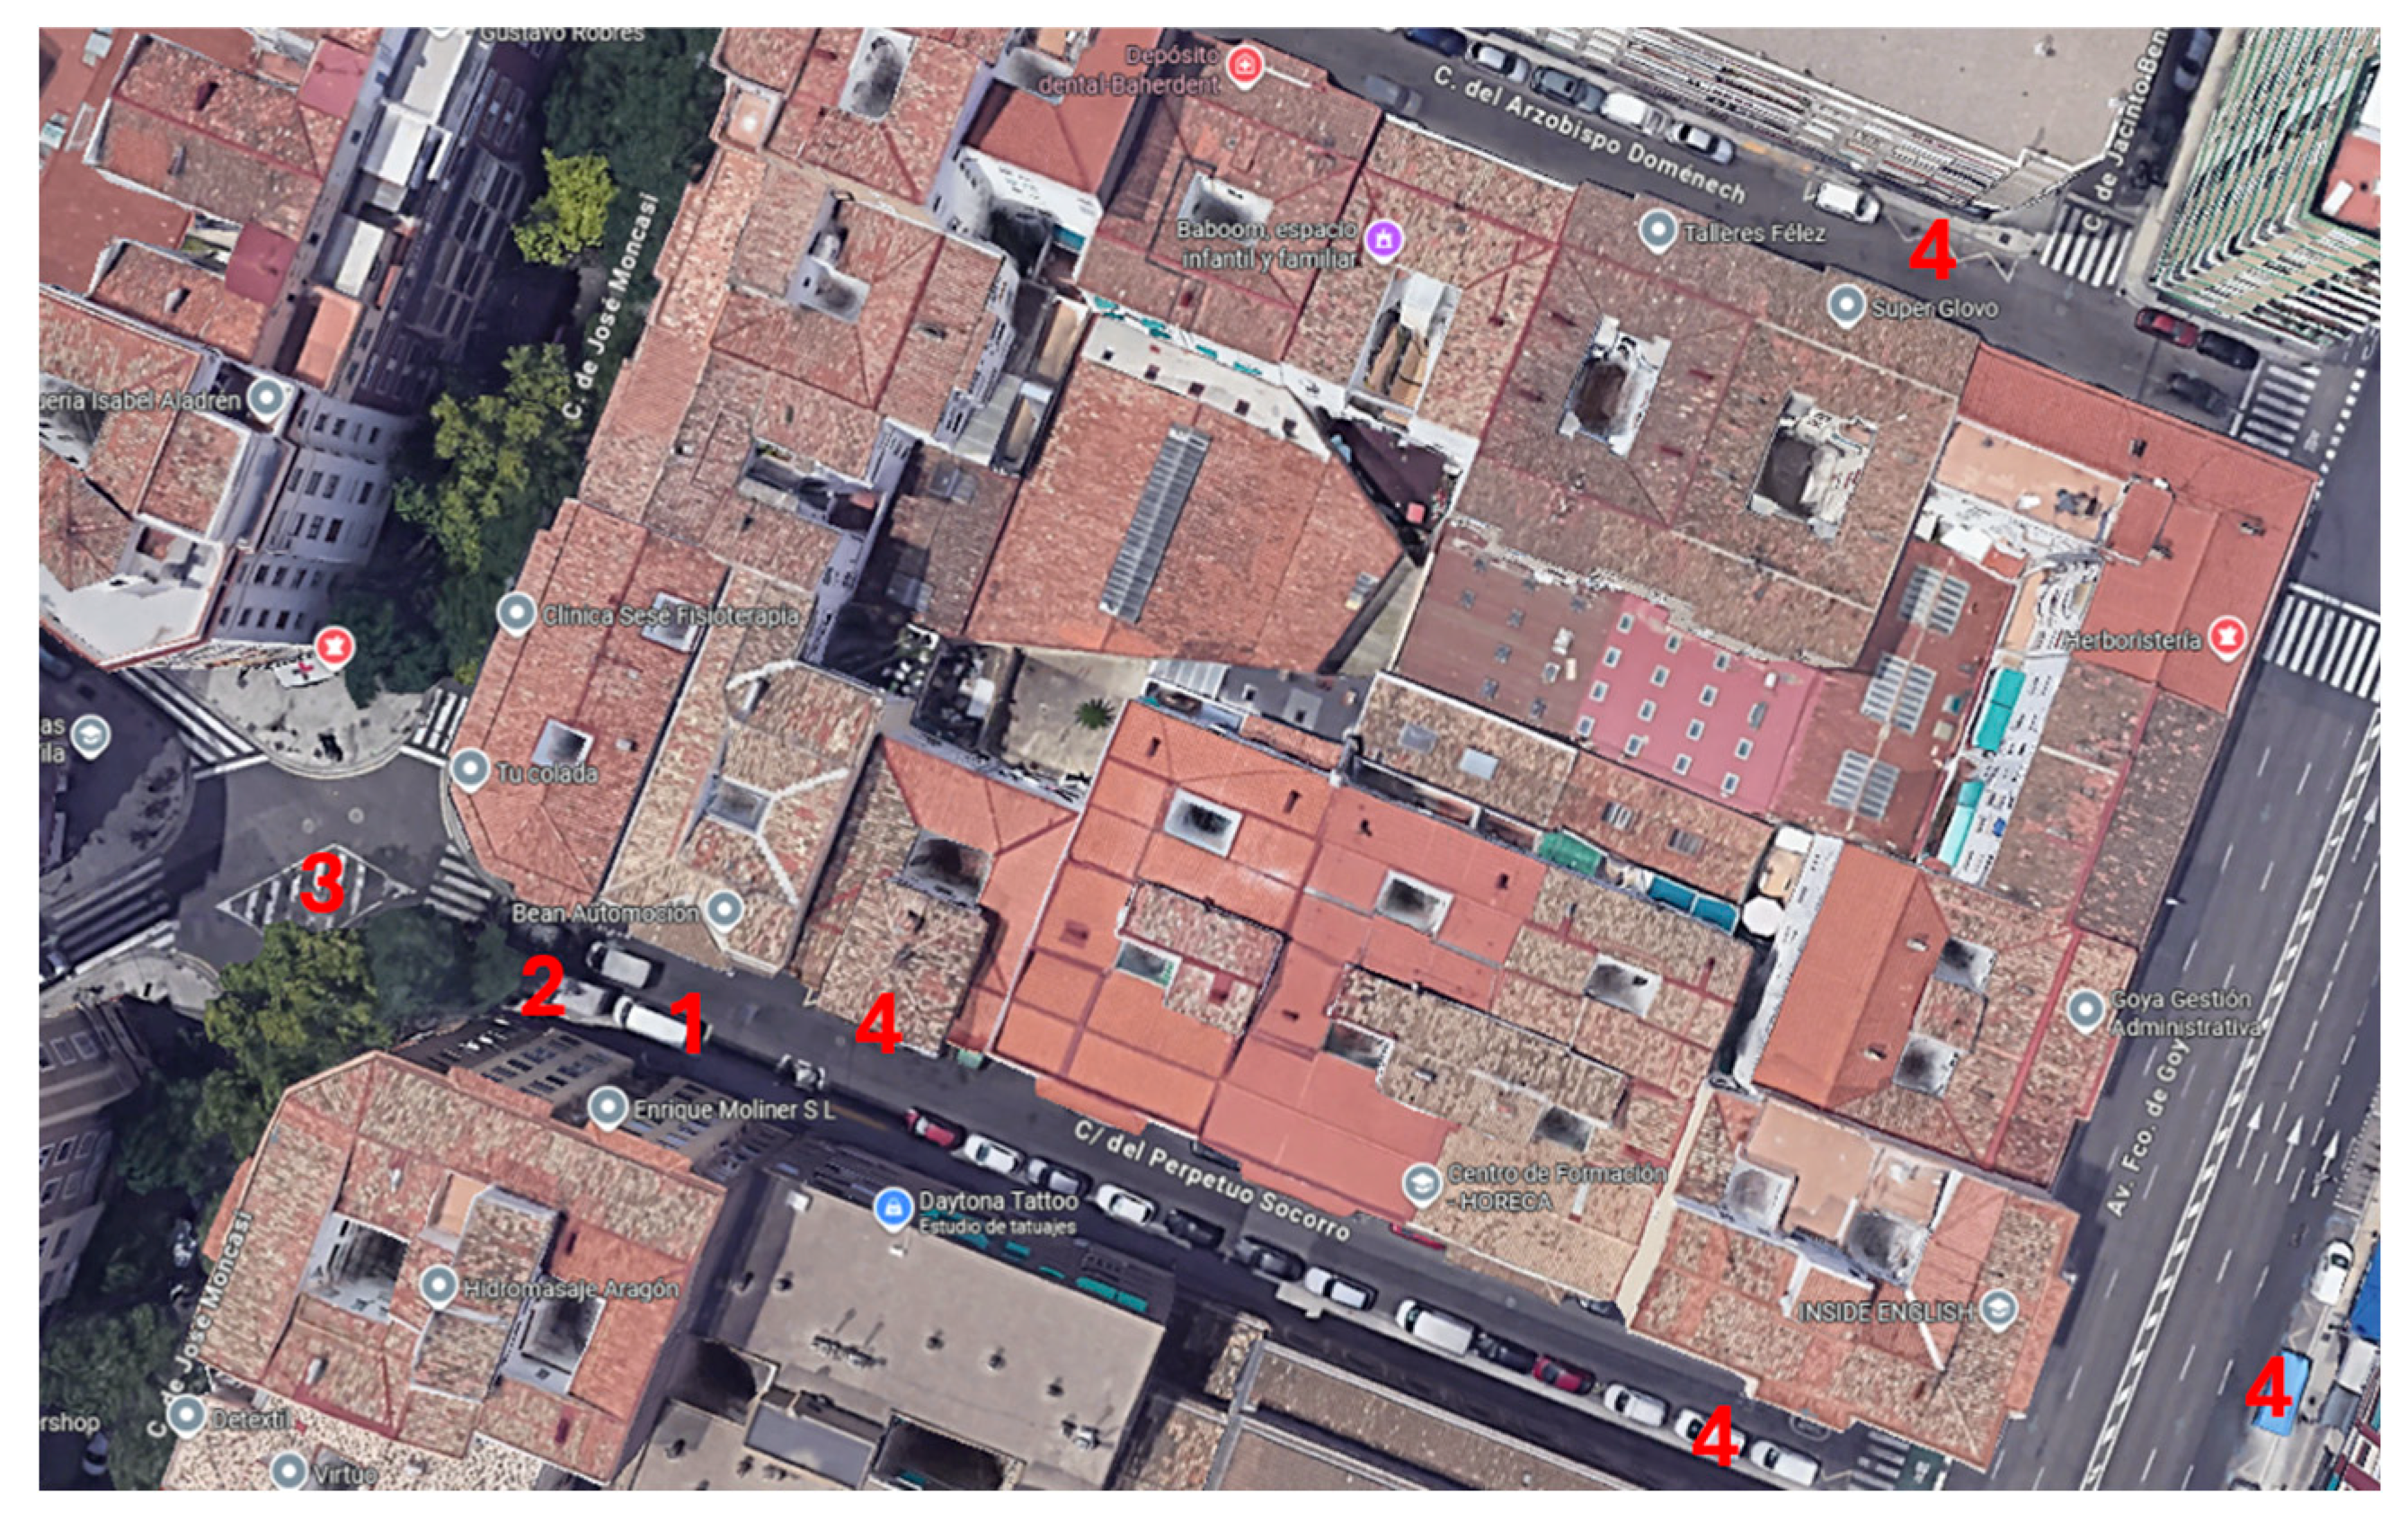
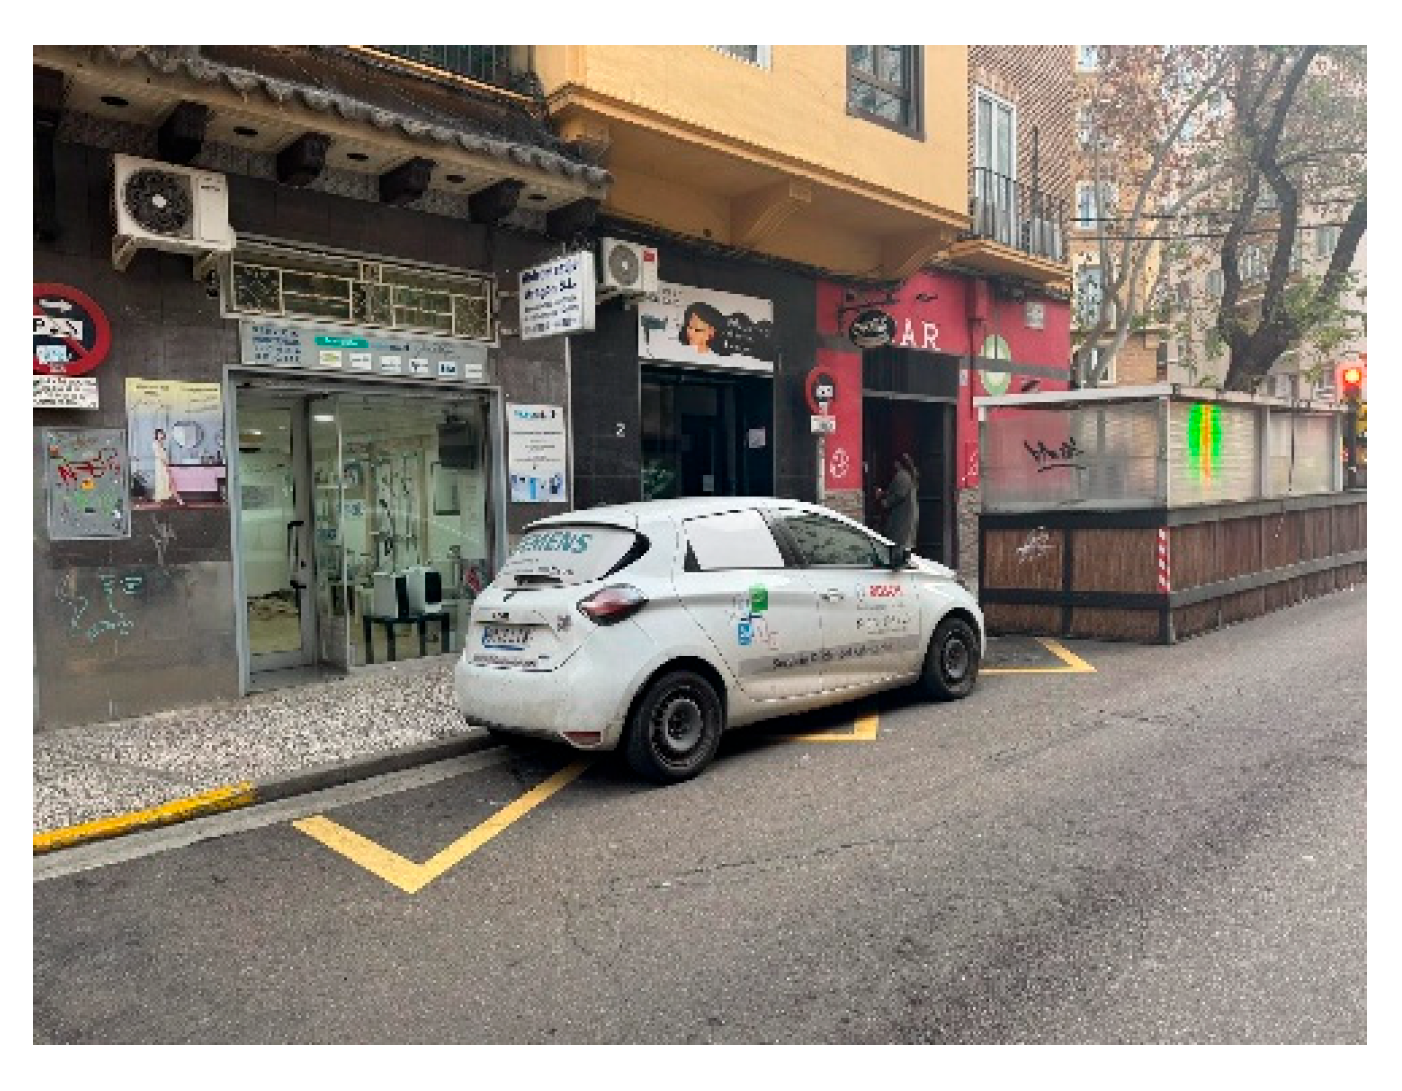
During the Covid19 era, it became common practice to expand outdoor spaces for bars and restaurants, often occupying areas reserved for parking and loading/unloading. In the city of Zaragoza (Spain), under the Municipal Ordinance regulating [33]the installation of outdoor seating areas, 700 terraces were installed, reducing parking spaces by 1,500, according to a Press Release from the Public Services and Mobility Department [34]. However, there is no information on how many of these affected loading and unloading zones. In our study case, Z5 experienced an exogenous reduction in effective curbside length of approximately 6 m, resulting from the installation of an outdoor restaurant terrace. This intervention reduced the usable curbside length for freight operations from a counterfactual configuration of 14 m to an observed configuration of 8 m, while the maximum authorised dwell time remained unchanged. This setting provides a controlled environment to isolate the effects of curbside length reduction on operational performance and vehicle behaviourFigure 2 below shows a delivery van correctly occupying the space reduced by the terrace, while Figure 3 shows an authorized vehicle of just 4 meters in length fully using an area that was initially designed to be 14 m for three van spaces.
Figure 2.
Z5 right occupation.
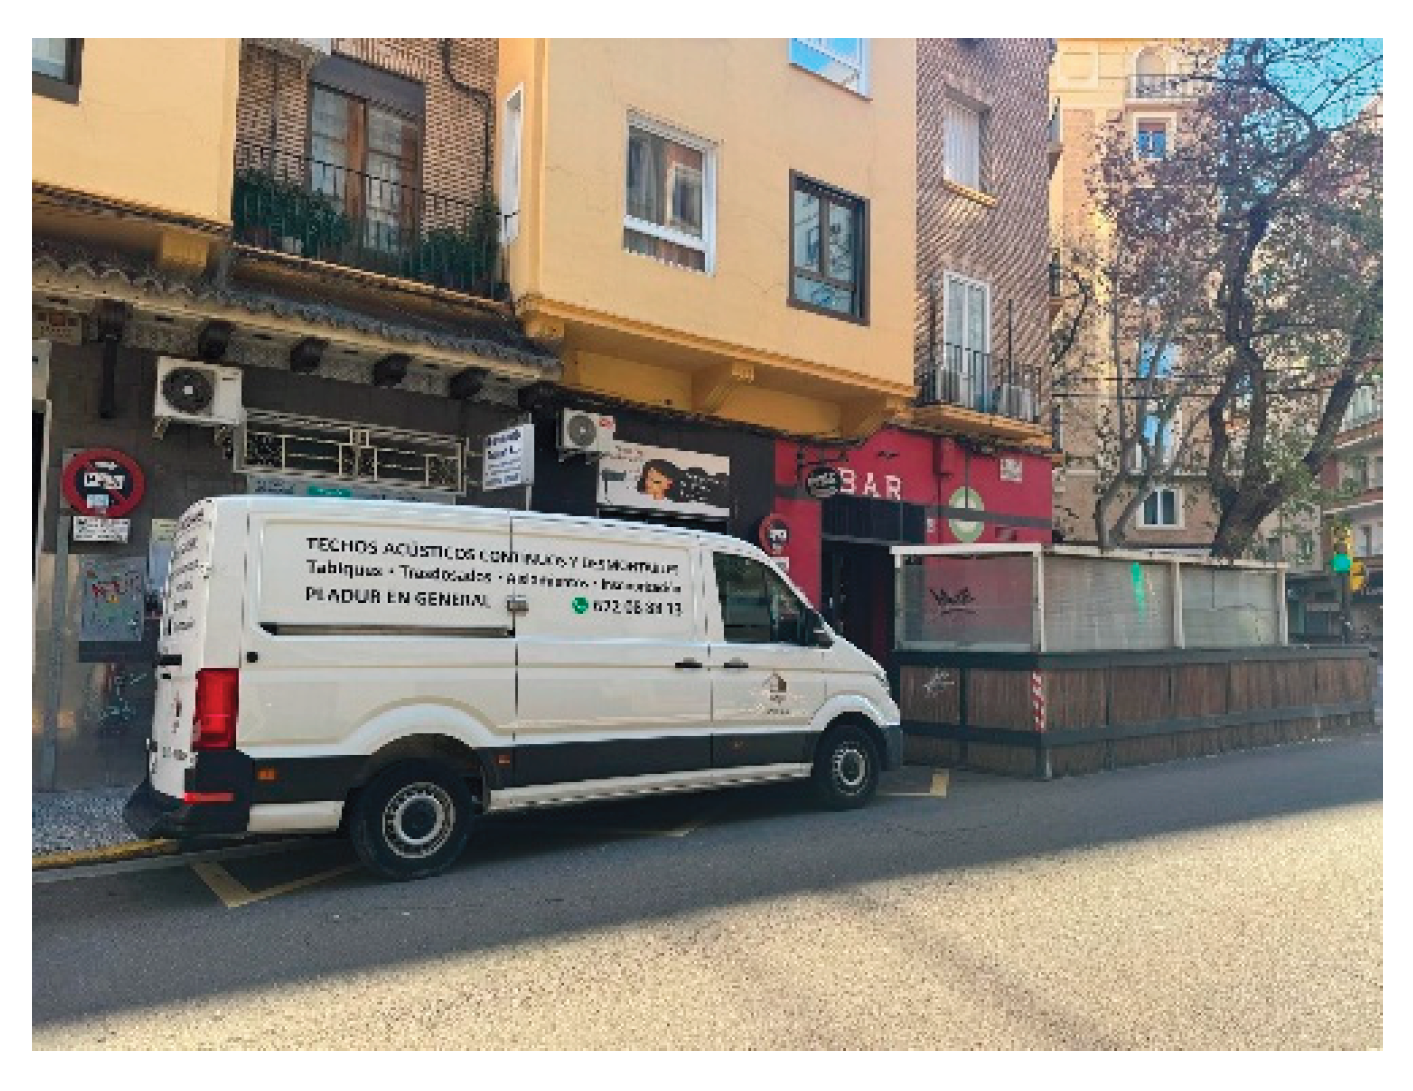
Figure 3.
Z5 underutilized occupation.
3.2. Observation Protocol and Dataset Overview
Data were collected through direct on site observation conducted by the authors. Observations covered 21 working days, with 6 consecutive hours per day, corresponding to the main delivery window. The same observation protocol was applied uniformly across all loading and unloading zones within the block.
This spatially complete coverage ensures that any vehicle rejected from Z5 and subsequently finding a legal loading space in another zone within the block would be recorded as a new observation. As a result, vehicles contributing to illegal occupancy associated with Z5 correspond to those that failed to reallocate legally within the observed area.
All observations were recorded manually, without the use of sensors or automated systems, allowing for detailed tracking of individual vehicle behaviour following rejection.
For each freight vehicle arrival at Z5, the following variables were recorded: arrival time, vehicle category, duration of the loading/unloading operation, outcome of the attempt (legal service, rejection, or illegal occupancy), number of recirculation loops performed after rejection, duration of illegal occupancy, and observed engine idling behaviour.
Vehicle types were classified into five operational categories: light truck (7.5 t MMA), chassis cab (3.5 t MMA), large van, small van, and delivery van.
Across the observation period, 211 vehicle arrivals were registered within the study area. Of these, 124 freight vehicles attempting to use Z5 ultimately resulted in illegal occupancy, either after one or more full recirculation loops or through immediate relocation to nearby intersection areas or garage accesses.
Empirical observation allowed the identification of distinct post rejection behaviours. A subset of vehicles performed one or more full recirculation loops around the block before stopping illegally, while others proceeded directly to illegal occupancy. For vehicles stopping illegally, the average duration of illegal occupancy was 22.3 minutes. Engine shutdown behaviour was also observed, with average thresholds of approximately 4 minutes for light commercial vehicles and up to 12 minutes for heavier vehicles.
4. Methodology
This section presents the methodological framework used to quantify the operational and environmental impacts of sidewalk capacity loss. The approach combines a spatiotemporal sidewalk design indicator, a loss based queuing model, and an empirical estimate of emissions induced by rejected freight vehicles. The methodology is designed to isolate the effect of reduced sidewalk length while holding demand and regulatory conditions constant.
4.1. Space Time Curbside Design Indicator: Factor of Occupancy (Fo)
The Factor of Occupancy (Fo) is introduced as a curbside design indicator that captures the joint influence of spatial and temporal constraints on the operational capacity of loading and unloading zones. Fo is defined as:
where:
- L denotes the effective curbside length available for freight operations (in metres)
- Tmax represents the maximum authorised dwell time per vehicle (in minutes)
Fo is expressed in metre–minutes and represents the design capacity of a curbside loading zone under a given regulatory framework. Unlike conventional operational indicators, Fo explicitly reflects how physical curbside configuration conditions the number of freight vehicles that can be accommodated over time.
In the present study, Fo is used to compare two curbside design scenarios for the same loading zone: a reduced configuration (8 m) and a restored configuration (14 m), with identical temporal constraints. This allows the isolated assessment of curbside length reduction on system performance.
4.2. Loss Based Queueing Model for Curbside Operations
Queueing theory provides a well established analytical framework to model systems in which demand for a limited resource arrives randomly over time and must be served subject to capacity constraints. In the context of urban loading and unloading zones, arriving freight vehicles can be interpreted as customers, while curbside loading spaces act as servers with finite capacity. When demand exceeds available capacity, vehicles cannot wait and are forced to abandon the system, either by searching for alternatives or by stopping illegally.
This operational setting is appropriately represented by loss systems, in which arrivals that find the system fully occupied are immediately rejected. Among these models, the Erlang B formulation (M/M/1/1) is particularly suitable for curbside freight operations, as it assumes Poisson arrivals, exponentially distributed service times, a single service position, and no waiting queue, Xiao et al. 2018 [35] . The model captures the fundamental characteristic of curbside loading zones: the impossibility of queuing without disrupting traffic flow. In this study, the Erlang B framework is used as a validated analytical foundation to estimate blocking probabilities and rejected operations under different curbside design configurations, allowing changes in effective curbside length to be directly translated into operational performance metrics.
Urban curbside loading zones are characterised by limited capacity and the absence of waiting space. When a vehicle arrives and the loading zone is occupied, the vehicle must immediately abandon the attempt and either seek an alternative location or stop illegally. This operational context is well represented by a loss system, in which arrivals that cannot be served are rejected.
Accordingly, curbside operations are modelled using an M/M/1/1 queueing system, where arrivals follow a Poisson process with rate λ, service times are exponentially distributed with mean 1/μ, a single service position is available, and no queue is allowed. Under these assumptions, the probability that an arriving vehicle is blocked is given by the Erlang loss formula for a single server:
where:
- λ = arrival rate (vehicles/hour)
- μ = service rate = 1/weighted dwell time
- = offered traffic (Erlangs)
The expected number of served and rejected vehicles over a given observation period can then be derived as functions of λ, μ, and the effective service capacity implied by Fo. Importantly, the arrival process and service time distributions are assumed to be identical across both curbside design scenarios. Differences in system performance are therefore attributable exclusively to changes in effective curbside length.
The queueing formulation adopted in this study builds directly on previous work by the authors Gil Gallego et al. [36], where loss based models for urban loading and unloading zones were extensively developed, discussed, and empirically validated. In that contribution, the Erlang loss framework (M/M/1/1) was shown to be particularly suitable for curbside freight operations, where waiting is not feasible and vehicles that arrive when the facility is occupied are immediately rejected, Legros et al. [37]. For the sake of brevity and to avoid methodological redundancy, the detailed derivation of the Erlang B formulation is not repeated here. The present paper reuses this validated modelling approach as a consolidated analytical foundation, shifting the focus towards the role of curbside design parameters and their operational and environmental implications.
4.3. Identification of Rejected Vehicles and Behavioural Responses
Vehicles that arrive when the loading zone is occupied are classified as rejected vehicles. Based on direct observation, rejected vehicles exhibit two main behavioural responses:
(i) Recirculation, whereby vehicles perform one or more full loops around the urban block in search of an alternative legal loading space;
(ii) Illegal occupancy, whereby vehicles stop in nearby intersection areas or garage accesses, typically with partial engine idling.
Because the monitored block is fully covered by the observation protocol, vehicles that successfully relocate to another legal loading zone within the block are recorded as new legal observations. Vehicles contributing to illegal occupancy are therefore those that fail to reallocate legally after rejection.
The empirical distribution of recirculation loops and illegal occupancy durations is used directly in the emission estimation, avoiding behavioural assumptions or synthetic modelling.
4.4. Hidden Carbon Emissions (HCE): Definition and Computational Steps
To quantify the environmental externalities induced by curbside capacity loss, we define the HCE indicator as the additional tailpipe CO₂ emitted by freight vehicles rejected from the loading zone and forced to (i) recirculate around the block and/or (ii) perform illegal stopping with partial engine idling. This formulation is intentionally parsimonious and fully data driven, relying on direct observation of post rejection behaviour.
Let T denote the observation period. HCE is computed as:
(a) Recirculation component
For each rejected vehicle i, let di be the additional distance travelled due to recirculation (km). Then:
where EFkm is the CO₂ emission factor per kilometre (gCO₂/km), and Nr(T) is the number of rejected freight vehicles attributable to curbside capacity constraints during T.
Operationally, if recirculation is observed as a discrete number of full loops Li around a block with perimeter Dloop(km), then:
This aggregation avoids behavioural assumptions: the empirical distribution of Li is taken directly from field observation.
(b) Illegal stopping / idling component
For each rejected vehicle i, let ti be the effective idling time (min) during illegal stopping. Then:
where EFmin is the CO₂ emission factor per minute of idling (gCO₂/min).
Because engine shut down was explicitly observed, idling time is computed as:
where τi is the observed illegal stopping duration (min), and θc(i) is the vehicle category specific engine shut down threshold (min) for category c. In the dataset, the average illegal stopping duration is 22.3 min, while shut down thresholds are approximately 4 min for light commercial vehicles and up to 12 min for heavier vehicles.
4.5. Emission Factors: Selection, Mapping, and Units
To guarantee replicability, emission factors are taken from publicly available and officially recognised sources and are expressed consistently in tailpipe CO₂.
4.5.1. Distance Based Factor EFkm (gCO₂/km)
As a single, transparent parameter for urban freight vehicles, we adopt an EU level official reference for average CO₂ emissions from new vans (light commercial vehicles), reported by the European Environment Agency (EEA). The EEA reports an average of 185.4 gCO₂/km for new vans (EU, Norway, Iceland) in 2024. This provides a conservative and easily traceable benchmark for the fleet average order of magnitude of LCV emissions per kilometre, European Environment Agency [38].
We acknowledge that the observed fleet is predominantly Euro 5 diesel (older than the newest registrations), which can imply higher real world emissions than a new vehicle average; consequently, using the EEA new van average is a conservative assumption for absolute HCE magnitudes, while preserving the validity of comparative results between curbside design scenarios.
4.5.2. Idling Factor EFmin (gCO₂/min)
The idling emission factor adopted in this study is derived using a transparent fuel based approach. A representative diesel fuel consumption under steady idling conditions of 0.63 L/h for light commercial vehicles is assumed, based on published technical evidence reporting typical idling behaviour for urban delivery vans, Kaddoussi et al. 2017 [39]. To convert fuel consumption into CO₂ emissions, a standard diesel emission factor of 2.64 kg CO₂/L is applied, as reported in methodological greenhouse gas accounting guidelines, The Energy and Resources Institute (TERI) [40]. Combining these two parameters yields an average idling emission rate of 27.77 g CO₂/min, which is used consistently across curbside configurations to estimate relative and avoidable emissions induced by curbside capacity loss. Given the comparative nature of the analysis, this value should be interpreted as a conservative and operationally grounded estimate rather than as an absolute fleet level emission rate. This value is applied as a conservative and operationally grounded estimate to quantify relative and avoidable emissions induced by curbside capacity loss. This factor is used to translate observed idling minutes into tailpipe CO₂ emissions in a unit consistent manner.
4.5.3. Mapping and Consistency Table
For transparency, the following mapping is applied:
𝐸𝐹km=185.4 gCO₂/km (EEA vans average) [38]
𝐸𝐹min=27.77 gCO₂/min (idling factor) [39,40]
4.6. Worked aggregation with observed behavioural variables
Using the above definitions, HCE can be computed in four deterministic steps:
Step 1 (behavioural totals). Compute total recirculation distance:
and total effective idling minutes:
The dataset provides Nr(T) and the empirical distributions of τi, Li, and θc from observation.
Step 2 (emissions by activity):
Step 3 (total HCE).
Step 4 (normalisation). For decision support, HCE may be normalised per served freight operation or per metre of curbside restored:
where ΔL is the restored curbside length (m). This supports comparability across sites and policy scenarios.
5. Results
This section presents the detailed application of the proposed space–time framework and loss based queueing model to the loading and unloading zone Z5. The objective is to quantify the operational consequences of curbside length reduction and to isolate the effects of regulatory compliance and curbside design on system performance.
The analysis is structured around a set of observed and simulated scenarios that progressively modify two key dimensions: (i) effective curbside length and (ii) compliance with access and dwell time regulations. By comparing the observed configuration of Z5 (8 m) with a counterfactual restored configuration (14 m), and by distinguishing between unrestricted and idealised regulated conditions, the analysis allows the identification of capacity losses attributable solely to curbside reallocation.
All scenarios are evaluated using the same modelling assumptions and demand profiles, ensuring that differences in performance arise exclusively from changes in curbside design or operational control. The results are expressed in terms of service capacity, blocking probability, and the number of vehicles served and rejected, providing a consistent basis for subsequent environmental assessment.
5.1. Z5 All Vehicles Without Restrictions for Real World Observation
Z5 is only 8 meters long because the initially 14 meter zone had 6 meters reserved for a bar's terrace due to measures implemented by the City Council during the COVID-19 pandemic, measures which remain in place today. This means that even though it is 8 meters long, in most cases it only occupies the length of one vehicle; two cannot fit. The authors wondered about the impact of removing those 6 meters for loading and unloading, quantified in the number of vehicles that are unable to unload for this reason. Therefore, an individual study of this zone was conducted using the methodology of the previous cases, and subsequently, the exercise was repeated with a simulation of the entire zone:
Vehicles entering the system (including private vehicles): 211 vehicles/month
Vehicles served without restrictions in the ZCD: 87 vehicles/month
Weighted average occupancy time (maximum 30 minutes per unloading): 48.13 minutes
Weighted average available time: 21 days, daily 6 hours, 8 minutes (Z5): 7,560 minutes
Weighted average time occupied in the ZCD: daily 6 hours, 8 minutes: 4,187.31 minutes
Percentage of weighted average time occupied: 55.39%
With this data, the following results are obtained:
vehícles/hour
vehícles/hour
Erlangs, the system is saturated, it is not viable without a queue and therefore losses occur which result in double lines and illegal occupations.
pB=0,5733
In this case, the probability of a blockage (57.33%) practically coincides with the actual observed data (124 vehicles, 58.77%).
The preliminary conclusions are that traffic intensity exceeds the system's capacity threshold (ρ>1). The system is not viable without restrictions, as disorderly use causes congestion, illegal occupation, and a loss of efficiency in goods unloading operations.
The results show that this loss of capacity generates a significant increase in rejected vehicles, which supports hypothesis H1, confirming that even with constant demand and regulatory conditions, the reduction of curbside space degrades operational capacity, leading to illegal occupations and double parking due to system saturation.
5.2. Simulation of Zone 5 Without Access to the ZCD for Unauthorized Private Vehicles and Considering a Maximum Time of 30 Minutes per Unloading of Authorized Vehicles
This idealized configuration is used as a reference to evaluate the magnitude of capacity losses induced by the reduction in sidewalk length and presents an ideal situation in which both access control for authorized vehicles and the time of use of the zone are guaranteed. The data characterizing this scenario are:
Vehicles entering the system (excluding private vehicles): 197 vehicles/month
Vehicles served applying restrictions in the ZCD: 73 vehicles/month
Weighted average occupancy time (maximum 30 minutes per unloading): 16.09 minutes
Weighted average available time: 21 days, daily 6 hours, 8 minutes (Z5): 7,560 minutes
Weighted average time occupied in the ZCD: daily 6 hours, 8 minutes: 1,174.57 minutes
Percentage of weighted average occupied time: 15.54%
Con estos datos y siguiendo la misma metodología del primer caso, se obtienen los siguientes resultados:
λ = 1.56 vehicles/hour
μ = 3.73 vehicles/hour
ρ = 0.42 Erlangs, perfectly viable system
In this idealized case of no entry into the ZCD by unauthorized private vehicles and no excessive time spent using the zone by commercial vehicles, a weighted amount of occupancy time is freed up, which could be compensated for by a greater number of occupancies by authorized vehicles.
The weighted occupancy time freed up is then calculated:
Treleased = Tunrestricted occupancy – Trestricted occupancy
In the comparative case of the Z5:
Treleased = (87 x 48,13= 4.187,31) – (73 x 16,09= 1.174,57) = 3.012,74 minutes
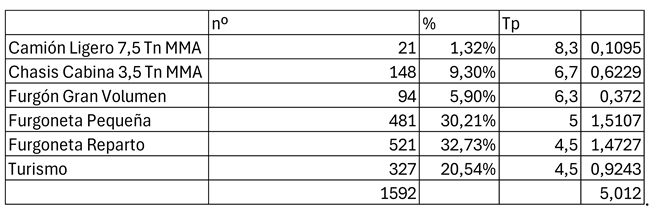
To calculate the number of additional vehicles that can access the system with that freed up time, it is necessary to know the weighted occupancy time per generic vehicle, which can be seen in Table 1:
Con ese valor, se calcula el nuevo número de vehículos adicionales atendidos:
In Zone 5, by applying restrictions, up to 322.27 additional vehicles could be served with the time freed up compared to the actual number served in the saturation scenario. That is, compared to the 197 authorized vehicles entering the system, under these control conditions (73 + 322.27) = 395 vehicles could be served, which is 308 more vehicles than the 87 served in the situation without restrictions.
The study is then repeated with the new simulated data, in which the Erlang B model will provide the blocking probability to validate whether the entire demand can be met.
Vehicles entering the system (excluding private vehicles): 197 vehicles/month
Vehicles served applying restrictions in the ZCD: 395 vehicles/month
Excess vehicle availability in the zone: 395-197=198 vehicles/month
Weighted average occupancy time (maximum 30 minutes per unloading): 16.09 minutes
Weighted average available time: 21 days, daily 6 hours, 8 minutes (Z5): 7,560 minutes
Weighted average time occupied in the ZCD: daily 6 hours, 8 minutes: 6,359.90 minutes
Percentage of weighted average time occupied: 84.13%
Using this data and following the same methodology as the first case, the following results are obtained:
λ = 1.56 vehicles/hour
μ = 3.73 vehicles/hour
ρ = 0.42 Erlangs, a perfectly viable system
pB = 0.2954
According to the probability suggested by the model, 58.20 vehicles, or 29.54% of those arriving, will not be able to be served. However, this figure is less than the 198 calculated as excess availability based on the weighted time. Therefore, we can confidently state that by strictly enforcing the established rules, without additional measures, the entire demand for commercial vehicles for loading and unloading in this area can be met.
These results empirically support H3 by showing that the system, when restricted to authorized vehicles only, significantly increases the served vehicles without exceeding capacity. The blocking probability is well within acceptable limits, indicating that the system operates efficiently under controlled conditions.
5.3. Z5 With 14 m All Vehicles According to Without Restrictions to Actual Observation
As mentioned previously, loading and unloading zone Z5 was reduced by 6 meters to accommodate a restaurant terrace. Leveraging queuing theory and the zone analysis conducted in this study, a simulation was performed to assess the behavior of this zone had it been fully occupied and to evaluate the resulting loss of operational capacity. To conduct this detailed analysis, a new key performance indicator (KPI) was defined, one not previously mentioned in any publication: the occupancy factor (Fo) of a loading and unloading zone. This factor is defined as the product of the length of the zone under study and the time allotted for the operation. Therefore, an individualized study of this zone was conducted using the methodology of the previous cases, starting with the occupancy factor:
Fo 8 m = l x t = 8 m x (6 h/day x 60 min/h x 21 days) = 60,480 m x min
Fo sim 14 m = l x t = 14 m x (6 h/day x 60 min/h x 21 days) = 105,840 m x min
Fo dif = 45,360 m x min
Next, this indicator is divided by the weighted occupancy time of the zone under the misuse scenario (restrictions not applicable), which is 48.13 minutes. Therefore, the zone's availability would have been 942.44 linear meters for the month. Since we have a record of all trucks accessing the zones, we obtain the weighted length of the vehicles based on the number of unloading operations they performed, Table 2:

Table 2.
Weighted occupancy time by vehicle type.
This translates to the 6 meter increase potentially accommodating 188.11 additional unloading operations, for a total of 275 (188 + 87) in the area during the one month study period. It is not estimated that having more space in the area would have led to a greater number of vehicles arriving to unload, but rather that it would have substantially reduced the illegal occupation associated with that area. For this reason, the queuing theory calculation parameters assume that all arriving vehicles will be served, and the loss predicted by the Erlang B model will be taken into account.
Another factor to be modified is the weighted time, since this KPI measures the longitudinal occupancy of vehicles over time, but relative to the total length of the area. Therefore, the weighted time indicator must be revised, adjusting it to the new length of 14 meters.
Vehicles entering the system (including private vehicles): 211 vehicles/month
Vehicles served with proper use applying restrictions in the ZCD: 211 vehicles/month
Weighted average occupancy time 14 m (max 30 min per unloading): 27.50 minutes
Weighted average available time: 21 days, 6 hours daily, 14 m (Z5): 7,560 minutes
Weighted average time occupied in the ZCD: 6 hours daily, 14 m: 5,802.50 minutes
Percentage of weighted average time occupied: 76.75%
With this data and following the same methodology as the first case, the following results are obtained:
λ = 1.67 vehicles/hour
μ = 2.18 vehicles/hour
ρ = 0.77 Erlangs, viable system, therefore double parking and illegal occupations should not occur.
pB = 0.4342
In this case, the probability of blocking (43.42%) indicates that 91.62 vehicles will be lost, with the number of vehicles served being predicted at 119.
These results empirically support H1, demonstrating that the reduction in available curbside length limits system performance and leads to illegal occupations and double parking, which can be mitigated by restoring capacity
5.4. Simulation Z5 With 14 m Without Access to the ZCD for Unauthorized Private Vehicles and Considering a Maximum Time of 30 Minutes per Unloading of Authorized Vehicles
This idealized configuration is used as a reference to evaluate the magnitude of capacity losses induced by the reduction in sidewalk length and presents an ideal situation in which both access control for authorized vehicles and the usage time of the zone are guaranteed in a simulated 14 meter zone. The data that characterize this scenario are:
Vehicles entering the system (excluding private vehicles): 197 vehicles/month
Vehicles served applying restrictions in the ZCD: 119 vehicles/month
Weighted average occupancy time (14 m², max. 30 min per unloading): 9.30 minutes
Weighted average available time: 21 days, 6 hours daily, 14 m² (Z5): 7,560 minutes
Weighted average time occupied in the ZCD: 6 hours daily, 14 m²: 1,110.20 minutes
Percentage of weighted average time occupied: 14.69%
With this data and following the same methodology as the first case, the following results are obtained:
λ = 1.56 vehicles/hour
μ = 6.45 vehicles/hour
ρ = 0.24 Erlangs, perfectly viable system
In this idealized case, no unauthorized private vehicles enter the ZCD and no excessive time is allowed in the zone For commercial vehicles in the 14m zone, a weighted amount of occupancy time is freed up that could be offset by a greater number of authorized vehicle occupancies.
The weighted occupancy time released is then calculated:
Treleased = Tunrestricted occupancy – Trestricted occupancy
In the comparative case of the Z5:
Treleased = (211 x 27,50= 5.802,50) – (119 x 9,30= 1.110,20) = 4.692,30 minutes
With a weighted occupancy time per generic vehicle calculated above of 9.35, the new number of additional vehicles served is calculated.
In the extended Z5 zone, up to 14 meters, applying restrictions would allow for the processing of up to 501.93 additional vehicles with the time freed up, compared to the actual number served in the saturated scenario. That is, compared to the 197 authorized vehicles entering the system, under these controlled conditions, (119 + 501.93) = 621 vehicles could be served, which is 410.31 more vehicles than the 211 served in the unrestricted situation.
The study is then repeated with the new simulated data, in which the Erlang B model will provide the probability of blocking to validate whether the entire demand can be met.
Vehicles entering the system (excluding private vehicles): 197 vehicles/month
Vehicles served applying restrictions in the ZCD: 621 vehicles/month
Excess vehicle availability in the zone: 621 - 197 = 424 vehicles/month
Weighted average occupancy time (14 m) (maximum 30 minutes per unloading): 9.30 minutes
Weighted average available time: 21 days, 6 hours daily, 14 m (Z5): 7,560 minutes
Weighted average time occupied in the ZCD: 6 hours daily, 14 m: 5,778.16 minutes
Percentage of weighted average time occupied: 76.43%
With this data and following the same methodology as the first case, the following results are obtained:
λ = 1.56 vehicles/hour
μ = 6.45 vehicles/hour
ρ = 0.24 Erlangs, Perfectly efficient system viable
pB=0.1951
According to the probability suggested by the model, 38.43 vehicles, or 19.51% of those arriving, will not be able to be served. However, this figure is lower than the 424 calculated as excess availability based on the weighted time. Therefore, we can confidently state that by strictly enforcing the established rules without exception, and without additional measures, the entire demand for commercial vehicles to load and unload in this hypothetically expanded 14 m zone could be met.
Table 3 shows the data from the two situations studied as a numerical summary of the proposed scenarios regarding vehicle arrivals and their activity. Table 4 compares the arrival, service, and traffic intensity parameters, revealing the system's capacity.
The difference in rejected vehicles across curbside configurations constitutes the basis for the estimation of Hidden Carbon Emissions, as developed in the following section.
This result empirically supports H1, demonstrating that restoring capacity (even with access and time restrictions) substantially increases system capacity by reducing illegal occupations.
5.5. Results: Hidden Carbon Emissions (HCE)
This subsection presents the results of the HCE associated with curbside capacity loss in loading zone Z5. HCE quantifies the additional tailpipe CO₂ emissions generated by freight vehicles that could not be legally served under the observed curbside configuration (8 m) and were therefore forced to recirculate around the block and/or perform illegal stopping.
All results correspond to the difference between the observed configuration (8 m) and the counterfactual restored configuration (14 m), under identical demand and regulatory conditions. Emissions are reported over the observed 21 day operational period, which is treated as a representative “operational month”.
5.5.1. Emissions from Recirculation
Out of the 124 freight vehicles that were rejected due to curbside capacity constraints at Z5, 78 vehicles attempted at least one full recirculation loop around the block. Among these, 78 vehicles performed one loop, 21 vehicles performed two loops, 8 vehicles performed three loops.
The total number of observed recirculation loops is therefore:
𝑁loops = 78 + (21×2) + (8×3) = 144
Given a block perimeter of 384 m, the cumulative additional distance travelled due to recirculation during the observation period is:
𝐷rec = 144 × 0.384 = 55.296 km
Using the distance based emission factor
total recirculation related emissions are:
𝐸𝐹km = 185.4 gCO2/km
𝐻𝐶𝐸rec = 55.296 × 185.4 = 10252 gCO2
That is:
𝐻𝐶𝐸rec ≈ 10.25 kgCO2
5.5.2. Emissions from Illegal Stopping and Idling
All 124 rejected vehicles ultimately resulted in illegal stopping, either directly or after one or more recirculation loops. The average observed illegal stopping duration is 22.3 minutes per vehicle. This is a long time because the preferred illegal occupation area is far from the consumption points, resulting in a long walking distance. However, effective idling time is limited by observed engine shut off behaviour, which differs by vehicle category. In many cases, especially in heavier vehicles, it is because they are refrigerated vehicles that require idling to maintain the refrigeration equipment.
Based on the observed fleet composition, 28 chassis cab vehicles (3.5 t MMA) are treated as heavier vehicles, with an average engine shut off threshold of 12 minutes, the remaining 96 vehicles (vans and light commercial vehicles) exhibit an average shut off threshold of 4 minutes.
The average effective idling time per rejected vehicle is therefore:
The total idling time during the observation period is:
Idle = 124 × 5,81 = 720 min
Using an idle emission factor of
Idle min = 27,77 gCO2/min
Total idling related emissions are:
Idle = 720 × 27,77 = 19994 gCO2
That is to say:
Idle ≈ 19,99 kgCO2
5.5.3. Total Hidden Carbon Emissions
The total hidden carbon emissions attributable to the loss of sidewalk capacity in Zone 5 during the 21 day operating period are obtained as the sum of the recirculation and idling emissions:
Emissions: 10.25 + 19.99 = 30.25 kgCO2
Total hidden carbon emissions attributable to the loss of sidewalk capacity in Zone 5 during the 21 day operating period: 10.30 + 19.99 = 30.25 kgCO2
Total hidden carbon emissions attributable to the loss of sidewalk capacity in Zone 5 during the 21 day operating period: 10.30 + 19.99 = 30.30 kgCO2
These emissions are structurally induced by the sidewalk design constraints and would be avoided with the restored 14 m configuration. This is clearly shown in Figure 6.
5.5.4. New medioambiental indicators
To enhance interpretability and policy relevance, HCE is additionally expressed using two new indicators that represent a relevant contribution since they quantify in a traceable and methodological way the environmental consequences of certain decisions made by the city's governance to meet needs external to the urban distribution of goods, and which, being hidden, might seem not to exist.
HCE per rejected operation
Normalising by the number of rejected freight vehicles yields:
This indicator captures the average emission burden induced by each rejected delivery attempt.
HCE per metre of curbside lost
The reduction in effective curbside length is 6 m (from 14 m to 8 m). Emissions per metre of curbside lost are therefore:
These results empirically support H2, highlighting the hidden emissions caused by curbside design, which are typically overlooked in conventional freight performance assessments. The study also introduces two new environmental indicators: HCE per rejected operation and HCE per meter of curbside lost, both of which quantify the environmental cost of curbside capacity reduction in a traceable and methodological way.
Table 5.
Summary of HCE Results.
| Component | Parameter | Value | Unit | Source / Basis |
| Spatial | Block perimeter DloopD_{\text{loop}}Dloop | 384 | m | Field measurement |
| Behaviour | Rejected vehicles NrN_rNr | 124 | vehicles | Direct observation |
| Behaviour | Vehicles with ≥1 loop | 78 | vehicles | Direct observation |
| Behaviour | Vehicles with 2 loops | 21 | vehicles | Direct observation |
| Behaviour | Vehicles with 3 loops | 8 | vehicles | Direct observation |
| Behaviour | Recirculation loops | 144 | vehicles | Direct observation |
| Behaviour | Additional recirculation distance | 55,3 | km | Direct observation |
| Behaviour | Mean illegal stopping duration τ\tauτ | 22.3 | min | Direct observation |
| Behaviour | Engine shut off (LCV) θLCV\theta_{\text{LCV}}θLCV | 4 | min | Observed behaviour |
| Behaviour | Engine shut off (heavier vehicles) θHGV\theta_{\text{HGV}}θHGV | 12 | min | Observed behaviour |
| Behaviour | Total idling time | 720 | min | Observed behaviour |
| Emissions | Distance factor EFkmEF_{\text{km}}EFkm | 185.4 | gCO₂/km | EEA (EU vans average) |
| Emissions | Idling factor EFminEF_{\text{min}}EFmin | 27.77 | gCO₂/min | TRL (diesel idling) |
| Emissions | HCE from recirculation | 10.25 | kg CO₂ | New kpi |
| Emissions | HCE from idling | 19.99 | kg CO₂ | New kpi |
| Emissions | Total HCE (21 days) | 30.25 | kg CO₂ | New kpi |
| Emissions | HCE per rejected operation | 0.244 | kg CO₂/veh | New kpi |
| Emissions | HCE per metre of curbside lost | 5.04 | kg CO₂/m | New kpi |
5.5.5. Summary of HCE Results
The following table summarizes all the results obtained from the HCE analysis, with particular emphasis on HCE from recirculation, HCE from idling and the sum of both, the total HCE (21 days), and the new indicators of HCE per rejected operation and HCE per meter of curbside lost
Approximately two thirds of HCE are generated by idling, not by driving. Hidden emissions are driven by curbside capacity loss, not vehicle propulsion technology. A reduction of only 6 m of curbside space produces measurable and avoidable CO₂ emissions over a single operational month.
6. Discussion
The results obtained in this study highlight the central role of curbside capacity as a structural constraint in urban freight systems. Unlike approaches that primarily focus on vehicle technology or routing optimisation, the present analysis demonstrates that small variations in effective curbside length can induce measurable operational and environmental impacts, even when demand levels and regulatory conditions remain unchanged. This finding reinforces the idea that, in dense urban environments, the limiting factor for sustainable freight distribution is increasingly space availability rather than propulsion technology.
The introduction of the Factor of Occupancy (Fo) allows curbside design to be analysed explicitly as a space–time resource. By expressing curbside capacity in metre–minutes, Fo bridges the gap between physical design decisions and operational performance, providing a direct link between curbside length, authorised dwell time, and the number of freight operations that can be accommodated. The results show that reducing Fo through the reallocation of only 6 m of curbside space leads to a disproportionate increase in rejected vehicles, confirming Hypothesis H1. This non linear response is consistent with loss based systems, where marginal reductions in capacity can translate into sharp increases in blocking probability.
From an environmental perspective, the proposed HCE indicator reveals externalities that remain largely invisible in conventional assessments of urban freight performance. The majority of HCE observed in the case study originates from engine idling during illegal stopping, rather than from additional distance travelled. This finding is particularly relevant, as it challenges the common assumption that emissions are primarily driven by kilometres travelled or by vehicle speed profiles. Instead, the results indicate that idle time induced by insufficient curbside capacity can represent a dominant share of emissions, thereby validating Hypothesis H2.
Importantly, the emissions quantified through HCE are not the result of inefficient driver behaviour or suboptimal routing choices. They are a direct consequence of curbside design decisions, specifically the reallocation of space from freight use to competing functions. This distinction is critical from a policy perspective: while vehicle technology upgrades require long term fleet renewal, curbside design and enforcement decisions can be implemented in the short term and yield immediate benefits. The comparison between the observed (8 m) and restored (14 m) configurations shows that reinstating a relatively small amount of curbside space would eliminate a significant share of avoidable emissions, thus supporting Hypothesis H3.
These findings have broader implications for urban mobility policy. Current decarbonisation strategies often prioritise the electrification of vehicle fleets or the introduction of low emission zones. While these measures are necessary, the present results suggest that they are insufficient if curbside capacity constraints are not addressed simultaneously. In contexts where streets operate close to their spatial limits, electrified vehicles will continue to generate congestion, delays, and indirect emissions if they are unable to access loading zones efficiently. Managing curbside capacity therefore emerges as a prerequisite for the effective decarbonisation of last mile logistics.
The results also contribute to the ongoing debate on the transformation of last mile delivery from a low cost commodity to a premium urban service. As curbside space becomes increasingly scarce and contested, reliable access to loading zones acquires economic value. The emissions and inefficiencies identified in this study can be interpreted as the hidden cost of treating home delivery as a commoditised service without accounting for spatial constraints. From this perspective, Fo and HCE provide complementary tools to support pricing, regulation, or prioritisation mechanisms that reflect the true cost of curbside use.
Finally, although the empirical analysis focuses on a single urban block, the methodological framework is intentionally transferable. Z5 represents a lower bound case for curbside induced emissions, as double parking is physically constrained; impacts would be expected to be larger in multi lane contexts. The combination of a space time design indicator, a loss based queueing model, and an empirically grounded emission metric can be applied to other urban contexts with minimal adaptation. Nevertheless, some limitations should be acknowledged. The environmental assessment is restricted to tailpipe CO₂ emissions and does not consider network wide effects or life cycle impacts. Additionally, the behavioural responses observed in this case study may differ in cities with alternative street layouts or enforcement regimes. These aspects represent promising avenues for future research.
The results validate all three hypotheses of the study. H1 is supported by the finding that reducing curbside length (from 14 m to 8 m) leads to a significant increase in rejected freight vehicles and illegal occupations, confirming that curbside capacity loss impairs system performance. H2 is validated through the introduction of Hidden Carbon Emissions (HCE), with emissions primarily resulting from idling during illegal stops, highlighting the environmental cost of insufficient curbside capacity. Finally, H3 is confirmed by the restoration of the curbside to 14 m, which reduces blocking probability and increases the number of vehicles served, demonstrating that restoring curbside capacity enhances system efficiency.
Overall, the discussion underscores a key insight: urban freight decarbonisation cannot be achieved through vehicle technology alone. Without explicit consideration of curbside capacity and design, a substantial share of emissions will remain structurally embedded in the system. By making these emissions visible and quantifiable, the proposed framework provides actionable evidence to support more coherent and effective curbside management policies.
7. Conclusions
This paper has examined the operational and environmental consequences of curbside capacity loss in urban freight operations through the combined use of space–time design indicators, loss based queueing theory, and empirically grounded emission estimates. By analysing a real world case study, the results provide quantitative evidence that relatively small curbside reallocation decisions can induce measurable inefficiencies and avoidable CO₂ emissions.
7.1. Main Contributions
The first contribution of this study is the formalisation of the Factor of Occupancy (Fo) as a space–time design indicator for urban loading and unloading zones. Fo explicitly links curbside length and authorised dwell time, enabling curbside design to be analysed as a capacity resource expressed in metres and minutes. By integrating Fo into a loss based queueing framework, the paper demonstrates that marginal reductions in effective curbside length can lead to non linear increases in rejected freight operations.
Second, this study advances the literature on urban freight performance by shifting the analytical focus from regulatory compliance and vehicle behavior to sidewalk design as a causal factor in system efficiency. The results show that, even with stable demand and regulatory conditions, a simple reduction in sidewalk length can substantially degrade service capacity. In this context, the article presents the HCE indicator, which captures CO₂ emissions induced by rejected vehicles due to recirculation and idling. Unlike conventional environmental assessments, which focus primarily on vehicle technology or distance traveled, the HCE indicator reveals emissions structurally embedded in the system due to insufficient sidewalk capacity. The results indicate that a significant portion of these emissions comes from idling during illegal stops, thus underscoring the environmental relevance of sidewalk design decisions, which extend beyond mere regulations and the type of vehicles used.
Third, to improve interpretability and policy relevance, the HCE indicator is expressed using two standardized indicators. (i) The first, HCE per missed operation, quantifies the emissions induced by vehicles rejected due to insufficient loading and unloading zone (LUZ) capacity, considering recirculation and idling during illegal stops. This indicator reveals the environmental cost of the operational loss of a period that should have been dedicated to loading. (ii) The second indicator, HCE per linear meter stolen from the LUZ, measures the emissions resulting from the loss of logistics space due to urban planning decisions that reallocate the curb to other, non logistics uses. This value highlights how small modifications to space can generate large environmental impacts, especially in dense urban areas. Both indicators allow for the quantification of hidden emissions generated by urban planning decisions, providing a clear methodological tool for assessing the environmental impact of urban reconfigurations on goods distribution.
The analysis of hidden emissions reveals that, environmentally, it is more efficient to prioritize recirculation recommendations over illegal parking, given that approximately two thirds of emissions come from idling during illegal stops. However, operationally, and for reasons of time savings, carriers tend to prefer illegal parking, generating these externalities negative environmental impacts.
7.2. Policy Implications and Future Research
Beyond its immediate analytical contributions, this study highlights several implications for urban mobility policy and future research. The findings reinforce the idea that urban freight decarbonisation cannot rely solely on vehicle technology or fleet renewal. In dense urban environments, emissions are increasingly driven by spatial constraints at the curbside, and without adequate capacity management, even low emission vehicles will continue to generate congestion, delays, and avoidable emissions.
Importantly, curbside capacity loss should not be understood only in terms of visible reallocations, such as the conversion of loading zones into terraces or other non logistics uses. Field observations conducted in this study reveal the presence of less visible forms of curbside space appropriation, particularly the prolonged use of loading zones by small commercial vehicles from trades and services (e.g., plumbing, carpentry, maintenance). Although these vehicles are legally authorised and commercial in nature, their long dwell times effectively reduce the functional capacity and turnover of loading zones, displacing last mile delivery vehicles and inducing additional rejections and emissions.
Future research should therefore focus on identifying and quantifying these hidden forms of curbside capacity erosion, distinguishing between different types of commercial use and their respective dwell time profiles. Extending the Fo and HCE framework to account for service type, duration, and functional priority would support more nuanced curbside management strategies based on turnover and efficiency rather than on simple access authorisation.
In conclusion, this paper shows that curbside space is a critical and finite urban resource whose design and management have direct implications for both logistics performance and environmental sustainability. By making the operational and carbon impacts of curbside capacity loss explicit and measurable, the proposed framework provides actionable evidence to support more coherent, efficient, and sustainable urban freight and curbside management policies.
Abbreviations
The following abbreviations are used in this manuscript:
| UDG | Urban Distribution of Goods |
| LUZ | Loading and Unloading Zones |
| OEE | Overall Equipment Effectiveness |
| HCE | Hidden Carbon Emissions |
References
- Valença, G.; Moura, F.; Morais de Sá, A. Main Challenges and Opportunities to Dynamic Road Space Allocation: From Static to Dynamic Urban Designs. Journal of Urban Mobility 2021, 1, 100008. [Google Scholar] [CrossRef]
- Castrellon, J.P.; Sanchez-Diaz, I. Effects of Freight Curbside Management on Sustainable Cities: Evidence and Paths Forward. Transp Res D Transp Environ 2024, 130, 104165. [Google Scholar] [CrossRef]
- Petzer, B.J.M.; Wieczorek, A.J.; Verbong, G.P.J. The Legal Street: A Scarcity Approach to Urban Open Space in Mobility Transitions. Urban Transform 2021, 3. [Google Scholar] [CrossRef]
- Palacios-Argüello, L.; Castrellon, J.P.; Sanchez-Diaz, I. From Pilot to Policy: Examining the Transition towards Institutionalized Practices in Freight Curbside Management. Transp Policy (Oxf) 2025, 164, 244–254. [Google Scholar] [CrossRef]
- Pinto, R.; Lagorio, A.; Golini, R. The Location and Sizing of Urban Freight Loading/Unloading Lay-by Areas. Int J Prod Res 2019, 57, 83–99. [Google Scholar] [CrossRef]
- Aiura, N.; Taniguchi, E. PLANNING ON-STREET LOADING-UNLOADING SPACES CONSIDERING THE BEHAVIOUR OF PICKUP-DELIVERY VEHICLES.
- Amaya, J.; Encarnación, T.; Delgado-Lindeman, M. Understanding Delivery Drivers’ Parking Preferences in Urban Freight Operations. Transp Res Part A Policy Pract 2023, 176. [Google Scholar] [CrossRef]
- Saki, S.; Hagen, T. Cruising for Parking Again: Measuring the Ground Truth and Using Survival Analysis to Reveal the Determinants of the Duration. Transp Res Part A Policy Pract 2024, 183, 104045. [Google Scholar] [CrossRef]
- Dalla Chiara, G.; Krutein, K.F.; Ranjbari, A.; Goodchild, A. Providing Curb Availability Information to Delivery Drivers Reduces Cruising for Parking. Sci Rep 2022, 12. [Google Scholar] [CrossRef] [PubMed]
- Ezquerro, S.; Moura, J.L.; Alonso, B. Illegal Use of Loading Bays and Its Impact on the Use of Public Space. Sustainability (Switzerland) 2020, 12. [Google Scholar] [CrossRef]
- Castrellon, J.P.; Sanchez-Diaz, I.; Gil, J. Smart Loading Zones. A Data Analytics Approach for Loading Zones Network Design. Transp Res Interdiscip Perspect 2024, 24. [Google Scholar] [CrossRef]
- Vishnoi, S.C.; Simoni, M.D. Surrogate-Based Real-Time Curbside Management for Ride-Hailing and Delivery Operations. Transportmetrica B: Transport Dynamics 2025, 13. [Google Scholar] [CrossRef]
- Viu-Roig, M.; Alvarez-Palau, E.J. The Impact of E-Commerce-Related Last-Mile Logistics on Cities: A Systematic Literature Review. Sustainability 2020, 12, 6492. [Google Scholar] [CrossRef]
- Visser, J.; Nemoto, T.; Browne, M. Home Delivery and the Impacts on Urban Freight Transport: A Review. Procedia Soc Behav Sci 2014, 125, 15–27. [Google Scholar] [CrossRef]
- Alho, A.R.; de Abreu e Silva, J.; de Sousa, J.P.; Blanco, E. Improving Mobility by Optimizing the Number, Location and Usage of Loading/Unloading Bays for Urban Freight Vehicles. Transp Res D Transp Environ 2018, 61, 3–18. [Google Scholar] [CrossRef]
- Comi, A.; Buttarazzi, B.; Schiraldi, M.M.; Innarella, R.; Varisco, M.; Rosati, L. DynaLOAD: A Simulation Framework for Planning, Managing and Controlling Urban Delivery Bays. Proceedings of the Transportation Research Procedia 2017, Vol. 22, 335–344. [Google Scholar] [CrossRef]
- Kalahasthi, L.K.; Sánchez-Díaz, I.; Pablo Castrellon, J.; Gil, J.; Browne, M.; Hayes, S.; Sentís Ros, C. Joint Modeling of Arrivals and Parking Durations for Freight Loading Zones: Potential Applications to Improving Urban Logistics. Transp Res Part A Policy Pract 2022, 166, 307–329. [Google Scholar] [CrossRef]
- Diehl, C.; Ranjbari, A.; Goodchild, A. Curbspace Management Challenges and Opportunities from Public and Private Sector Perspectives. Transportation Research Record: Journal of the Transportation Research Board 2021, 2675, 1413–1427. [Google Scholar] [CrossRef]
- Les, A.; Morella, P.; Lambán, M.P.; Royo, J.; Sánchez, J.C. A New Indicator for Measuring Efficiency in Urban Freight Transportation: Defining and Implementing the OEEM (Overall Equipment Effectiveness for Mobility). Applied Sciences (Switzerland) 2024, 14. [Google Scholar] [CrossRef]
- Comi, A.; Moura, J.L.; Ezquerro, S. A Methodology for Assessing the Urban Supply of On-Street Delivery Bays. Green Energy and Intelligent Transportation 2022, 1. [Google Scholar] [CrossRef]
- Wilson, M.; Janjevic, M.; Winkenbach, M. Modeling a Time-Differentiated Policy for Management of Loading Bays in Urban Areas. Research in Transportation Business and Management 2022, 45. [Google Scholar] [CrossRef]
- Ochoa-Olán, J. de J.; Betanzo-Quezada, E.; Romero-Navarrete, J.A. A Modeling and Micro-Simulation Approach to Estimate the Location, Number and Size of Loading/Unloading Bays: A Case Study in the City of Querétaro, Mexico. Transp Res Interdiscip Perspect 2021, 10. [Google Scholar] [CrossRef]
- Burns, A.J.; Michalek, J.J.; Samaras, C. Estimating the Potential for Optimized Curb Management to Reduce Delivery Vehicle Double Parking, Traffic Congestion and Energy Consumption. Transp Res E Logist Transp Rev 2024, 187, 103574. [Google Scholar] [CrossRef]
- Yu, M.; Bayram, A. Management of the Curb Space Allocation in Urban Transportation System. International Transactions in Operational Research 2021, 28, 2414–2439. [Google Scholar] [CrossRef]
- Tao, T.; Qian, S. Do Smart Loading Zones Help Reduce Traffic Congestion? A Causal Analysis in Pittsburgh. Transp Res E Logist Transp Rev 2024, 192, 103796. [Google Scholar] [CrossRef]
- Liu, J.; Ma, W.; Qian, S. Optimal Curbside Pricing for Managing Ride-Hailing Pick-Ups and Drop-Offs. Transp Res Part C Emerg Technol 2023, 146, 103960. [Google Scholar] [CrossRef]
- Dalla Chiara, G.; Krutein, K.F.; Ranjbari, A.; Goodchild, A. Providing Curb Availability Information to Delivery Drivers Reduces Cruising for Parking. Sci Rep 2022, 12. [Google Scholar] [CrossRef]
- Nourinejad, M.; Gandomi, A.; Roorda, M.J. Illegal Parking and Optimal Enforcement Policies with Search Friction. Transp Res E Logist Transp Rev 2020, 141, 102026. [Google Scholar] [CrossRef]
- Allen, J.; Piecyk, M.; Piotrowska, M.; McLeod, F.; Cherrett, T.; Ghali, K.; Nguyen, T.; Bektas, T.; Bates, O.; Friday, A.; et al. Understanding the Impact of E-Commerce on Last-Mile Light Goods Vehicle Activity in Urban Areas: The Case of London. Transp Res D Transp Environ 2018, 61, 325–338. [Google Scholar] [CrossRef]
- Marsden, G.; Docherty, I.; Dowling, R. Parking Futures: Curbside Management in the Era of ‘New Mobility’ Services in British and Australian Cities. Land use policy 2020, 91, 104012. [Google Scholar] [CrossRef]
- Letnik, T.; Farina, A.; Mencinger, M.; Lupi, M.; Božičnik, S. Dynamic Management of Loading Bays for Energy Efficient Urban Freight Deliveries. Energy 2018, 159, 916–928. [Google Scholar] [CrossRef]
- Gil Gallego, A.; Lambán, M.P.; Royo Sánchez, J.; Sánchez Catalán, J.C.; Morella Avinzano, P. Study and Characterization of New KPIs for Measuring Efficiency in Urban Loading and Unloading Zones Using the OEE (Overall Equipment Effectiveness) Model. Applied Sciences 2025, 15, 7652. [Google Scholar] [CrossRef]
- Ayuntamiento de Zaragoza Ordenanza Municipal Reguladora de La Instalación de Terrazas de Veladores. Área de Servicios Públicos y Movilidad. In Publicado En El Boletín Oficial de La Provincia de Zaragoza (BOPZ).
- Ayuntamiento de Zaragoza Nota de Prensa. Área de Servicios Públicos y Movilidad. Available online: https://www.zaragoza.es/sede/servicio/noticia/317255 (accessed on 10 October 2022).
- Xiao, J.; Lou, Y.; Frisby, J. How Likely Am I to Find Parking? – A Practical Model-Based Framework for Predicting Parking Availability. Transportation Research Part B: Methodological 2018, 112, 19–39. [Google Scholar] [CrossRef]
- Gil Gallego, A.; Lambán Castillo, M.P.; Royo Sánchez, J.; Sánchez Catalán, J.C.; Avinzano, P.M. Evaluation of Loading and Unloading Zones Through Dynamic Occupancy Scenario Simulation Aligned with Municipal Ordinances in Urban Freight Distribution. Applied Sciences 2025, 16, 100. [Google Scholar] [CrossRef]
- Legros, B.; Fransoo, J.C. Admission and Pricing Optimization of On-Street Parking with Delivery Bays. Eur J Oper Res 2024, 312, 138–149. [Google Scholar] [CrossRef]
- Agencia Europea de Medio Ambiente Average-Co2-Emissions-from-New-Cars-and-New-Vans.
- Kaddoussi. Aida Giacomo Vecia Report Investigating the Impacts Caused By Construction Delivery Inefficiencies. 2017-02-17; 2017.
- The Energy and Resources Institute (TERI) Freight Greenhouse Gas Calculator: Methodology Report. Available online: https://www.teriin.org/project/freight-greenhouse-gas-calculator (accessed on 6 January 2026).
Figure 4.
Comparison of scenarios referring to vehicle arrivals and their activity.
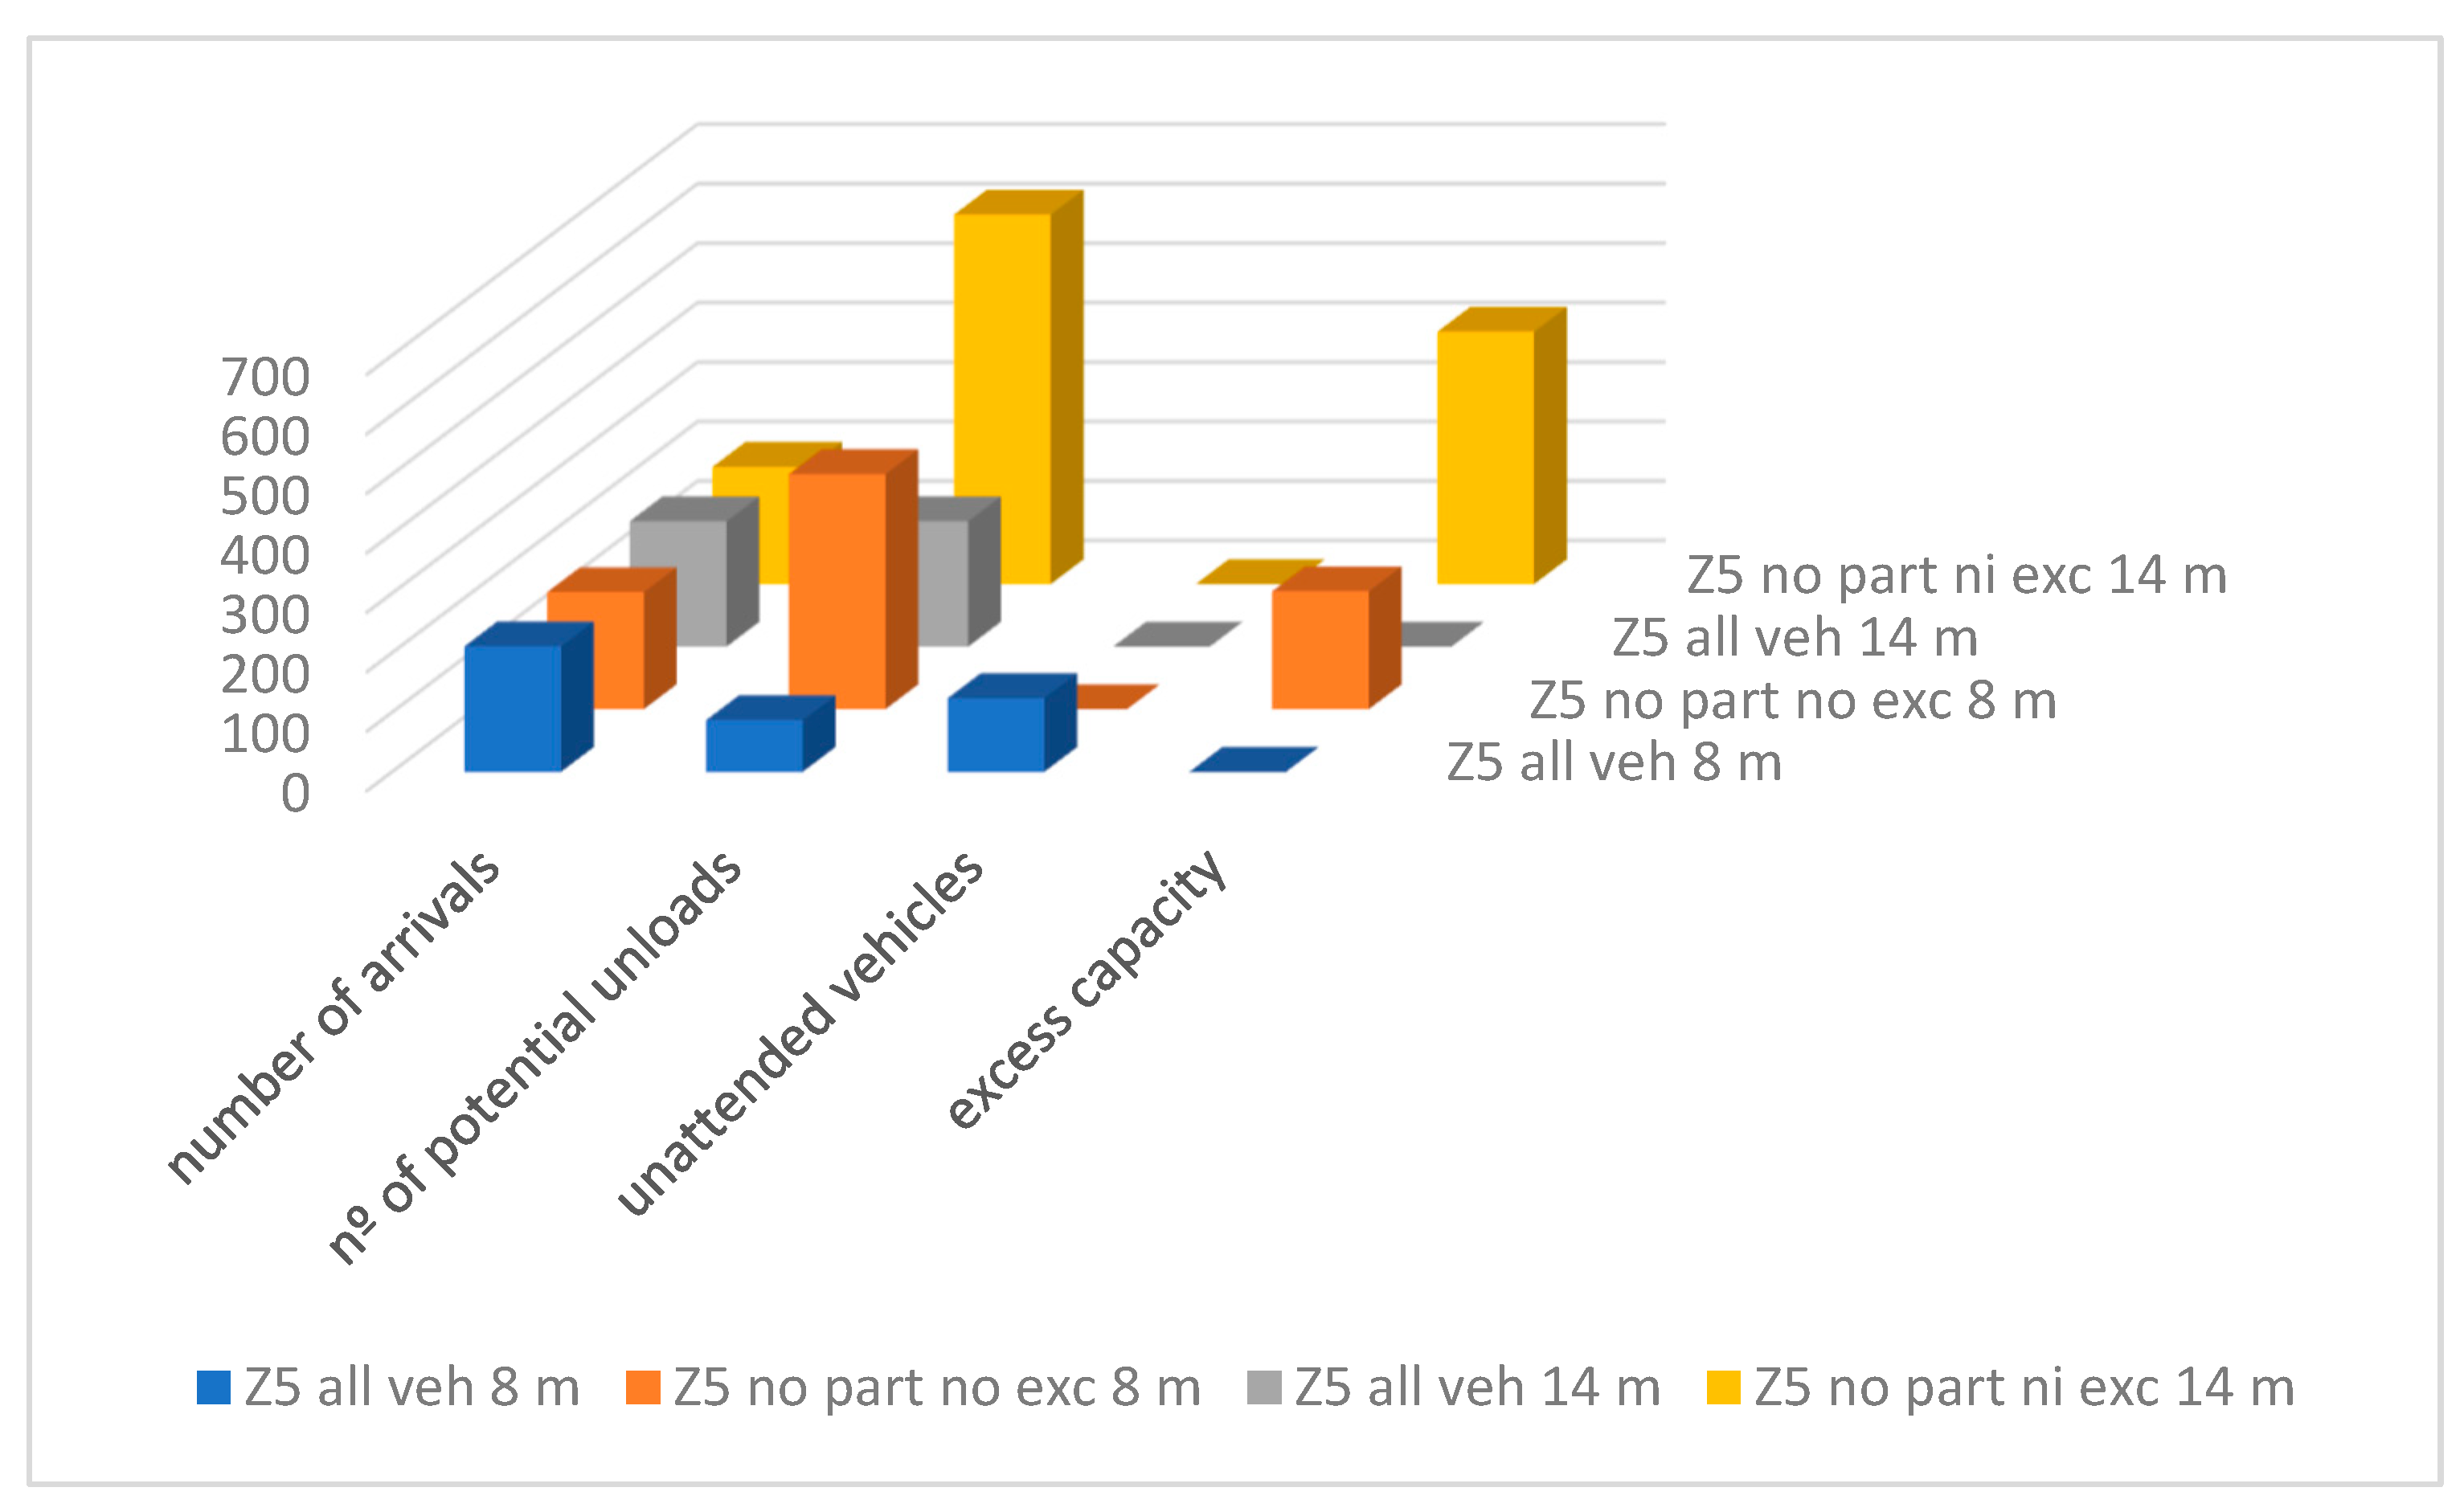
Figure 5.
Arrival, service and traffic intensity rates.
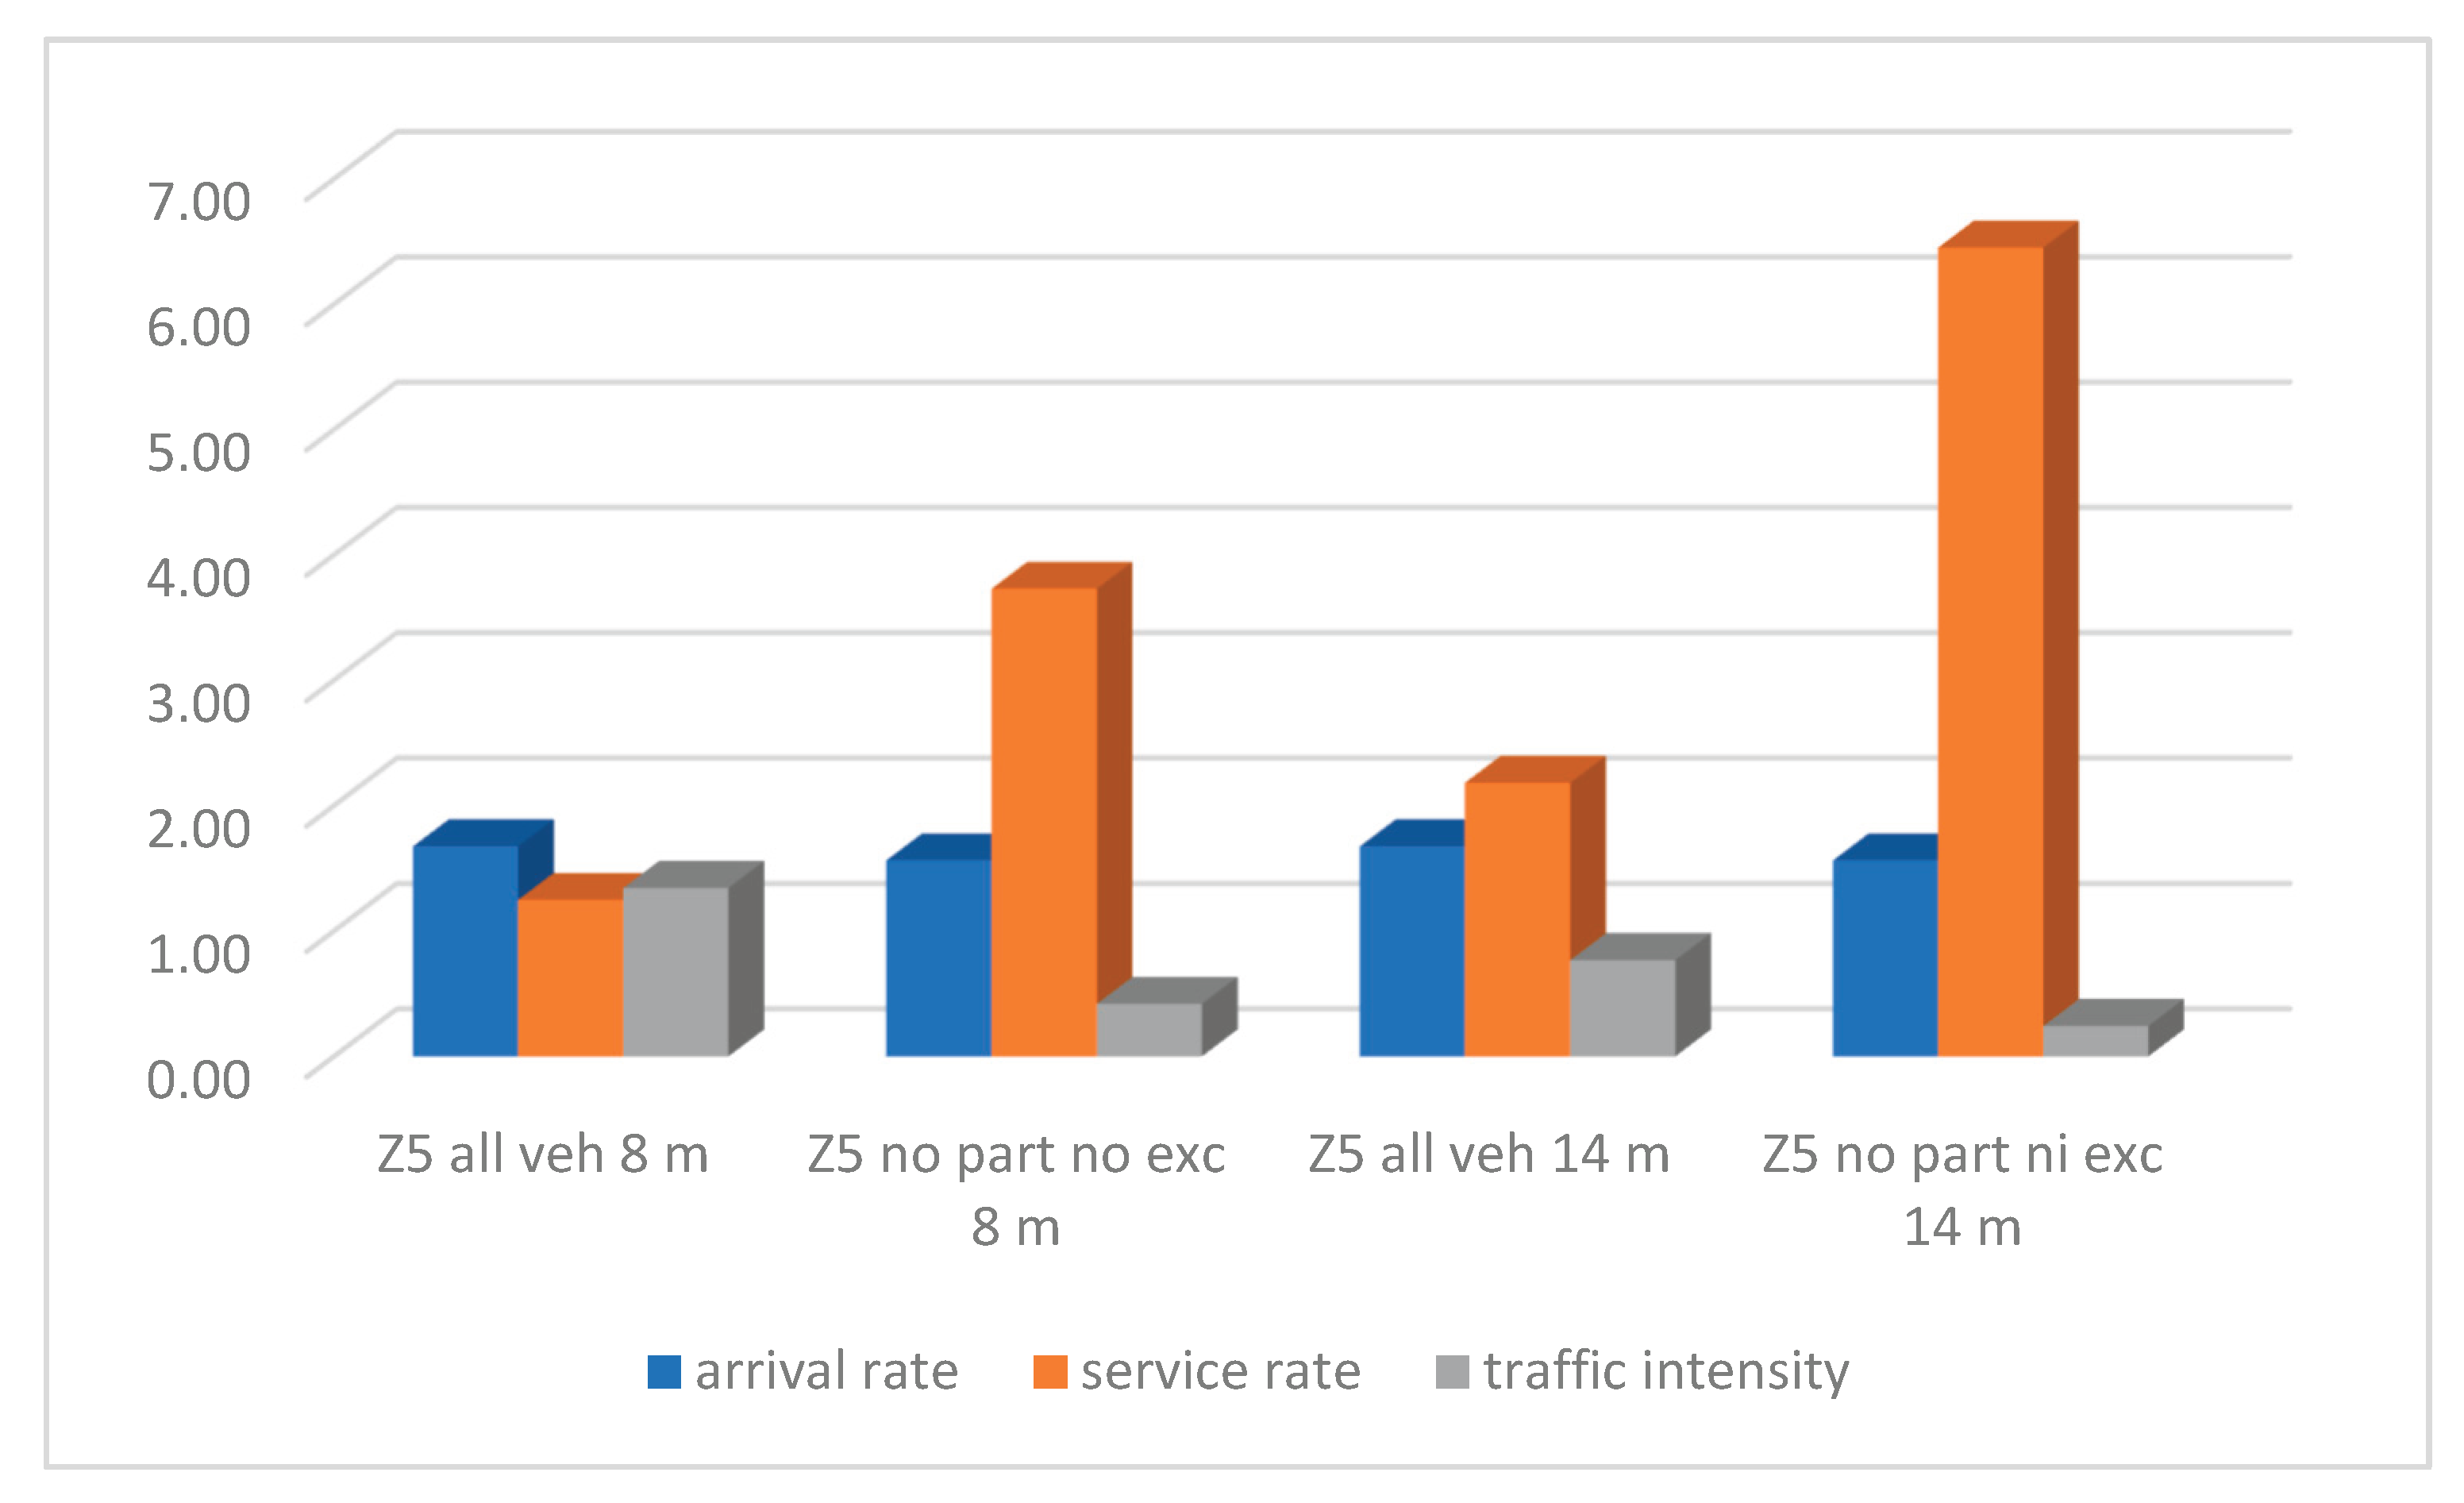
Figure 6.
Effective curbside and HCE effect.
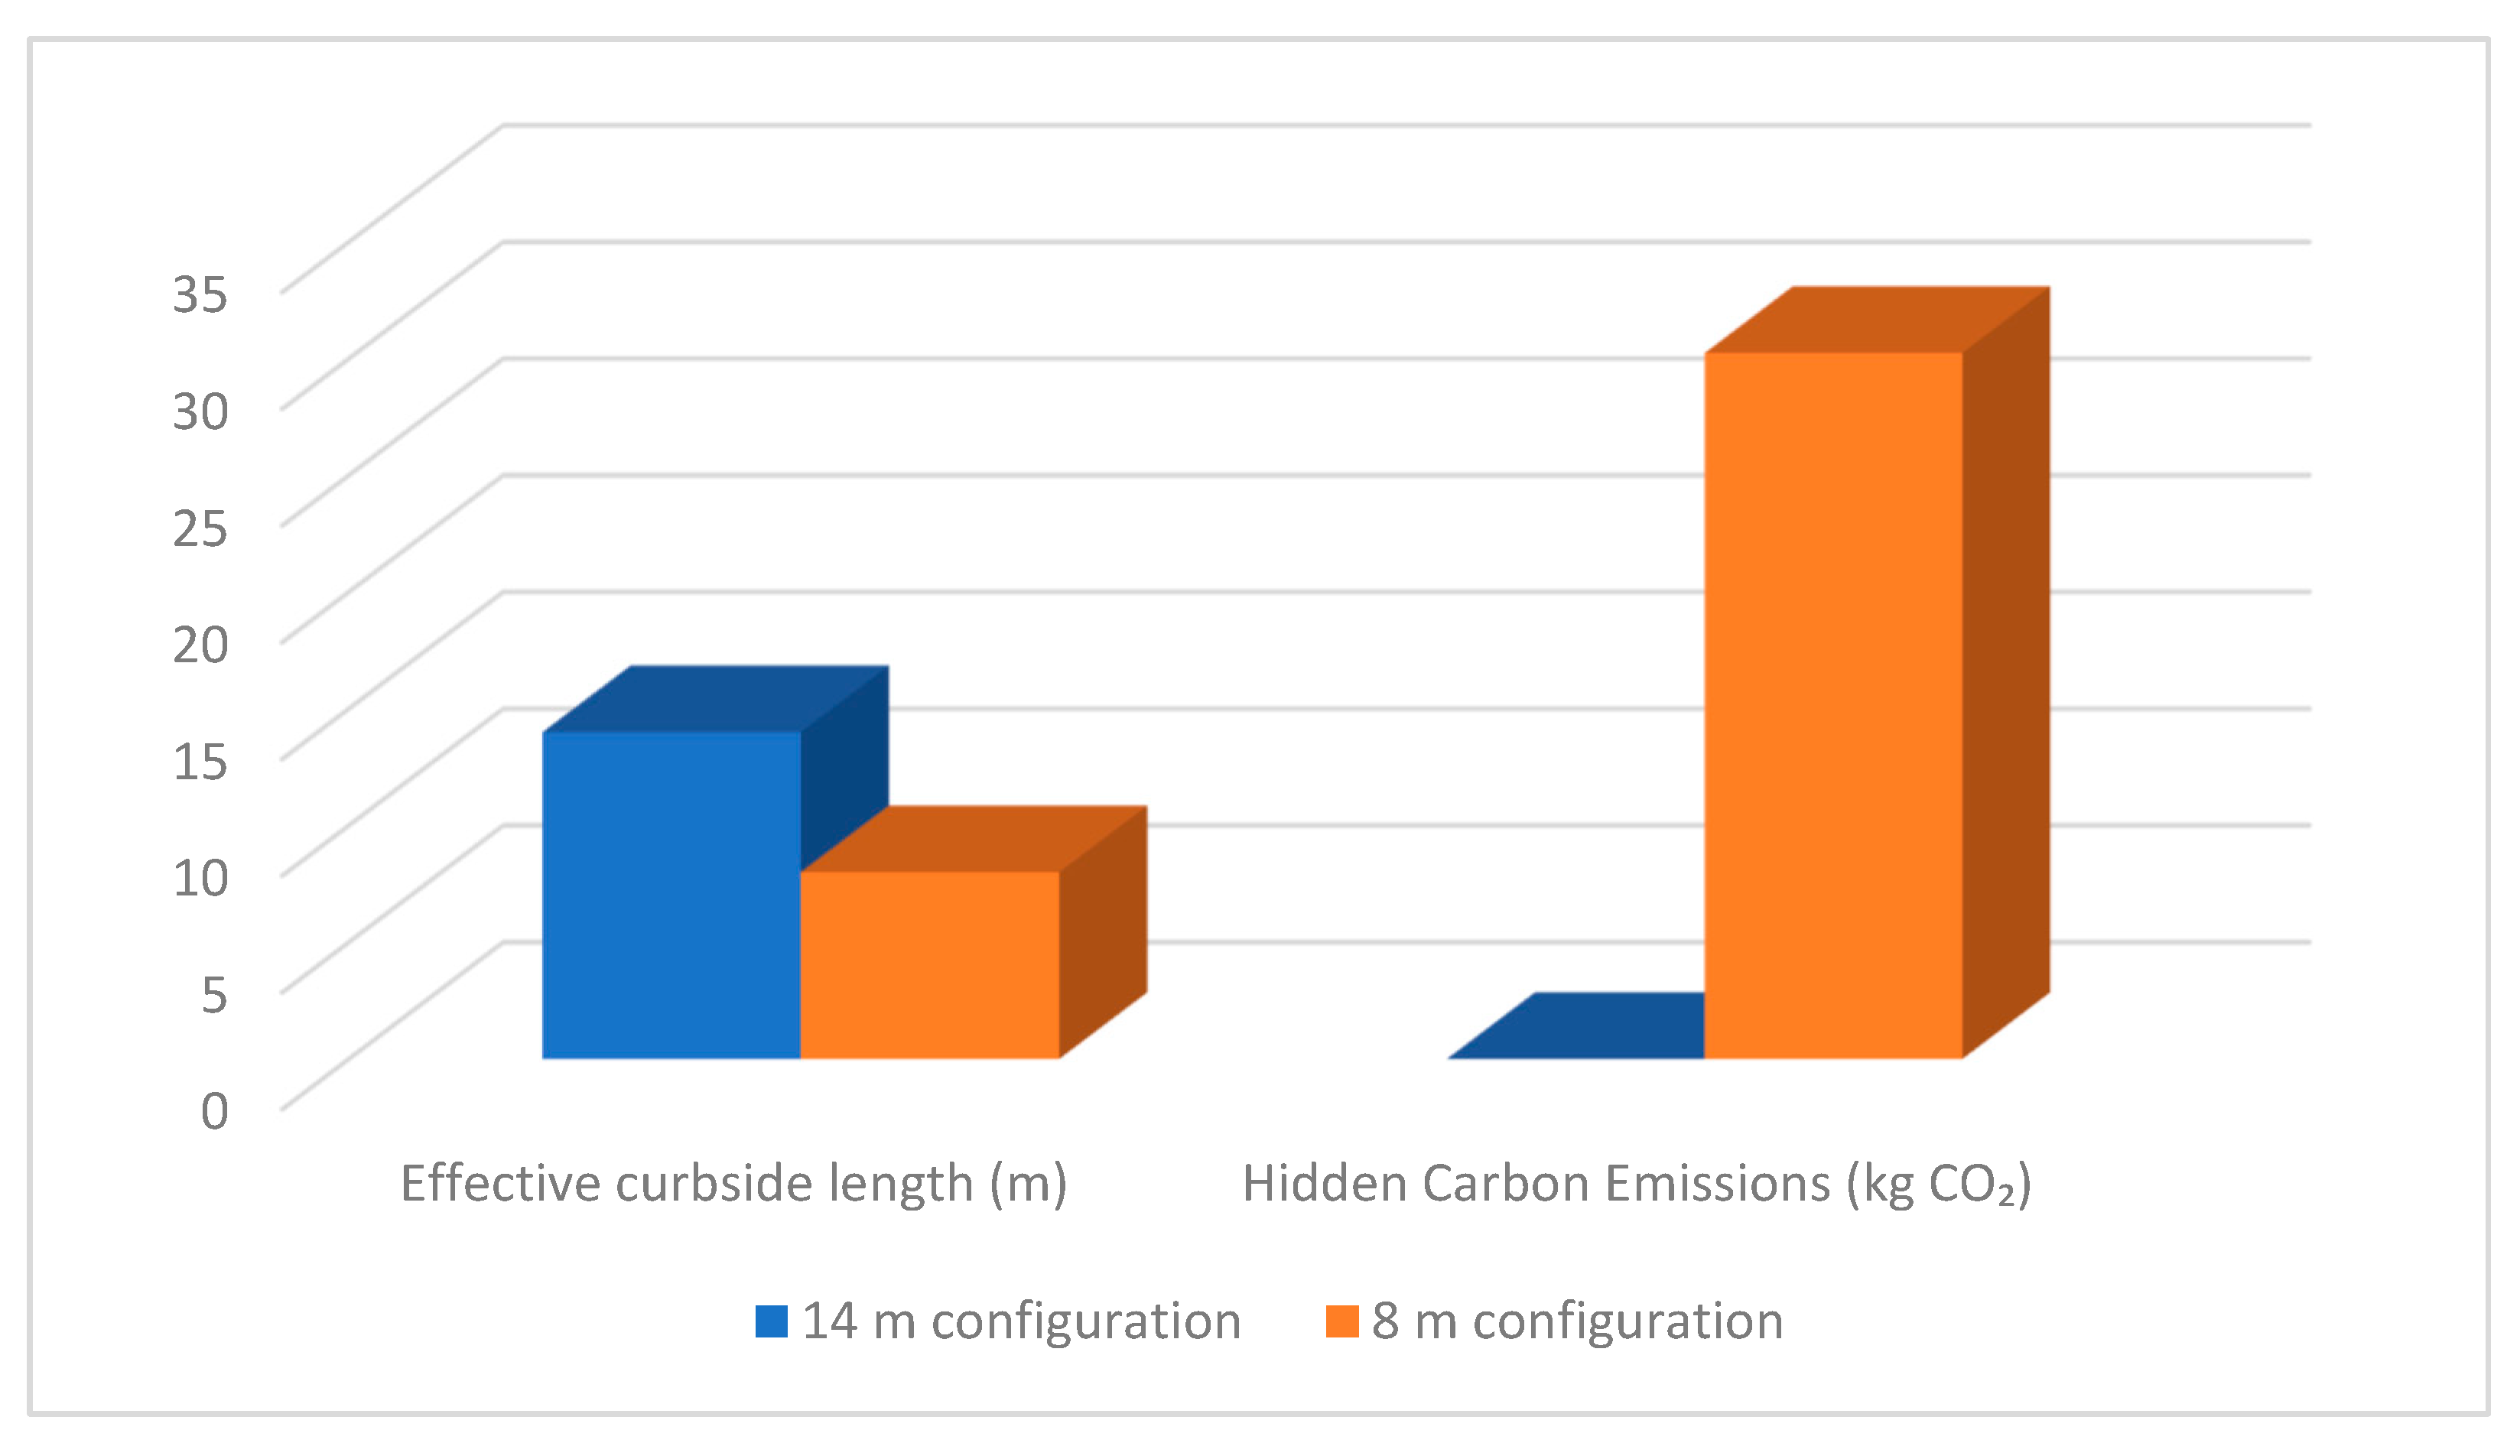
Table 1.
Weighted occupancy time by vehicle type.
| Vehicle Type | n° | % | tp | Global |
|---|---|---|---|---|
| Light Truck 7.5 Tn | 21 | 1.66% | 13.80 | 0.23 |
| Chassis Cab 3.5 Tn | 148 | 11.70% | 11.23 | 1.31 |
| Large Volume Van | 94 | 7.43% | 10.83 | 0.80 |
| Small Van | 481 | 38.02% | 8.58 | 3.26 |
| Delivery Van | 521 | 41.19% | 9.08 | 3.74 |
| Total | 1.265 | 9.35 |
Table 3.
Comparison of scenarios referring to vehicle arrivals and their activity.
| number of arrivals | nº of potential unloads | unattended vehicles | excess capacity | |
| Z5 all veh 8 m | 211 | 87 | 124 | 0 |
| Z5 no part no exc 8 m | 197 | 395 | 0 | 198 |
| Z5 all veh 14 m | 211 | 211 | 0 | 0 |
| Z5 no part ni exc 14 m | 197 | 621 | 0 | 424 |
Table 4.
Arrival, service and traffic intensity rates.
| arrival rate | service rate | traffic intensity | |
| Z5 all veh 8 m | 1,67 | 1,25 | 1,34 |
| Z5 no part no exc 8 m | 1,56 | 3,73 | 0,42 |
| Z5 all veh 14 m | 1,67 | 2,18 | 0,77 |
| Z5 no part ni exc 14 m | 1,56 | 6,45 | 0,24 |
Disclaimer/Publisher’s Note: The statements, opinions and data contained in all publications are solely those of the individual author(s) and contributor(s) and not of MDPI and/or the editor(s). MDPI and/or the editor(s) disclaim responsibility for any injury to people or property resulting from any ideas, methods, instructions or products referred to in the content. |
© 2026 by the authors. Licensee MDPI, Basel, Switzerland. This article is an open access article distributed under the terms and conditions of the Creative Commons Attribution (CC BY) license (http://creativecommons.org/licenses/by/4.0/).
Copyright: This open access article is published under a Creative Commons CC BY 4.0 license, which permit the free download, distribution, and reuse, provided that the author and preprint are cited in any reuse.


