Submitted:
04 February 2026
Posted:
05 February 2026
You are already at the latest version
Abstract
This study presents an Augmented Reality (AR) educational installation designed to improve public awareness of invasive beetle species. The system combines a physical dodecahedron structure with interactive AR visualizations created in Unity. Each face of the dodecahedron displays information about different invasive species, while users can scan the panels to view 3D beetle models and animations in AR. The dodecahedron structure naturally draws attention, encourages curiosity, and promotes hands-on interaction across different age groups. To evaluate usability and engagement, a questionnaire with ten Likert-scale questions was prepared, focusing on visual appeal, interactivity, realism, and educational values. Data collection is currently ongoing, and the analysis will determine how AR and tangible design together can increase interest and knowledge retention. The goal of this project is to demonstrate that combining physical exhibits with AR content can create accessible and immersive learning experiences in visitor centers and educational environments. This approach aims to make scientific topics, such as invasive species, more understandable and engaging for the public.
Keywords:
augmented reality
; informal learning
; STEM education
; environmental sustainability
; public science communication
; interactive exhibits
; place-based learning
1. Introduction
Invasive species pose significant ecological and economic challenges, making public awareness and education critical components of prevention and mitigation strategies. Visitor centers, outreach events, and informal learning environments provide valuable opportunities to engage the public; however, traditional static displays often struggle to capture attention or convey complex ecological dynamics effectively. Augmented reality (AR) has emerged as a promising approach for enhancing informal learning by combining interactive digital content with physical artifacts, allowing users to visualize complex systems, explore cause–effect relationships, and engage with educational material in an immersive manner [1,2,3].
In this study, the AR Station refers to the physical dodecahedron-based exhibit deployed in outreach settings, while the AR application refers to the tablet-based augmented reality software used to interact with the station. To support invasive species outreach, a physical “AR Station” was developed that integrates a dodecahedron-shaped device with an AR experience featuring three-dimensional models, interactive elements, and simulation-based content related to invasive species impacts. The design emphasizes intuitive interaction, visual appeal, and immersion, with the goal of increasing user engagement while improving understanding of the ecological consequences of invasive species and the importance of public awareness as shown in Figure 1 [4,5,6].
The purpose of this study is to evaluate user perceptions of the AR Station and to identify the design factors that contribute most strongly to its outreach effectiveness. Specifically, this work examines how users rate the usability of the interface, the level of engagement and immersion provided by the experience, and the perceived educational value of the AR content. In addition, the study investigates whether these perceptions vary across different visitor groups interacting with the AR Station under varying deployment conditions. Finally, the analysis explores which aspects of the user experience—such as immersion, realism of the AR models, and perceived usefulness of the data and simulation components—are most strongly associated with users’ willingness to tell others about invasive species and the AR application, a key indicator of outreach amplification. Prior work has shown that immersive AR and VR experiences can positively influence motivation, engagement, and spatial understanding, suggesting that well-designed AR systems may enhance outreach effectiveness in informal learning contexts [4,7,8].
2. Materials and Methods
2.1. Participants and Data Collection
Data for this study were collected using a post-experience survey administered to participants after they interacted with the AR Station. The AR Station was deployed in an informal outreach setting, where visitors were invited to explore the augmented reality content independently or with minimal facilitation as seen in Figure 2. Participants interacted with the AR Station by using a tablet running the AR application, which overlaid digital content onto the physical exhibit. Upon completion of the experience, participants were asked to complete a brief anonymous survey evaluating their interaction with the system.
A total of 238 valid survey responses were collected across six distinct visitor groups, reflecting different deployment sessions or audience cohorts. Group sizes varied, with Group 2 contributing 87 responses, Group 3 contributing 39 responses, Group 1 contributing 37 responses, Group 4 contributing 34 responses, Group 5 contributing 22 responses, and Group 6 contributing 18 responses. One respondent did not specify a group affiliation and was included in aggregate analyses but excluded from group-based comparisons.
The survey instrument consisted of ten Likert-scale items rated on a five-point scale, where higher values indicated more positive perceptions. Likert-scale survey instruments are commonly used in user experience and educational technology research; however, such data are ordinal in nature and require appropriate analytical treatment [9].The items assessed multiple aspects of the AR Station experience, including interface intuitiveness, engagement, visual appeal of the device, perceived impact of invasive species, importance of public awareness, realism of the AR models, usefulness of the dodecahedron form factor, usefulness of the data or simulation components, overall immersion, and likelihood of telling others about invasive species and the AR application. An optional open-ended comment field was included to capture qualitative feedback and suggestions for improvement.
All responses were collected electronically and exported to a spreadsheet format for analysis. No personally identifiable information was recorded, and participation was voluntary. The study design focused on capturing immediate user perceptions following interaction with the AR Station to evaluate usability, engagement, and perceived outreach effectiveness in a realistic deployment context.
2.2. Data Collection and Analysis
User perceptions of the AR Station were measured using a structured post-experience survey consisting of ten statements rated on a five-point Likert scale, where a rating of 1 indicated the lowest level of agreement and a rating of 5 indicated the highest as seen in Figure 3. The survey items were designed to capture key dimensions of the AR Station experience, including the intuitiveness of the user interface, overall engagement, visual appeal of the physical device, perceived ecological impact of invasive species, perceived importance of public awareness, realism of the augmented reality models, usefulness of the dodecahedron form factor, usefulness of the data or simulation components, overall immersion, and participants’ likelihood of telling others about invasive species and the AR application. In addition to the quantitative items, participants were given the option to provide open-ended comments to share qualitative feedback, observations, or suggestions for improvement.
Survey responses were exported to a spreadsheet format and analyzed using standard statistical techniques appropriate for ordinal data and exploratory evaluation studies. Descriptive statistics, including means and standard deviations, were calculated for each survey item to summarize overall user perceptions. The internal consistency of the survey instrument was assessed using Cronbach’s alpha to evaluate whether the set of items reliably measured a cohesive user experience construct.
To examine the underlying structure of the survey, principal component analysis (PCA) was conducted to determine whether the items reflected a dominant overall experience factor or multiple distinct dimensions. Differences in user perceptions across visitor groups were evaluated using the Kruskal–Wallis test, which is well suited for Likert-scale data and does not assume normality. When statistically significant group effects were identified, post-hoc pairwise comparisons were performed to explore which groups differed meaningfully from one another.
Finally, to investigate which aspects of the AR Station experience were most strongly associated with outreach amplification, predictive modeling was performed using ordinary least squares regression. In this analysis, participants’ likelihood of telling others about invasive species and the AR application served as the outcome variable, while selected experience-related survey items were used as predictors. Although Likert-scale data impose limitations on strict causal interpretation, the regression analysis was used to identify directional relationships and to highlight experience factors with the greatest practical influence on users’ willingness to share the experience.
3. Results
3.1. Descriptive Outcomes
Overall, participants rated the AR Station very positively across all measured dimensions. Mean ratings for the ten survey items ranged from 4.50 to 4.77 on a five-point scale, indicating consistently high levels of perceived usability, engagement, and educational value.
As summarized in Table 1, participants reported that the interface controls were intuitive (M = 4.769, SD = 0.560), the interaction was engaging (M = 4.710, SD = 0.626), and the physical device was visually appealing (M = 4.735, SD = 0.631). Ratings related to learning and awareness were similarly high, including perceived impact of invasive species (M = 4.697, SD = 0.657) and the importance of public awareness (M = 4.752, SD = 0.604).
Items associated with the AR experience itself also received strong evaluations. Participants rated the realism of the AR models (M = 4.609, SD = 0.725), the usefulness of the dodecahedron form factor (M = 4.655, SD = 0.655), and the usefulness of the data or simulation components (M = 4.718, SD = 0.610) highly. Overall immersion received a mean rating of 4.576 (SD = 0.822), while participants’ likelihood of telling others about invasive species and the AR application had a mean of 4.500 (SD = 0.889). Among all items, immersion and likelihood to tell others exhibited the greatest variability, suggesting greater differentiation among participants for these outcomes compared to other measures.
3.2. Reliability and Dimensionality
The ten Likert-scale items demonstrated excellent internal consistency, with a Cronbach’s alpha of 0.913 (Table 2), indicating that the instrument reliably captured a cohesive perception of the AR Station experience. The internal consistency of the survey instrument was assessed using Cronbach’s alpha, a widely accepted measure for evaluating the reliability of multi-item scales [10].To further examine the underlying structure of the survey, principal component analysis was conducted. Results indicated a dominant first principal component accounting for approximately 57% of the total variance, consistent with the presence of a strong overall positive experience or perceived impact factor rather than multiple unrelated constructs.
3.3. Group Comparisons
Differences in user perceptions across visitor groups were examined using the Kruskal–Wallis test. Statistically significant group effects were observed for perceived intuitiveness of the user interface (χ²(5) = 22.57, p < .001) and likelihood of telling others about the AR application and invasive species (χ²(5) = 13.51, p = .019). For interface intuitiveness, Group 6 reported the lowest mean rating (M = 4.28), while several other groups reported higher means, including Group 3 (M = 4.90) and Group 1 (M = 4.84). Post-hoc pairwise comparisons with correction indicated that Group 6 differed most clearly from Groups 1 through 3 on this measure. No statistically significant differences were detected for the remaining survey items (p > .05), though several measures exhibited trend-level effects. The Kruskal–Wallis test was selected because it does not assume normality and is appropriate for ordinal Likert-scale data when comparing multiple independent groups [11]. Principal component analysis is commonly used to explore whether survey instruments reflect a dominant underlying construct or multiple dimensions in exploratory evaluation studies [12].

Table 3.
Kruskal-Wallis analysis of survey items by AR Station group.
| Item | χ² (H) | df | p-value | Interpretation |
|---|---|---|---|---|
| Q1 – Intuitive interface controls | 22.567 | 5 | < .001 | Significant |
| Q2 – Engagement | 3.848 | 5 | .572 | n.s. |
| Q3 – Visual appeal | 9.482 | 5 | .091 | n.s. (trend) |
| Q4 – Perceived invasive species impact | 2.808 | 5 | .730 | n.s. |
| Q5 – Importance of public awareness | 9.592 | 5 | .088 | n.s. (trend) |
| Q6 – AR model realism | 6.100 | 5 | .297 | n.s. |
| Q7 – Dodecahedron usefulness | 9.747 | 5 | .083 | n.s. (trend) |
| Q8 – Data / simulation usefulness | 7.508 | 5 | .186 | n.s. |
| Q9 – Immersion | 7.977 | 5 | .158 | n.s. |
| Q10 – Likelihood to tell others | 13.505 | 5 | .019 | Significant |
Note: n.s. = not significant. Trend indicates .05≤ p ≤.10.
Statistically significant group differences were observed for perceived intuitiveness of the interface (χ²(5) = 22.57, p < .001) and likelihood of telling others about the AR application (χ²(5) = 13.51, p = .019). No statistically significant differences were detected for the remaining survey items (p > .05), though several measures exhibited trend-level effects
These differences suggest that contextual factors such as facilitation style, crowding, device availability, or brief variations in onboarding or instruction across deployment sessions may influence perceived usability. Importantly, these findings point to actionable opportunities for improving consistency in future deployments through standardized onboarding and facilitation practices.
3.4. Drivers of Willingness to Tell Others
To identify experience factors most strongly associated with outreach amplification, correlations and regression analyses were conducted using participants’ likelihood of telling others as the outcome variable. Prior research has demonstrated that immersion, realism, and meaningful interaction are key drivers of engagement and learning outcomes in immersive technologies [8,13]. Spearman correlation analysis revealed strong positive associations between willingness to tell others and several experience-related measures, particularly overall immersion (ρ = 0.687), usefulness of the data or simulation components (ρ = 0.563), usefulness of the dodecahedron form factor (ρ = 0.555), and realism of the AR models (ρ = 0.551).
A multiple regression model using key experience variables to predict willingness to tell others explained a substantial portion of the variance (R² = 0.509). Within this model, immersion emerged as the strongest predictor (β = 0.368, p < 0.001), followed by model realism (β = 0.331, p < 0.001) and perceived usefulness of the data or simulation components (β = 0.235, p = 0.011). These results indicate that participants were more likely to share the experience when the AR interaction felt immersive, visually and behaviorally realistic, and supported by meaningful informational or simulation content.
4. Discussion
The results of this study indicate that the AR Station effectively achieved its primary goals of usability, engagement, and educational outreach. Participants consistently rated the interface controls as intuitive, the interaction as engaging, and the physical device as visually appealing.
These uniformly high ratings suggest that users were able to interact with the system with minimal friction, allowing them to focus on the content rather than on learning how to operate the technology. Moreover, the high rating for the perceived importance of public awareness of invasive species underscores that the AR Station successfully aligns technological novelty with a meaningful educational mission, rather than being perceived as technology deployed for its own sake. This alignment is critical for outreach-oriented applications, where sustained attention and message retention are central objectives.
Beyond overall satisfaction, the modeling results provide insight into which aspects of the experience most strongly influence users’ willingness to share the information with others. Immersion emerged as the most influential factor, followed closely by the realism of the AR models and the perceived usefulness of the data or simulation components. These findings suggest that outreach effectiveness is maximized when users feel absorbed in the experience, perceive the virtual content as realistic and credible, and clearly understand how the interactive data or simulations contribute to learning. Design efforts that prioritize immersion and realism are therefore likely to yield the greatest gains in outreach amplification.
Several specific design implications emerge from these findings. Reducing interaction friction—such as improving tracking stability, minimizing load times, and shortening the path to the initial “wow” moment—can enhance immersion and sustain user engagement. Incorporating short narrative sequences that guide users through stages of observation, identification, impact, and action may further strengthen the educational arc of the experience. Improvements to model fidelity, including enhanced lighting, shadows, scale cues, and animation, can increase perceived realism and reinforce user trust in the content. In addition, making the value of the data or simulation components more explicit through concise visual callouts or a brief summary panel at the conclusion of the experience may help users better articulate what they learned and why it matters, thereby increasing their likelihood of sharing the experience with others.
The group-level differences observed in perceived interface intuitiveness and willingness to tell others highlight the importance of consistent deployment practices. Variations in facilitation, onboarding, crowding, or device availability may influence user perceptions even when the underlying technology remains the same. Providing a standardized onboarding script or clearly visible instructional signage, along with tracking facilitator presence and approximate time-on-task, may help reduce variability across deployments and improve consistency in user experience.
Several limitations of this study should be acknowledged. The high overall ratings across most survey items indicate the presence of a ceiling effect, which may limit sensitivity to smaller differences among participants or design variations. Additionally, the evaluation was conducted using a single instrument in a specific deployment context, and future studies involving additional sites and audiences are needed to establish broader generalizability. Finally, the results rely on self-reported perceptions rather than objective performance or learning measures. Future work could strengthen evaluation by incorporating behavioral metrics such as time-on-task, interaction completion rates, or pre- and post-experience knowledge assessments to complement subjective user feedback. These findings align with prior AR and MR research demonstrating that immersive, well-designed interactive systems can improve engagement, learning, and user motivation across educational and training contexts [3,5,6]. This reinforces theoretical frameworks that emphasize immersion and presence as central mechanisms through which virtual and augmented environments influence user behavior and learning [8,13].
5. Conclusions
This evaluation demonstrates that a dodecahedron-based AR Station can achieve strong usability and engagement while supporting invasive species outreach objectives. Survey results from 238 participants showed consistently high ratings and excellent instrument reliability. Group comparisons indicate that session-level implementation factors can measurably affect perceived intuitiveness and willingness to share. Most importantly, immersion, AR model realism, and perceived usefulness of the data/simulation are key drivers of “tell others, “Offering clear priorities for iterative improvement and scaling to visitor-center deployments.:
Acknowledgments
This work was supported by the United States Department of Agriculture, Animal and Plant Health Inspection Service (USDA/APHIS), with additional support from Sam Houston State University. The authors acknowledge the contributions of student research assistants and collaborating partner sites that supported fabrication, testing, and applied deployment activities.
References
- Azuma RT. A Survey of Augmented Reality. Presence: Teleoperators & Virtual Environments. 1997;6(4):355-385. [CrossRef]
- Dede C. The Role of Digital Technologies in Deeper Learning. Jobs for the Future; 2014. https://files.eric.ed.gov/fulltext/ED561254.pdf.
- Ibáñez MB, Delgado-Kloos C. Augmented reality for STEM learning: A systematic review. Computers & Education. 2018;123:109-123. [CrossRef]
- Dakeev U. Innovative Augmented Reality (AR) Application for Effective Utilization of Hazard Communication Pictograms. Technology Interface International Journal. 2020;2(1).
- Dakeev U, Pecen R, Yildiz F, Aljaroudi A. A novel Augmented Reality application for a Mobile Renewable Trailer as an Emergency Response. Published online 2020:9.
- Dakeev U, Pecen R, Yildiz F, Sowell L, Obeidat S, Basith I. Development of Virtual Reality Robotics Laboratory Simulation. In: ASEE Zone IV Conference; 2022. 2022. https://aseezoneiv2022.engineering.ubc.ca/.
- Dakeev U, Clint E, Pecen R, Yildiz F. Effect of an Augmented Reality Tool in Early Student Motivation and Engagement. In: 2020 CIEC Proceedings. ASEE Conferences; 2021:38705. [CrossRef]
- Makransky G, Andreasen NK, Baceviciute S, Mayer RE. Immersive virtual reality increases liking but not learning with a science simulation and generative learning strategies promote learning in immersive virtual reality. Journal of Educational Psychology. 2021;113(4):719-735. [CrossRef]
- Lionello M, Aletta F, Mitchell A, Kang J. Introducing a Method for Intervals Correction on Multiple Likert Scales: A Case Study on an Urban Soundscape Data Collection Instrument. Front Psychol. 2021;11:602831. [CrossRef]
- Cronbach LJ. Coefficient Alpha and the Internal Structure of Tests. Psychometrika. 1951;16(3):297-334. [CrossRef]
- Kruskal WH, Wallis WA. Use of Ranks in One-Criterion Variance Analysis. Journal of the American Statistical Association. 1952;47(260):583-621. [CrossRef]
- Sam AH, Field SM, Collares CF, et al. Very-short-answer questions: reliability, discrimination and acceptability. Medical Education. 2018;52(4):447-455. [CrossRef]
- Slater M, Wilbur S. A Framework for Immersive Virtual Environments (FIVE): Speculations on the Role of Presence in Virtual Environments. Presence: Teleoperators & Virtual Environments. 1997;6(6):603-616. [CrossRef]
Figure 1.
AR Application interaction with invasive species information.
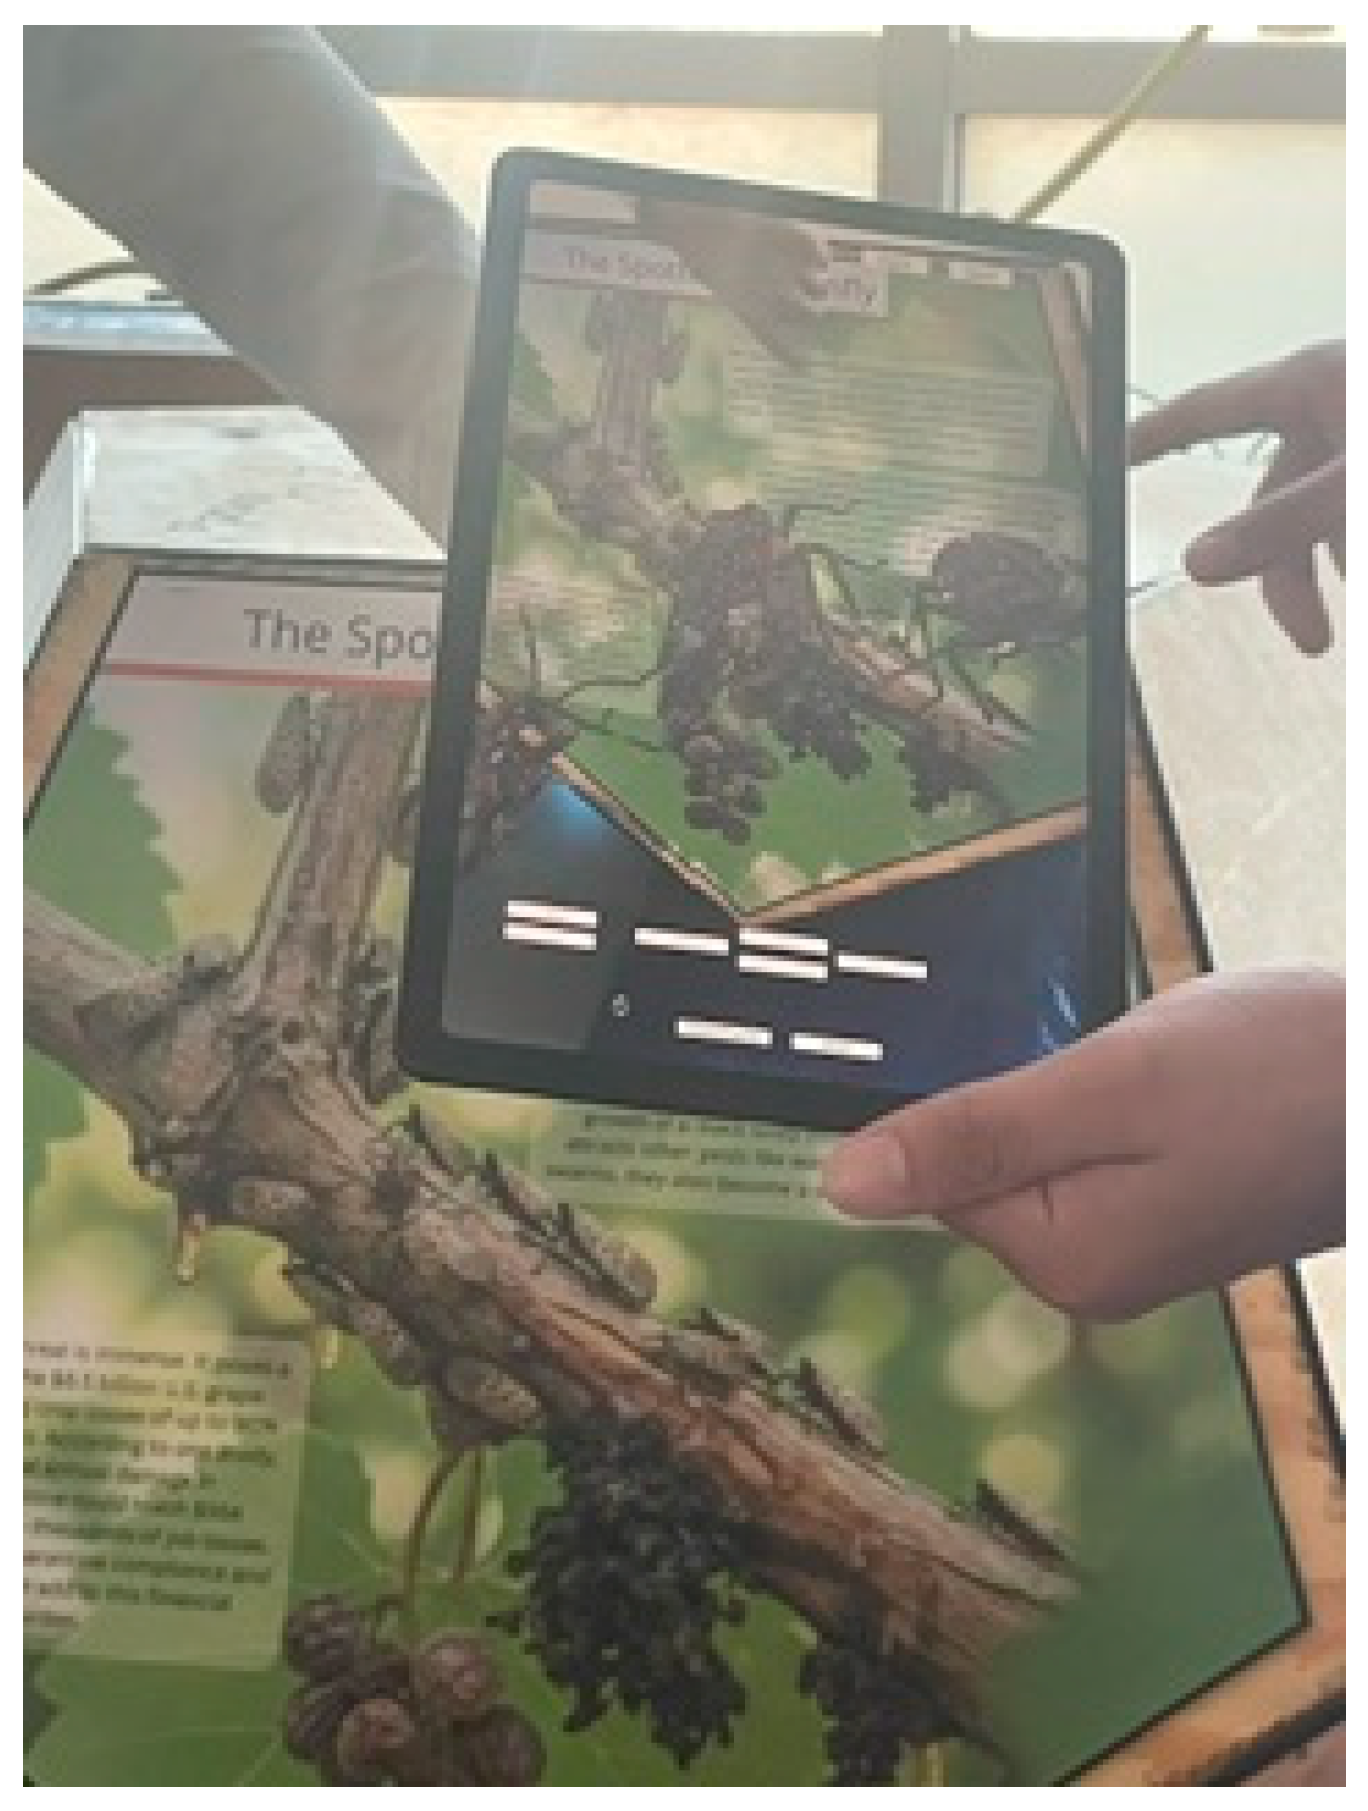
Figure 2.
Student Interaction with the campus community.
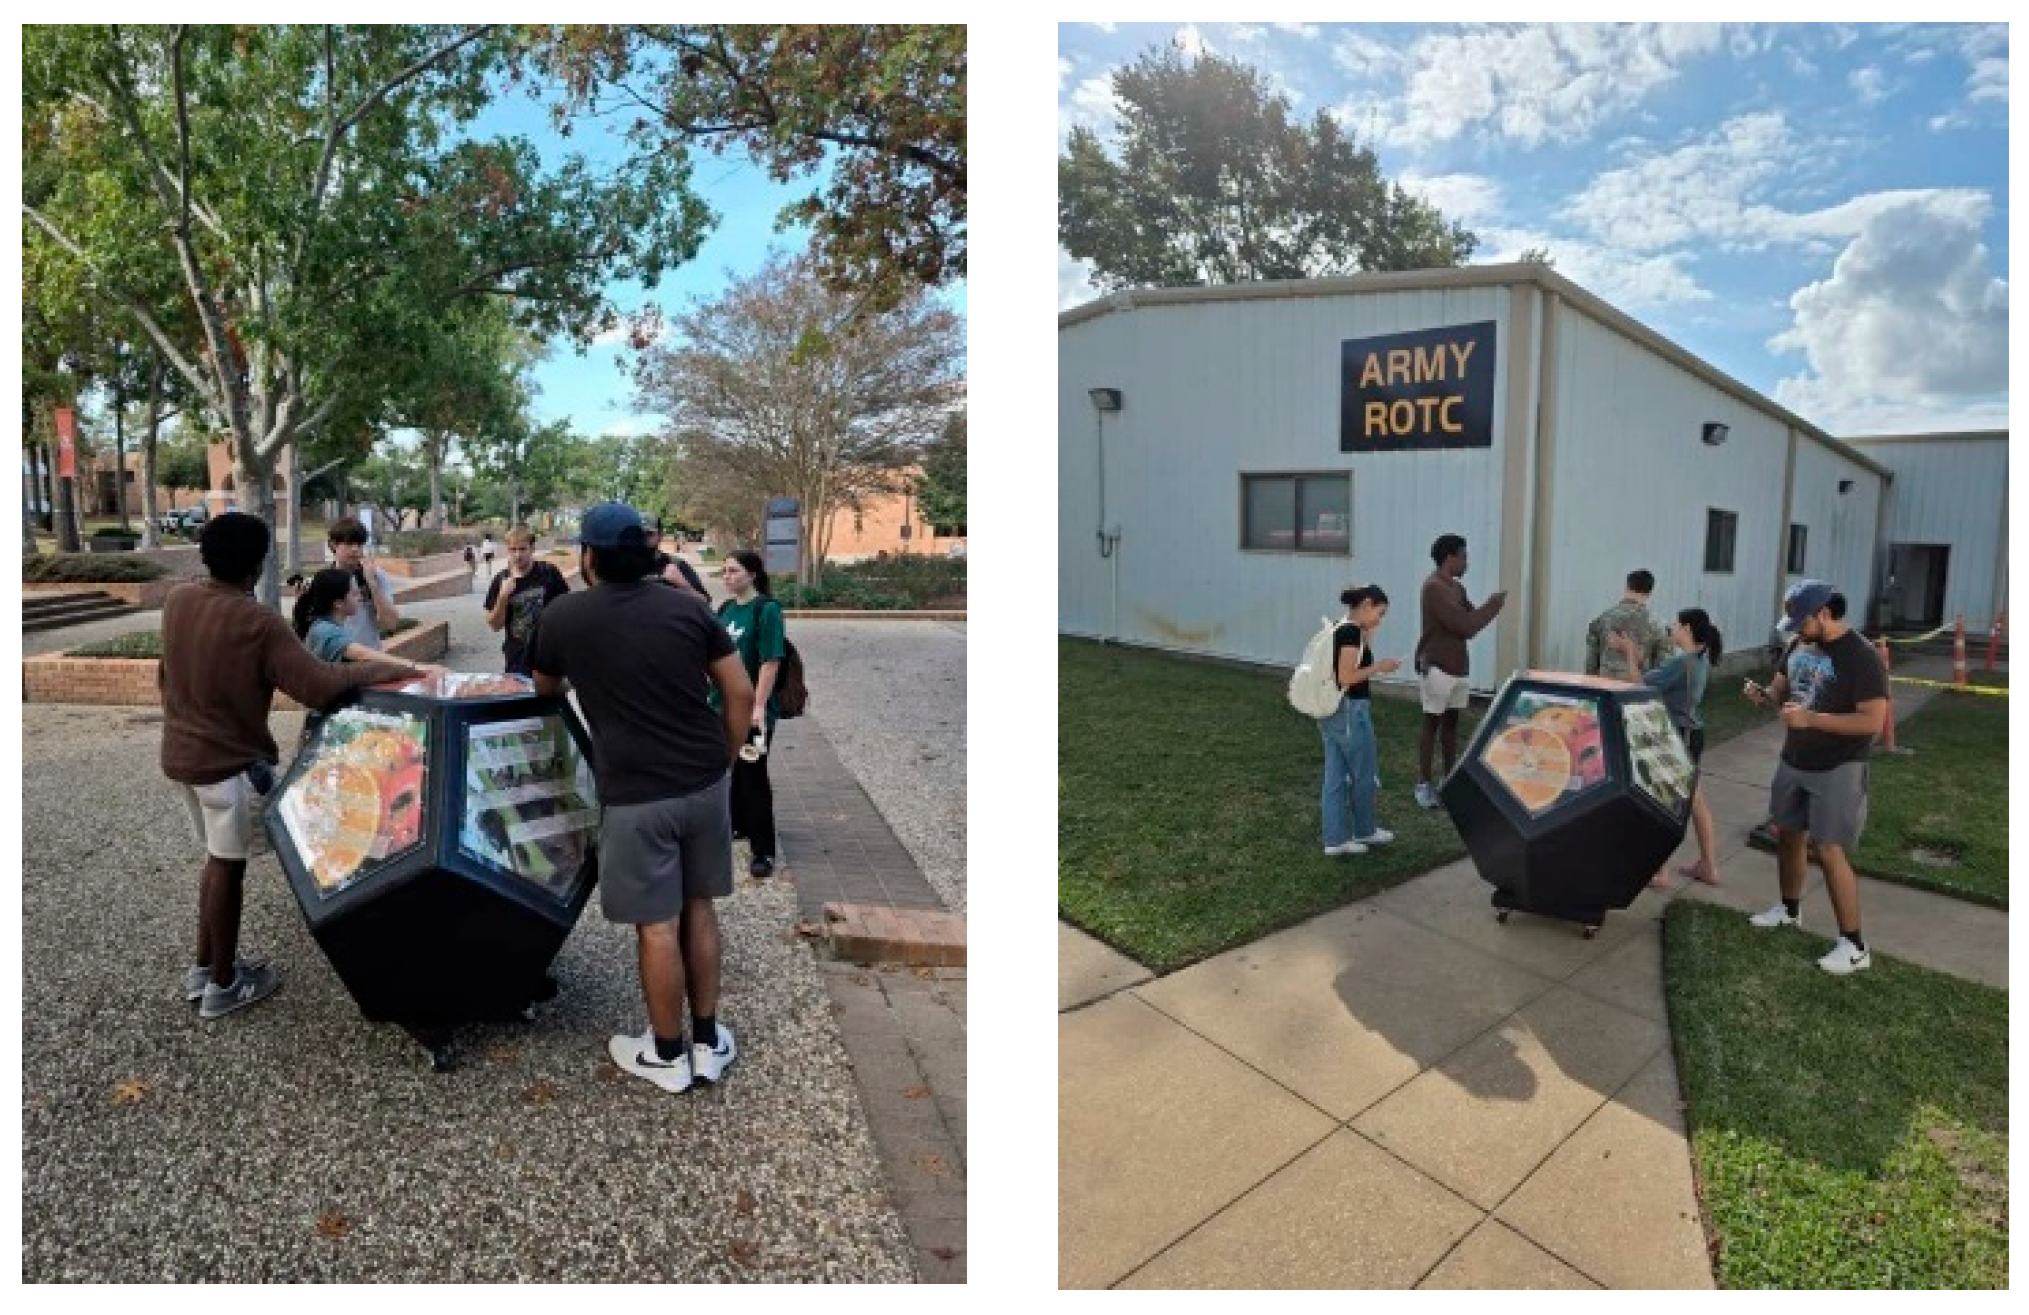
Figure 3.
Survey Questionnaire for Public Education/Awareness on Invasive Species.
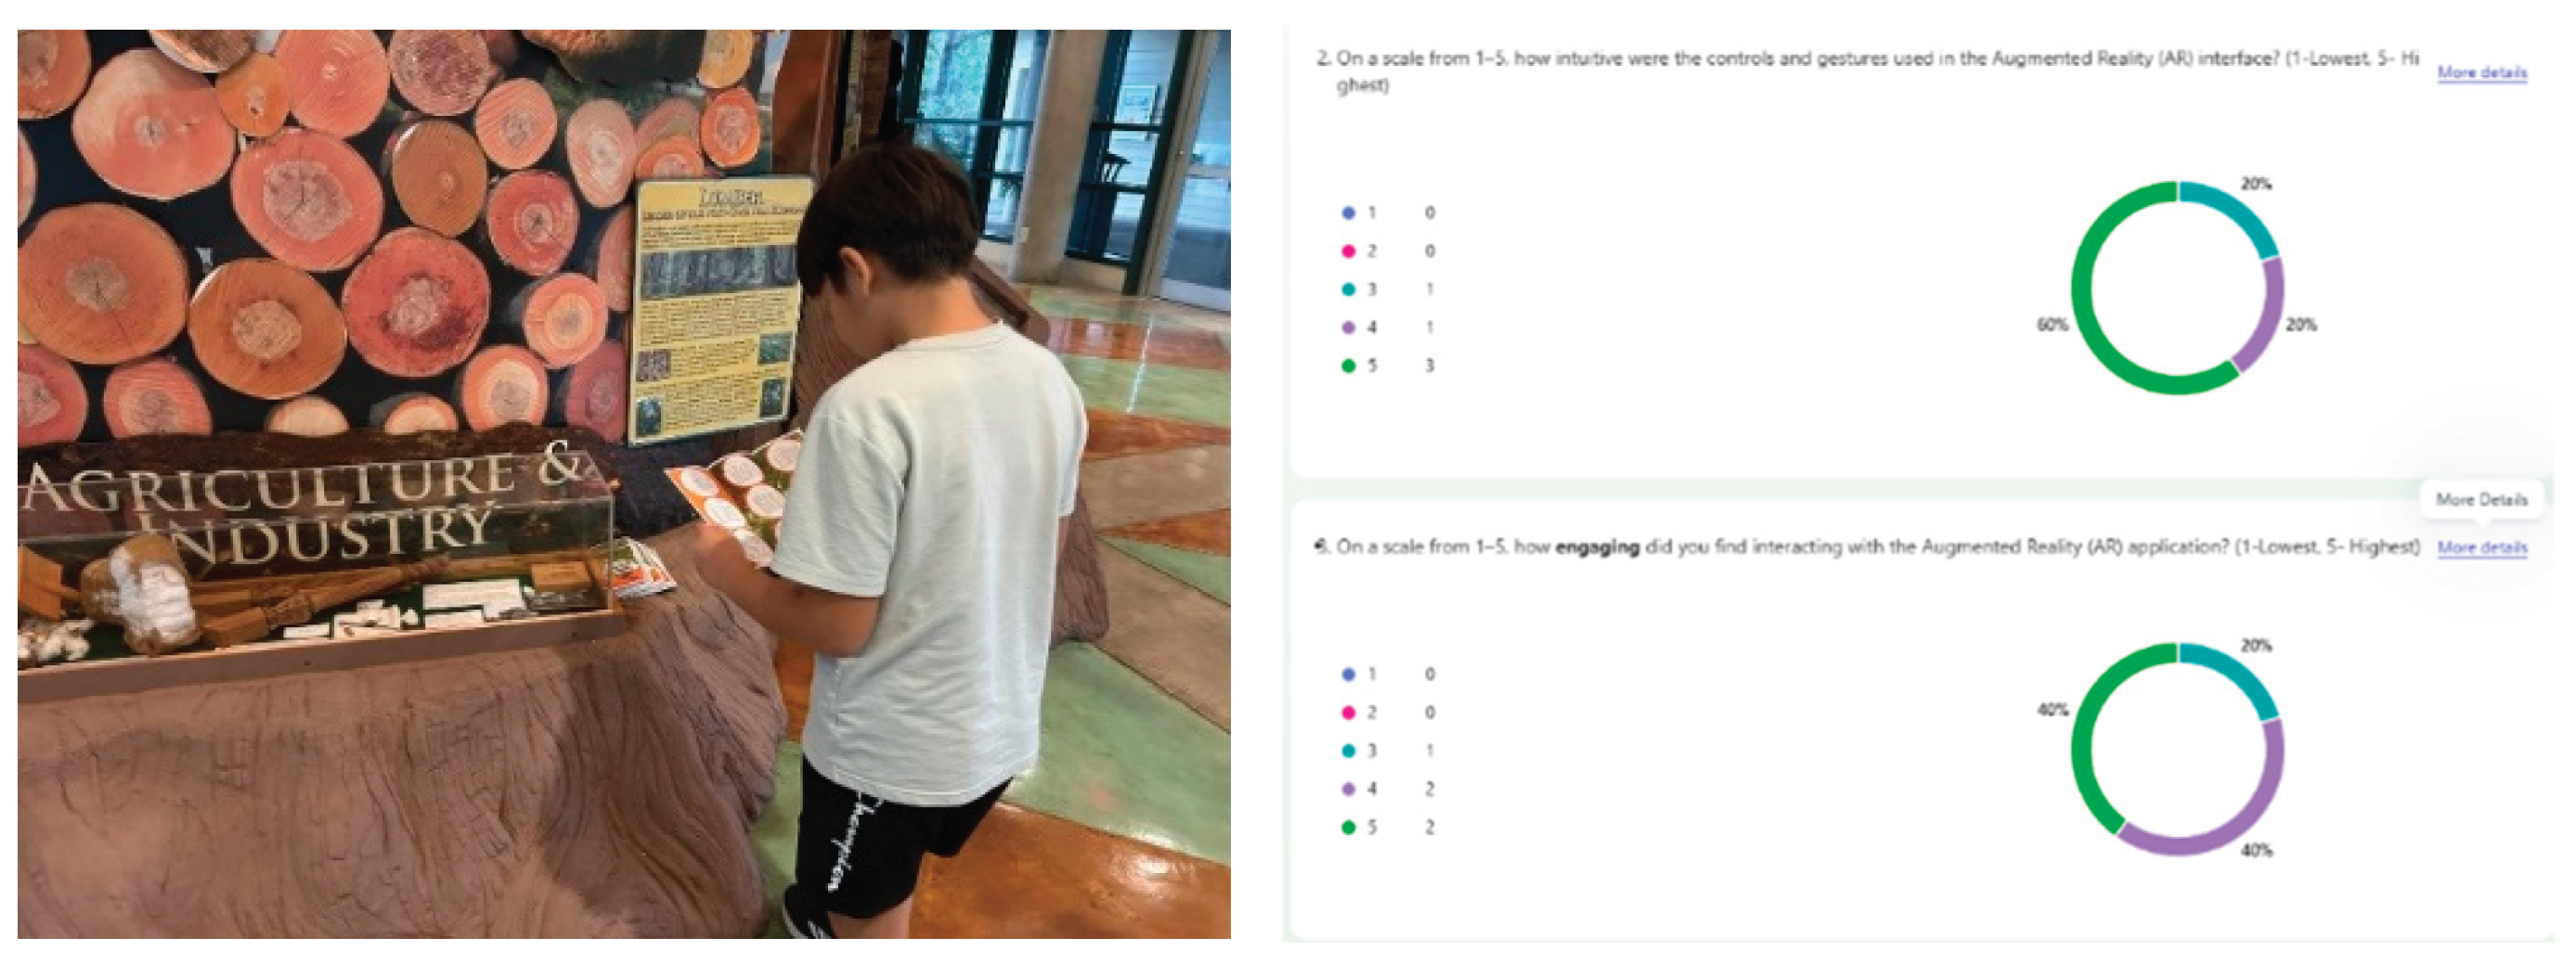
Table 1.
Descriptive Statistics.
| Descriptive Statistics | |||||
|---|---|---|---|---|---|
| N | Minimum | Maximum | Mean | Std. Deviation | |
| Intuitive interface controls | 238 | 1 | 5 | 4.769 | .560 |
| Engagement | 238 | 1 | 5 | 4.710 | .626 |
| Visual appeal | 238 | 1 | 5 | 4.735 | .631 |
| Perceived invasive species impact | 238 | 1 | 5 | 4.697 | .657 |
| Importance of public awareness | 238 | 1 | 5 | 4.752 | .604 |
| AR model realism | 238 | 1 | 5 | 4.609 | .725 |
| Dodecahedron usefulness | 238 | 1 | 5 | 4.655 | .655 |
| Data/simulation usefulness | 238 | 1 | 5 | 4.718 | .610 |
| Immersion | 238 | 1 | 5 | 4.576 | .822 |
| Likelihood to tell others | 238 | 1 | 5 | 4.500 | .889 |
| Valid N (listwise) | 238 | ||||
Table 2.
Reliability statistics for AR Station survey items.
| Reliability Statistics | |
|---|---|
| Cronbach’s Alpha | N of Items |
| .913 | 10 |
Disclaimer/Publisher’s Note: The statements, opinions and data contained in all publications are solely those of the individual author(s) and contributor(s) and not of MDPI and/or the editor(s). MDPI and/or the editor(s) disclaim responsibility for any injury to people or property resulting from any ideas, methods, instructions or products referred to in the content. |
© 2026 by the authors. Licensee MDPI, Basel, Switzerland. This article is an open access article distributed under the terms and conditions of the Creative Commons Attribution (CC BY) license (http://creativecommons.org/licenses/by/4.0/).
Copyright: This open access article is published under a Creative Commons CC BY 4.0 license, which permit the free download, distribution, and reuse, provided that the author and preprint are cited in any reuse.


