Submitted:
14 February 2026
Posted:
14 February 2026
You are already at the latest version
Abstract
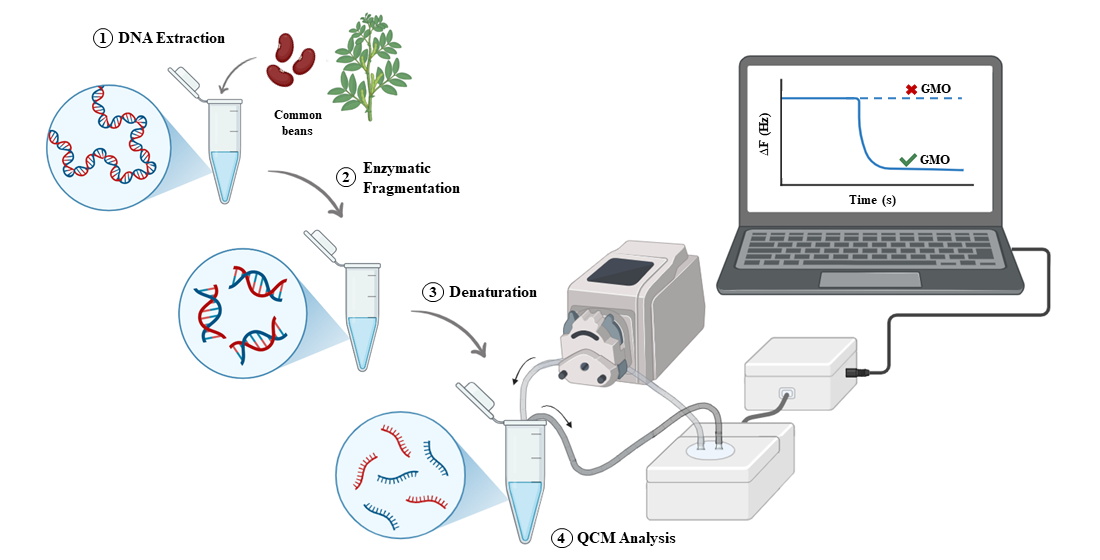
A quartz crystal microbalance-based biosensor for the specific detection of the first transgenic common bean (Phaseolus vulgaris L.) cultivar (BRS FC401 RMD) with resistance to bean golden mosaic virus (BGMV) was developed. The immobilization chemistry relies on the strong bond between the thiolated probe and the gold electrode surface. The probe sequence is internal to a region of the BGMV rep gene that was introduced into the common bean genome. The sensor's analytical performance was determined using synthetic oligonucleotides. Real samples of transgenic and wild-type bean seeds were also tested. Sample pretreatment consisted only of enzymatic fragmentation, followed by a thermal denaturation step combined with blocking oligonucleotides. Different biosensor regeneration approaches were studied. Immobilization showed good reproducibility (CV% of 5.8%). The biosensor proved specific for both synthetic oligonucleotides and non-amplified genomic DNA. A linear detection range of 0–1.4 ng/µL was observed, with a detection limit of 0.18 ng/µL. Three sequential detections were performed without loss of surface activity. The results demonstrate the biosensor's potential for direct, real-time, label-free detection of DNA samples for field screening of transgenic common bean cultivars.
Keywords:
bean golden mosaic virus
; biosensor
; common bean
; genetically modified organism
; immobilization
; quartz crystal microbalance
; regeneration
1. Introduction
Brazil is among the world's leading common bean producers. BRS FC401 RMD is the first genetically modified common bean (Phaseolus vulgaris L.) cultivar developed in the world and the only one registered and protected in Brazil as effectively resistant (immune) to golden mosaic [1]. Caused by Bean golden mosaic virus (BGMV), symptoms of golden mosaic include leaf yellowing, plant stunting, pod and grain deformation, and flower abortion. That is the main bean viral disease in Brazil, responsible for production losses ranging from 40% to 100% [2].
The transgenic cultivar possesses an intron-hairpin gene construct containing 411 base pairs of the BGMV rep gene (GenBank Accession NC 004042, position 1836-2247), positioned in sense and antisense, aiming to express an RNA that will form a hairpin structure, with double-stranded regions. The cellular machinery converts this double-stranded RNA (dsRNA) into small interfering RNAs (siRNA). These small RNAs trigger the degradation of the viral messenger RNA (mRNA) specific to the rep gene, a process known as RNA interference. Since the rep gene is essential for virus replication, its silencing leads to plants that are immune to golden mosaic virus [2,3].
BRS FC401 RMD is phenotypically identical to non-transgenic cultivars, being morphologically indistinguishable. Therefore, several safety concerns have been erroneously raised about this cultivar, including suspicions of loss of resistance, contamination with non-transgenic cultivars, or the emergence of other viruses transmitted by the same vector [4]. Furthermore, to comply with biosafety and food safety regulations in countries that adopt mandatory regulations (European Union (EU), Japan, Australia, New Zealand, Thailand, China and Brazil), transgenic cultivars must be traceable at all stages of the production chain, from seed and grain production to packaging and marketing [5].
Currently, the most popular DNA-based methods for screening genetically modified organisms (GMO) use polymerase chain reaction (PCR), with real-time PCR as the gold standard for GMO quantification. These procedures are laborious, expensive, and time-consuming, making them unsuitable for routine analyses [5]. Therefore, the development of fast, low-cost, easy-to-use, and field-applicable tools to detect the presence of GMOs is crucial [6].
An alternative to traditional methods is the use of DNA biosensors, known as genosensors. Among the various transduction methods [7,8,9], piezoelectric genosensors based on quartz crystal microbalances (QCMs) have recently gained prominence as the most attractive due to their potential for real-time, label-free detection, high sensitivity, simplicity, and low instrumentation cost [10,11]. In these devices, a quartz crystal wafer is sandwiched between two gold electrodes. The electrodes provide the connection between the reaction surface and the external oscillator circuit, which drives the quartz crystal at its resonance frequency [12]. DNA detection in QCM is performed by measuring the mass change at the sensor surface due to DNA hybridization. The linear relationship between the frequency change and the mass deposited on the quartz crystal surface is described by the Sauerbrey equation [13]:
where is the frequency shift of the crystal resonance, is the fundamental frequency of the crystal, is the surface area and is the deposited mass. Thus, the immobilization, hybridization, and hydrolytic cleavage of DNA can be monitored in situ by measuring the quartz crystal's resonance frequency. The mass-sensitive QCM technique has been successfully used to detect GMOs in several previous studies [14,15,16,17].
Therefore, the purpose of this study was to develop a genosensor capable of detecting the BRS FC401 RMD event and differentiating transgenic from conventional cultivars in non-amplified samples using quartz crystal microbalance technology. Biosensors were prepared by immobilizing a probe complementary to the characteristic DNA sequence present in the transgenic common bean. The probe sequence was internal to the BGMV rep gene sequence that was inserted into the common bean genome. The reproducibility of the immobilization procedures – thiol-gold interaction with a thiol-blocking solution – was evaluated. The analytical performance of the genosensor was evaluated for sensitivity, repeatability, reproducibility, and specificity. Furthermore, different bioreceptor regeneration approaches were investigated.
2. Materials and Methods
2.1. Chemicals
Hydrochloric acid (HCl), sulfuric acid (H2SO4), hydrogen peroxide (H2O2), 6-mercapto-1-hexanol (MCH), sodium hydroxide (NaOH), saline-sodium phosphate-EDTA buffer (SSPE 20X), ethanol, and tris (hydroxymethyl) aminomethane hydrochloride (Tris–HCl) were purchased from Merk (Darmstadt, Germany). Sodium dodecyl sulfate (SDS), potassium phosphate monobasic (KH2PO4), ethidium bromide, and agarose were purchased from Sigma-Aldrich® (Madrid, Spain). Ethylene diamine tetraacetic acid (EDTA), tris-borate-EDTA (TBE 10X) buffer, and saline-sodium citrate (SSC 20X) buffer were obtained from Thermo Fisher Scientific (Waltham, MA, USA). All buffers and solutions used in the experiments were prepared with ultrapure water obtained from a Millipore Milli-Q® (Madrid, Spain) purification system (18.2 MΩ·cm at 25 ◦C).
2.2. Synthetic Oligonucleotides Samples
Synthetic oligonucleotides were designed based on studies of the BGMV rep gene sequence. The base sequences of the 5′-functionalised probe (25-mer), complementary target (25-mer) and non-complementary terget (25-mer) oligonucleotides and blocking oligonucleotides (10-mer) are reported in Table 1.
All the oligonucleotides were purchased from GenOne Biotechnologies (Rio de Janeiro, Brazil). Lyophilized samples were dissolved in ultrapure water to a final concentration of 100 μM (pmol/μL) and stored at -20°C. Both the target and non-complementary sequences were used to evaluate the analytical performance of the biosensor. Blocking oligonucleotides were applied in the genomic DNA (gDNA) denaturation procedure.
2.3. Genomic DNA Samples
2.3.1. Genomic DNA Extraction
Initially, the bean grains (both wild type and transgenic) were ground for 20s (IKA A11 basic) to ensure greater exposure of the genetic material during cell lysis. Genomic DNA was then extracted using three commercial kits: ZymoBIOMICS (Zymo Research, United States), DNeasy Plant Pro (Qiagen Co. Ltd., Germany), and DNeasy mericon Food (Qiagen Co. Ltd., Germany), following recommended protocols. The DNA extract was quantified and its purity evaluated with a spectrophotometer (Thermo Scientific NanoDrop One) by determining the A260/280 and A260/230 ratios. Sample integrity was verified next by electrophoresis on a 1.5% agarose gel in TBE 1X buffer containing ethidium bromide, and samples were photodocumented with the Loccus Biotecnologia L.PIX Transilluminator (manual profile; 696 x 520 resolution; 16-bit format). Finally, the DNA was stored at -20 °C until use.
2.3.2. Enzymatic Digestion
After extraction, gDNA was enzymatically digested using the restriction enzyme FastDigest AluI (Thermo Scientific™). The choice of enzyme was based on the presence of restriction sites located in the flanking regions of the target sequence. The reaction was allowed to proceed at 37 °C for 15 min in a dry bath/thermoblock (Nova Ética/model 330 - 3D). Enzyme inactivation was not performed. The fragmented DNA was immediately used in the denaturation step.
2.3.3. Thermal Denaturation with Blocking Oligonucleotides
DNA fragments obtained by enzymatic digestion have a double helix structure and the two strands should be separated (denatured) to allow the hybridization with the probe immobilized on the sensor. To obtain a single strand, the digested DNA was submitted to thermal denaturation with a blocking oligonucleotide procedure [18], as shown in the Figure 1. This method is based on combining thermal dissociation effect with the steric hindrance caused by the binding of two short oligonucleotides to the thermally separated strands. One oligonucleotide binds to the strand containing the target while the other binds to the strand containing the probe. In this way, re-association of the strands is prevented, leaving the target strand available for hybridization. After adding 50 µL of each oligonucleotide (10 ng/µL), the sample was incubated at 95 °C for 5 minutes and then for 1 minute at 40 °C. This second temperature is the appropriate temperature for the annealing of the oligonucleotides to the complementary DNA sequences. The sample was injected into the cell flow immediately after completion of the procedure. The sample containing wild-type DNA was used as negative control.
2.4. QCM Crystals and the Experimental Set-Up
A quartz crystal resonator with an AT-cut and a nominal frequency of 10 MHz, oscillating in the fundamental harmonic (Novaetech S.r.l., Italy), was used for piezoelectrical measurements of hybridizations of synthetic oligonucleotides and genomic DNA. The device has an approximate thickness of 160 μm and a total diameter of 13.9 mm, positioned between two circular gold electrodes with a diameter of 6 mm and a thickness of approximately 200 nm. The adhesion of the gold to the quartz surface was enhanced by the deposition of an intermediate layer of titanium (Ti). The crystal exhibits a nominal sensitivity of 4.42 × 10⁻⁹ g Hz⁻¹ cm⁻² (), with thermal stability characterized by a variation of ± 20 kHz at 23 °C.
The quartz crystal was previously cleaned with a Piranha solution composed of H2O2 (30%) and H2SO4 (98%) in a 1:3 ratio. Approximately three drops of the solution were deposited on the electrode surface and held for 10 minutes. Then, it was rinsed with ultrapure water. The crystal was used immediately or kept in absolute ethanol until use.
The quartz crystal was housed inside a flow-cell and the resonance frequency was continuously recorded using an open-source quartz crystal frequency counter (openQCM proximity electronic, 1–25 MHz) developed by Novaetech S.r.l (Pompei, Italy). Samples and solutions were passed through the QCM flow-cell setup at a specific flow rate (100-500 µL/min) using an open-source, precise peristaltic pump [19]. The frequency shifts (∆F) reported in the paper are the difference between two stable values (±1 Hz). All measurements were conducted in a controlled laboratory environment to minimize external interferences. Additionally, the ambient temperature was monitored using the OpenQCM software's real-time temperature monitoring feature to prevent signal drift.
2.5. Immobilization of the Oligonucleotide Probe on Gold
Quartz crystal functionalization was carried out as described in previous works [14,20], with some modifications. The immobilization solution (1 M KH2PO4, pH 3.8) was injected into the flow-cell until a stable baseline frequency was achieved. Then, 50 µL of the thiolated probe (10 ng/µL) prepared in the same solution was injected and recirculation was maintained for 2 hours. The surface modification is based on the direct chemisorption of DNA probes onto transducer surfaces due to the formation of gold–thiol bonds. Next, the crystal was washed with immobilization solution and water to remove non-linked probes and prepare it for the blocking step. To block the surface and prevent non-specific adsorption, the crystal was treated with 1 mL of a 1 mM aqueous solution of blocking thiol (6-mercapto-1-hexanol, MCH) for 1 hour. Both probe immobilization and blocking surface procedure were conducted with recirculation of each solution at a continuous flow rate (100 µL/min). Frequency value shifts were recorded when a stable frequency signal was obtained. Sauerbrey equation was used to determine the amount of mass deposited on the crystal surface by immobilized thiolated probe and blocking thiol.
2.6. Hybridization with Synthetic Oligonucleotides
Hybridizations using synthetic oligonucleotides were conducted to characterize the analytical capabilities of the genosensor in terms of stability, specificity, and reproducibility. The flow cell was filled with hybridization buffer (SSPE 1x) and left in this condition until baseline stabilization. Hybridization was conducted using a solution containing 10 ng/µL of the complementary synthetic target, prepared in the same buffer, for 30 minutes under continuous recirculation (100 µL/min). Then, the crystal was washed with the hybridization buffer to remove unbound target molecules. The single-stranded probe regeneration was performed by treatment with a 1 mM HCl solution for 1 minute at a continuous flow rate (500 µL/min). Finally, the hybridization buffer was injected, re-establishing the experimental conditions necessary for subsequent detection cycles.
2.7. Hybridization with Real Samples
Genomic DNA was first enzymatically digested to obtain fragments that could be easily denatured and recognised by the immobilised probe. The procedure for hybridising digested genomic DNA is the same as that described for oligonucleotides, with a few exceptions due to the greater complexity of the sample. The samples were diluted in hybridization buffer to ~1.2 ng/µL. The hybridization reaction was allowed to proceed for 30 min. In addition to the treatment with 1 mM HCl for 1 minute, NaOH (50 mM and 100 mM) and 200 mM Tris-HCl (pH 7, 0.1X SSC, and 0.1% p/v SDS) were used to optimize the regenerations, varying the temperature and exposure time (detailed in supplementary material). The regeneration solutions were injected into the flow cell and discarded at a continuous flow rate of 500 µL/min.
3. Results and Discussion
3.1. Electrode Functionalization
Immobilization was achieved by directly interacting the gold surface of the quartz crystal with the thiolated probe solution. The driving force for coating thiolated probes on gold surfaces is due to the formation of strong thiol-Au bonds, which have a chemisorption energy of ∼50 kcal/mol [21]. The application of this technique is easy and straightforward and is possibly the most widely employed surface chemistry approach for immobilizing bioreceptors on Au-based molecular detection platforms [22]. The QCM gold electrode serves as a transduction interface, and the immobilization process can be observed in real time, eliminating the need for a labeling system. In this study, a frequency variation of -162 ± 9 Hz (n=3) was observed upon 2h immobilization of 10 ng/uL of the thiolated probe, corresponding to a coefficient of variation (CV%) of 5.8%. This value corroborates the literature results [14] and demonstrates good reproducibility, also indicating that the procedures adopted for crystal cleaning, solution preparation, and flow condition control are robust. According to the Sauerbrey equation () for a 10 MHz quartz crystal with a nominal sensitivity of 4.42 × 10⁻⁹ g Hz⁻¹ cm⁻², a frequency decrease of 1 Hz corresponds to a mass increase of 1.25 ng. Therefore, the estimated chemisorbed mass was ~203 ng, equivalent to a probe density of 5.6 × 10¹³ molecules.cm⁻² (MW of thiolated-probe; 7691 g/mole).
After the immobilization with the thiolated probe, the crystal was treated with 1 mM of MCH for 1 hour at a continuous flow rate (100 µL/min) to control surface density and remove non-specific interactions [23]. The frequency variation associated with MCH treatment was +46 ± 4 Hz, indicating partial desorption of poorly anchored probes and monolayer reorganization.
Surface activity was assessed by hybridization with 10 ng/µL of complementary DNA in 1x SSPE buffer. The hybridization signal was -35 ± 4 Hz (n = 3), corresponding to a hybridization ratio of ~30% (calculated as adjusted after MCH passivation). The hybridization ratio typically observed in QCM biosensors ranges from 30% to 80%, depending on the probe design, surface chemistry, and experimental conditions[24,25]. Specifically for hybridization with a thiol-modified probe, a ratio of 40-42% is reported[25].
This results highlight opportunities for optimization by fine-tuning probe density to balance monolayer stability, reproducibility, and accessibility for hybridization. Among the possible optimizations, reducing the concentration of probes in the immobilization fluid or decreasing the exposure time stands out, resulting in a less dense monolayer and more favorable interactions with the target. Another possibility focuses on the concentration of the blocking agent: in excess, it can displace probes from the QCM surface and reduce subsequent hybridization. At low concentrations, the probes may not assume an upright orientation, thereby reducing their availability for binding to the target [26]. Alternatively, decreasing the flow rate can reduce mass transport, resulting in less compact monolayers [27]. All of this, combined with surface studies (Atomic Force Microscopy (AFM), X-ray photoelectron spectroscopy (XPS), etc.), allows for a more detailed investigation of the influence of each variable on electrode functionalization.
3.2. Analytical Performances of the Biosensor
Analytical performance of the developed biosensor was evaluated for sensitivity, repeatability, reproducibility and specificity using standard solutions of synthetic oligonucleotides. As shown in Figure 2, a calibration curve was obtained using the complementary target in a concentration range of 0–10 ng/µL. The sensor demonstrated linear behavior over the 0–1.4 ng/µL concentration range, described by the regression equation ∆F (Hz) = (11.909) C (ng/µL) + (0.8971), with a high correlation coefficient of R2 = 0.9858. The experimental limit of detection (LOD) calculated following the standard approach () for the complementary target sequence was 0.18 ng/µL.
Repeatability of the biosensor was evaluated by performing five consecutive measurements on the same electrode, using the same complementary target concentration (10 ng/µL). Electrode regeneration was performed by injecting 1 mM HCl at a flow rate of 500 µL/min. The average frequency variation was -30 Hz, with a standard deviation of ±2 Hz, yielding a coefficient of variation of 6%. Similar studies reported CVs of 8% (n=4)[17] and 11% (n=3)[20] for assays using the same regeneration solution. Thus, the low variability observed indicates good repeatability of the system and confirms the stability of the detection signal resulting from hybridization of ssDNA on the quartz crystal surface.
Reproducibility was investigated by performing three detection tests on three independent electrodes under the same experimental conditions. A frequency variation of -35 Hz was observed, with a standard deviation of ±4 Hz. The CV of 11% indicates good inter-device reproducibility. This value, although slightly higher than that observed for repeatability, remains within the range reported in the literature for piezoelectric DNA biosensors[16,28], indicating robustness of the manufacturing and immobilization process. The observed variation may be associated with slight differences in probe density, heterogeneity in the self-assembled monolayer, and differences in hybridization efficiency across electrodes.
Specificity was demonstrated by comparing the biosensor's response to 10 ng/µL complementary target DNA with that of two non-complementary sequences. Negligible signals (< 1Hz) from non-complementary sequences confirm the sensor's ability to recognize the intended DNA target specifically. This result is crucial for the device's applicability, ensuring that only genetically modified targets are detected, minimizing false positives.
3.3. Genomic DNA Extraction
For each method of DNA detection and/or quantification in biomolecular analyses, at least one extraction protocol applicable to the sample matrix must be available, tested, and validated. Table 2 presents the results of genomic DNA extraction from transgenic bean grains using three commercial kits. The essence of extraction is to obtain a sufficient quantity of DNA with adequate quality for subsequent analyses. Quality refers to the length, structural integrity and physicochemical purity of the extracted DNA[29].
Kits I and II showed similar average extraction yields, indicating comparable efficiency in the lysis and recovery of genomic DNA from the plant matrix. However, kit II showed lower reproducibility between replicates. Kit III, on the other hand, showed a yield twice that of the previous ones. The A260/280 ratio was greater than 1.7 for all extracts, indicating that all three kits were efficient in removing proteins, since values between 1.7 and 2.0 are accepted as indicative of pure DNA. The evaluation of DNA purity by measuring the absorbance ratio at 260 and 280 nm (A260/280) is a widely used technique for indicating, for example, the presence of residual peptides and phenolic compounds. These compounds exhibit strong absorption around 280 nm, resulting in low A260/280 ratios when they coexist with DNA, which absorbs at 260 nm [15]. The A260/A230 ratio showed distinct behavior: all samples exhibited values below the ideal range (2.0–2.2), indicating residual presence of contaminants that preferentially absorb at 230 nm, such as lipids, salts and phenols[29].
The integrity of the extracts obtained from the bean seeds was evaluated by agarose gel electrophoresis (Figure 3). Eight samples were analyzed.
All samples exhibited intense bands located near the top of the gel, a region of high molecular weight, indicating the presence of genomic DNA with good structural integrity [16]. The exception was sample 6, extracted with kit II, whose band showed reduced intensity, suggesting a lower amount of DNA extracted. The extraction method and sample characteristics influence the yield and quality of the extracted DNA, and both are crucial to the results of GMO detection and quantification. Overall, kit III showed better yields and purity. However, although purity ratios are important indicators of sample quality, the best indicator of nucleic acid quality is its functionality in subsequent applications of interest [16]. Therefore, all samples were subjected to enzymatic digestion steps and detection assays to assess the quality of the signal obtained.
3.4. Sample Pretreatment: Enzymatic Fragmentation and Thermal Denaturation Combined with Oligonucleotides
DNA fragmentation and denaturation are necessary pretreatment steps for samples that require short fragments for rapid hybridization and high-sensitivity target detection [30]. Plant genomic DNA is a structurally complex, long, and difficult-to-dissociate molecule, which sterically hinders the approximation of target sequences to probes bound to the crystal surface [31]. Therefore, after extraction, the gDNA was enzymatically digested using the restriction enzyme FastDigest AluI. The enzyme was chosen based on the presence of restriction sites located in the flanking regions of the target sequence, allowing the generation of a fragment of 138 nitrogenous base pairs. The length of the fragment obtained is smaller than that reported in similar studies (approximately 400-900 bp) [20,31]. It is worth noting that smaller fragments tend to exhibit greater diffusional mobility and less steric hindrance during association with the probe.
The high-temperature thermal denaturation procedure (95 °C for 5 min, followed by 1 min in ice) is widely described in literature for hybridization assays [14]. However, this approach may be unfavorable for experiments performed on instrumentation that employs flow systems for sample injection [18], such as the one developed in this work. This limitation is due to the rapid reannealing of denatured DNA strands before they come into contact with the sensor surface. Therefore, the digested sample was subjected to a thermal denaturation protocol associated with the presence of oligonucleotides. In this strategy, after denaturation, the DNA is incubated for 1 minute at the oligonucleotide annealing temperature (40 °C). The binding of these oligonucleotides to single-stranded DNA (ssDNA) slows reannealing, increasing the time that denatured sequences remain available for hybridization. The effectiveness of sample pretreatment was inferred from the analytical hybridization signal.
3.5. Hybridization with Non-Amplified gDNA Samples
In the digested DNA sample, the target sequence is present at reduced copy number and embedded within a highly complex matrix of fragmented genomic DNA. Even so, the biosensor detected the complementary sequence in all samples analyzed. This result demonstrates that the sample pretreatment strategy—involving extraction, enzymatic digestion, and thermal denaturation combined with blocking oligonucleotides—was effective in making the target sequence available in a form accessible to molecular recognition.
The reproducibility assay in three distinct crystals revealed a hybridization frequency variation of -40 ± 16 Hz with a CV% of 40%. It should be noted that it is not possible to directly compare the coefficient of variation of the signals obtained with real samples and with samples of synthetic oligonucleotides, since these matrices present distinct levels of complexity. While synthetic oligonucleotides constitute well-defined and homogeneous systems, genomic DNA extracted from plant matrices is a complex mixture of fragments, possible residual contaminants from the extraction process, and variability inherent in the pretreatment steps, all of which tend to increase the dispersion of analytical signals.
The comparison of the different extraction kits revealed no direct correlation between hybridization signal intensity and the extraction method. Although differences in DNA yield and purity were observed, particularly with the DNeazy mericon Food kit, these variations were not significantly reflected in the final biosensor response.
The biosensor's specificity was confirmed using a negative control, consisting of wild-type DNA subjected to the same extraction, digestion, and heat treatment procedures. Under these conditions, a negligible frequency shift (≤ 4 Hz) was observed (n=3). The small frequency shift can be attributed either to direct DNA adsorption on the gold electrode without hybridization with the probe or to weak, non-specific interactions between the probe and partially complementary sequences in the complex sample.
3.6. Surface Regeneration
To regenerate the bioreceptor after hybridization with gDNA, different approaches were evaluated using 1 mM HCl, NaOH (50 mM and 100 mM), and 200 mM Tris-HCl (pH 7), with 0.1X SSC and 0.1% w/v SDS. The efficiency of each treatment was evaluated by the percentage of baseline recovery before hybridization. No regeneration occurred with 1mM HCl and 50mM NaOH. Only partial regeneration occurred with 100 mM NaOH (25°C), accompanied by incomplete removal of hybridized target DNA, resulting in lower surface activity. On the other hand, regeneration with I: (100 mM NaOH (25°C) for 1 min + 200 mM Tris-HCl(…)(25°C) for 2 min) and II: (200 mM Tris-HCl(…) (95°C) for 10 min + H2O (95°C) for 15 s) resulted in a regeneration percentage greater than 100%, indicating that in addition to the removal of the hybridized target DNA, there was also partial removal of the probes immobilized on the sensor surface. The maintenance of the surface's analytical capacity was evaluated by the percentage retention of the analytical signal after two regeneration/hybridization cycles (Figure 4).
Regeneration with treatment I showed a cumulative loss of approximately 93% of the analytical signal compared to the initial value after the third cycle. In comparison, regeneration with II resulted in a 51% loss. This difference is attributed to the milder chemical conditions employed in treatment II, in which only the thermal effect was used to promote the separation of the DNA strands, combined with the Tris-HCl buffer solution (pH 7, 0.1X SSC, and 0.1% w/v SDS). The use of temperature to induce DNA denaturation is a well-established technique and, when adequately controlled, can be applied without causing irreversible damage to the integrity of the nucleic acid [30]. Despite this progressive decrease, the signal remained clearly distinguishable from noise and the negative control after treatment II, allowing for the unequivocal identification of the analyte in all cycles evaluated. This behavior indicates that although the functional layer shows partial degradation, a significant fraction of the probes remains active and accessible for molecular recognition. At least three hybridization reactions can proceed without the need for a new immobilization procedure.
5. Conclusions
In this work, a QCM-based genosensor for the detection of common bean resistant to golden mosaic was developed. By immobilizing a sequence internal to a region of the BGMV rep gene on the QCM sensor surface, the system achieved selective, sensitive detection of the transgenic event directly from non-amplified samples. Although some challenges remain, the developed biosensor introduces an assay format that allows for real-time detection of the transgenic event without markers, without the need for extensive sample preparation or complex analytical procedures. The assay is compatible with miniaturized instrumentation, making it particularly suitable for field applications. In Brazilian agriculture, this method can transform the monitoring of modified common beans, speeding up inspections, reducing costs, and expanding analytical reach to regions with less laboratory infrastructure.
Supplementary Materials
The following supporting information can be downloaded at the website of this paper posted on Preprints.org. Table S1: Approaches studied for bioreceptor regeneration after hybridization with genomic DNA.
Author Contributions
Conceptualization, I.C.S.N., A.M.S. and E.M.M.O; methodology, I.C.S.N., A.V. and R.O.M.F.; investigation, I.C.S.N. and A.M.S.; writing—original draft preparation, I.C.S.N.; writing—review and editing, A.P.P and A.V.; supervision, A.M.S., A.V. and R.O.M.F.; project administration, A.M.S. and E.M.M.O; resources, A.V., R.O.M.F., A.M.S. and E.M.M.O; funding acquisition, A.M.S. and E.M.M.O. All authors have read and agreed to the published version of the manuscript.
Funding
This research was funded by Coordenação de Aperfeiçoamento de Pessoal de Nível Superior (CAPES), grant number 88887.464101/2019-00.
Data Availability Statement
The original contributions presented in the study are included in the article, further inquiries can be directed to the corresponding author.
Conflicts of Interest
The authors declare no conflicts of interest.
Abbreviations
The following abbreviations are used in this manuscript:
| BGMV | bean golden mosaic virus |
| dsRNA | double-stranded RNA |
| siRNA | small interfering RNAs |
| GMO | genetically modified organisms |
| PCR | polymerase chain reaction |
| gDNA | genomic DNA |
| ssDNA | single-stranded DNA |
| AFM | atomic force microscopy |
| XPS | x-ray photoelectron spectroscopy |
References
- Barbosa, F.R.; Souza, T.L.P.O.; Wendland, A.; Costa, A.G.; Quintela, E.D.; Aragão, F.J.L.; Faria, J.C.; Vivian, R. Feijão Resistente Ao Mosaico-Dourado; Embrapa: Goiás, 2021. [Google Scholar]
- Souza, T.L.P.O.; Faria, J.C.; Aragão, F.J.L.; Peloso, M.J.D.; de Faria, L.C.; Aguiar, M.S.; Wendland, A.; Quintela, E.D.; Díaz, J.L.C.; Magaldi, M.C. de S.; et al. BRS FC401 RMD: Cultivar de Feijão Carioca Geneticamente Modificada Com Resistência Ao Mosaico-Dourado; Embrapa, 2016. [Google Scholar]
- Souza, T.L.P.O.; Faria, J.C.; Aragão, F.J.L.; Del Peloso, M.J.; Faria, L.C.; Wendland, A.; Aguiar, M.S.; Quintela, E.D.; Melo, C.L.P.; Hungria, M.; et al. Agronomic Performance and Yield Stability of the RNA Interference-Based Bean Golden Mosaic Virus-Resistant Common Bean. Crop Science 2018, 58, 579–591. [Google Scholar] [CrossRef]
- Teixeira, N.C.; Wendland, A.; Oliveira, M.I. de S.; Brandão, L.T.D.; de Souza, T.L.P.O.; de Faria, J.C.; Del Peloso, M.J.; Cortes, M.V. de C.B. Rapid Identification of RNA-Interference-Based Resistance to Bean Golden Mosaic Virus in Transgenic Common Beans via Loop-Mediated Isothermal Amplification. Crop Science 2020, 60, 3004–3012. [Google Scholar] [CrossRef]
- Arugula, M.A.; Zhang, Y.; Simonian, A.L. Biosensors as 21st Century Technology for Detecting Genetically Modified Organisms in Food and Feed. Anal. Chem. 2014, 86, 119–129. [Google Scholar] [CrossRef]
- Brara, Z.; Madani, K.; Costa, J.; Taouzinet, L.; Djaoudene, O.; Amrane-Abider, M.; Bougherra, H.; Mouhoubi, K.; Brahimi, N.; Bouiche, C.; et al. Current Progress on the Detection of Genetically Modified Organisms in Food: From Transgenic Towards Genome-Edited Crops. Comprehensive Reviews in Food Science and Food Safety 2025, 24, e70243. [Google Scholar] [CrossRef]
- Han, C.; Park, S.; Park, S.; Lee, D.; Jo, H.; Seo, S.; Han, H.; Jeong, S.; Kwon, W. DNA-Functionalized Nanomaterials for Optical Biosensors: Mechanisms, Applications, and Design Perspectives. Sensors and Actuators Reports 2026, 11, 100443. [Google Scholar] [CrossRef]
- Pohanka, M. Overview of Piezoelectric Biosensors, Immunosensors and DNA Sensors and Their Applications. Materials 2018, 11, 448. [Google Scholar] [CrossRef]
- Gunasekaran, B.M.; Srinivasan, S.; Ezhilan, M.; Nesakumar, N. Nucleic Acid-Based Electrochemical Biosensors. Clinica Chimica Acta 2024, 559, 119715. [Google Scholar] [CrossRef]
- Babaei, A.; Pouremamali, A.; Rafiee, N.; Sohrabi, H.; Mokhtarzadeh, A.; de la Guardia, M. Genosensors as an Alternative Diagnostic Sensing Approaches for Specific Detection of Virus Species: A Review of Common Techniques and Outcomes. TrAC Trends in Analytical Chemistry 2022, 155, 116686. [Google Scholar] [CrossRef] [PubMed]
- Pohanka, M. Quartz Crystal Microbalance (QCM) Sensing Materials in Biosensors Development. International Journal of Electrochemical Science 2021, 16, 211220. [Google Scholar] [CrossRef]
- Barrias, S.; Fernandes, J.R.; Martins-Lopes, P. Newly Developed QCM-DNA Biosensor for SNP Detection in Small DNA Fragments: A Wine Authenticity Case Study. Food Control 2025, 169, 111036. [Google Scholar] [CrossRef]
- Sauerbrey, G. The Use of Quartz Oscillators for Weighing Thin Layers and for Microweighing. Zeitschrift für Physik 1959, 155, 206–222. [Google Scholar] [CrossRef]
- Karamollaoğlu, İ.; Öktem, H.A.; Mutlu, M. QCM-Based DNA Biosensor for Detection of Genetically Modified Organisms (GMOs). Biochemical Engineering Journal 2009, 44, 142–150. [Google Scholar] [CrossRef]
- Passamano, M.; Pighini, M. QCM DNA-Sensor for GMOs Detection. Sensors and Actuators B: Chemical 2006, 118, 177–181. [Google Scholar] [CrossRef]
- Stobiecka, M.; Cieśla, J.M.; Janowska, B.; Tudek, B.; Radecka, H. Piezoelectric Sensor for Determination of Genetically Modified Soybean Roundup Ready (R) in Samples Not Amplified by PCR. Sensors 2007, 7, 1462–1479. [Google Scholar] [CrossRef]
- Mannelli, I.; Minunni, M.; Tombelli, S.; Mascini, M. Quartz Crystal Microbalance (QCM) Affinity Biosensor for Genetically Modified Organisms (GMOs) Detection. Biosensors and Bioelectronics 2003, 18, 129–140. [Google Scholar] [CrossRef]
- Wang, R.; Minunni, M.; Tombelli, S.; Mascini, M. A New Approach for the Detection of DNA Sequences in Amplified Nucleic Acids by a Surface Plasmon Resonance Biosensor. Biosensors and Bioelectronics 2004, 20, 598–605. [Google Scholar] [CrossRef] [PubMed]
- iGEM Aachen Precise Peristaltic Pump. Available online: https://www.instructables.com/Open-Source-Peristaltic-Pump/ (accessed on 20 October 2025).
- Minunni, M.; Mannelli, I.; Spiriti, M.M.; Tombelli, S.; Mascini, M. Detection of Highly Repeated Sequences in Non-Amplified Genomic DNA by Bulk Acoustic Wave (BAW) Affinity Biosensor. Analytica Chimica Acta 2004, 526, 19–25. [Google Scholar] [CrossRef]
- Oberhaus, F.V.; Frense, D.; Beckmann, D. Immobilization Techniques for Aptamers on Gold Electrodes for the Electrochemical Detection of Proteins: A Review. Biosensors 2020, 10, 45. [Google Scholar] [CrossRef] [PubMed]
- Yang, D.-K.; Yu, L.-K.; Kuo, C.-T.; Weng, J.-H.; Leïchlé, T.; Swami, N.S.; Chen, L.-C.; Wei, P.-K.; Chou, C.-F. Direct in Situ and Real-Time Visualization of Salt-Dependent Thiolated-DNA Immobilization and Biosensing on Gold in Nanofluidic Channels. Sensors and Actuators B: Chemical 2023, 394, 134303. [Google Scholar] [CrossRef]
- Optimisation of peptide nucleic acid (PNA) probe immobilisation by EIS for enhanced bioFET detection of miR-155. Microchemical Journal 2025, 217, 115074. [CrossRef]
- Lazerges, M.; Perrot, H.; Zeghib, N.; Antoine, E.; Compere, C. In Situ QCM DNA-Biosensor Probe Modification. Sensors and Actuators B: Chemical 2006, 120, 329–337. [Google Scholar] [CrossRef]
- Lazerges, M.; Perrot, H.; Rabehagasoa, N.; Compère, C. Thiol- and Biotin-Labeled Probes for Oligonucleotide Quartz Crystal Microbalance Biosensors of Microalga Alexandrium Minutum. Biosensors 2012, 2, 245–254. [Google Scholar] [CrossRef]
- Lino, C.; Barrias, S.; Chaves, R.; Adega, F.; Fernandes, J.R.; Martins-Lopes, P. Development of a QCM-Based Biosensor for the Detection of Non-Small Cell Lung Cancer Biomarkers in Liquid Biopsies. Talanta 2023, 260, 124624. [Google Scholar] [CrossRef]
- Camillone, N. Diffusion-Limited Thiol Adsorption on the Gold(111) Surface. Langmuir 2004, 20, 1199–1206. [Google Scholar] [CrossRef] [PubMed]
- Tombelli, S.; Minunni, M.; Santucci, A.; Spiriti, M.M.; Mascini, M. A DNA-Based Piezoelectric Biosensor: Strategies for Coupling Nucleic Acids to Piezoelectric Devices. Talanta 2006, 68, 806–812. [Google Scholar] [CrossRef] [PubMed]
- Prins, T.W.; Broothaerts, W.; Burns, M.; Demšar, T.; Edelmann, S.; Papazova, N.; Peterseil, V.; Taverniers, I. Guidance on the Selection and Use of DNA Extraction Methods. Available online: https://publications.jrc.ec.europa.eu/repository/handle/JRC134298 (accessed on 6 December 2025).
- Jia, Y.; Chen, S.; Wang, Q.; Li, J. Recent Progress in Biosensor Regeneration Techniques. Nanoscale 2024, 16, 2834–2846. [Google Scholar] [CrossRef]
- Minunni, M.; Tombelli, S.; Mascini, M. A Biosensor Approach for DNA Sequences Detection in Non-amplified Genomic DNA. Analytical Letters 2007. [Google Scholar] [CrossRef]
Figure 1.
Thermal denaturation followed by blocking to dissociate the dsDNA. (A) high temperature denaturation (95°C for 5min), (B) blocking with oligonucleotides (1 min incubation with oligonucleotides at 40 ◦C), (C) injection into the flow cell to hybridization with the probe immobilized on the electrode.
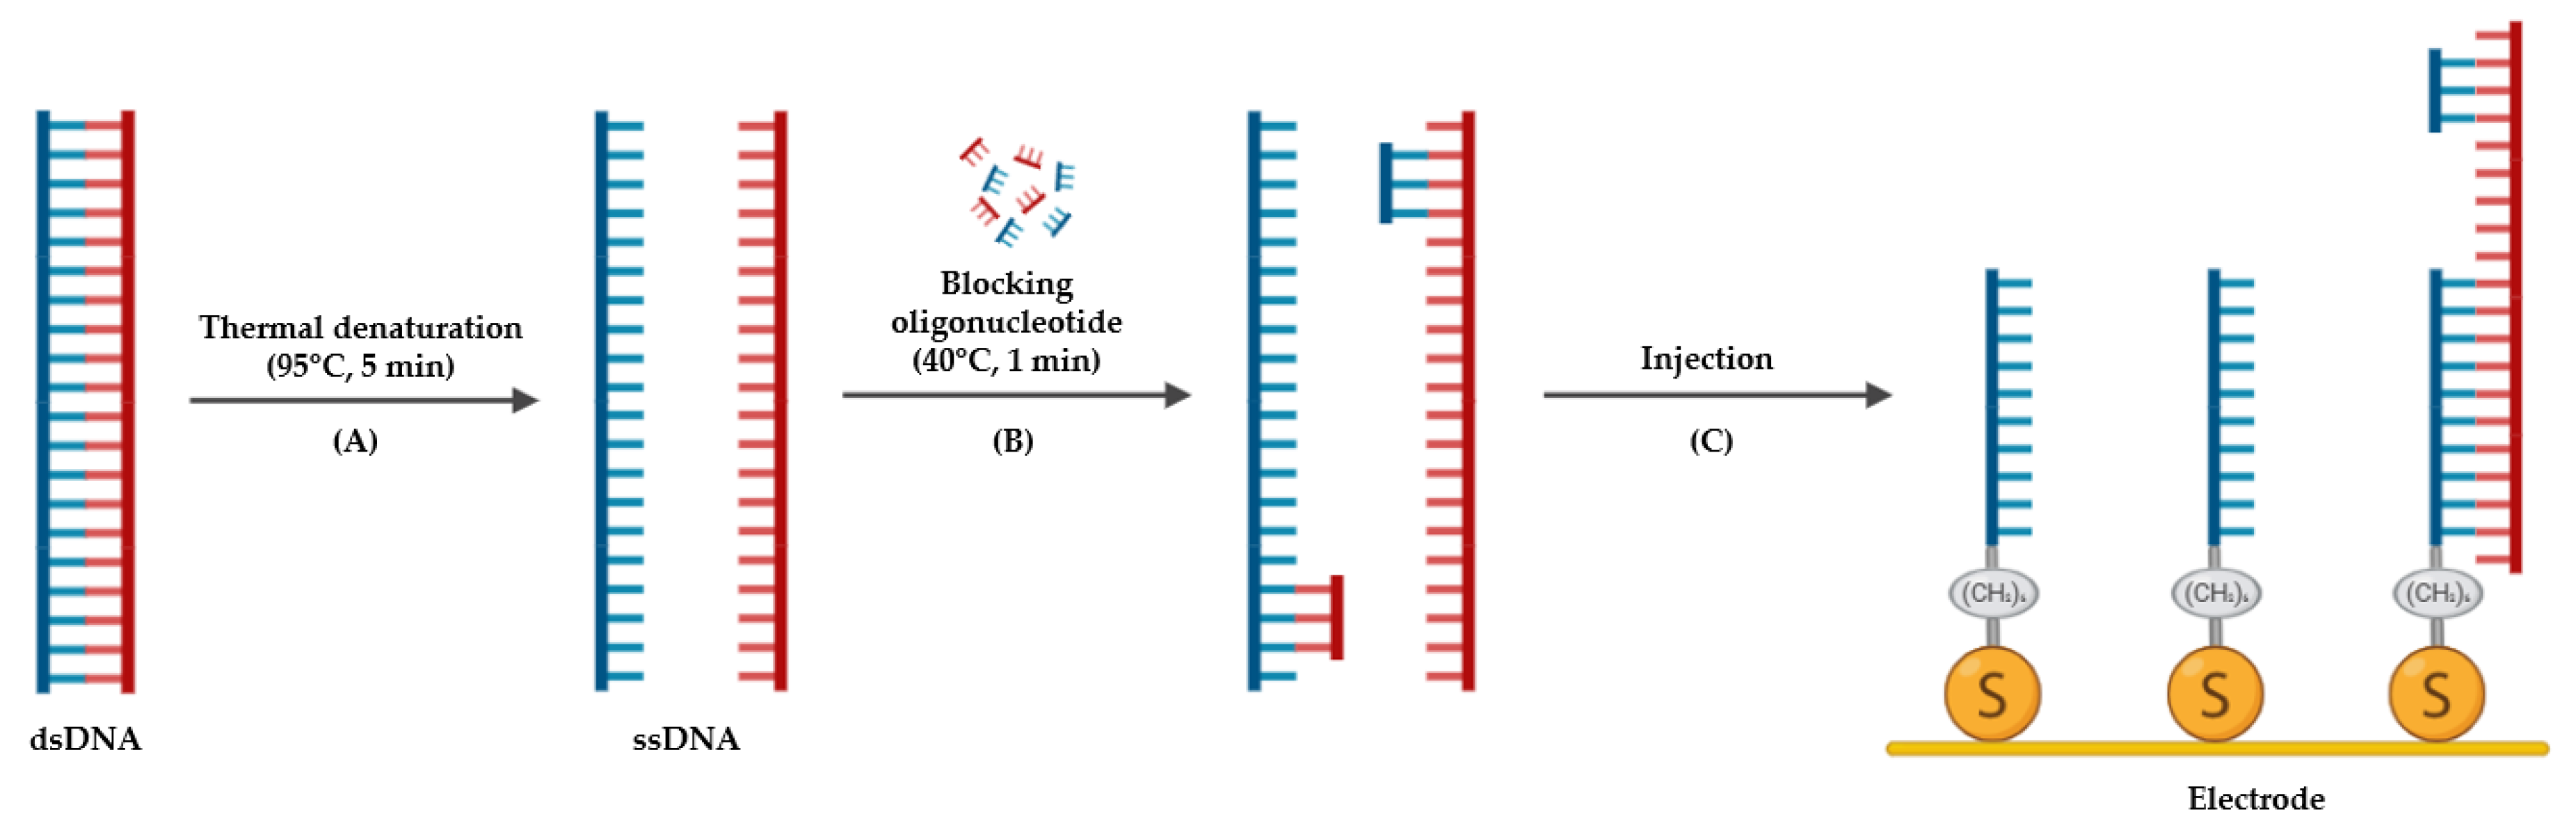
Figure 2.
Calibration curve for complementary target detection obtained from thiolated probe/ blocking thiol immobilization procedure.
Figure 2.
Calibration curve for complementary target detection obtained from thiolated probe/ blocking thiol immobilization procedure.
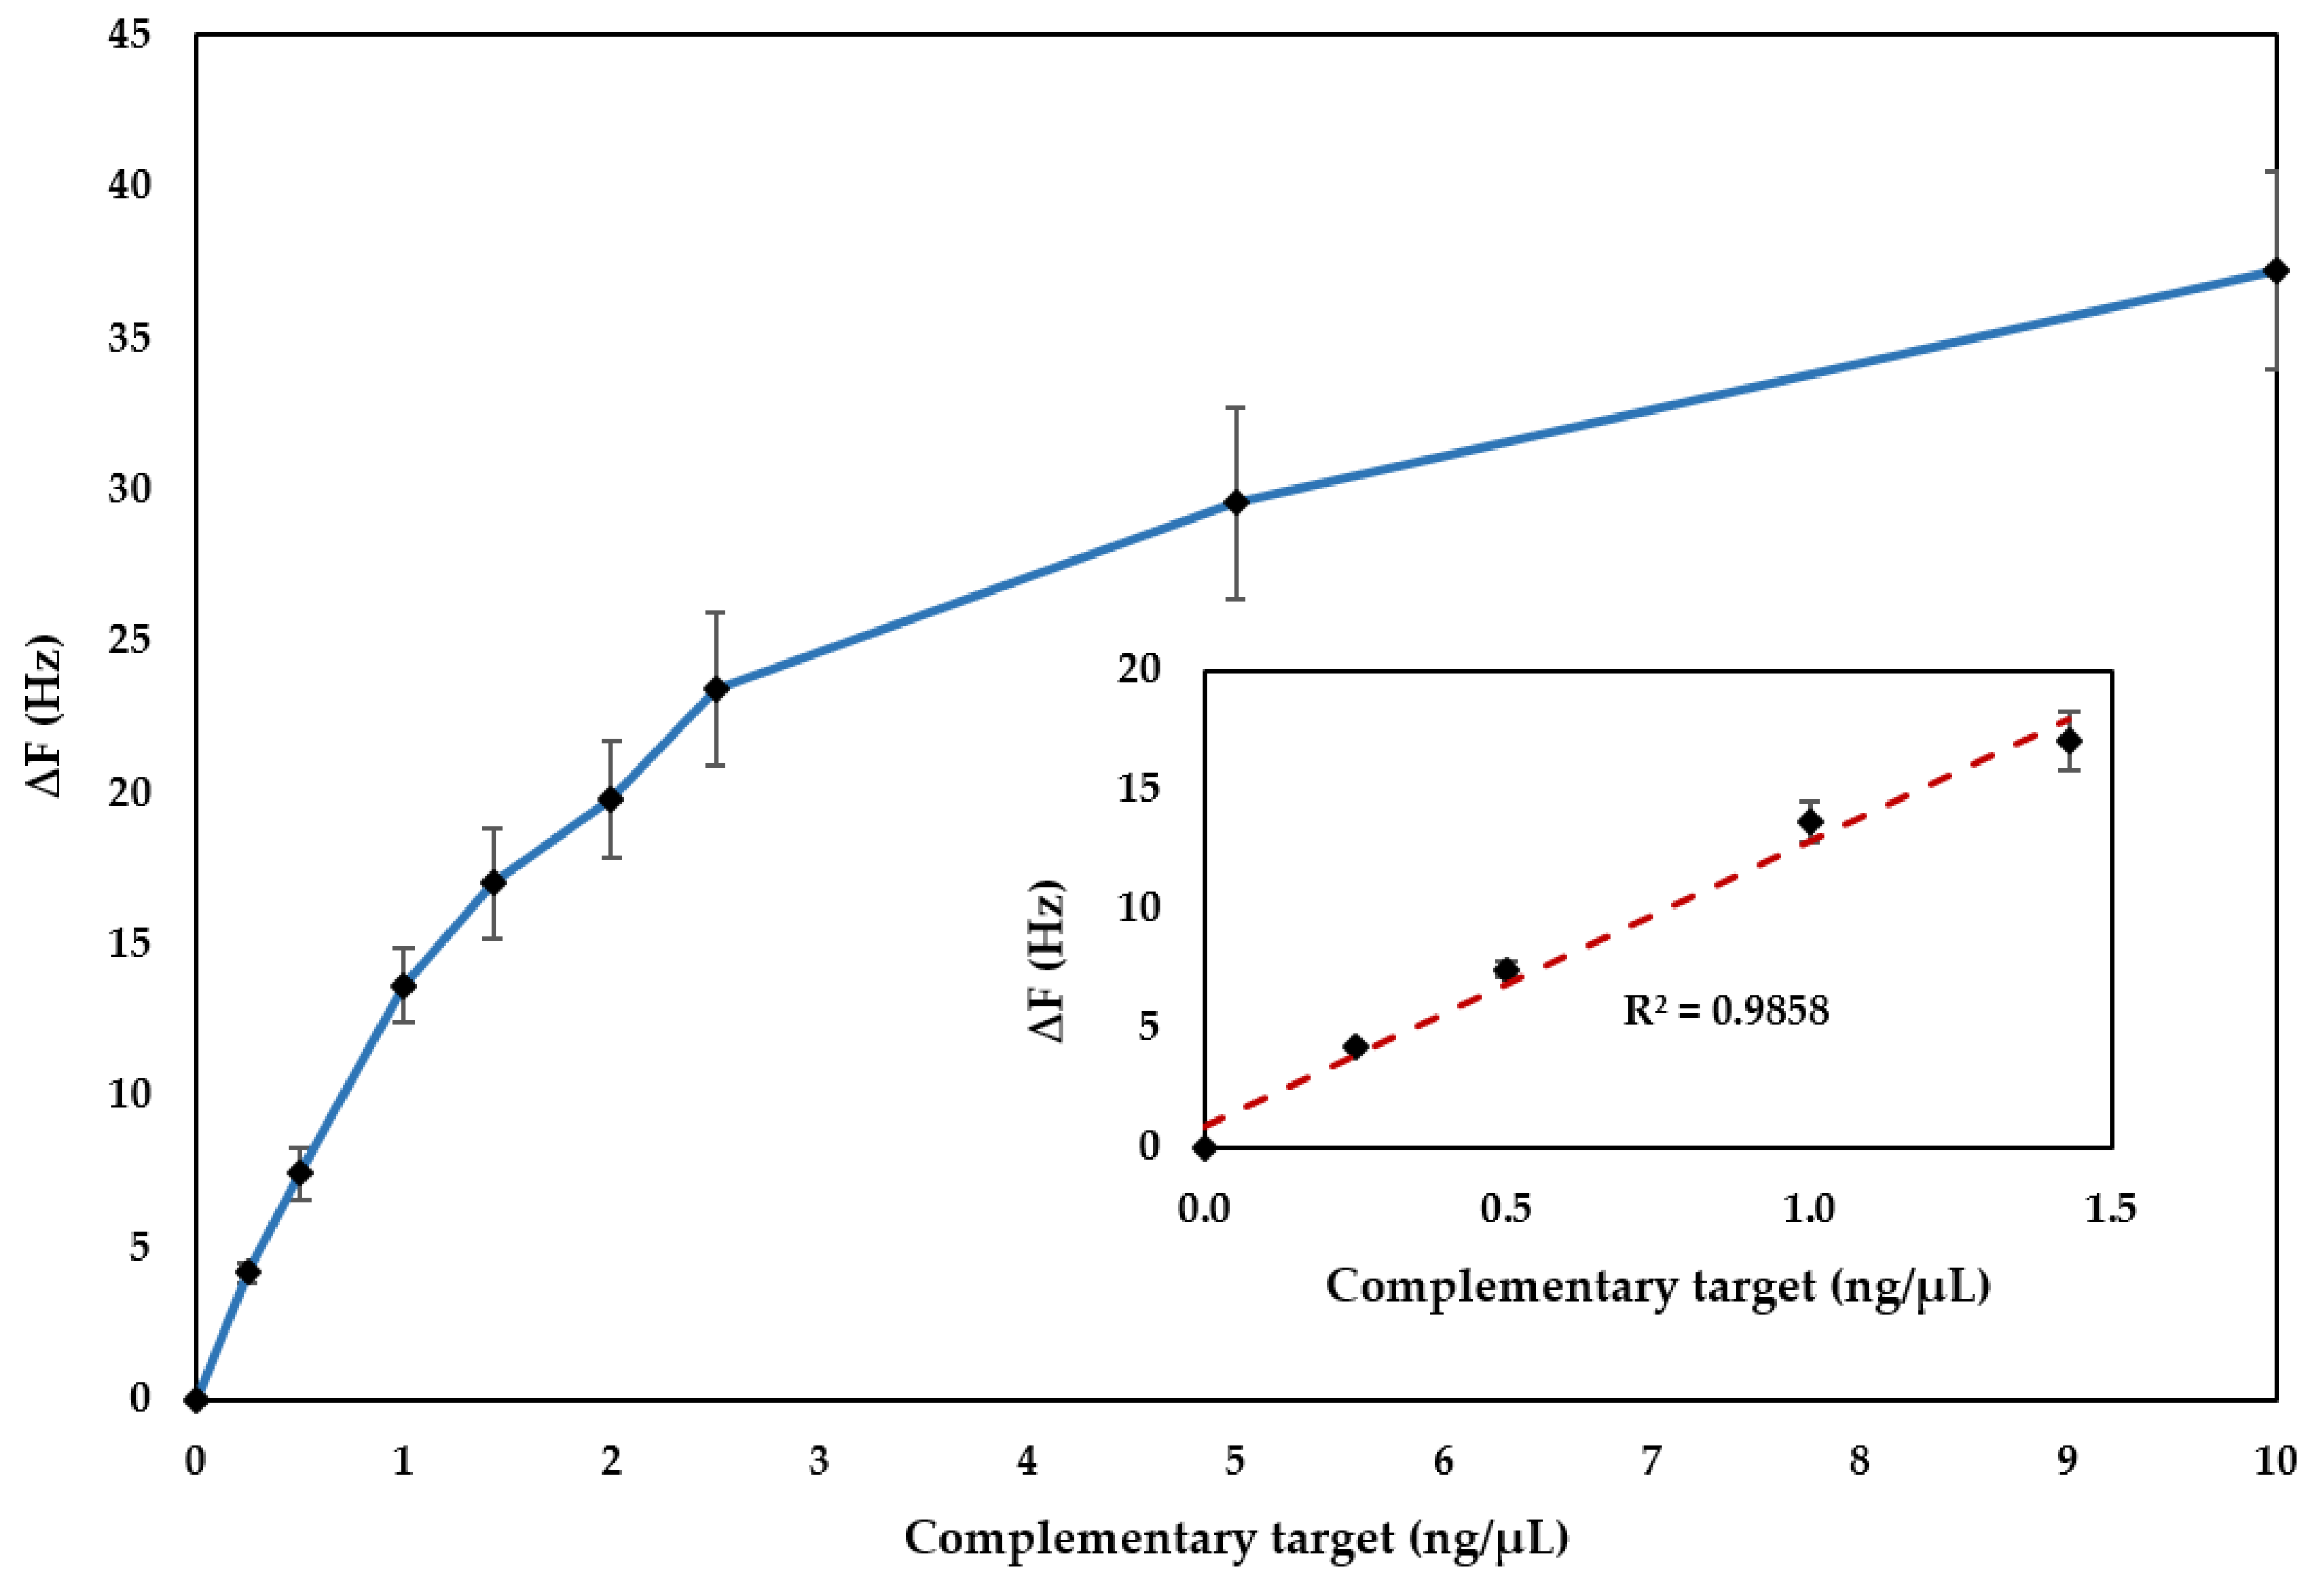
Figure 3.
Agarose gel electrophoresis of genomic DNA extracted from transgenic carioca bean seeds using the commercial kits ZymoBIOMICS, DNeasy Plant Pro and DNeasy mericon Food.
Figure 3.
Agarose gel electrophoresis of genomic DNA extracted from transgenic carioca bean seeds using the commercial kits ZymoBIOMICS, DNeasy Plant Pro and DNeasy mericon Food.
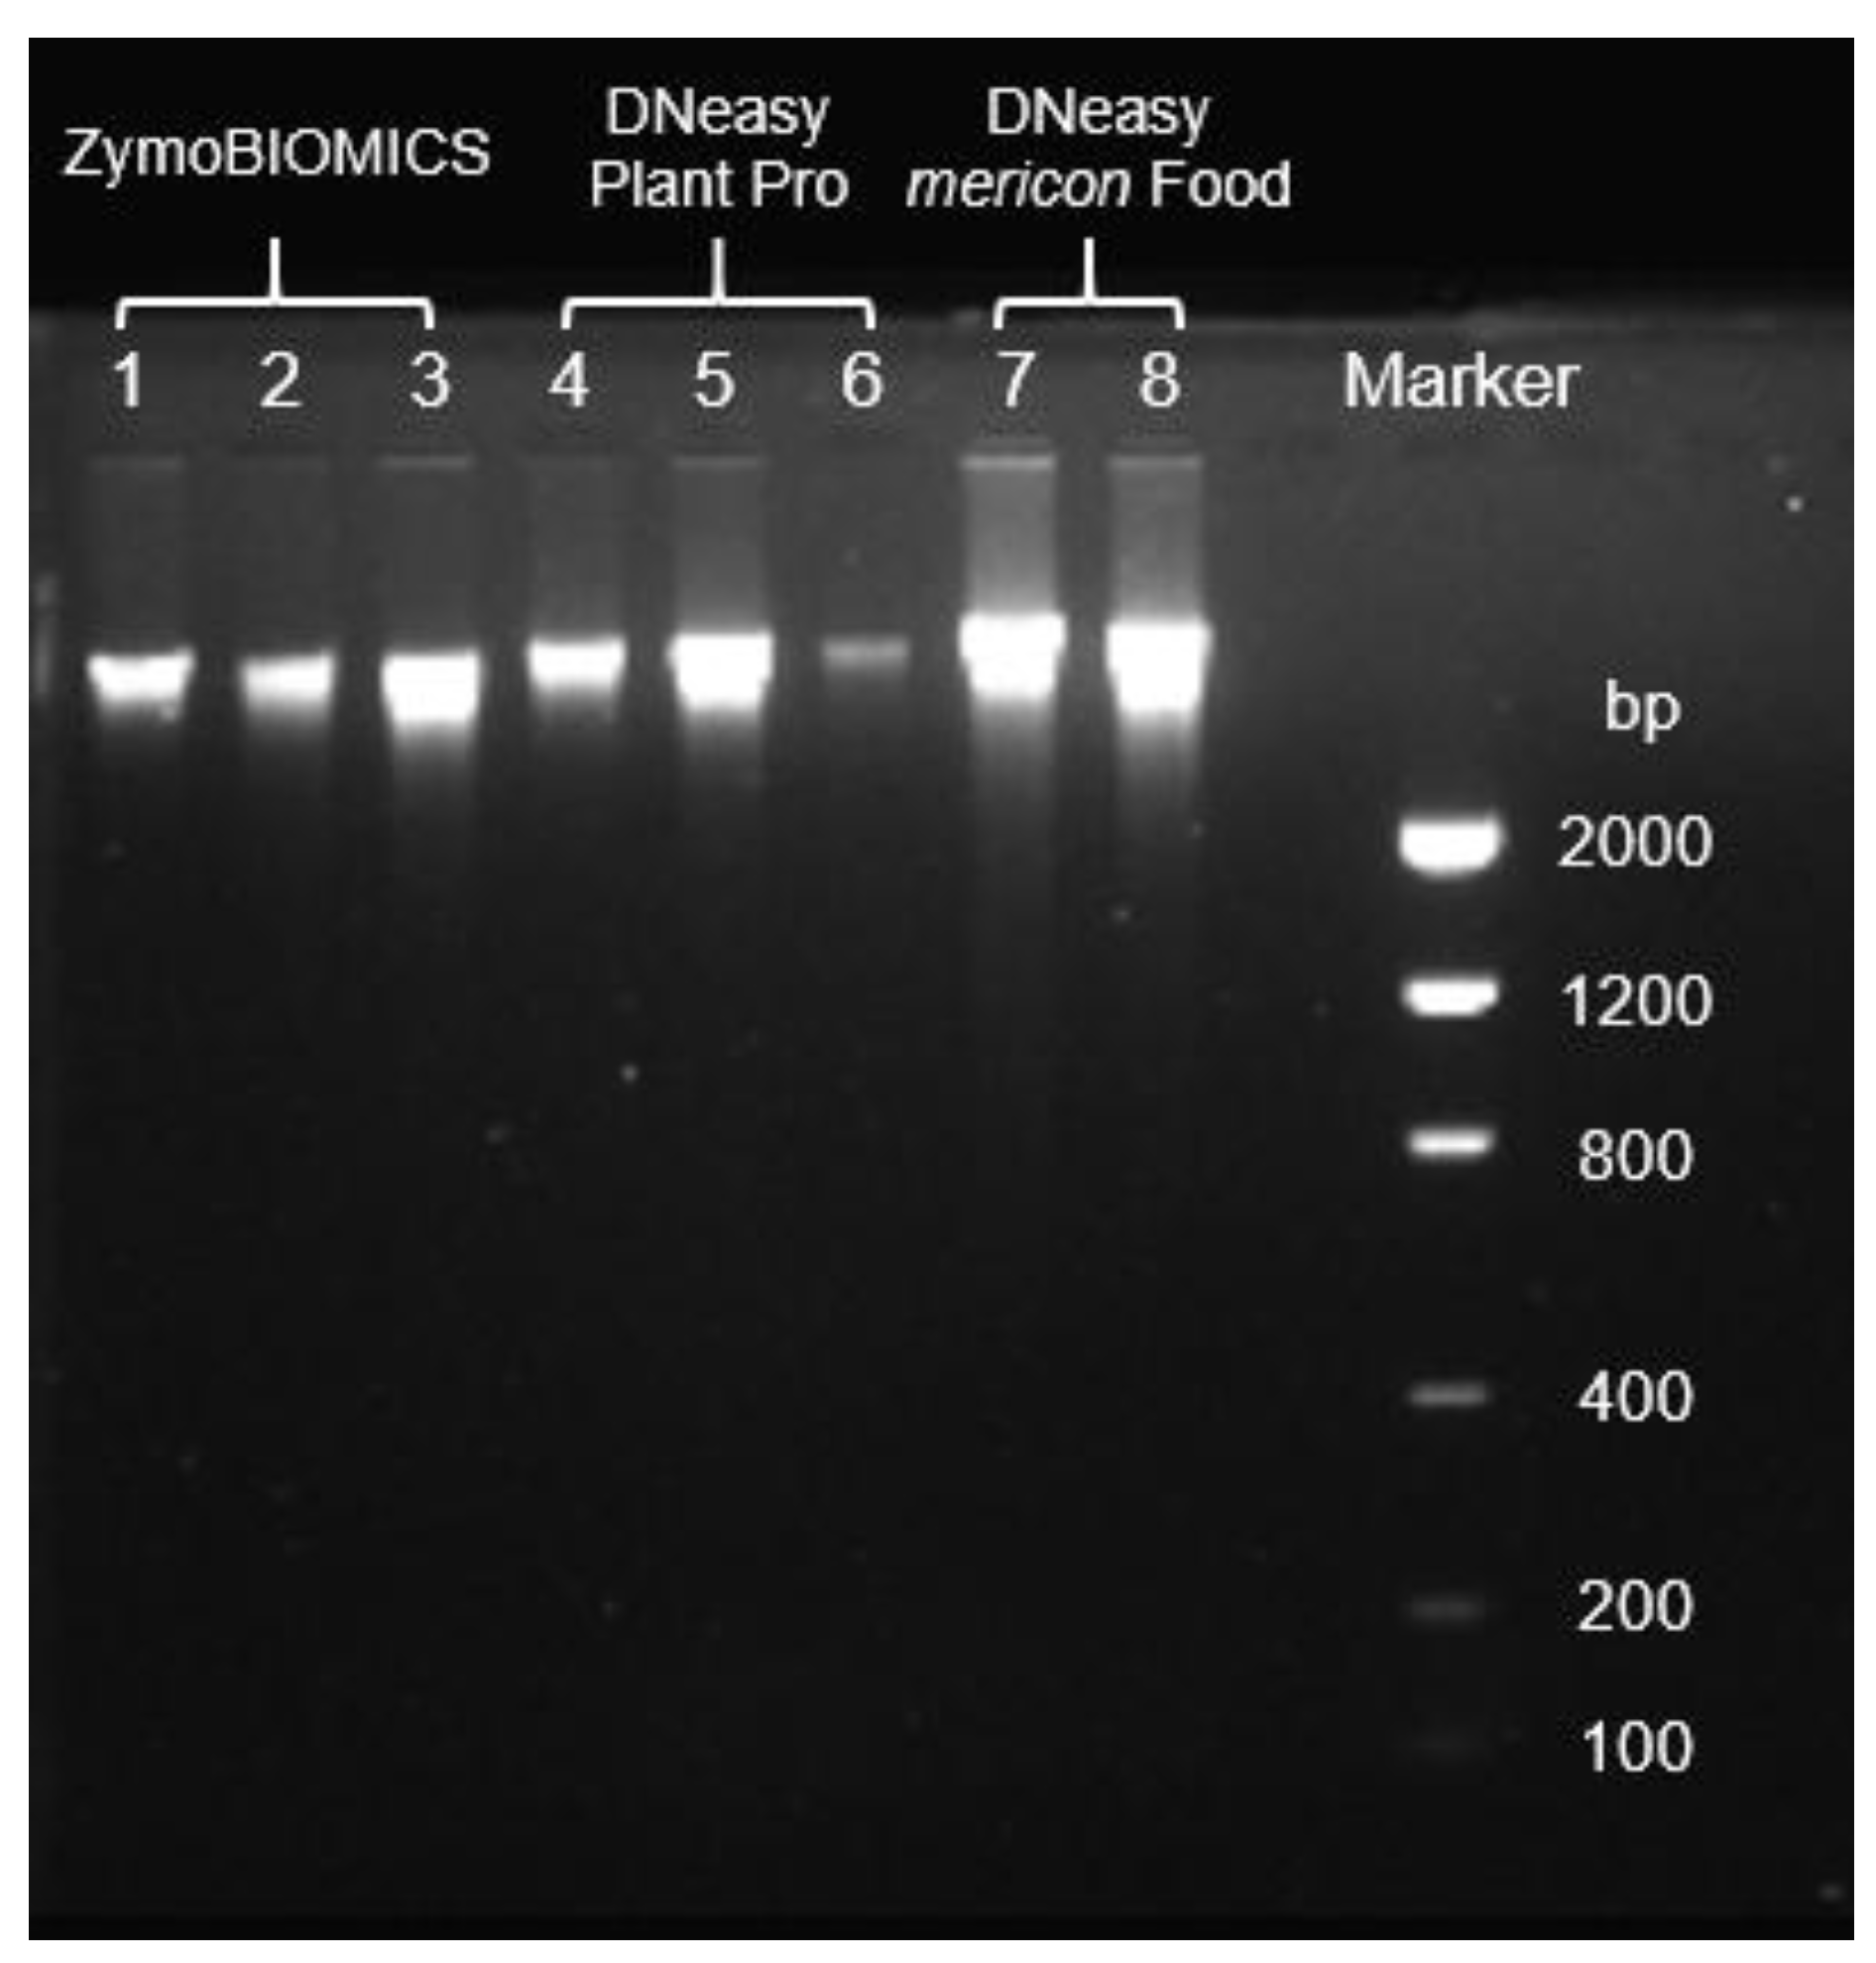
Figure 4.
Percentage retention of the analytical signal after two regeneration/hybridization cycles.
Figure 4.
Percentage retention of the analytical signal after two regeneration/hybridization cycles.
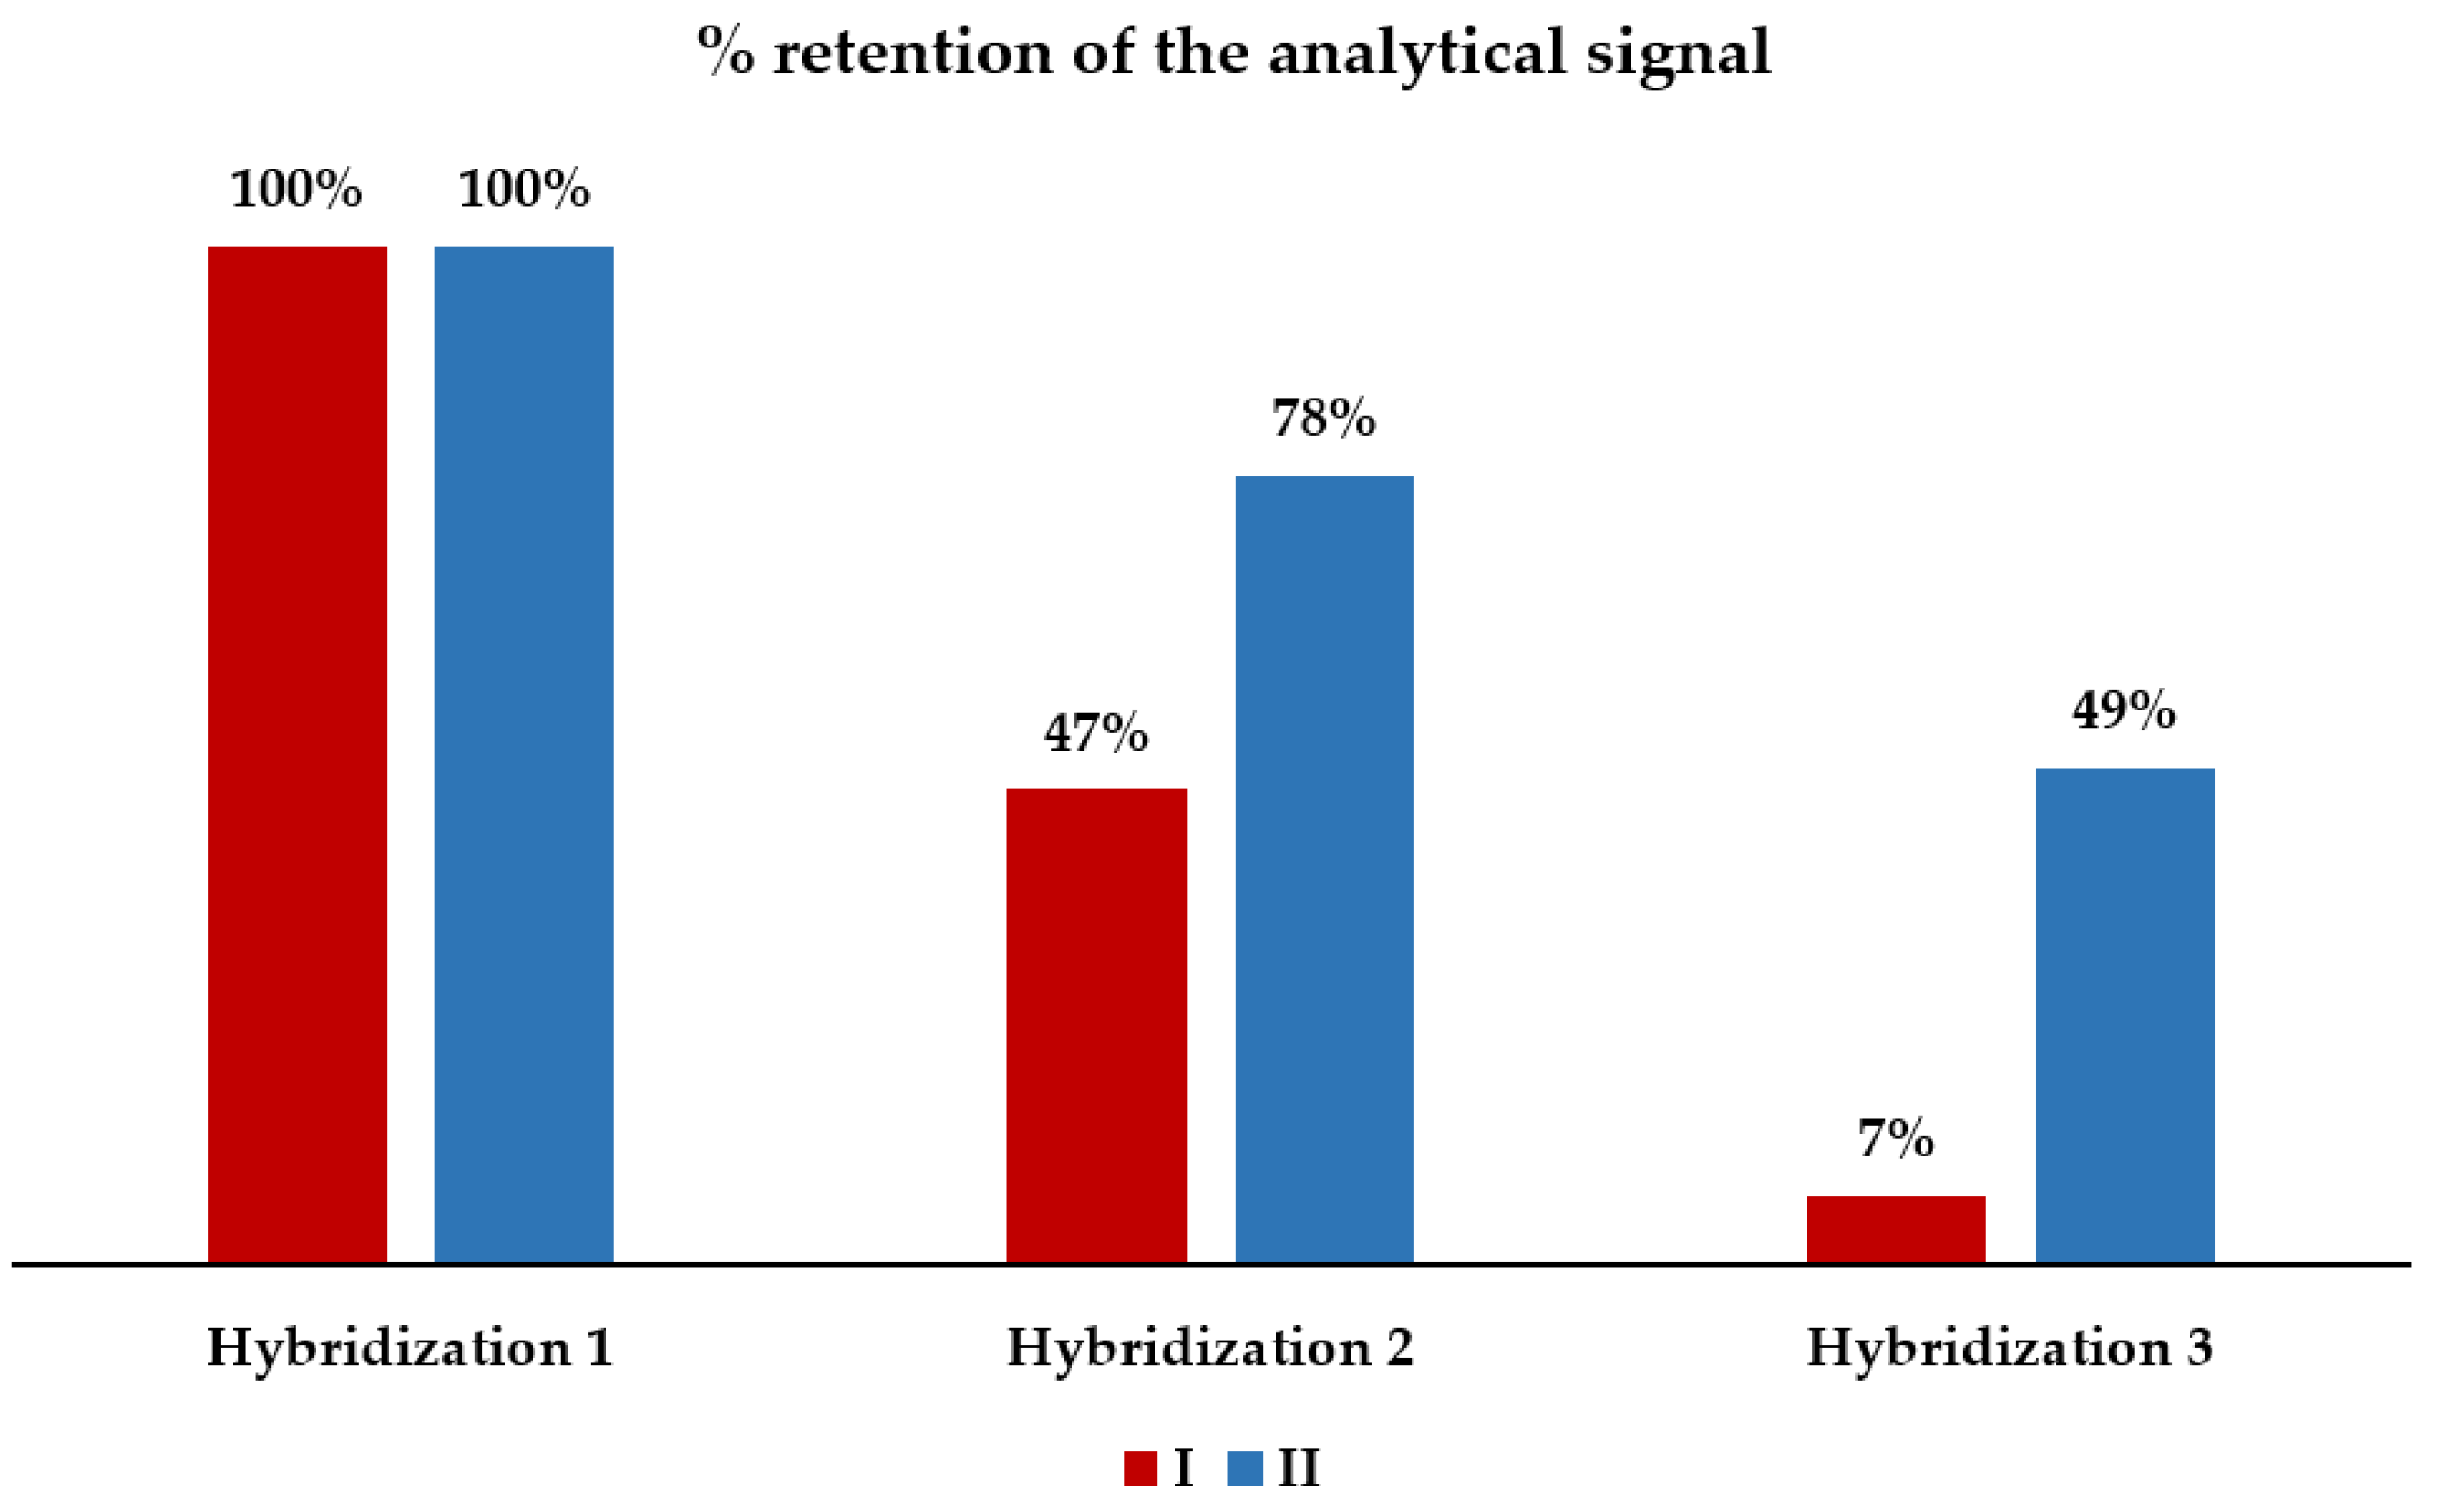

Table 1.
Synthetic oligonucleotide sequences used in this study.
| Elements | Sequence |
|---|---|
| Probe | 5′ HS-(CH2)6 - ATGCGGCATCCGAAGCATTGAATGC 3′ |
| Complementary target | 5’ GCATTCAATGCTTCGGATGCCGCAT 3’ |
| Non-complementary 1 | 5’ TTGATGACATCGCACCGCACTATCT 3’ |
| Non-complementary 2 | 5’ AGCGGCACCTCTCCCGAAATAATCA 3’ |
| Blocking oligo 1 | 5’ ATATTCACAA 3’ |
| Blocking oligo 2 | 5’ TGCATGGCTT 3’ |
Table 2.
Results of gDNA analysis using the NanoDrop spectrophotometer.
| N | gDNA Extraction Kit | ng/µL | A260/280 | A260/A230 |
|---|---|---|---|---|
| I | ZymoBIOMICS DNA Miniprep | 59 ± 9 | 1.95 ± 0.00 | 1.49 ± 0.07 |
| II | DNeasy Plant Pro | 52 ± 20 | 1.86 ± 0.03 | 0.13 ± 0.06 |
| III | DNeazy mericon Food | 127 ± 16 | 1.85 ± 0.04 | 1.28 ± 0.00 |
Disclaimer/Publisher’s Note: The statements, opinions and data contained in all publications are solely those of the individual author(s) and contributor(s) and not of MDPI and/or the editor(s). MDPI and/or the editor(s) disclaim responsibility for any injury to people or property resulting from any ideas, methods, instructions or products referred to in the content. |
© 2026 by the authors. Licensee MDPI, Basel, Switzerland. This article is an open access article distributed under the terms and conditions of the Creative Commons Attribution (CC BY) license.
Copyright: This open access article is published under a Creative Commons CC BY 4.0 license, which permit the free download, distribution, and reuse, provided that the author and preprint are cited in any reuse.


