Submitted:
15 February 2026
Posted:
17 February 2026
You are already at the latest version
Abstract
The paper presents an analysis of the risk of failure of port structures in a modern seaport due to vessel impacts. The analysis addresses potential damage related to port maneuvers of self-maneuvering vessels and possible risk reduction options that can be applied to enhance port resilience. The proposed system model—including ship, port infrastructure and environment—enabled the observation of both implemented and anticipated future risk reduction measures. The analysis was carried out using the ferry terminal in the large Polish Port of Gdynia as a case study. A Bayesian influence diagram—including decisions related to the implementation of risk reduction options—was used to determine the total risk associated with ro-pax ferry port calls. Sustainable risk management led to the implementation of a cloud-based monitoring system and, subsequently, to the design of a new terminal in line with the green port concept. A comparative risk assessment for the two locations demonstrated improved safety and reduced environmental pollution in the new Public Ferry Terminal, primarily due to reduced spatial risk and the implementation of cold-ironing technology in the new terminal. The potential future implementation of an automated mooring system was also discussed.
Keywords:
sustainable risk management
; seaport infrastructure resilience
; Bayesian-based risk analysis
1. Introduction
Sustainable risk management involves actions that ensure the long-term success of a seaport. This process encompasses hazard identification, risk assessment, as well as the prevention and mitigation of adverse events. An important element in the risk assessment loop is management policy. Cooperation between the Port Authority, policymakers, and industry stakeholders at various levels—often supported by AI-based logistics optimization—ensures the efficient operation of a sustainable and resilient port system [1,2].
Resiliency is defined as a port’s ability to resume normal operations at pre-disruptive performance levels [3]. This refers to the port’s capacity to withstand and recover from disruptive events such as natural disasters, cyber threats, and supply chain disruptions. It requires the implementation of proactive measures such as crisis planning and operational flexibility, in order to maintain critical services [4,5,6].
UNCTAD’s guidebook, Building Capacity to Manage Risk and Enhancing Resilience, defines “operational resilience” in terms of traditional risk identification and detection tools and links it to “strategic resilience”, which encompasses value-added activities that support risk management objectives [7].
Mohsendokhtey et al. [6] presented a critical review of research and development directions in seaport resilience analyses. Resilience is primarily considered in the context of protecting seaports against the effects of both short-term and long-term adverse weather phenomena. Cuong et al. [8] incorporated disruptions such as a global pandemic into their innovative resilience planning strategy for seaport competitiveness.
Ensuring compliance with evolving international regulations and guidelines, including those of IMO (International Maritime Organization), IAPH (International Association of Ports and Harbors), and PIANC (The World Association for Waterborne Transport Infrastructure), port authorities’ business initiatives are closely linked to the reduction of GHG (greenhouse gas) emissions [9,10,11].
The green port concept involves the development of monitoring and reporting systems, improved equipment operation, intelligent energy management, infrastructure modernization, and extensive digitalization.
Sustainable risk management of damage to waterborne infrastructure addresses risks arising from a broad range of factors, including climate [12], supply chains related to ships calling at the port, and regulatory changes. Basically, it focuses on:
- prioritizing activities,
- measuring, monitoring, and reporting the condition of infrastructure,
- responding to failures,
- protecting against failures,
- mitigating the effects of failures.
The expected benefits of this process include not only increased resilience of port infrastructure, but also an enhanced reputation and new business opportunities that attract responsible investors.
Various technologies can be used to control emissions. Carbon emissions can be reduced by more than 50% when large vessels use a port-based electricity source (cold ironing) [9,13]. The possible reduction in carbon emissions resulting from the implementation of automatic mooring systems—which allow safe mooring operations without the use of ship power—can exceed 70%. For example, the Port of Santander in Spain reduced its carbon emissions by 77% [9]. Reducing ship speed from 24 knots to 8 knots in approach channels can proportionally decrease emission by more than 30% [14]. Speed reduction is also a risk mitigation measure related to ship maneuvering operations.
Land-based emissions in container and ferry terminals—which are usually comparable to those generated by maritime operations—can be reduced through the implementation of artificial intelligence-based optimization of logistics processes [1].
A proactive measure in sustainable risk management is digitalization. Port digital twins enable effective monitoring, maintenance, and planning of the further development of port infrastructure. Additional advantages include easy access to documentation presented in the form of a detailed 3D model, efficient information flow within the port, and a higher level of digitization of various processes, including infrastructure monitoring.
Online monitoring and reporting of technical condition are key to ensuring the resilience of marine structures. Considerations regarding damage to port infrastructure resulting from ship impacts mainly concern large, independently maneuvering vessels such as cruisers and ferries. The paper presents an example of the former ferry terminal in the Port of Gdynia, where a proven and effective monitoring method was applied to increase quay resilience and minimize the risk of its damage.
The Port of Gdynia is the main port of the Baltic-Adriatic Transport Corridor, one of nine corridors of the Trans-European Transport Network, with the Gdynia-Karlskrona Motorway of the Sea providing a ferry connection between Poland and Sweden.
It serves as an example of successful, long-term port development planning [15] and sustainable risk management of port infrastructure damage. In the case of ferry connections, the implementation of a prototype cloud-based system for monitoring ship-generated loads on the quay was crucial [17,19].
The next stage of development was the construction of a new Public Ferry Terminal for larger ships at a new location within the Port of Gdynia.
The Bayesian approach to determining the risk of damage to the quay at the ferry terminal in the Port of Gdynia, as proposed in the paper, enabled the construction of a Bayesian influence diagram in the form of a Bayesian Believe Network, considering the impact of decisions regarding the use of risk mitigation measures. The results indicate a significant reduction in risk following the implementation of a system for monitoring the impact of ships on seabed protection and quay structure [19]. However, even more important was sustainable management in line with the green port concept, including sustainable spatial planning and modern ferry operating systems that reduce harmful emissions.
2. Materials and Methods
2.1. Methods of Operation and Maintenance of the Quay
The methods of quay operation and maintenance depend on the policies and regulations of the port authority. Considering the assumed reliability of quay walls designed for a long service life, failure-free operation exceeding 50 years is expected; the durability of steel sheet piles is approximately 50 years, while concrete quay walls can exceed 100 years. Maintenance, repair and monitoring are key to achieving the designed service life. Proper maintenance of seabed protection near the quay wall is one of the most important factors influencing quay durability. The methods of operation and maintenance of quays and seabed protection are presented in Figure 1.
Common practice in ferry terminals involves planned prevention based on reports from divers’ inspections of quay walls and seabed protection, conducted at scheduled intervals. In exceptional cases, e.g., when permissible ship-generated loads are exceeded, inspections are carried out more frequently.
Assessing the current technical condition, based on the values of monitored parameters, requires measurement of stresses in the quay wall. In advanced systems, stress measurements are sent to a digital twin of the structure, enabling evaluation of the current condition and identification of necessary actions.
For seabed protection, only indirect measurement of propeller jet velocity over the seabed near the quayside [19] is possible. This type of measurement requires an online monitoring system with a warning alarm triggered when permissible values are exceeded.
An example of an effectively operating monitoring system at the ferry terminal in the Port of Gdynia is described in detail in the publications [17,19]. This cloud-based system for monitoring ship-generated loads allows for online measurements of pressure on the quay wall. The measurements and the resulting calculated propeller jet velocities are compared with permissible velocities above the seabed. If these values are exceeded, an alarm is triggered.
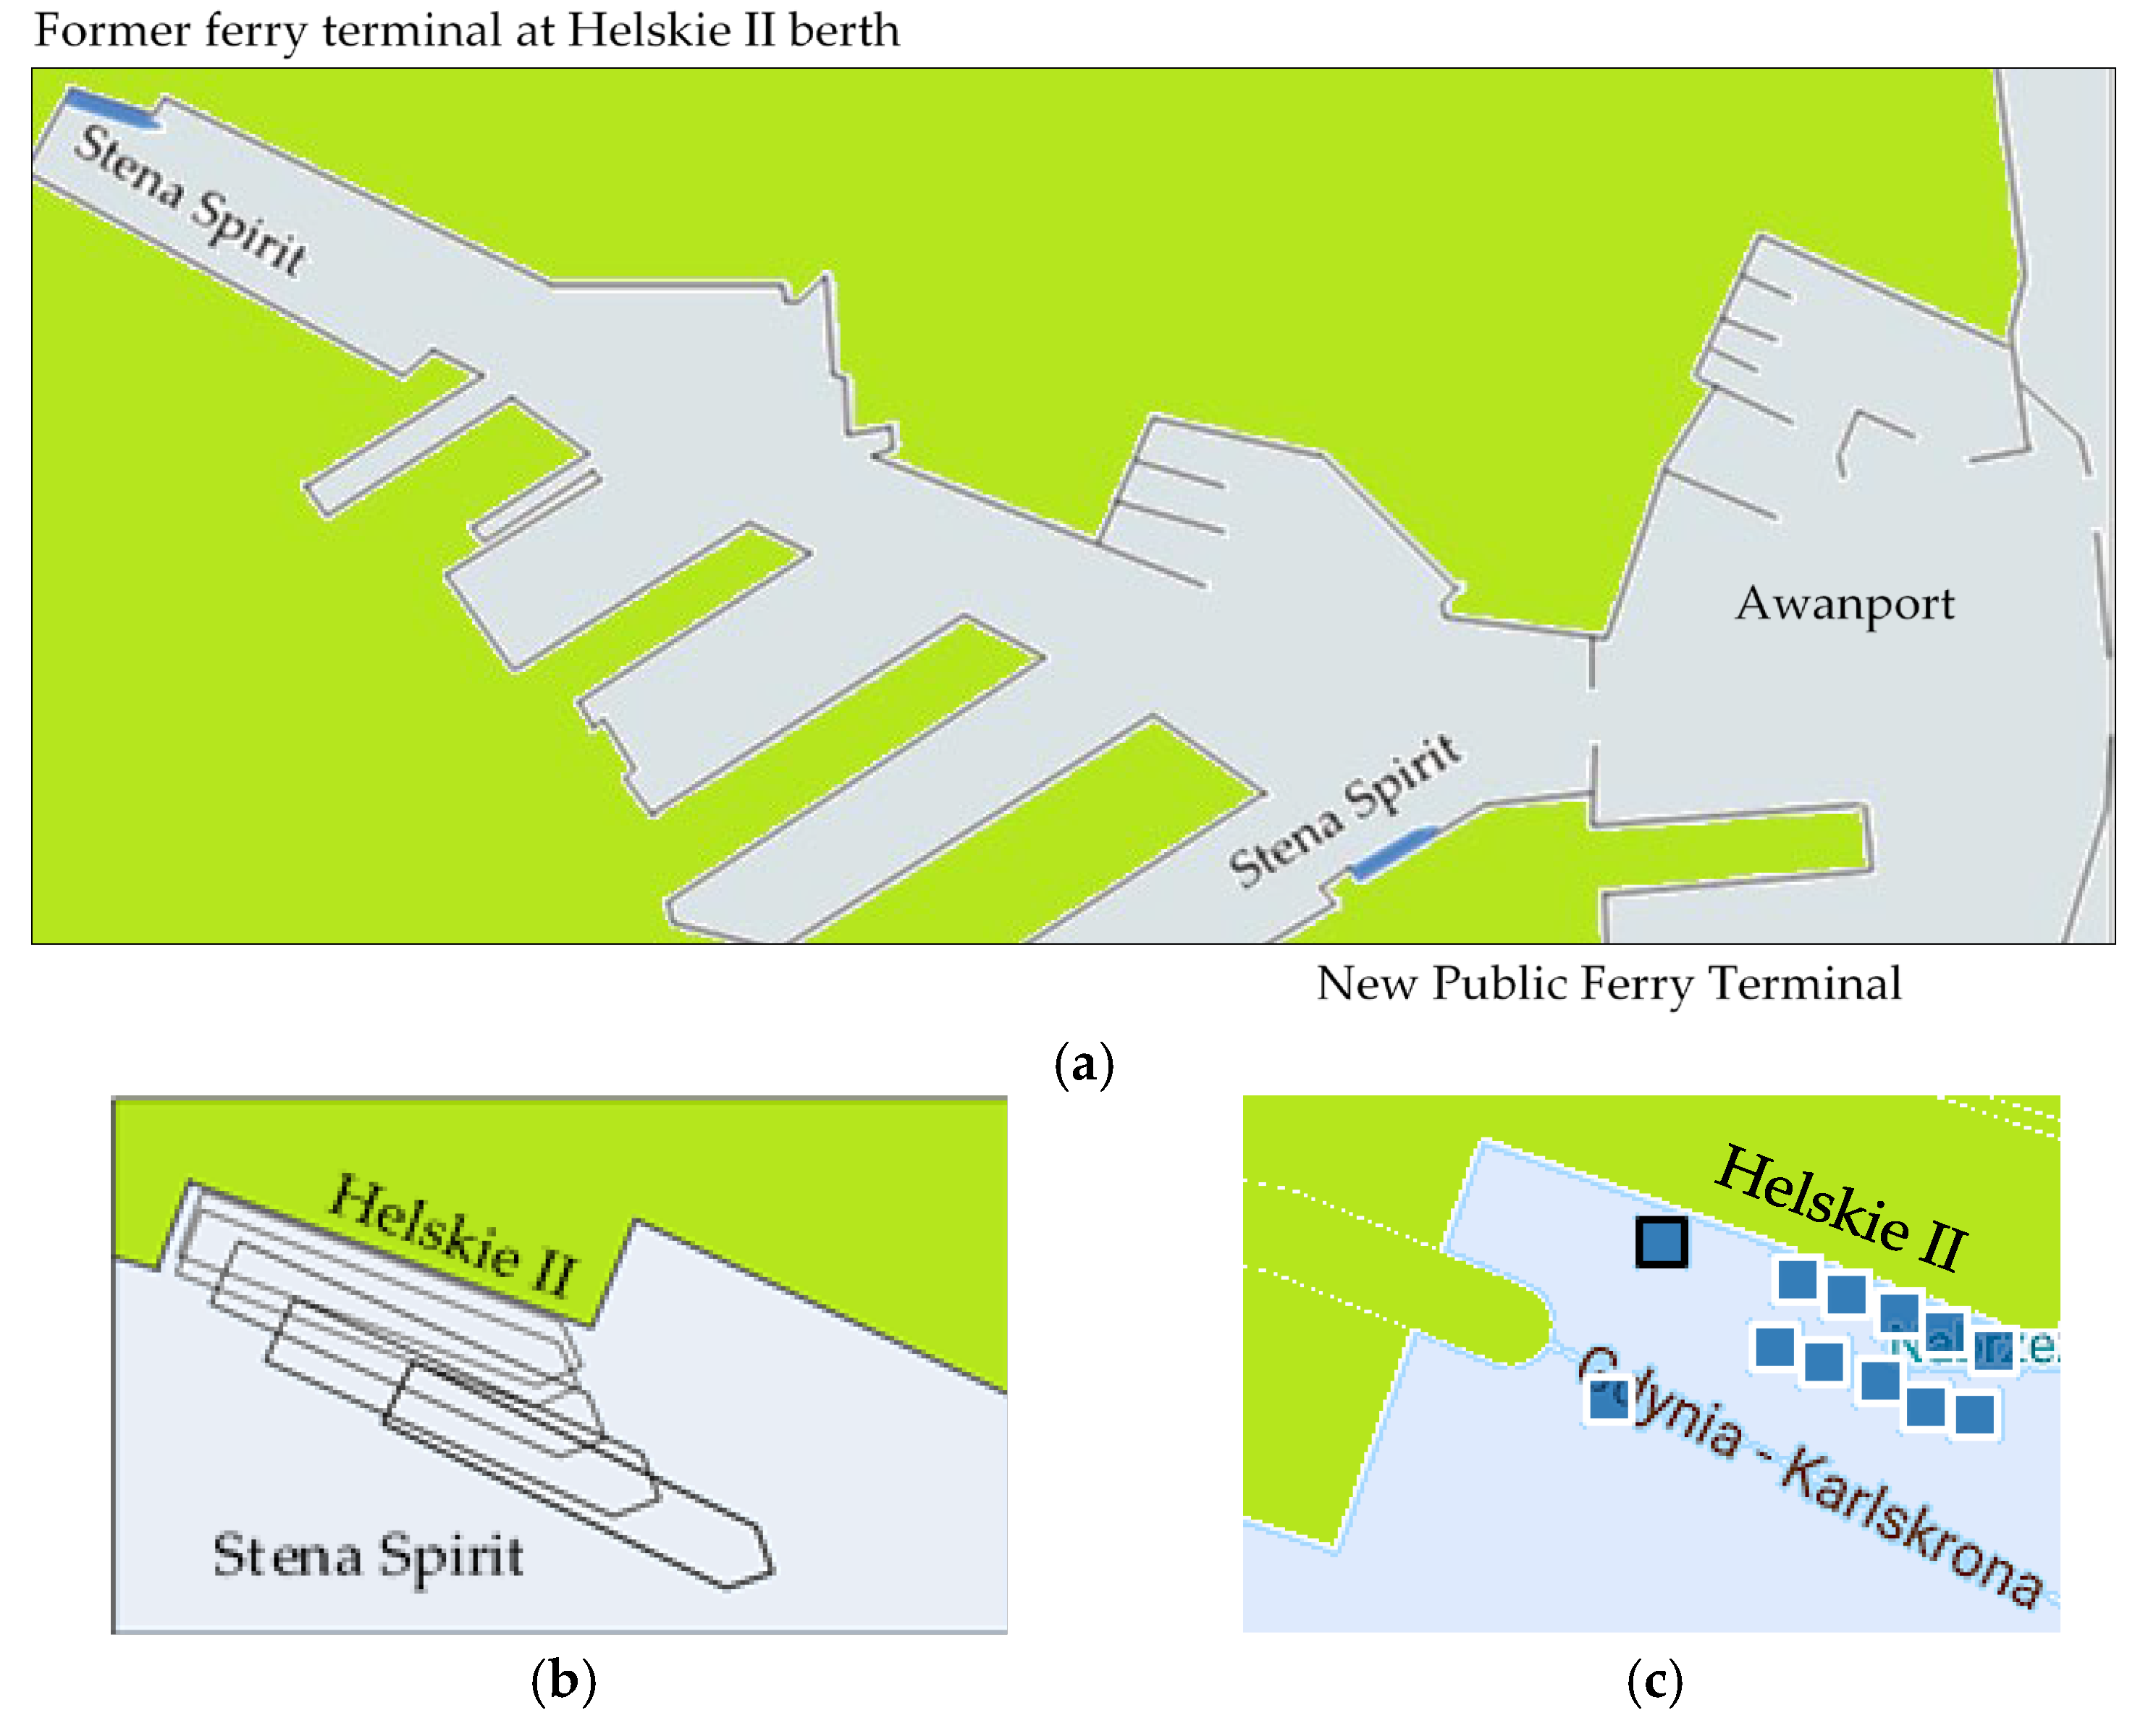
Figure 1(a) shows the 168 m long, and 28 m wide ro-pax ferry Stena Spirit moored at the Helskie II quay in the former ferry terminal and at the Polish quay in the new Public Ferry Terminal.
Figure 1(b) shows Stena Spirit being unberthed from the Helskie II quay with her actual positions recorded by AIS (Automatic Identification System) [20]. The application window of the E-QuayTracker cloud-based monitoring system for predicting propeller loads on the seabed [19], showing the quay near the ramp with marked positions of pressure meters installed on the quay wall, is presented in Figure 1(c).
Figure 2.
Ferry terminal in the Port of Gdynia: (a) former location at the Helskie II quay and the new Public Ferry Terminal at the Polskie quay; (b) actual positions of the ro-pax ferry Stena Spirit unberthing from the Helskie II quay recorded by AIS; (c) section of the Helskie II quay near the ramp with marked positions of pressure meters installed on the quay wall.
To determine the risk of port infrastructure failure, considering the impact of weather conditions and possible risk mitigation measures, including tugboats assistance and monitoring of propeller jets velocities, a Bayesian influence diagram was proposed.
2.2. Risk Modelling Using the Bayesian Influence Diagram
Risk modeling using Bayesian Believe Networks enables a proactive approach to safety by addressing threats for which no consequences have been observed or statistical methods cannot be applied. It can be based on both subjective assessment and empirical data. It allows for the calculation of resulting risk levels while simultaneously illustrating the relationships between events and presenting the mechanism of potential failures.
A Bayesian network is a directed acyclic graph in which the vertices (nodes) represent events or values of random variables. The edges (arcs) represent probabilistic measures of the relationships between these variables. If an arc leads from node A to node B, then event B is called the consequent or effect of event A, and A is called the antecedent or cause of event B. An arc starting at node A and ending at node B corresponds to the conditional probability . The absence of arcs connecting nodes A and B indicates that the events they represent are independent, which means that the probability of the product of these events is equal to the product of their probabilities. Bayesian network theory is based on Bayes’ theorem and the theorem of total probability. Inference from the network is analogous to inference from joint distribution, which is the product of nodal distributions.
If the probability of the product of events (1):
then (2):
Events form a Markov chain (3) if:
In computer programs, events can be replaced by the values of binary random variables Xi. These formulas then take the form of equation (4) and (5):
Introducing variables that represent risk control options into the network structure creates the Bayesian influence diagram. This diagram allows for the determination of the impact of risk control options on the safety of complex operations and can be used for both risk assessment and management. The risk measure is defined as the product of the probability of an event and its consequences, typically the costs resulting from accidents. By taking into account the costs associated with implementing specific risk reduction measures, the expected utility (EU) can be calculated. EU is the algebraic sum of costs at all utility nodes. This value provides a measure of risk from the perspective of economic efficiency.
3. Results
The Bayesian-based risk model presented for the operation of Stena Spirit at the old and new locations in the Port of Gdynia indicates a two-fold reduction in risk under assumed average wind conditions
3.1. A Bayesian-Based Risk Model for Hydrotechnical Structure Failures in the Context of Ferry Maneuvering Operations
The presented example of a Bayesian based risk model for hydrotechnical structure failure during ship maneuvering operations in the Port of Gdynia was developed using the Hugin Expert program [21]. The random variables (chance nodes) corresponding to subsequent states of the system—ship, port infrastructure, environment—are defined as vessel navigation along the approach fairway, passage through the port entrance, navigation along the port channel, turning in the turning basin, and mooring. The conditional probability of port infrastructure failure in the given state is computed based on the probabilities of failure in the previous states, considering wind conditions and decisions on the application of risk mitigation measures.
The conditional probabilities of transitions between system states were assumed based on expert opinion. Probabilities of hazardous wind conditions can be calculated using a hydrometeorological conditions identification model that incorporates current weather conditions and environmental dynamics models. In the presented example, these probabilities were based on statistical data for the Port of Gdynia and expert opinion.
The computing algorithm used in the Bayesian influence diagram was the Prop Sum Normal (PSN) propagation method. This method updates all probabilities and the expected utility of chance nodes based on the decision nodes and input evidence. It calculates the total probability distribution of random variables, the risk values at utility nodes, and the total expected utility, that is, the total risk of failure during maneuvering operations.
The expected costs of risk reduction measures, depending on decisions regarding their use, included in the utility nodes, are as follows: Tug E – tugboat assistance on ship entering or leaving the port, Tug B – tugboat assistance on ship berthing or unberthing, Cloud-based system – cloud-based monitoring system of ship propeller-generated loads during berthing [19]. The cost of using the monitoring system was based on daily depreciation and maintenance expenses.
The costs of risk control options are presented in Table 1.
The consequences of failure in the considered example were assumed based on losses recorded during similar failures and expert opinions. Specifically, the consequences of grounding, collision in the approach fairway, or allision with port heads are €100,000; the consequences of allision with a hydrotechnical structure while passing through port channels or berthing at a quay are €10,000; and seabed protection failure due to propeller jets is €25,000.
The consequences of these failures are summarized in Table 2.
3.1.1. Influence Diagram of the Arrival of the Ro-Pax Ferry Stena Spirit Berthing at the Helskie II Quay in the Former Ferry Terminal
The Bayesian influence diagram developed for an example port call of the ro-pax ferry Stena Spirit berthing at the Helskie II quay in the former ferry terminal is presented in Figure 3.
The two possible states assumed in the probability distribution tables were Safe and ALARP (As Low as Reasonably Practicable). ALARP condition is related to the port’s operational window, which is typically limited by a maximum wind speed of 15-17 m/s (7 B) and the vessel’s ability to maneuver independently. At wind speeds close to this value, the decision to use tugboats as a risk reduction measure becomes crucial.
Figure 4 and Figure 5 present examples of calculating the joint probability distribution for 30% and 100% probability of a dangerous transverse wind direction, and 10% and 100% probability of a dangerous wind speed, respectively, without the use of any risk reduction measures, based on the PSN algorithm.
The loss values at utility nodes are the products of the total probability of failure and its consequences. The total value of expected utility is the algebraic sum of costs at all utility nodes.
The loss values serve as measures of the risk of failure. The absolute value of the total expected utility represents the losses corresponding to the risk of failure during a sequence of maneuvers performed by the vessel, considering the implemented risk reduction options.
Figure 6 shows an example of calculating the joint probability distribution for an assumed 100% probability of hazardous crosswind, with risk reduction measures applied, including tugboat assistance and a cloud-based monitoring system.
The risk of failure during the sequence of maneuvers, calculated for selected combinations of wind speed, wind direction, and applied risk reduction measures, is presented in Table 3.
3.1.2. Influence Diagram of the Arrival of the Ro-Pax Ferry Stena Spirit Berthing at the Polskie Quay in the New Public Ferry Terminal
The Bayesian influence diagram developed for an example port call of the ro-pax ferry Stena Spirit berthing at the new Public Ferry Terminal at the Polskie quay is presented in Figure 7.
The location of this terminal and the design of the berth allowed the network to be built without the “Port channel” chance node and “Monitoring” decision node.
Due to its proximity to the port entrance, the ferry can turn near the inner entrance and then berth moving astern. Monitoring of propeller jet velocities is not necessary in this case, because the seabed is protected with stone gabions, rather than with mattress made of large geotextile bags filled with sand, as in the case of the Helskie II quay.
Figure 8 and Figure 9 present examples of calculating the joint probability distribution for 30% and 100% probability of transverse wind direction, and 10% and 100% probability of hazardous wind speed, respectively, without the use of any risk reduction measures, based on the PSN algorithm.
Figure 10 presents examples of calculating the joint probability distribution for an assumed 0% probability of hazardous crosswind, without any risk reduction measures applied.
The risk of failure of hydrotechnical structures during the sequence of maneuvers, calculated for selected combinations of wind speed, wind direction, and applied risk reduction measures, for the ro-pax ferry Stena Spirit berthing at the Public Ferry Terminal ,is presented in Table 4.
The absolute difference in risk calculated for both locations is equal to (6):
where: EUH and EUP are the risks calculated for the Helskie II quay and the Public Ferry Terminal, respectively, and ΔEU represents the absolute difference in risk between the two locations.
The relative percentage difference δEU (7) is equal to:
The results of the infrastructure failure risk due to ferry maneuvering operations at the two locations are compared in Table 5.
Comparing the results of the calculations, it was confirmed that the risk of infrastructure failure at the previous terminal location, under the assumed most frequently occurring wind conditions, was 49% higher than at the new location. Installing a monitoring system at the former location at the Helskie II quay reduced this difference to only 7%.
At the limit values of hazardous crosswinds, without any risk reduction measures applied, this difference was 14%, and with risk reduction measures in place, it decreased to 4%. Under favorable weather conditions with a 0% probability of hazardous winds, the risk is mainly related to failure of seabed protection. In this case, the differences were 99.996% without the monitoring system and 98.7% with the monitoring system
4. Discussion
The sustainable development of ferry connections in the Port of Gdynia, in line with the green port concept, involved designing a larger ferry terminal in a better location, and with improved road connections to communication routes. The new Public Ferry Terminal located near the port entrance allows easier and safer maneuvering than the previous location, where ferries had to pass through the entire port. It also imposes less restriction on port capacity. Port calls are shortened by approximately 40 minutes per call., and the shorter route reduces both noise and pollutant emissions.
The design of the new terminal included the possibility of installing a monitoring system for ship propeller-generated loads. However, this system has not been implemented at the current stage of operation due to the greater resistance of the seabed protection against propeller jets. In the case of geotextile mattresses made from sand-filled bags connected by cables, damage to one or more of these elements can cause significant damage if permissible propeller jet velocities are subsequently exceeded. The installation of such a system would improve quay structural resilience by enabling rapid response and repair of minor damage. More careful maneuvering by the Masters, informed of the continuous load measurements, also contributed to improved resilience [19].
The introduction of an onshore power supply system (cold ironing) for ferries docking at the Public Ferry Terminal has eliminated emissions, vibrations, and noise generated by onboard generators [18]. The shore-based electricity supply system includes a dedicated converter station built into a container, a cable line laid along the Polskie quay in a cable duct, cable sockets at three locations on the quay, and a mobile davit that moves along the quay and feeds the cable with the socket to the ship.
Much larger vessels have entered ferry service. The line is currently served by three vessels: the ro-pax ferry Stena Spirit and two newly built, modern E-Flexer ferries: Stena Estelle and Stena Ebba—the largest ferries operating on the Baltic Sea. These ferries can carry 1,200 passengers and 200 trucks, and their energy-efficient design allows the use of shore-based power system, reducing CO2 emissions.
Their parameters are also uniquely optimized. Measuring 240 m in length and 28 m in width, with a maximum draft of 6.4 m, the E-Flexer Stena Estelle is 80 m longer than Stena Spirit. Its maximum draft is 0.3 m less than that of Stena Spirit reducing its impact on seabed protection. The main particulars of these ferries are presented in Table 6.
The new E-Flexer ferries can be supplied with gas, enabling fuel conversion to methanol or LNG.
During port maneuvers, the main engine is the primary source of emissions. The maneuvering time is approximately 0.5 hours while entering the port and approaching the berth, and 0.5 hours while leaving the berth and departing the port. The ship remains at the berth for approximately one hour. The following maximum emission values were obtained for the ferry, assuming 50% engine power consumption and entry and departure times of 0.5 hours each [18]:
- Nox = 6.35 kg/h;
- SO2 = 4.2 kg/h;
- CO = 3.5 kg/h;
- PM10 = 1.9 kg/h.
To reduce exhaust emissions, the ship operates at approximately 10% of its main engine power on average.
To compare the maneuvering operations of ferries calling at the new Public Ferry Terminal, the sequence of port maneuvers is presented. The actual positions of the vessels while passing through the inner port entrance, turning, and approaching the quay, recorded from online AIS data [20], are shown in Figure 11: 11(a) Stena Spirit maneuvers, 11(b) Stena Estelle maneuvers.
In line with the green port concept, the use of an Automatic Mooring System (AMS) is also being considered. This would involve the installation of additional equipment to ensure safe and fast mooring operations. The use of this system would not eliminate the possibility of traditional mooring methods.
The planned implementation of AMS for berthing and unberthing without the use of traditional mooring equipment—such as ship winches and drums powered by the ship’s generators—could reduce carbon emissions [22,23]. The system can moor a vessel in 30 seconds by remote control, without the use of mooring lines. It enhances safety, reliability, economy, and efficiency, reduces the need for linesman’s work and improves quay utilization.
5. Conclusions
Integrating sustainable design principles into new developments and upgrading existing facilities with green technologies in the Port of Gdynia has proven effective, largely due to the implementation of a digital twin of the port’s infrastructure, encompassing quays, roads, and railways. The digitalization of infrastructure enables easier and more cost-effective planning, as well as continuous assessment of infrastructure conditions. The ability to digitally manage and evaluate situations using BIM (Building Information Modeling) and GIS (Geographic Information System) technologies streamlines these processes and reduces the risk of errors. During the implementation of the strategic investment in the Port of Gdynia described in the paper great attention was paid to environmental protection, implementation of smart access control systems and integrated environmental monitoring [18,24,25].
The example of sustainable risk management of seaport infrastructure damage caused by vessel impacts presented in the paper involved two key steps: the first consisted of updating the existing infrastructure considering its sensitivity to vessel operations, and the second involved the development of new infrastructure designed to satisfy the main purpose, i.e., long-term port development and resilience.
Funding
This research was funded by grant number WN/2025/PZ/03.
Conflicts of Interest
The author declares no conflicts of interest.
Abbreviations
The following abbreviations are used in this manuscript:
| AIS | Automatic Identification System |
| AMS | Automatic Mooring System |
| BIM | Building Information Modeling |
| CHG | Greenhouse Gas Emissions |
| GIS | Geographic Information System |
| IAPH | International Association of Ports and Harbors |
| IMO | International Maritime Organization |
| PIANC | The World Association for Waterborne Transport Infrastructure |
| UNCTAD | United Nations Conference on Trade and Development |
References
- Vaca-Cabrero, J.; Domínguez Rastrojo, J.; GonzálezCancelas, N.; Camarero-Orive, A. Enhancing Sustainability in Port Infrastructure through Innovation: A Case Study of the Spanish Port System. Sustainability 2025, 17, 2593. [Google Scholar] [CrossRef]
- Brooke, J.; Giovando, J.; Bessone, G.; Kempmann, K. Climate Change Costs to Ports and Waterways. Scoping the Business Case Assessment for Investment in Adaptation. Permanent Task Group for Climate Change, PIANC Technical Note No. 2 – 2024.
- Gharehgozli, A. H.; Mileski, J.; Adams, A.; von Zharen, W. Evaluating a “wicked problem”: A conceptual framework on seaport resiliency in the event of weather disruptions. Technological Forecasting and Social Change 2017, 121, 65–75. [Google Scholar] [CrossRef]
- Balbi, A.; Kammouh, O.; Cimellaro, G.P.; Repetto, M.P. Resilience framework for sea-port infrastructure under extreme wind. Cities and Structures 2025, 4, 96–116. [Google Scholar]
- Balbi, A.; Repetto, M. P.; Kammouh, O.; Cimellaro, G.P. Resilience Framework for Seaport Infrastructure. In book: Theory and Application Maintenance, Safety, Risk, Management and Life-Cycle Performance of Bridges; Available online: https://www.taylorfrancis.com/chapters/edit/10.1201/9781315189390-262/resilience-framework-seaport-infrastructure-theory-application-balbi-repetto-kammouh-cimellaro.
- Mohsendokht, M.; Kontovas, C.; Chang, C. H.; Qu, Z.; Li, H.; Yang, Z. Resilience analysis of seaports: a critical review of development and research directions. Maritime Policy & Management 2025, 1–36. [Google Scholar] [CrossRef]
- Building Capacity to Manage Risks and Enhance Resilience. Resilient Maritime Logistics UN Trade and Development (UNCTAD) guidebook. Available online: https://resilientmaritimelogistics.unctad.org/guidebook/21-defining-port-resilience (accessed on 04.02.2025).
- Cuong, T.N.; You, S.-S.; Long, L.N.B.; Kim, H.-S. Seaport Resilience Analysis and Throughput Forecast Using a Deep Learning Approach: A Case Study of Busan Port. Sustainability 2022, 14, 13985. [Google Scholar] [CrossRef]
- Issa Zadeh, S.B.; López Gutiérrez, J.S.; Esteban, M.D.; Fernández-Sánchez, G.; Garay-Rondero, C.L. Scope of the Literature on Efforts to Reduce the Carbon Footprint of Seaports. Sustainability 2023, 15, 8558. [Google Scholar] [CrossRef]
- Zukowska, S. Concept of green ports. Case study of the seaport in Gdynia. Transport Geography Papers of Polish Geographical Society 2020, 23(3), 61–68. [Google Scholar] [CrossRef]
- Roubos, A. A.; de Lange, D.; Duffy, K.; van der Wal, E.; Jaspers Focks, D.-J.; Gavin, K. G. Towards sustainable port infrastructure by performing full scale pile load tests. In Proceedings of the 35th PIANC World Congress 2024; Cape Town, South Africa, Schoonees, J. S., Ed.; 29 April 2024; pp. 967–972. [Google Scholar]
- Cocuzza, E.; Ignaccolo, M.; Marinacci, C.; Ricci, S.; Twrdy, E.; Zanne, M. Sustainable Strategies for Ports and Maritime logistics: A Methodological Approach to Green Transition. Sustainability 2025, 17, 5739. [Google Scholar] [CrossRef]
- Kelmalis, A.; Dimou, A.; Lekkas, D.F.; Vakalis, S. Cold Ironing and the Study of RES Utilization for Maritime Electrification on Lesvos Island Port. Environments 2024, 11, 84. [Google Scholar] [CrossRef]
- Yun, P.; Li, X.; Wang, W.; Liu, K.; Li, C. A simulation-based research on carbon emission mitigation strategies for green container terminals. Ocean Eng. 2018, 163, 288–298. [Google Scholar] [CrossRef]
- Ziemska, M.; Plodzik, E.; Falkowska, M. Comparative Analysis of Ports Practices and Activities in the Tri-City and China. TransNav, the International Journal on Marine Navigation and Safety of Sea Transportation 2019, 13(3), 641–646. [Google Scholar] [CrossRef]
- Gerigk, M. Interference between land and sea logistics systems. Multifunctional building system design towards autonomous integrated transport infrastructure. TransNav, the International Journal on Marine Navigation and Safety of Sea Transportation 2022, 16(3), 439–446. [Google Scholar] [CrossRef]
- Abramowicz-Gerigk, T.; Burciu, Z.; Gerigk, M.K.; Jachowski, J. Monitoring of Ship Operations in Seaport Areas in the Sustainable Development of Ocean–Land Connections. Sustainability 2024, 16, 597. [Google Scholar] [CrossRef]
- Port of Gdynia. Available online: https://www. port.gdynia.pl (accessed on 4 February 2026).
- Abramowicz-Gerigk, T.; Gerigk, M.K.; Hapke, L.; Tetfejer, K. Cloud-based system for monitoring loads generated on the quay wall by ship propeller jets. Marine Structures 2024, 93, 103517. [Google Scholar] [CrossRef]
- VesselFinder. Available online: https://www.vesselfinder.com (accessed on 11.01.2026).
- HuginExpert. Available online: https://www.hugin.com/tag/bayesian-network (accessed on 03.11.2025).
- Yan, K.; Zhang, S.; Oh, J.; Seo, D.-W. A Review of Progress and Applications of Automated Vacuum Mooring Systems. J. Mar. Sci. Eng. 2022, 10, 1085. [Google Scholar] [CrossRef]
- Kołakowski, P.; Rutkowski, G.; Łebkowski, A. Reliability Evaluation of Electrochemical Energy Storage Systems Supplying the Ship’s Main Propulsion System. TransNav, the International Journal on Marine Navigation and Safety of Sea Transportation 2023, 17(1), 87–94. [Google Scholar]
- Kosek, W.; Chamier-Gliszczynski, N.; Królikowski, T. Smart ports in Poland: The digital transformation of maritime logistics on the example of the ports of Gdańsk, Gdynia, and Szczecin–Swinoujście. Procedia Computer Science 2025, 270, 5318–5328. [Google Scholar] [CrossRef]
- Devi, P.; Kizielewicz, B.; Guleria, A.; Shekhovtsov, A.; Wątróbski, J.; Królikowski, T.; Więckowski, J.; Sałabun, W. Decision Support in Selecting a Reliable Strategy for Sustainable Urban Transport Based on Laplacian Energy of T-Spherical Fuzzy Graphs. ENERGIES 2022, 15(14), 4970. [Google Scholar] [CrossRef]
Figure 1.
Methods of operation and maintenance of quays.
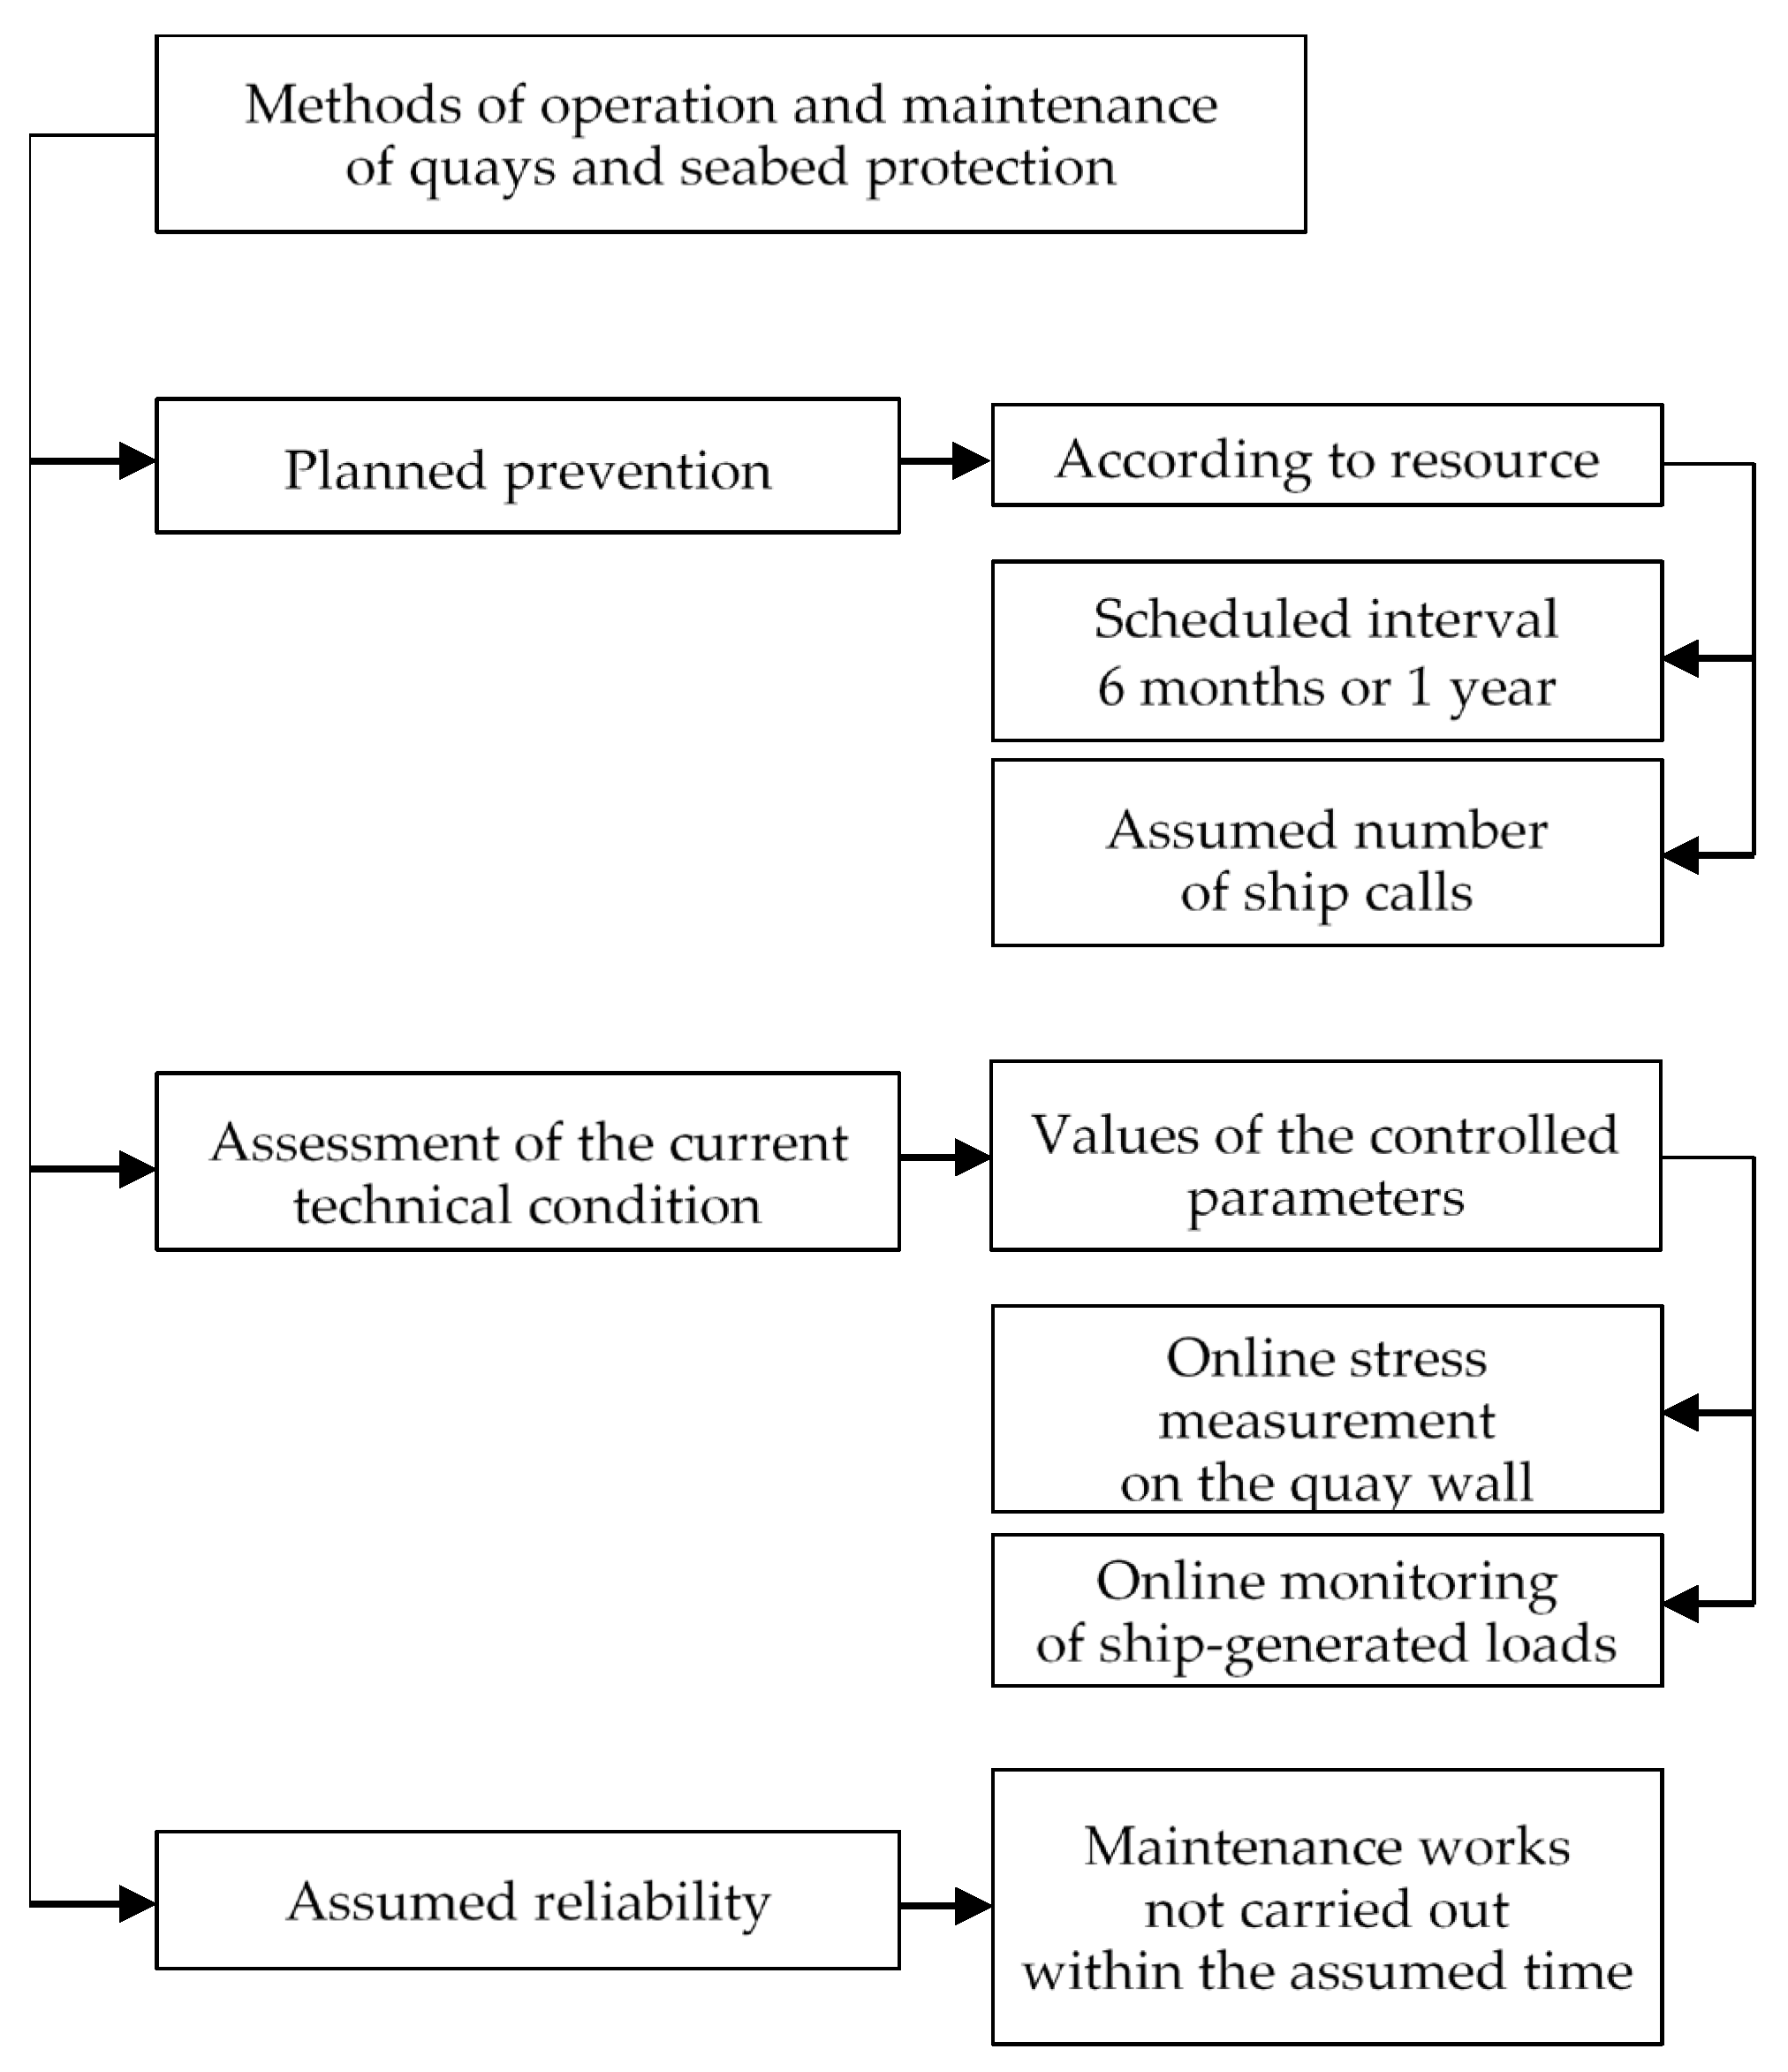
Figure 3.
Influence diagram for the arrival of the ro-pax ferry Stena Spirit berthing at the Helskie II quay.
Figure 3.
Influence diagram for the arrival of the ro-pax ferry Stena Spirit berthing at the Helskie II quay.
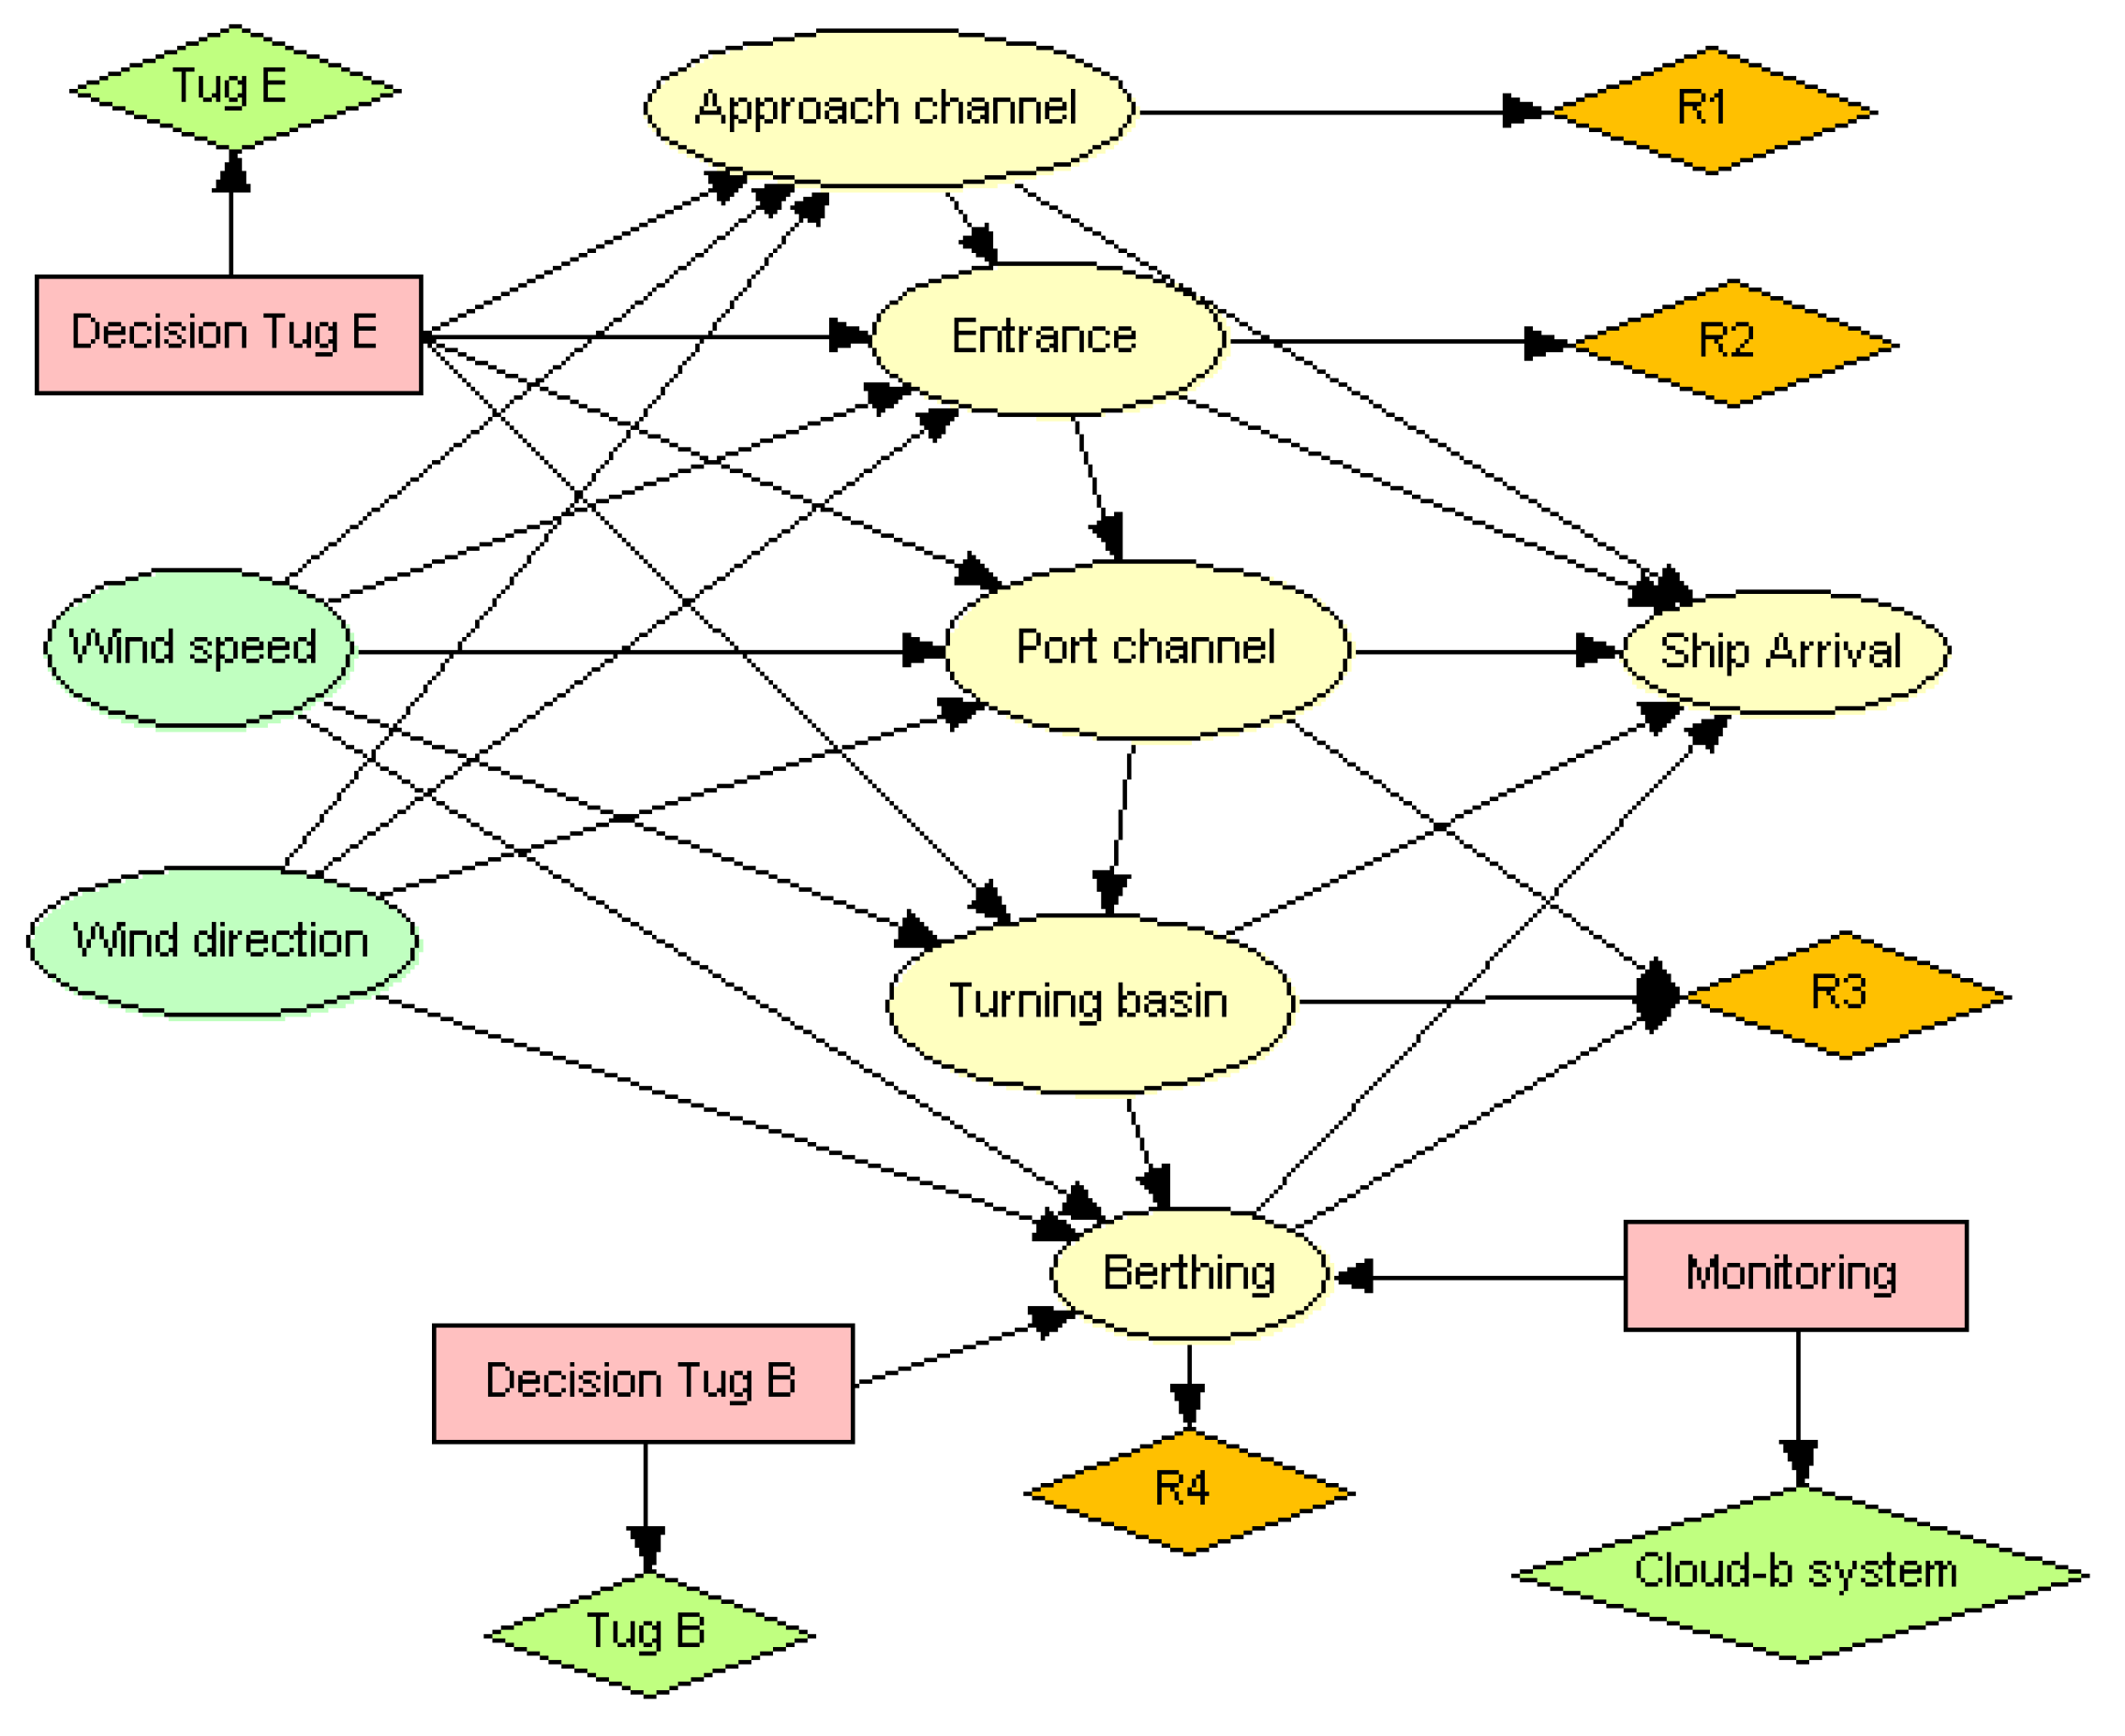
Figure 4.
Results of calculations performed using the PSN method, EU= 6.243 k€, for an assumed 10% probability of hazardous wind 7 B and a 30% probability of transverse wind direction, without any risk reduction measures applied, for the arrival of the ro-pax ferry Stena Spirit berthing at the Helskie II quay.
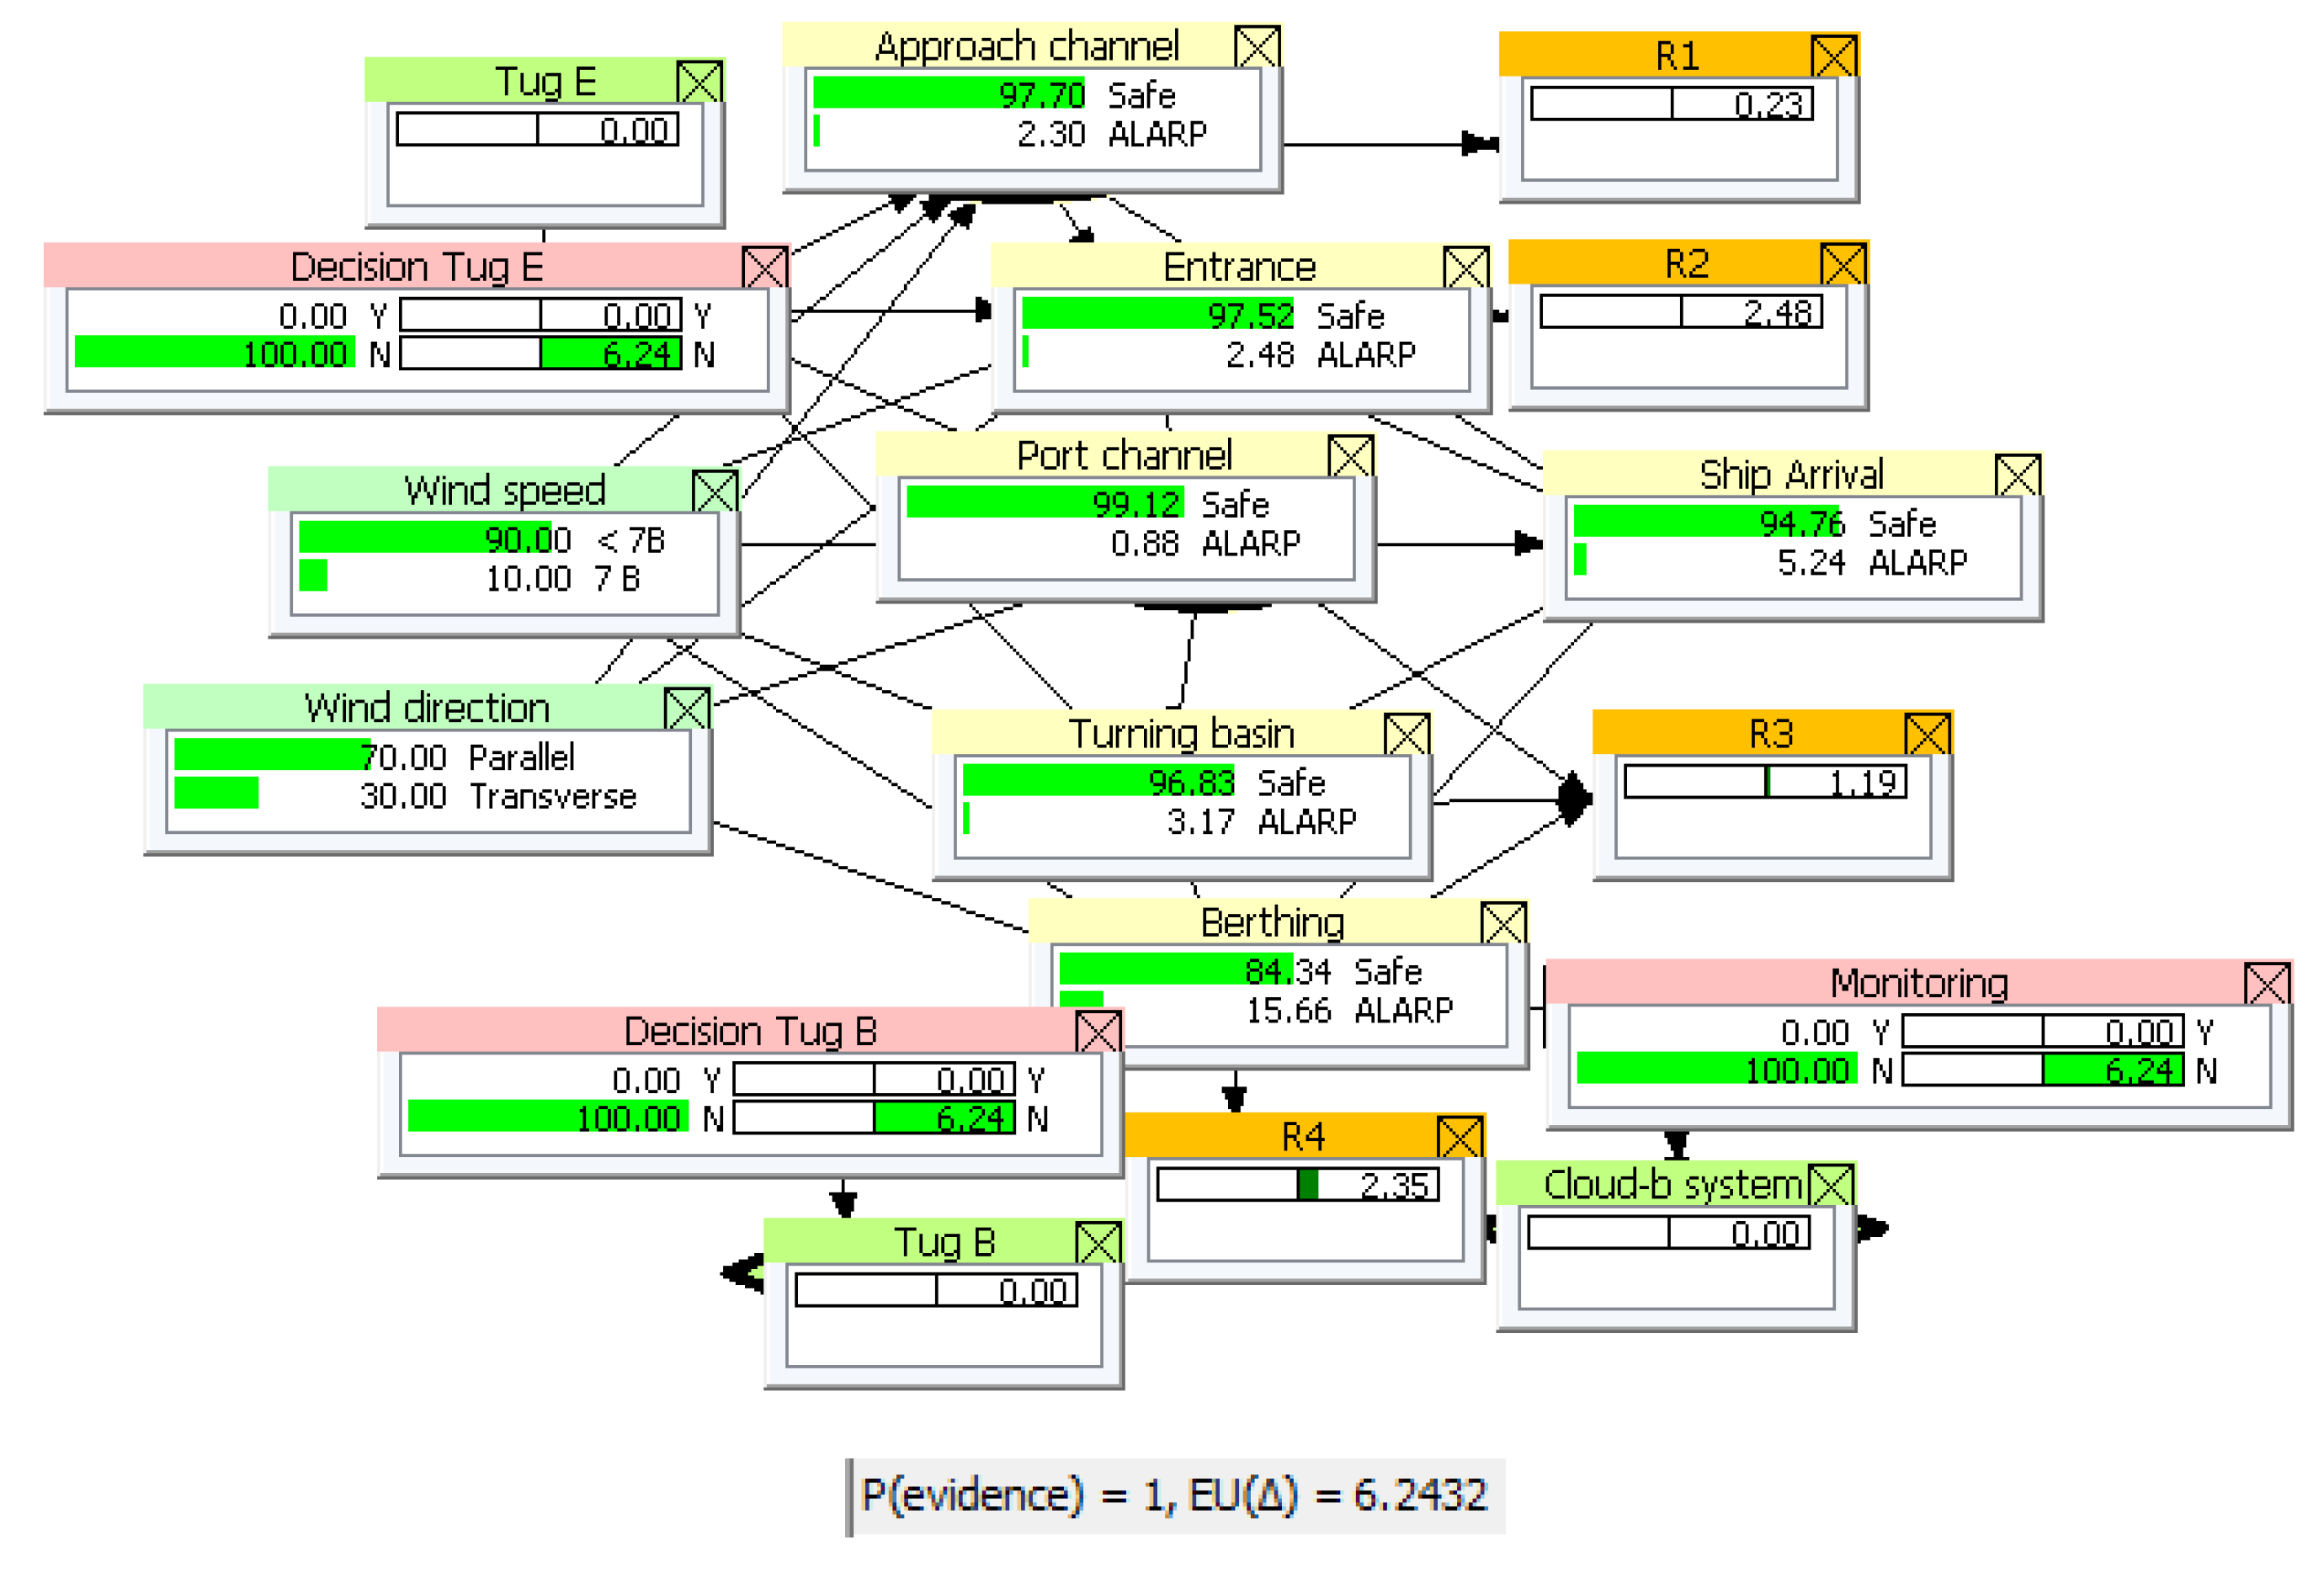
Figure 5.
Results of calculations performed using the PSN method, EU= 48.333 k€, for an assumed 100% probability of hazardous crosswind, without any risk reduction measures applied, for the arrival of the ro-pax ferry Stena Spirit berthing at the Helskie II quay.
Figure 5.
Results of calculations performed using the PSN method, EU= 48.333 k€, for an assumed 100% probability of hazardous crosswind, without any risk reduction measures applied, for the arrival of the ro-pax ferry Stena Spirit berthing at the Helskie II quay.
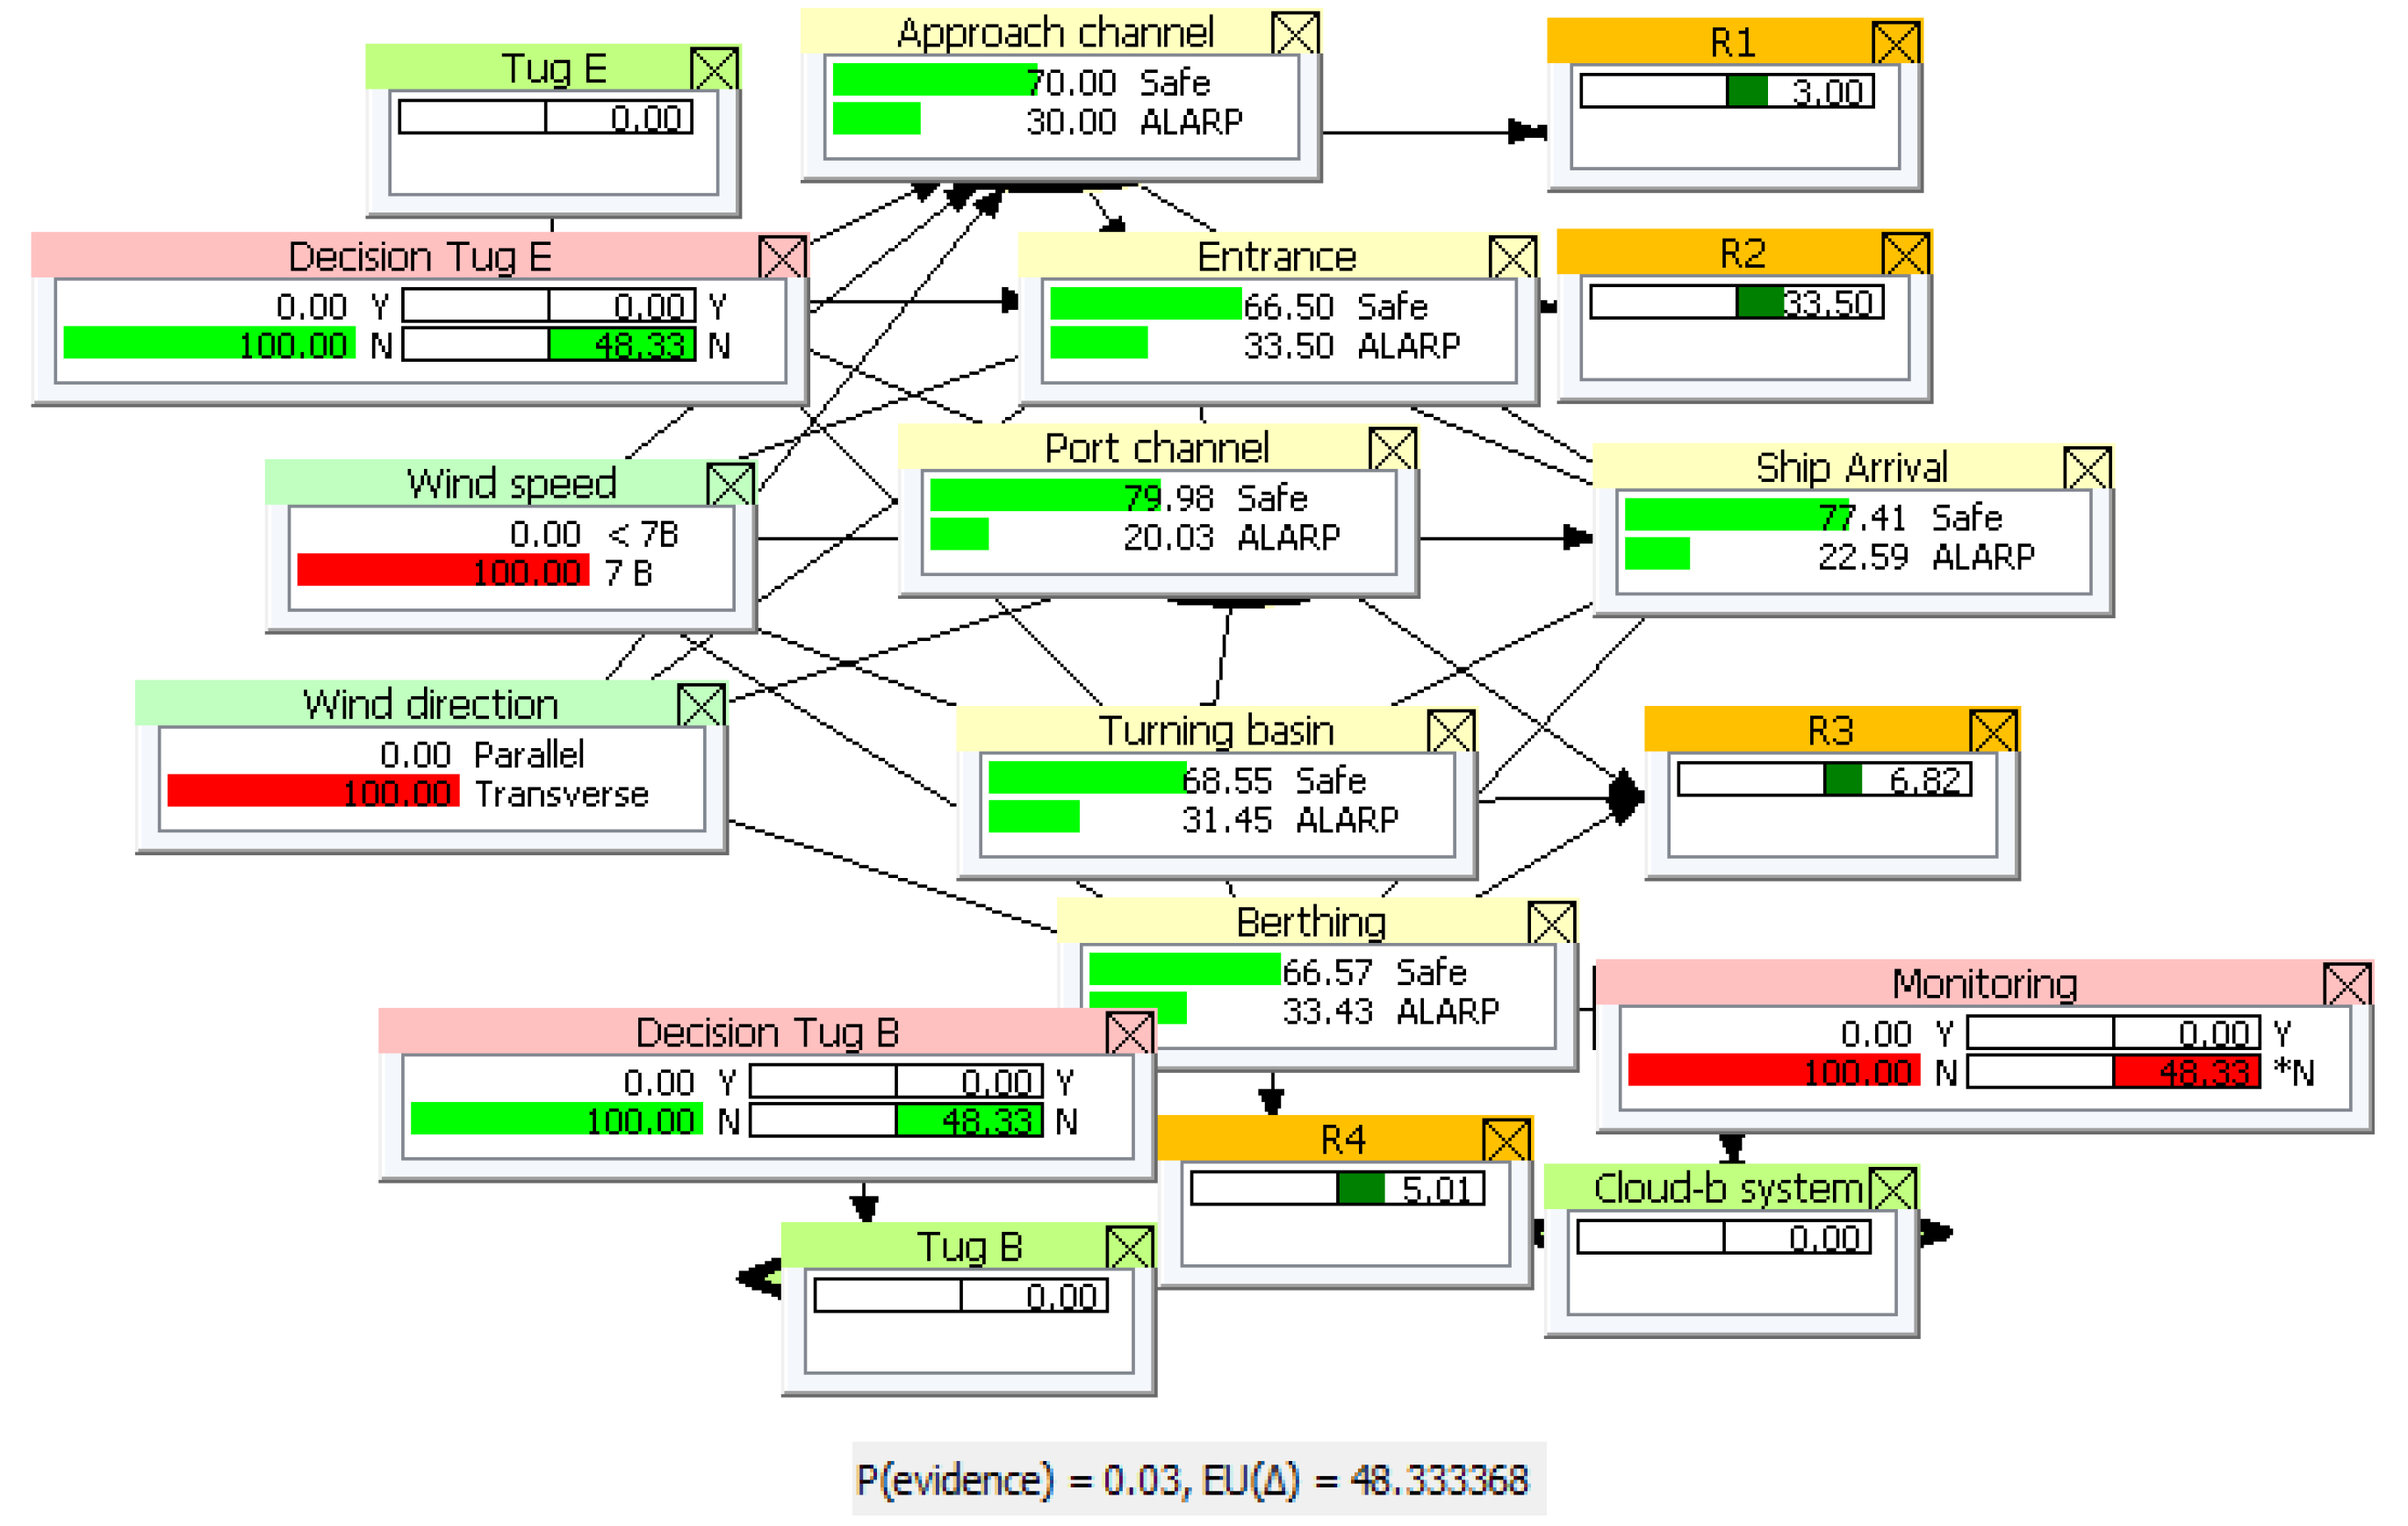
Figure 6.
Results of calculations performed using the PSN method, EU= 3.320 k€, for an assumed 100% probability of hazardous crosswind, with risk reduction measures applied, including tugboat assistance and berthing monitoring system, for the arrival of the ro-pax ferry Stena Spirit berthing at the Helskie II quay.
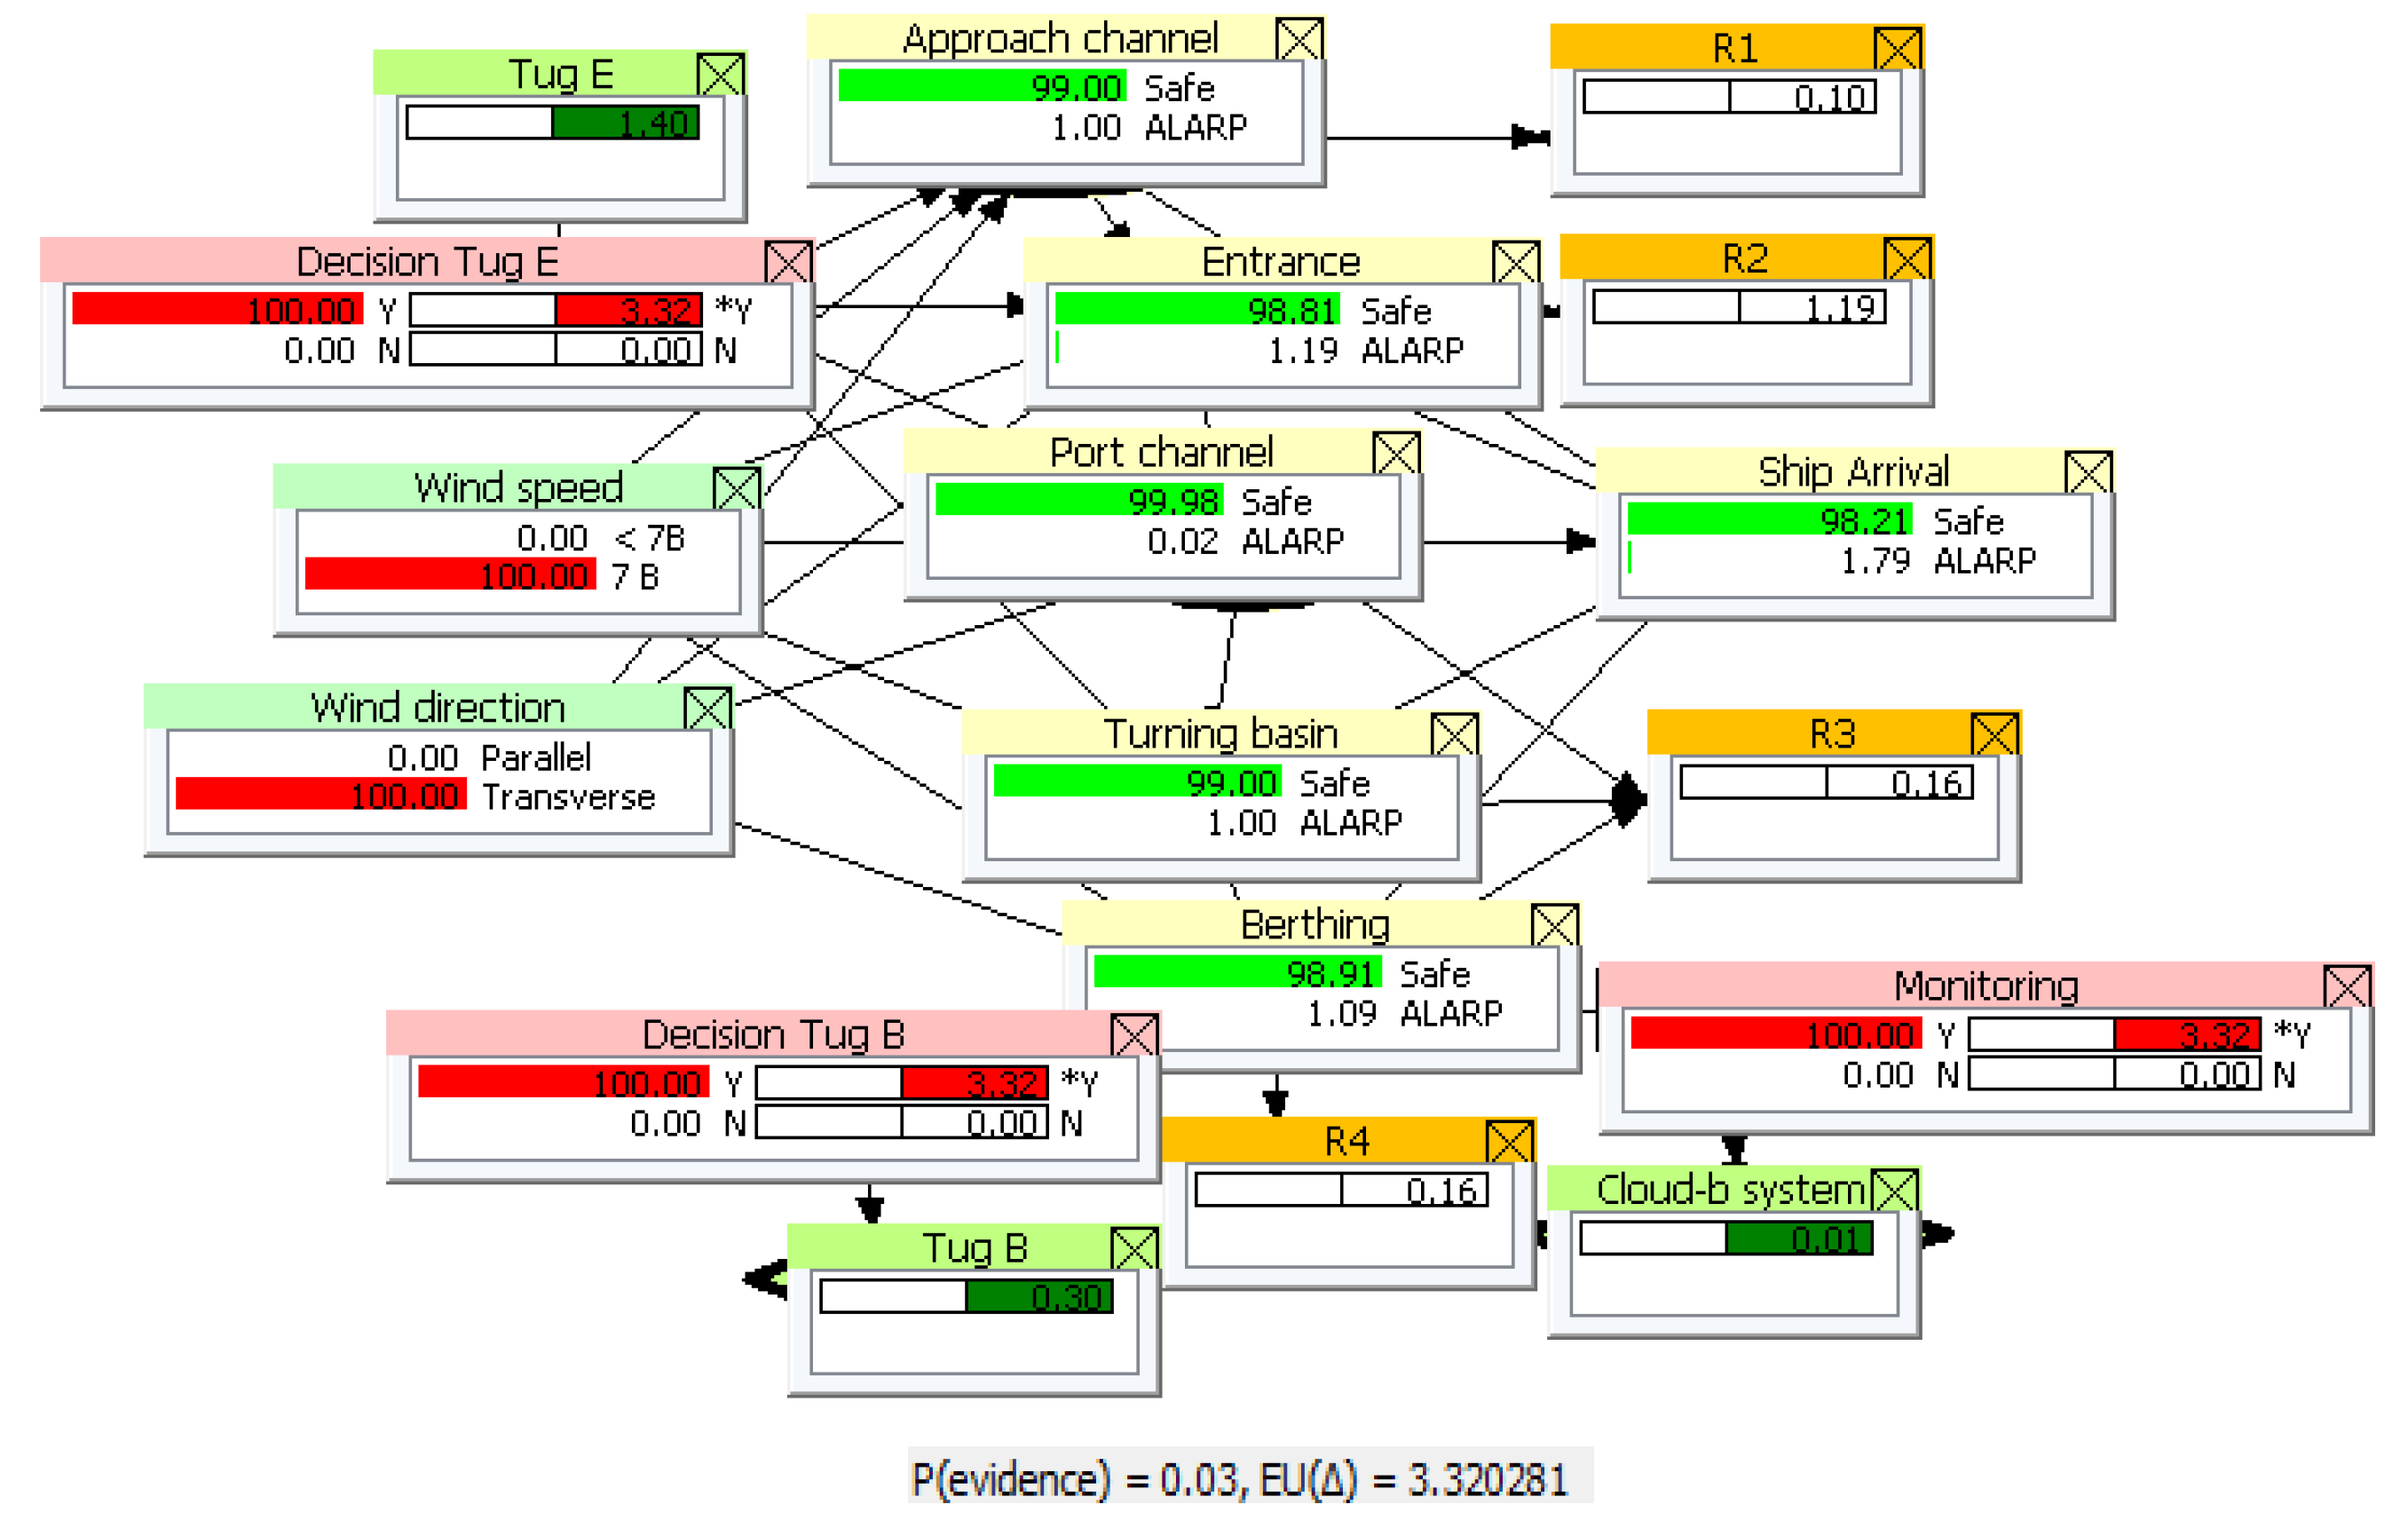
Figure 7.
Influence diagram for the arrival of the ro-pax ferry Stena Spirit berthing at the new Public Ferry Terminal.
Figure 7.
Influence diagram for the arrival of the ro-pax ferry Stena Spirit berthing at the new Public Ferry Terminal.
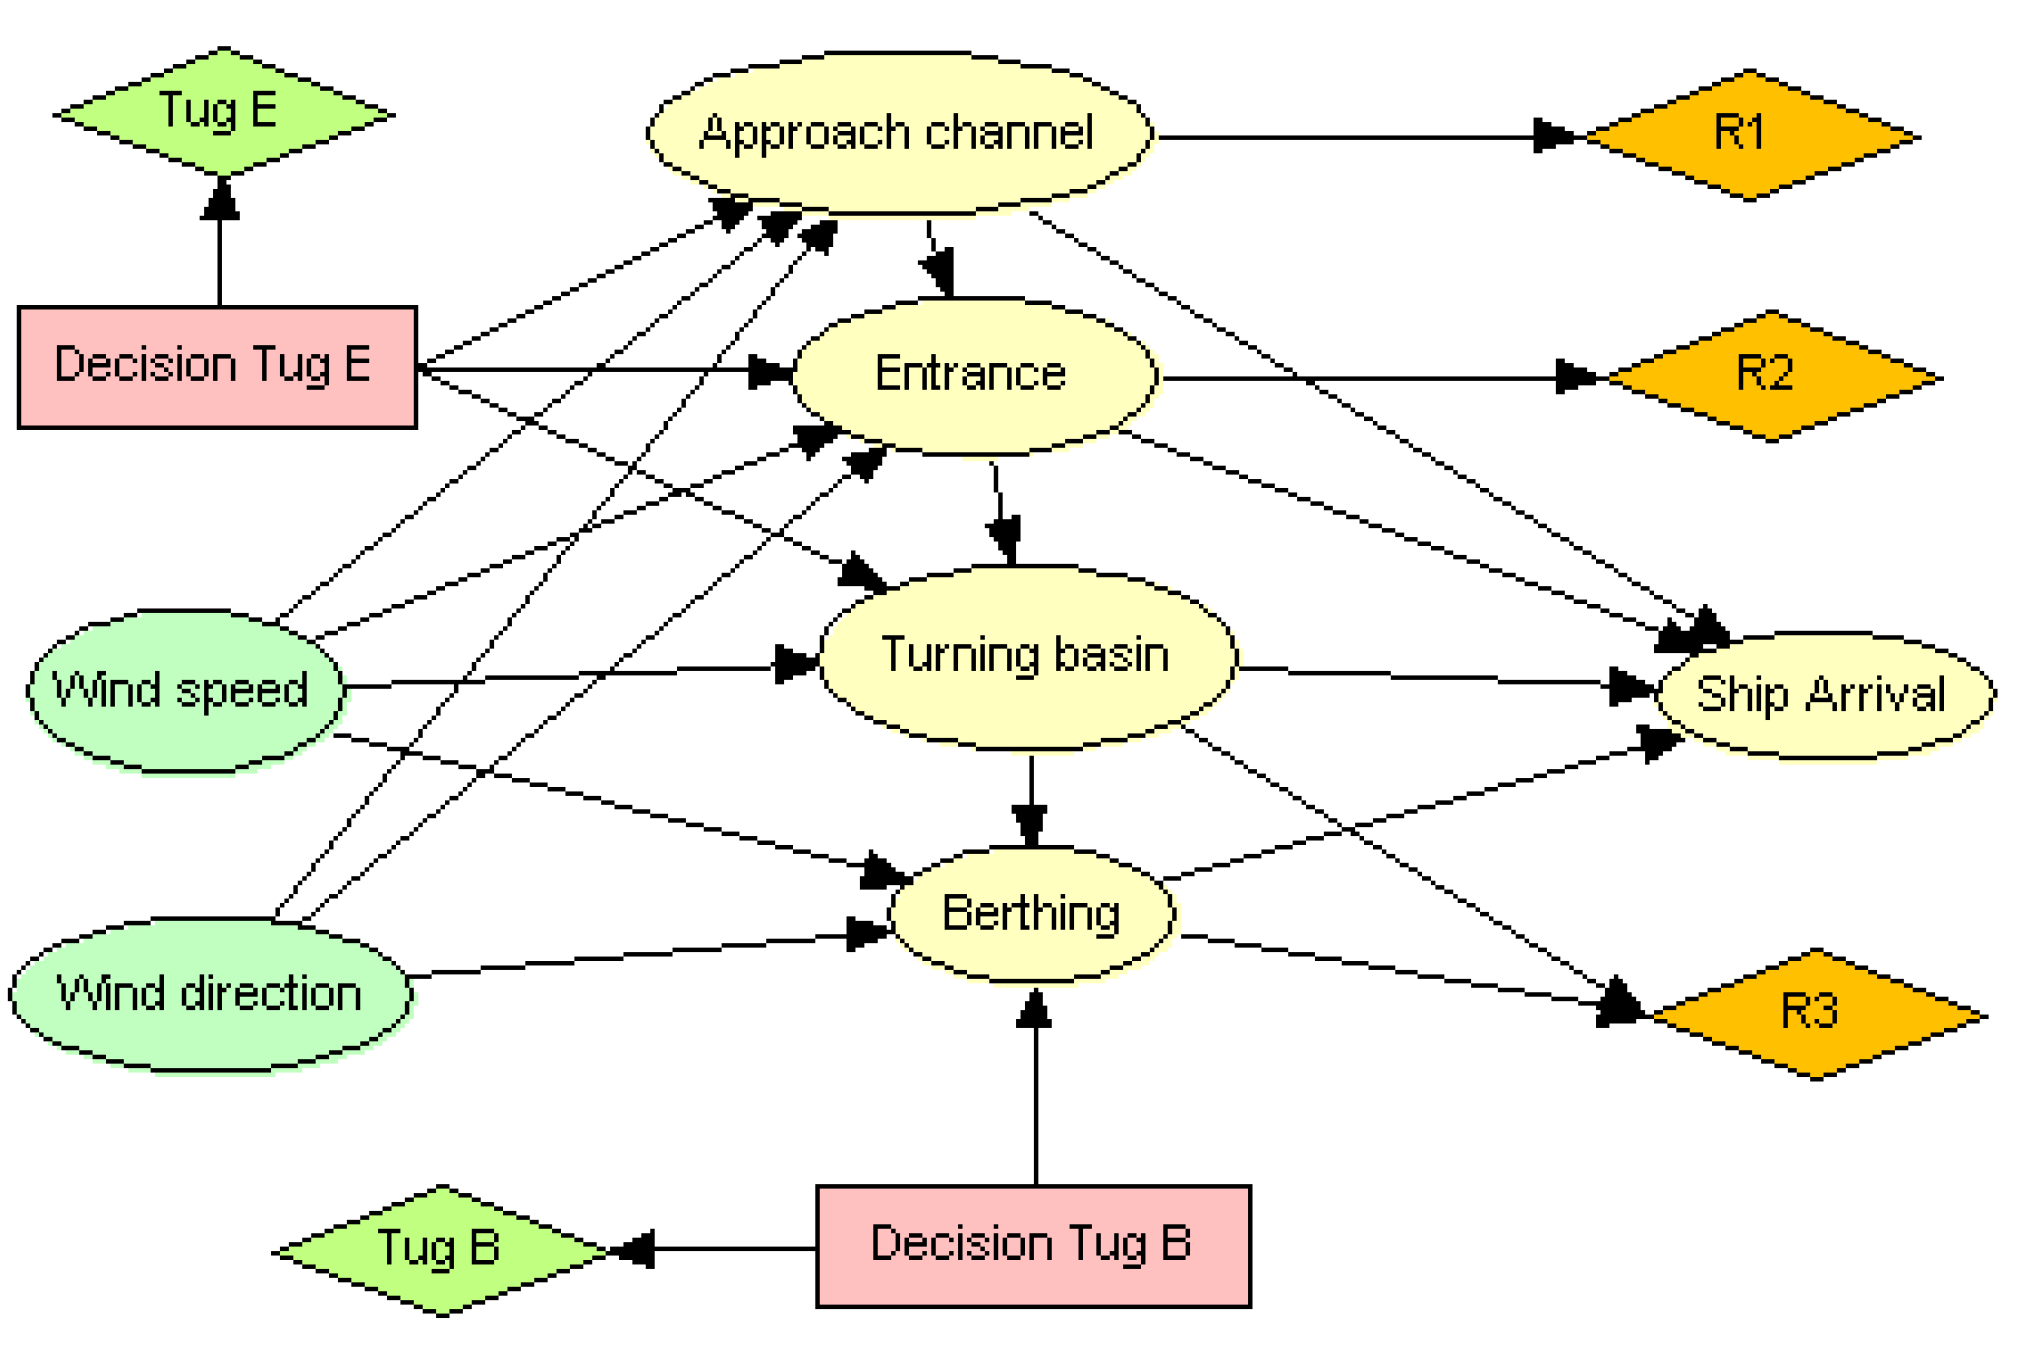
Figure 8.
Results of calculations performed using the PSN method, EU= 3.174 k€, for an assumed 10% probability of hazardous wind at 7 B and a 30% probability of transverse wind direction, without any risk reduction measures applied, for the arrival of the ro-pax ferry Stena Spirit berthing at the Polskie quay in the new Public Ferry Terminal.
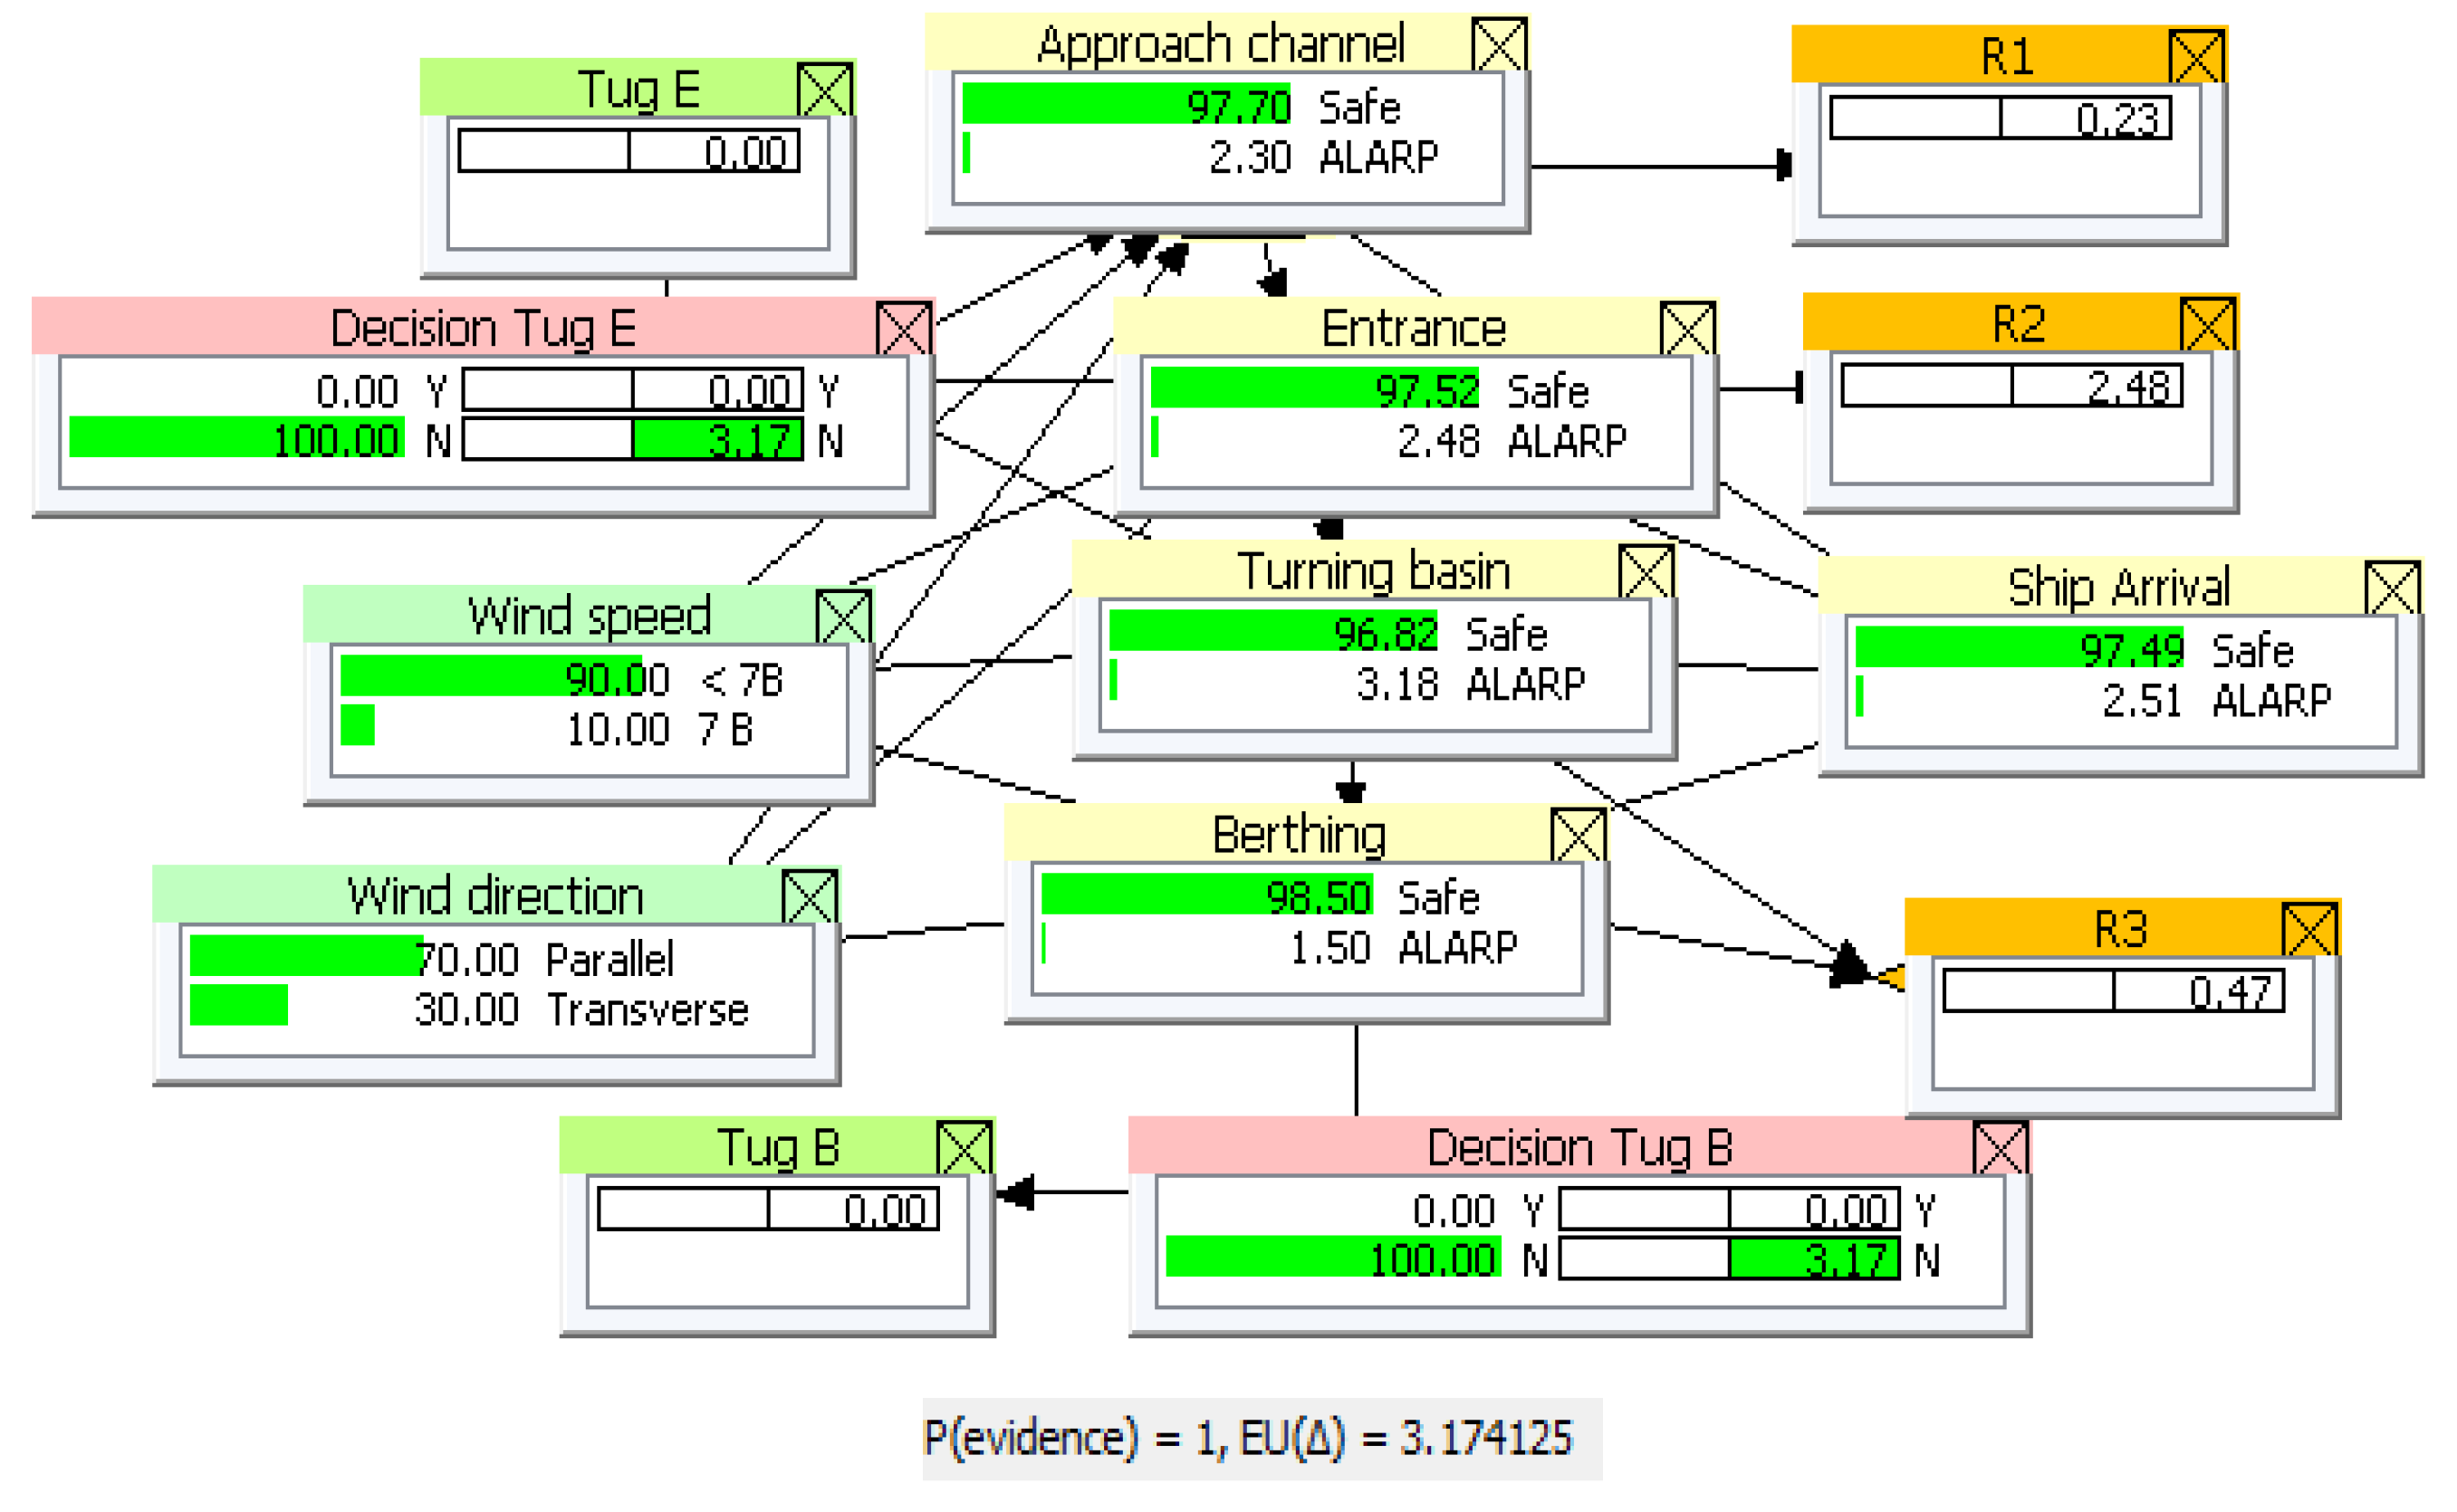
Figure 9.
Results of calculations performed using the PSN method, EU= 41.545 k€, for an assumed 100% probability of dangerous crosswind, without any risk reduction measures applied, for the arrival of the ro-pax ferry Stena Spirit berthing at the Polskie quay in the new Public Ferry Terminal.
Figure 9.
Results of calculations performed using the PSN method, EU= 41.545 k€, for an assumed 100% probability of dangerous crosswind, without any risk reduction measures applied, for the arrival of the ro-pax ferry Stena Spirit berthing at the Polskie quay in the new Public Ferry Terminal.
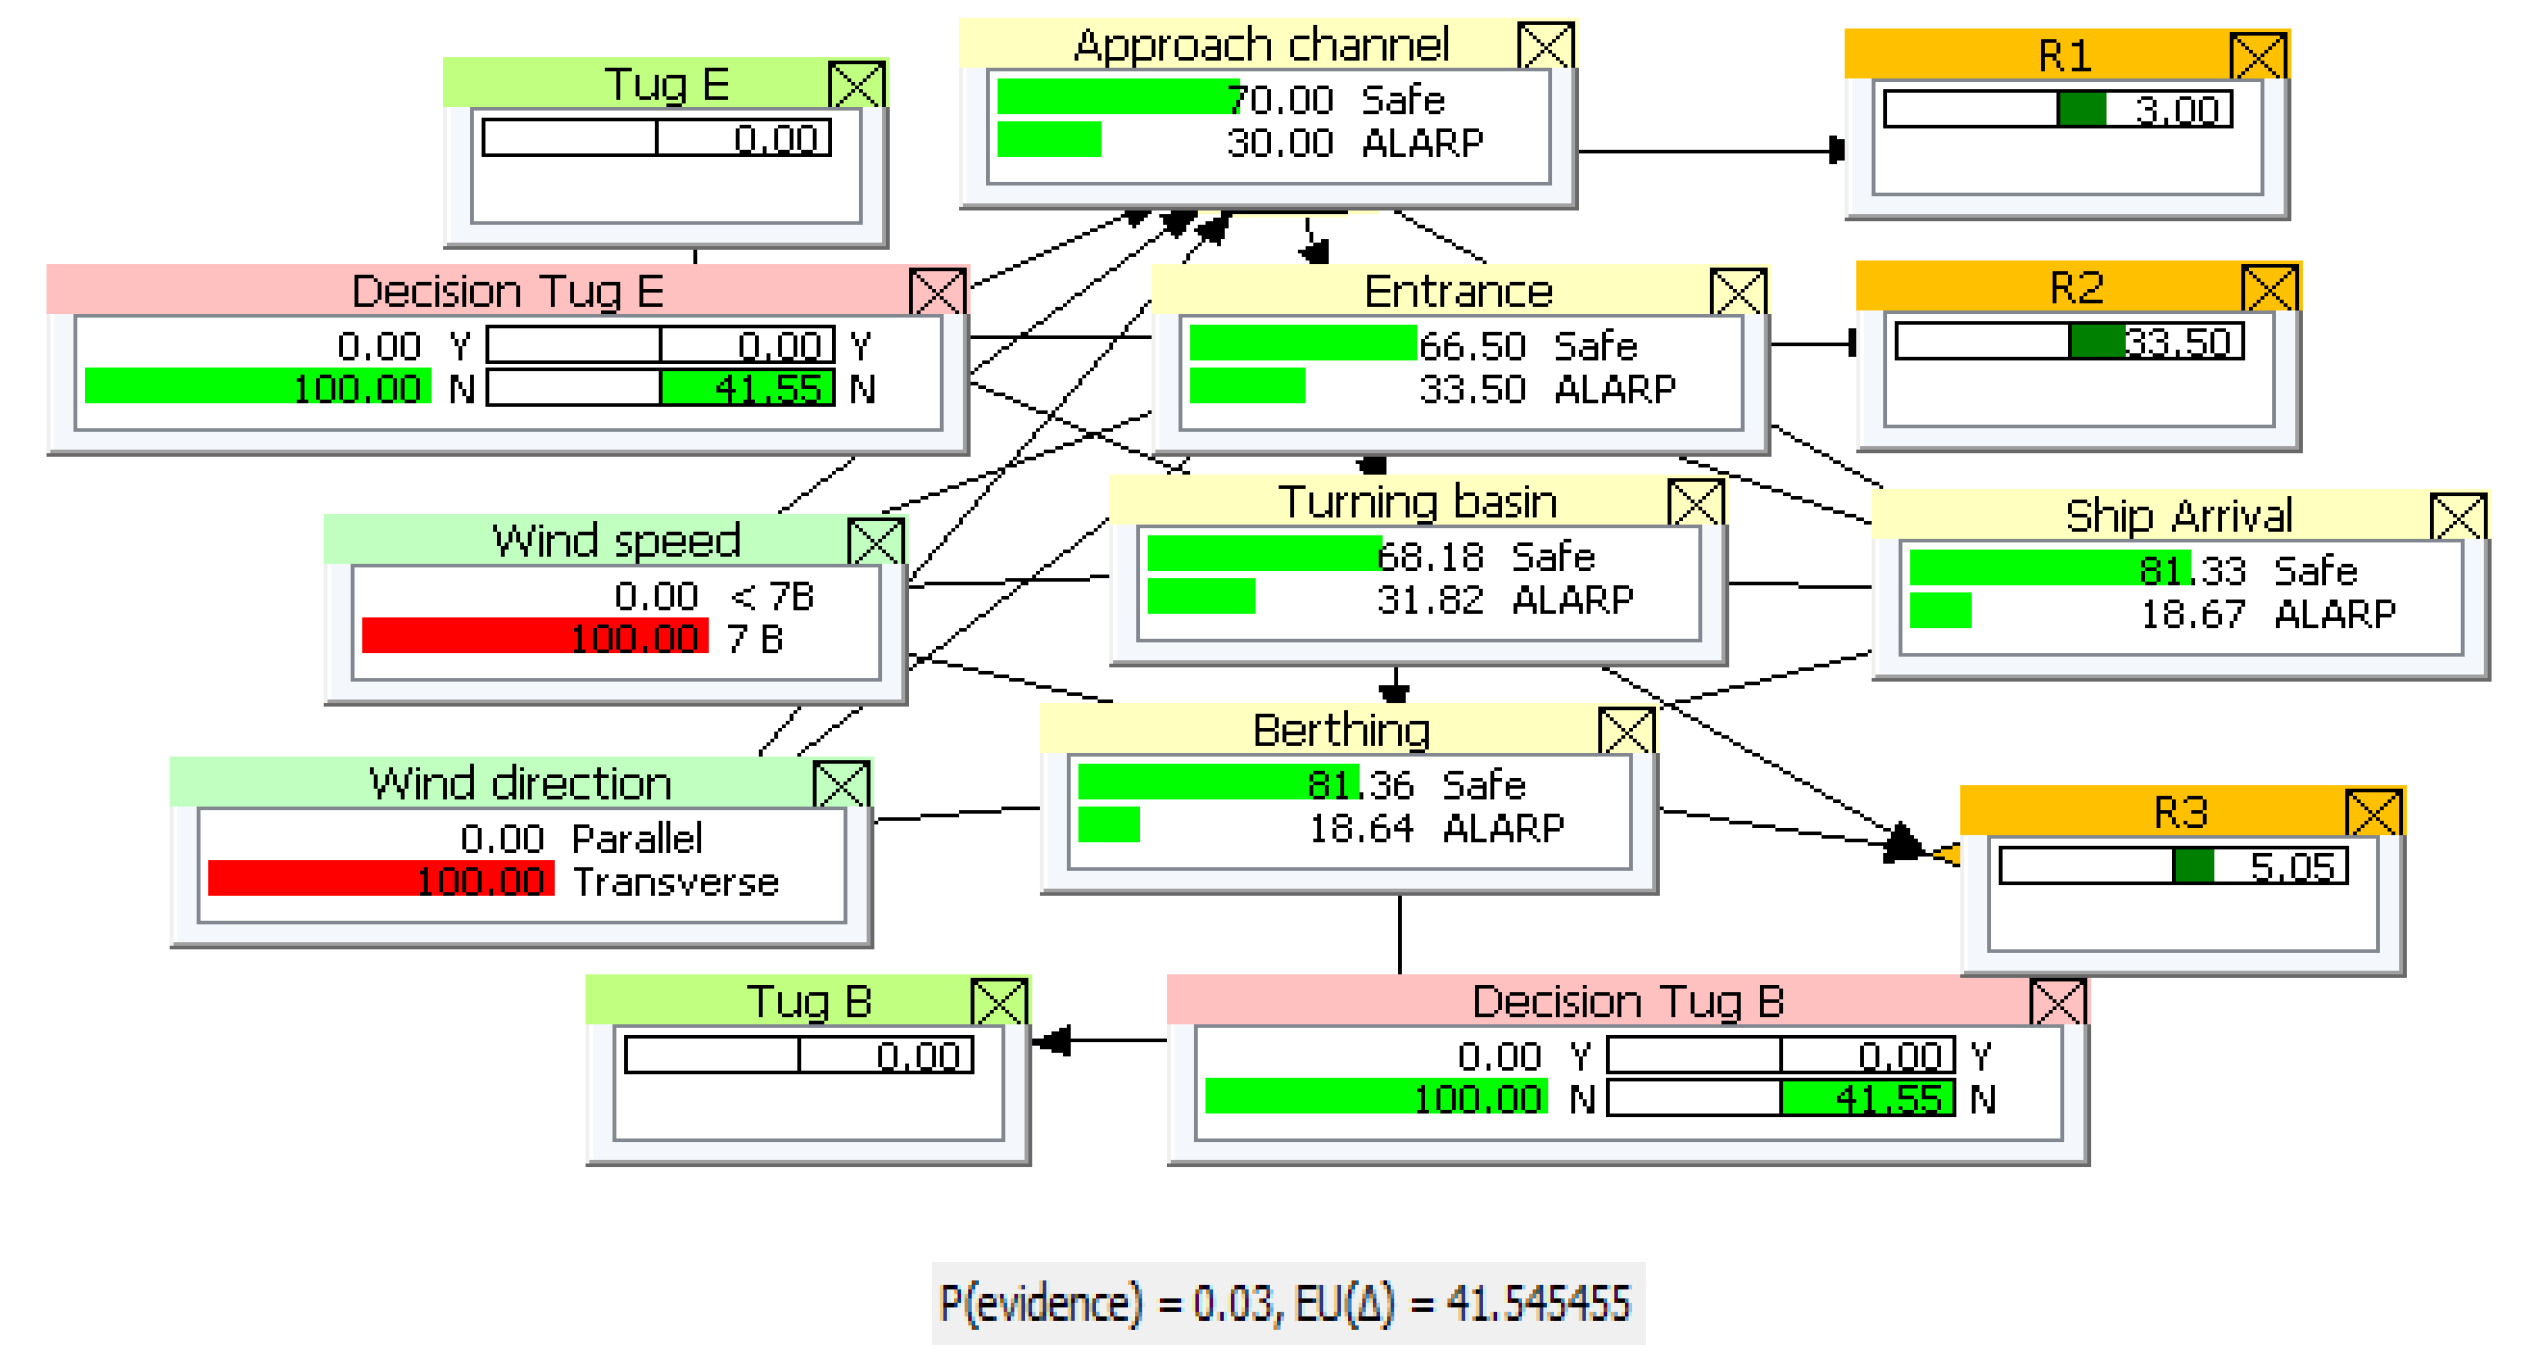
Figure 10.
Results of calculations performed using the PSN method, EU= 0.001, for an assumed 0% probability of dangerous crosswind, without any risk reduction measures applied, for the arrival of the ro-pax ferry Stena Spirit berthing at the new Public Ferry Terminal.
Figure 10.
Results of calculations performed using the PSN method, EU= 0.001, for an assumed 0% probability of dangerous crosswind, without any risk reduction measures applied, for the arrival of the ro-pax ferry Stena Spirit berthing at the new Public Ferry Terminal.
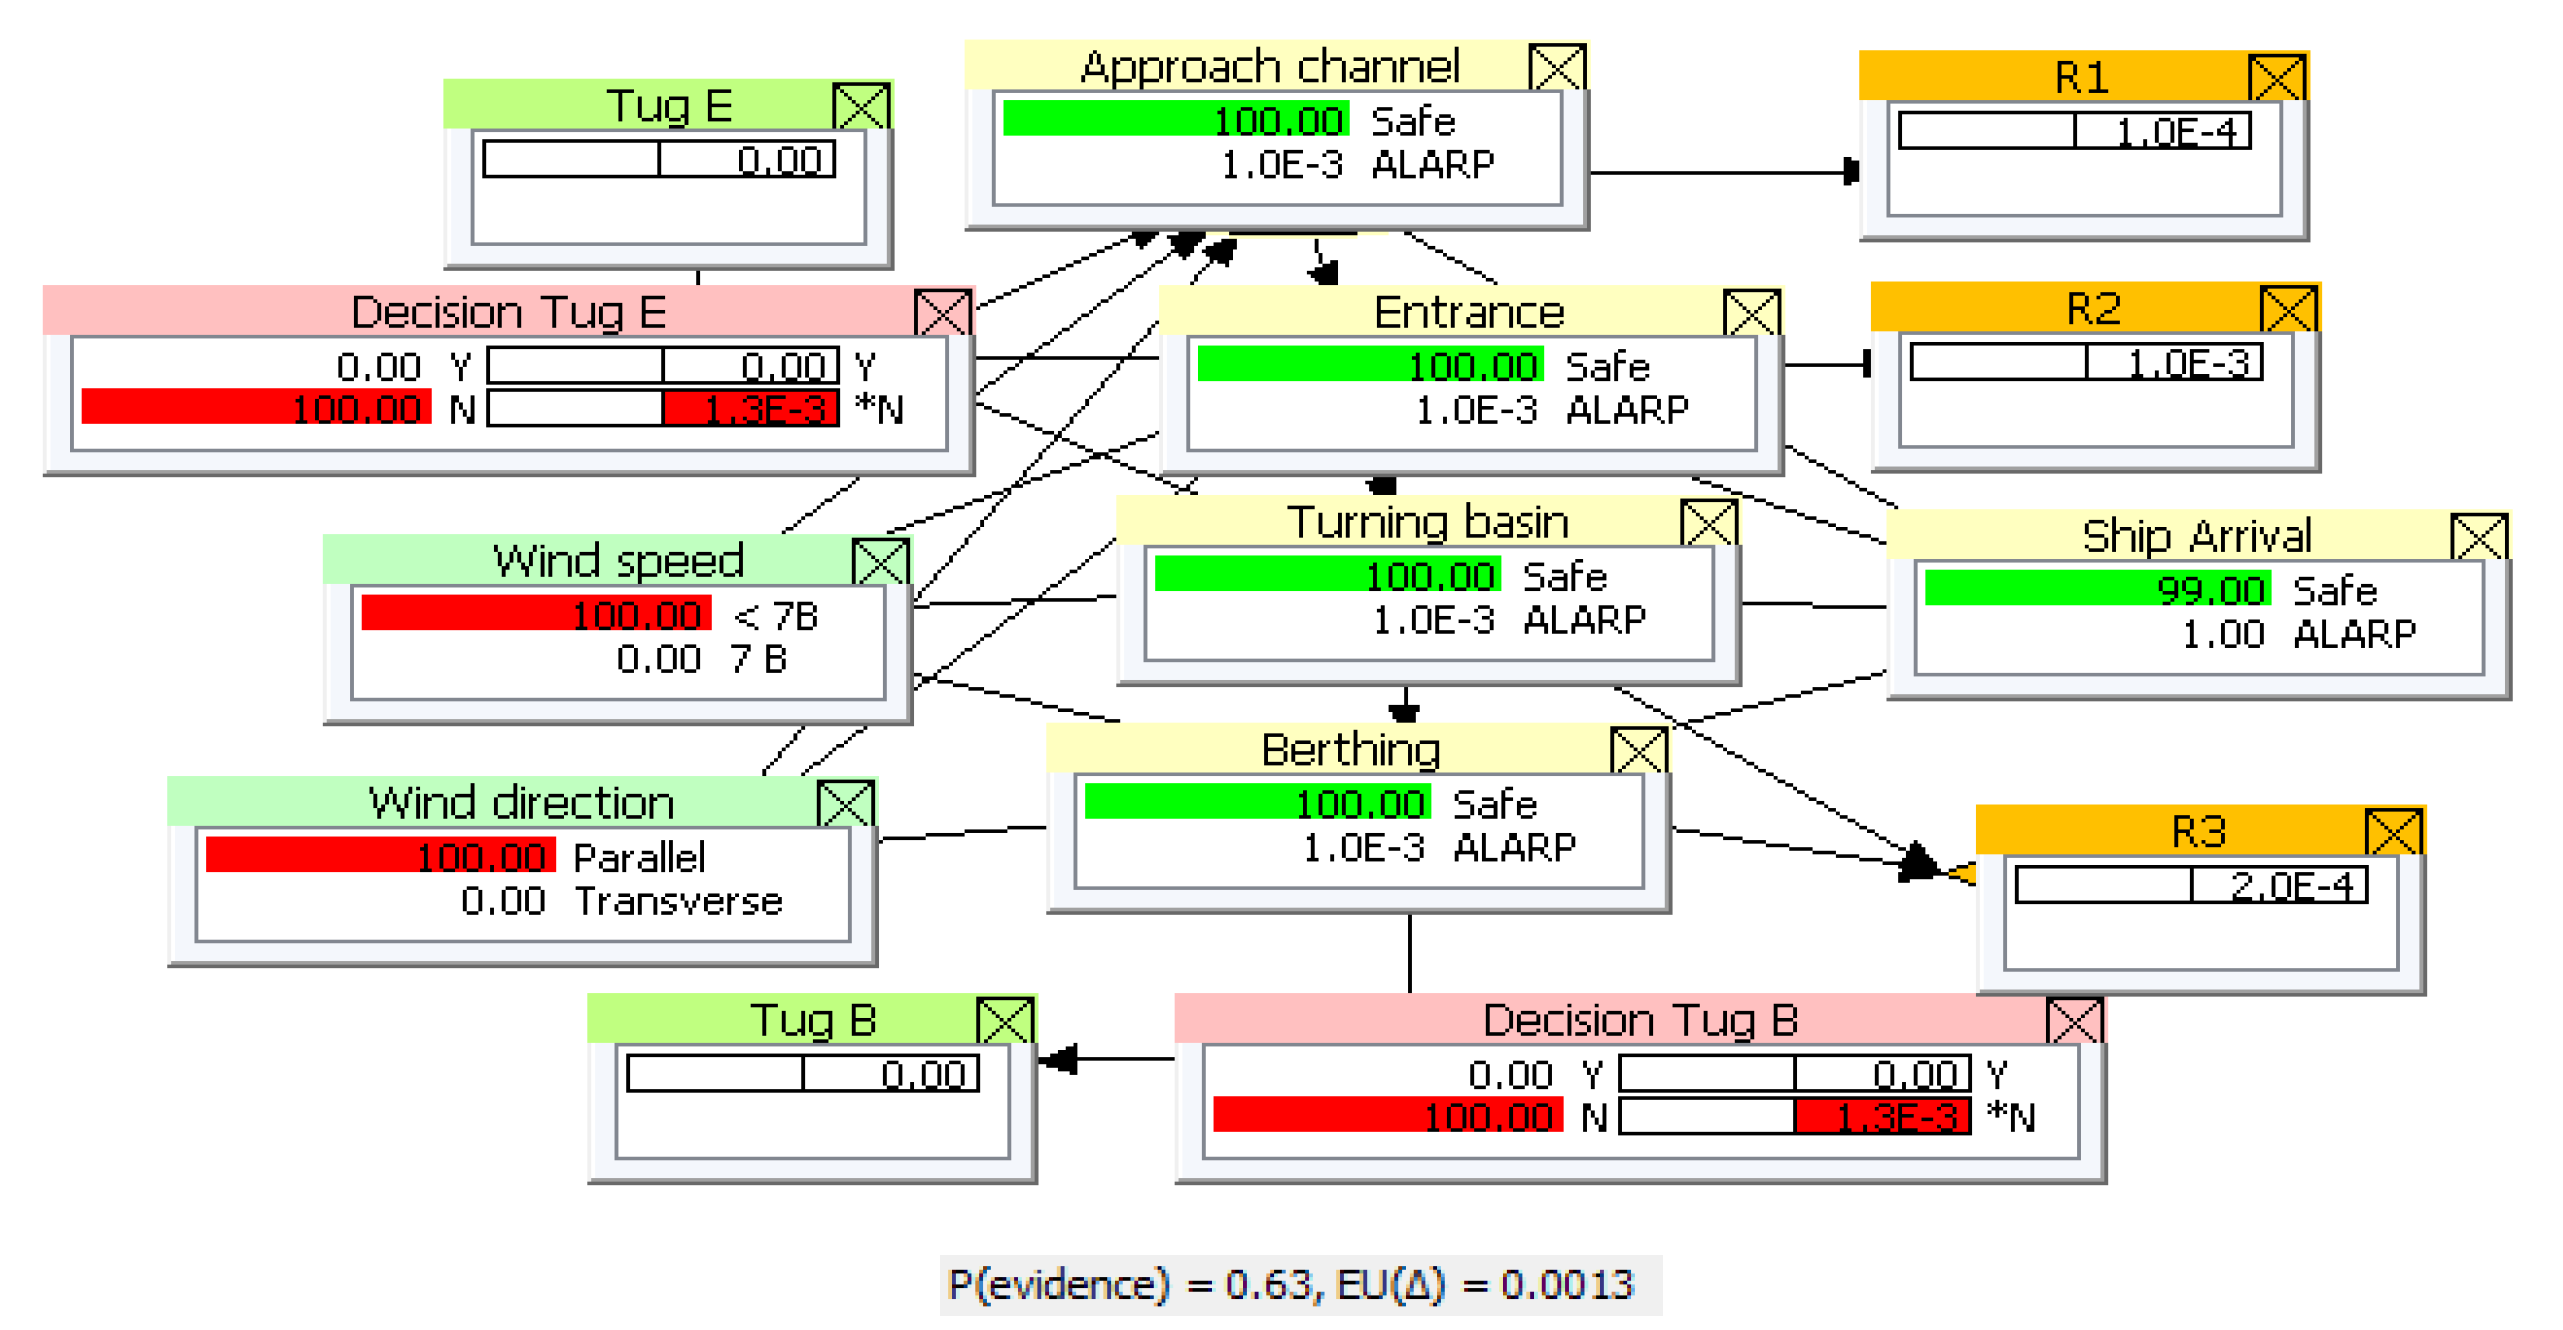
Figure 11.
Sequence of the vessels’ actual positions recorded by AIS while passing through the inner entrance, turning, and approaching the quay: (a) Stena Spirit maneuvers; (b) Stena Estelle maneuvers.
Figure 11.
Sequence of the vessels’ actual positions recorded by AIS while passing through the inner entrance, turning, and approaching the quay: (a) Stena Spirit maneuvers; (b) Stena Estelle maneuvers.
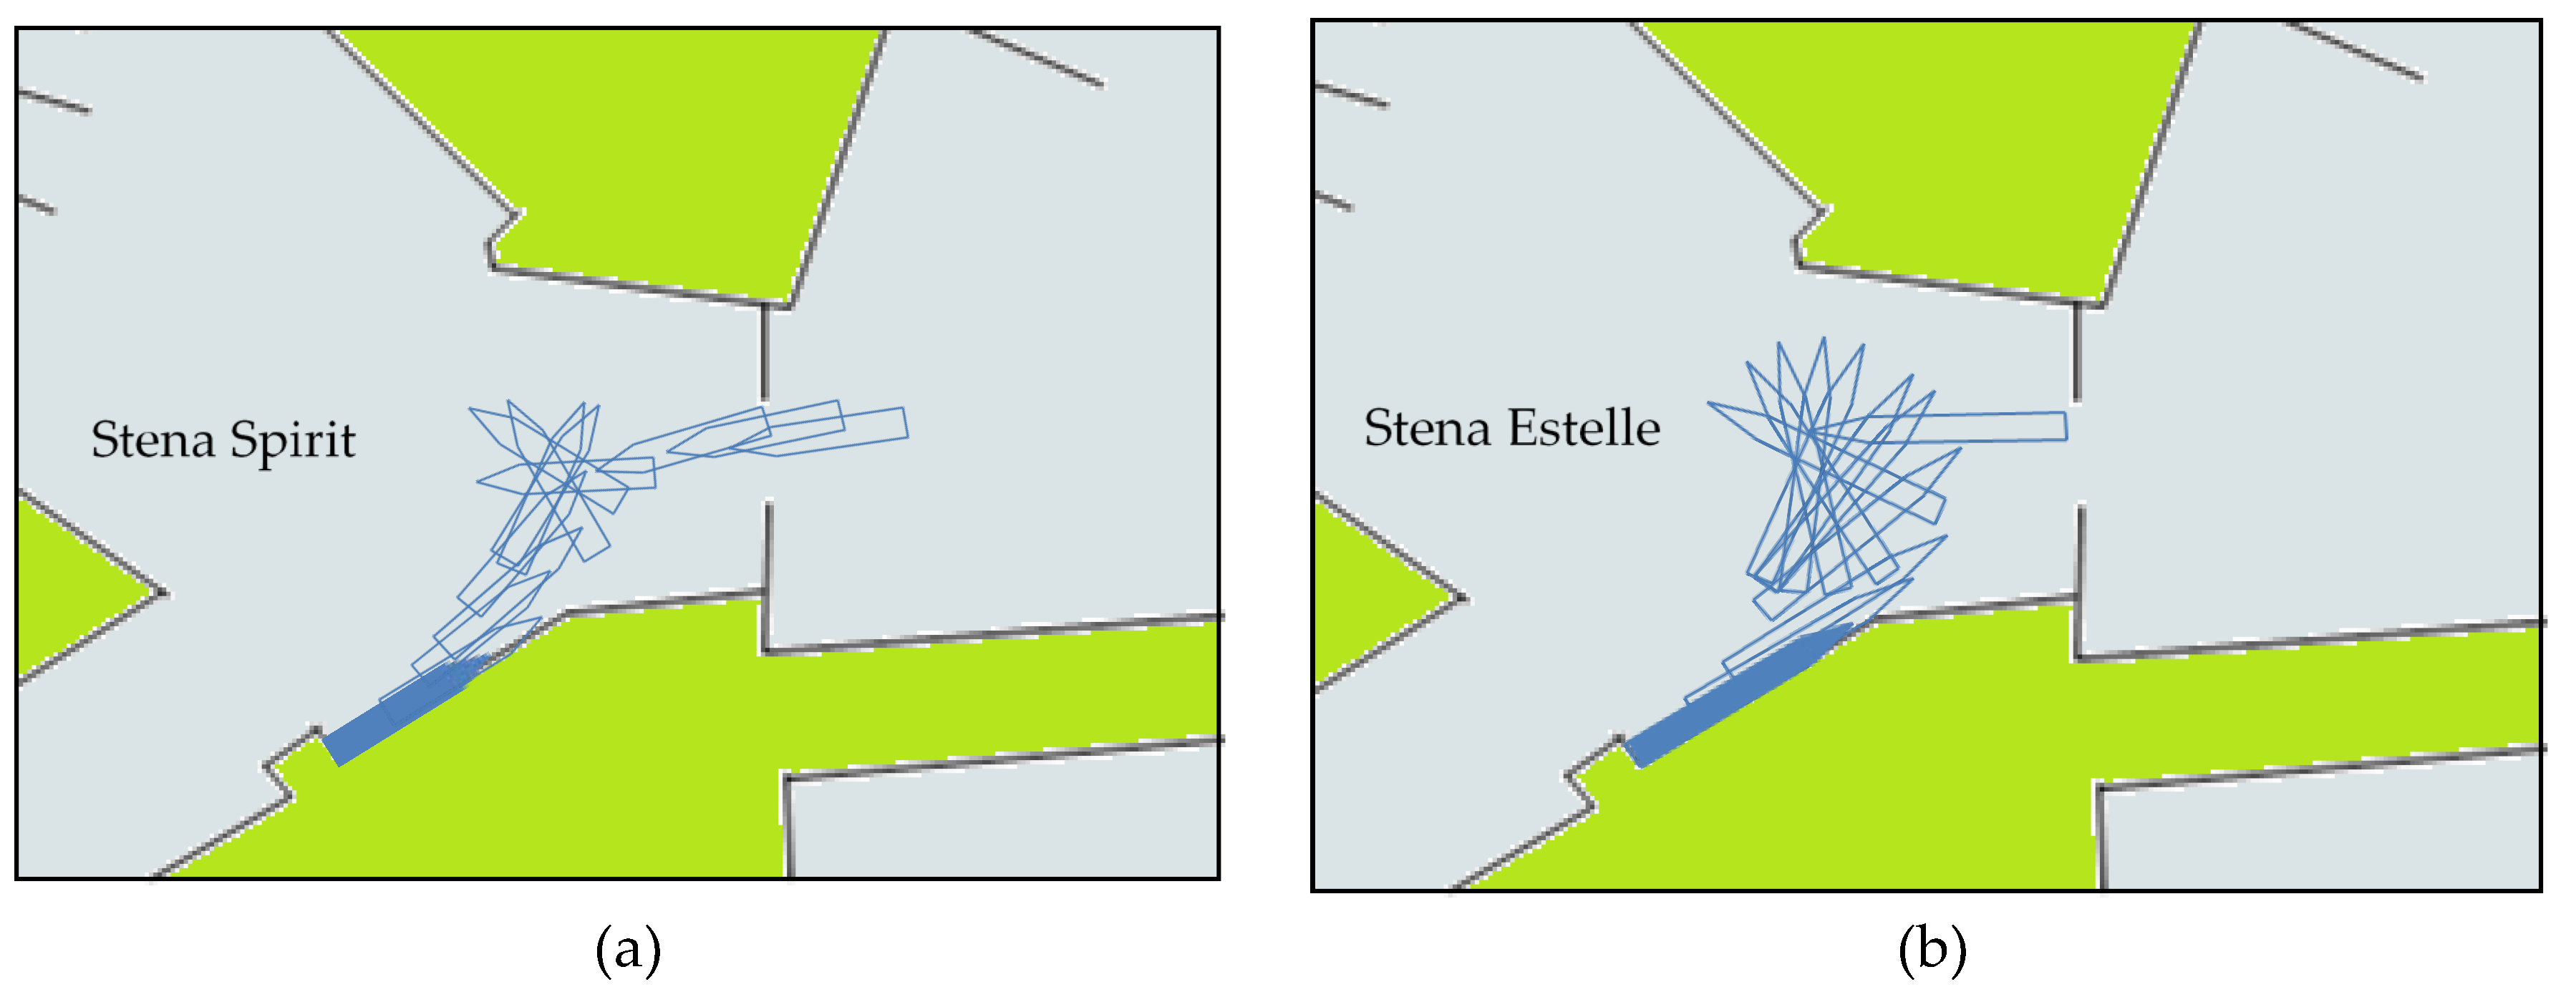

Table 1.
Risk control options.
| Risk control option | Description | Cost [k€] |
|---|---|---|
| Tug E | Tugboat assistance when entering and leaving the port | 1.4 |
| Tug B | Tugboat assistance when berthing and unberthing | 0.3 |
| Cloud-based system | Daily depreciation and maintenance costs of cloud-based monitoring system | 0.01 |
Table 2.
Risk descriptions and costs related to the consequences of failure.
| Symbol | Description of failure | Consequences Losses [k€] |
|---|---|---|
| R1 | Grounding or collision in the approach channel | 10 |
| R2 | Collision with a port head or breakwater when entering the port | 100 |
| R3 | Allision with a hydraulic structure during: passing through port channels, turning in the turning basin, berthing |
10 10 5 |
| R4 | Seabed protection failure | 25 |
Table 3.
Risk related to wind speed, wind direction, and applied risk reduction measures, calculated for the arrival of the ro-pax ferry Stena Spirit berthing at the Helskie II quay.
Table 3.
Risk related to wind speed, wind direction, and applied risk reduction measures, calculated for the arrival of the ro-pax ferry Stena Spirit berthing at the Helskie II quay.
| Wind | Tug E | Tug B | Monitoring System | R1 | R2 | R3 | R4 | EU | |
|---|---|---|---|---|---|---|---|---|---|
| 7 B | Transverse | ||||||||
| % | % | k€ | k€ | k€ | k€ | k€ | k€ | k€ | k€ |
| 10 | 30 | 0 | 0.0 | 0 | 0.23 | 2.48 | 1.19 | 2.35 | 6.24 |
| 10 | 30 | 0.0 | 0.0 | 0.01 | 0.23 | 2.48 | 1.19 | 0.23 | 3.42 |
| 100 | 100 | 0.0 | 0.0 | 0 | 3.00 | 33.50 | 6.82 | 5.01 | 48.33 |
| 100 | 100 | 0.0 | 0.0 | 0.01 | 3.00 | 33.50 | 6.08 | 2.81 | 45.40 |
| 100 | 100 | 1.4 | 0.3 | 0.01 | 0.10 | 1.19 | 0.16 | 0.16 | 3.32 |
| 0 | 0 | 0.0 | 0.0 | 0.0 | 1.0E-3 | 1.0E-4 | 0.75 | 2.25 | 3.30 |
| 0 | 0 | 0.0 | 0.0 | 0.01 | 1.0E-3 | 1.0E-4 | 2.5E-4 | 1.5E-4 | 0.01 |
Table 4.
Risk related to wind speed, wind direction and applied risk reduction measures, calculated for the arrival of the ro-pax ferry Stena Spirit berthing at the Public Ferry Terminal.
Table 4.
Risk related to wind speed, wind direction and applied risk reduction measures, calculated for the arrival of the ro-pax ferry Stena Spirit berthing at the Public Ferry Terminal.
| Wind | Tug E | Tug B | R1 | R2 | R3 | EU | |
|---|---|---|---|---|---|---|---|
| 7 B | Transverse | ||||||
| % | % | k€ | k€ | k€ | k€ | k€ | k€ |
| 10 | 30 | 0 | 0.0 | 0.23 | 2.48 | 0.47 | 3.17 |
| 100 | 100 | 0.0 | 0.0 | 3.00 | 33.50 | 5.05 | 41.55 |
| 100 | 100 | 1.4 | 0.0 | 0.10 | 1.19 | 2.58 | 5.27 |
| 100 | 100 | 1.4 | 0.3 | 0.10 | 1.19 | 0.21 | 3.20 |
| 0 | 0 | 0.0 | 0.0 | 1.0E-4 | 1.0E-3 | 2E-4 | 1.3E-4 |
Table 5.
Risk related to wind speed, wind direction, and applied risk reduction measures, calculated for the arrival of the ro-pax ferry Stena Spirit berthing at the Public Ferry Terminal.
Table 5.
Risk related to wind speed, wind direction, and applied risk reduction measures, calculated for the arrival of the ro-pax ferry Stena Spirit berthing at the Public Ferry Terminal.
| Wind | Tug E |
Tug B |
Berth | Monitoring System |
R1 | R2 | R3 | R4 | EU | ΔEU | δEU | |
|---|---|---|---|---|---|---|---|---|---|---|---|---|
| 7 B | Trans- verse |
|||||||||||
| % | % | k€ | k€ | k€ | k€ | k€ | k€ | k€ | k€ | k€ | % | |
| 10 | 30 | 0.0 | 0.0 | Helskie II | 0 | 0.23 | 2.48 | 1.19 | 2.35 | 6.24 | 3.07 | 49 |
| 0.01 | 0.23 | 2.48 | 1.19 | 0.23 | 3.42 | 0.25 | 7 | |||||
| Public Ferry Terminal | - | 0.23 | 2.48 | 0.47 | - | 3.17 | ||||||
| 100 | 100 | 0.0 | 0.0 | Helskie II | 0 | 3.00 | 33.50 | 6.82 | 5.01 | 48.33 | 6.78 | 14 |
| Public Ferry Terminal | - | 3.00 | 33.50 | 5.05 | - | 41.55 | ||||||
| 1.4 | 0.3 | Helskie II | 0.01 | 0.10 | 1.19 | 0.16 | 0.16 | 3.32 | 0.12 | 4 | ||
| Public Ferry Terminal | - | 0.10 | 1.19 | 0.21 | - | 3.20 | ||||||
| 0 | 0 | 0.0 | 0.0 | Helskie II | 0.0 | 1.0E-3 | 1.0E-4 | 0.75 | 2.25 | 3.30 | 3.30 | 99.996 |
| 0.01 | 1.0E-3 | 1.0E-4 | 2.5E-4 | 1.5E-4 | 0.01 | 0.01 | 98.7 | |||||
| Public Ferry Terminal | - | 1.0E-4 | 1.0E-3 | 2E-4 | - | 1.3E-4 | ||||||
Table 6.
Main particulars of the ferries Stena Spirit, Stena Estelle and Stena Ebba.
| Parameter | Stena Spirit | Stena Estelle Stena Ebba |
|---|---|---|
| Length [m] | 168 | 240 |
| Breadth [m] | 28 | 28 |
| Depth [m] | 6.7 | 6.4 |
Disclaimer/Publisher’s Note: The statements, opinions and data contained in all publications are solely those of the individual author(s) and contributor(s) and not of MDPI and/or the editor(s). MDPI and/or the editor(s) disclaim responsibility for any injury to people or property resulting from any ideas, methods, instructions or products referred to in the content. |
© 2026 by the authors. Licensee MDPI, Basel, Switzerland. This article is an open access article distributed under the terms and conditions of the Creative Commons Attribution (CC BY) license (http://creativecommons.org/licenses/by/4.0/).
Copyright: This open access article is published under a Creative Commons CC BY 4.0 license, which permit the free download, distribution, and reuse, provided that the author and preprint are cited in any reuse.


