Submitted:
18 February 2026
Posted:
19 February 2026
You are already at the latest version
Abstract
Being the second-largest producer of horticultural products, the sector in India is experiencing supply chain issues. Thus, the primary objective of this research is to use the resource curse and cluster theories to assess how the horticulture supply chain affects the smallholders' livelihoods. Independent (Horticulture Supply Chain Efficiency- HSCE), dependent (Smallholders' Livelihood Development- SLD), and moderating (Farmers Producer Organization Intervention- FPOI) variables are all included in the analysis. Using a combination of literature reviews, expert interviews, and focus groups, the researcher developed a preliminary research framework and measuring instruments for each latent construct. The instrument has been validated using face and language validation, followed by a pilot study and main study with 405 responses. Both SmartPLS 4.0 and SPSS 25.0 have been used for that purpose. This study found both HSCE and FPOI directly impacted SLD, explaining 65% of the variance, mostly by SC collaboration, followed by agricultural credit, SC infrastructure, and FPO. However, contrary to the theoretical part, the moderating effect was found to be negatively significant. This indicates the immaturity of FPOs to amplify these factors, which can draw the attention of policymakers to make necessary arrangements.
Keywords:
horticulture
; supply chain
; smallholder
; livelihood
; farmer producer organization
1. Introduction
India is predominantly agrarian, with 58% of rural households dependent on agriculture. Agriculture and its allied sectors contributed 20% to GDP in 2020-2021, rising in succeeding years [1]. Unlike the Indian horticulture industry, which contributes 33% of the total Gross Value Added to GDP [2]. Data from the Directorate of Economics and Statistics’ National Horticulture Database 2020-21 shows 331.048 million metric tons of horticultural produce produced on 27.586 MH [3]. India’s diversified agroclimatic conditions allow for horticultural crop production and offer an alternative to diversifying Indian agriculture for economic, nutritional security and poverty reduction [2,4,5,6]. Horticulture, which is more labor-intensive than staple crop production, may provide more employment and markets at the producer level owing to higher market pricing [6,7].
Similarly, Tripura, a Northeast Indian state, with 1.48962 MMT of horticulture production and 0.12681 MH of land [3], produces 0.543775 MMT of fruits, 0.835183 MMT of vegetables, and 0.00058 MMT of flowers in 0.05416 MH, 0.047332 MH and 0.00029 MH of land, respectively [5,8]. This leads to a huge surplus of products. Based on government reports and official interviews, the state resides with 95% small and marginal farmers who produce their goods with little MSP, bargaining power, and with a focus only on production. The sector comes under three major schemes, i.e., MIDH (Mission for Integrated Development of Horticulture-Central, Pre and Post development), state plan, and RKYV (Rashtriya Krishi Vikash Yojana-Infrastructure development) [5,9,10] that solely focus on production and productivity only. This lowers farm-gate prices for smallholders and raises consumer costs due to a lack of cooperation and transparency among farmers and other stakeholders, which increases intermediaries, resulting in unduly lengthening and costing the SC [11,12]. Further, it is evident from the Consumer Food Price Index (CFPI-combined) that even with 7.75% inflation of agricultural products, the producers’ share of consumer pricing remains low [10,13,14]. This shows a significant SC gap between producers and consumers. Therefore, an efficient SC is required to reduce product loss, increase infrastructure, productivity, negotiating power, safety, quality, knowledge and skill sharing, transparency, tracking system, investments, risk sharing, productivity improvement, and customer satisfaction. These issues are very much relevant to smallholders as owing to limited resources and market access, needs additional study [15].
Horticultural crops include fruits, vegetables, ornamentals, aromatics, medicinals, and herbs & spices. This doubles farmers’ income compared to traditional agriculture, adding value to the sector and the country’s economic growth [16,17]. India’s F&V SC is inefficient and overlooked, resulting in large post-harvest losses. It is also evident that six to seven intermediaries in the SC make it more fragmented without adding value, even though they provide product transportation, ownership transfer, vendor payment, maintenance, and customer delivery [18,19,20,21].
The state of Tripura has started forming FPOs that combine private and cooperative principles to help farmers and improve their living standards by managing an efficient supply chain. Many implementing and promoting organizations use various schemes to form and operate FPOs to address common issues in agricultural services (agricultural training, advisory services, and technical support), input supply, procurement, processing, marketing, and distribution to increase farmers’ bargaining power, and incomes [5,9,22].
Therefore, the study objective covers Tripura’s horticultural sector, which includes fruits and vegetables, to construct a research model and instrument based on an existing literature review, focus group discussion, interviews with different stakeholders, and expert advice. Identifying these elements and how they affect smallholder livelihoods with the existing government policies and schemes. The independent variable, "Horticulture Supply Chain Efficiency", affects the dependent variable, "Smallholders’ Livelihood Development". The moderating variable, "FPO Intervention," helps the SC to develop smallholders’ economic and non-economic livelihoods.
2. Literature Review and Hypothesis Development
2.1. Theoretical Background
The resource curse theory posits that resource-rich countries are less likely to use their natural resources, which increases the likelihood of conflicts, authoritarianism, economic instability, and slow economic progress [23]. Traditionally, natural resources promote economic growth, but corruption, poor governance, institutional or government policy, poor investment, lack of information, poor infrastructure, and poor collaboration have caused negative effects in a few countries [24,25,26,27,28,29,30,31,32]. Likewise, underutilised natural resources like horticulture and human resources in India could strengthen the nation’s and state’s economies [33]. While cluster theory is essential for local and regional development because institutional actors work together to strengthen clusters’ competitive advantage by fostering innovation [34,35,36,37]. Unorganised markets, opportunistic middlemen, increased SC transaction costs, decreasing quality and quantity, farm gate pricing, and higher consumer purchasing prices motivate smallholders to join clusters. This cluster has solid administration, making the resource (horticulture) curse a blessing for smallholders and the country’s economic development by sharing cost and profit [38] (Figure 1).
2.2. Identification of Research Variables and Hypotheses Development
Multiple layers of interaction (Interviews, FGD & Expert advice) with Govt. officials (BDOs, ADOs, & Directorate of Agriculture), Farmers, BoD & CEOs of FPOs have been initiated to finalise the research model (see Figure 2) and its standard instrument specific to the Tripura horticultural sector. At the same time, FGD [39,40] was conducted with farmers to understand the schemes at the ground level.
2.2.1. Horticultural Supply Chain Efficiency, Smallholders’ Livelihood Development and Farmer Producer Organization Intervention
Horticultural product SC includes production, post-harvest, and distribution from farm to table. Low shelf-life, significant demand, price changes, food safety and quality issues make perishable food SC more complicated [41]. The complicated, fragmented, and intermediary-dependent F&V SC causes farmers and buyers to lose economic and non-economic benefits after harvest [42]. Several middlemen, a lack of policy, unorganized sectors, and a lack of cold storage are among the factors that contribute to Indian fruit SC post-harvest losses, making the SC inefficient [12,43,44]. HSCE can enhance smallholders’ livelihoods via infrastructure, collaboration, and agricultural loans. SC infrastructure systems may help the horticulture SC save time, cost, and waste and boost production and market reach. In contrast, collaboration across horticulture SC players increases negotiating power for better pricing, shares knowledge and resources, provides training, and increases market access, maximizing efficiency. Smallholders also require accessible and timely agricultural loans to invest in their fields, buy inputs, and adopt the latest technologies to become more efficient [45,46,47,48]. SC Infrastructure (HSCE1), Agricultural Credit (HSCE2), and SC Collaboration (HSCE3) are important factors in HSCE that have been identified based on theory and literature review.
Similarly, livelihood security is seen as a precondition for livelihood development [49,50]. Though studies confirm horticulture’s ability to strengthen farmer livelihoods [51,52,53,54,55]. Low farm gate prices and limited market access [56,57,58] hinder livelihood security [49,50], which need to be addressed. Food and nutritional security (SLD1), economic security (SLD2), ecological security (SLD3), social security (SLD4), psychological security (SLD5), and physical security (SLD6) have been identified and used to measure the outcome variable. Further, market risk mitigation (FPO1) and economies of scale (FPO2) have been used to measure FPO intervention, as a moderating variable. FPO uses efficient and effective use of common resources through technology and extension services help attain economies of scale in production, which enhances their revenue [59,60]. This not only empowers smallholders, but also boost rural development with sustainably. Further, FPOs provide training, quality control, and marketing assistance for an effective market share, customer service, and farmer returns [61,62,63]. FPOs reduce market risk through retail marketing, spot markets, futures trading, cooperative and exporter collaboration, and direct marketing [64,65,66]. Authorities like the World Bank and UNDP encourage FPO establishment and empowerment via policy and financial tools, acknowledging their importance. Thus, FPOs improve SC efficiency and empower farmers [63,67,68].
2.2.1.1. SC Infrastructure and Smallholders’ Livelihood Development
HSCE needs infrastructure to create livelihoods and ensure the smooth operation of the supply chain. Input, resource, and physical infrastructure increase farmers’ production, productivity, and services and decrease environmental uncertainty, resulting in higher income, lower costs, and better livelihoods [35,69,70]. Thus, we can hypothesize:
H1.
There is a significant relationship between HSCE1 in HSCE and SLD.
2.2.1.2. Agricultural Credit and Smallholders’ Livelihood Development
Credit is the most significant element in all agricultural development programs. Seeds, fertilizers, pesticides, animal feed, marketing, production, and investment need financing (short, medium, and long-term). Smallholders borrowing from moneylenders or relatives at high-interest rates and with collateral may make agricultural activities unprofitable [71,72]. Providing easy and affordable agricultural credit to is a critical factor in improving farmer livelihoods [73,74]. Thus, we posit that:
H2.
There is a significant relationship between HSCE2 in HSCE and SLD.
2.2.1.3. Supply Chain Collaboration and Smallholders’ Livelihood Development
HSCE through SC collaboration is generally recognised in high-value food SCs, assures food quality and safety compliance, and enhances smallholder returns. Weak collaboration in the agri-food SC leads to high SC costs in developing countries. Collaboration helps in product development, planning, forecasting, procurement, information sharing, and capital expenditures [75,76,77,78,79,80,81]. Thus, we posit that:
H3.
There is a significant relationship between HSCE3 in HSCE and SLD.
2.2.1.4. FPOI Moderation Effect
The efficiency of SC may be enhanced by the efforts of FPO by improving infrastructure, market intelligence, collaboration, smooth execution of government policy and procedure, credit facility, and decreasing intermediaries to boost smallholder livelihoods [65,82,83]. Thus, we can hypothesize:
H4.
There is a significant relationship between FPOI and SLD.
Infrastructure development is crucial for boosting production, reducing post-harvest losses, and accessing markets [84]. FPO may help provide the infrastructure that improves their members and the agricultural community’s livelihoods [85]. Thus, we posit that:
H5.
There is a significant moderation effect of FPOIbetween HSCE1 in HSCE and SLD.
Cluster-Based Business Organizations (CBBOs) promote FPOs, whereas SFAC, NAFED, NCDC, NERAMAC, NABARD, and state governments implement them. Implementing agencies help agricultural communities affiliated with FPOs to access institutional financing. Agriculture credit aids pre- and post-harvest operations, storage, processing, ripening chambers, logistics, and marketing. The ultimate objective of these endeavors is to ensure that the agricultural communities receive satisfactory remuneration for their products, thereby leading to an enhancement in their overall livelihood [22,85,86,87]. Thus, we can hypothesize:
H6.
There is a significant moderation effect of FPOI between HSCE2 in HSCE and SLD.
The FPOs foster a sustainable and conducive environment for the farmers with strong collaborative culture with different stakeholders. This helps overcome SC challenges related to pre and post-harvest operations. This ensures that smallholders receive equitable and holistic livelihoods [22,68,85,87]. Thus, we can hypothesize:
H7.
There is a significant moderation effect of FPOI between HSCE3 in HSCE and SLD.
3. Research Methodology
This cross-sectional mixed-method research collects, analyses, and interprets quantitative and qualitative data [88,89] from both primary and secondary sources.
Responses were collected using a 7-point Likert scale from four of Tripura’s eight districts (West-Tripura, Dhalai, Gomati, and Sipahijala) from smallholders affiliated with FPOs registered with the "Promotion of 10000 FPOs scheme" and the "MOVCDNER (Mission Organic Value Chain Development for Northeast Region) scheme" under various implementing and promotional agencies. This study used purposive sampling in a non-probability sampling design to include people with the necessary information or meeting the researchers’ criteria [89]. The minimum sample size of 405 for SEM has been calculated using a confidence interval [90,91], which is considered adequate for multivariate analysis, including regression.
3.1. Measures with Face and Language Validity
The present study pertains to the development and validation of the measurement tool (see Appendix A- Table A1). Developing and validating an instrument for specific contexts is a prevalent research practice, particularly when the original scale was formulated for a distinct population or environment based on a literature review, interview, and expert opinions. Initially, the face and linguistic validation have been duly considered to address this purpose. Face validity is a researcher’s subjective assessment of whether an instrument’s items are pertinent, practicable, reasonable, unambiguous, and clear [92,93,94]. In contrast, Linguistic validation ensures that the instrument is conceptually and semantically identical to the source language following translation and cross-cultural adaptation [95,96]. Since Bengali and Hindi speakers make up most of the state’s population, English is translated into those languages. Two experts’ suggestions and feedback were used at each stage to refine and develop the instrument further.
4. Data Analysis and Findings
The study uses Microsoft Excel & Word 2016, SPSS 25.0, and SmartPLS 4.0 for its tabulation, analysis, and presentation of data for both the Pilot and Main study. The pilot study used Factor Analysis, a combination of EFA (SPSS 25) and CFA (SmartPLS, PLS-SEM) for instrument development and reliability. The pilot study found all significant results within the threshold preceding the instrument’s reliability, understandability, and internal consistency after removing below threshold items, i.e., HSCE2.2, HSCE2.4, HSCE3.2 and HSCE3.5 based on the rotated component matrix. However, the study didn’t find any moderating effect of the FPO intervention in the model. This doesn’t align with the final study, which has shown a moderation effect. This may be limited statistical power and restricted variation in the institutional context in the pilot study, which has been eliminated in the main study with a more heterogeneous study.
4.1. Final Study
4.1.1. Measurement Model
4.1.2. Discriminate Validity
To evaluate the distinctiveness of each factor, researchers may apply a standardised method called the heterotrait-monotrait ratio of correlations (HTMT) [103,104]. All the constructs in the current investigation had HTMT values below the cutoff of 0.85 [105], making them statistically significant (can be seen in Table 2).
4.1.3. Structural Model
Each construct’s VIF threshold below 5.0 shows no multi-collinearity, and also used bootstrapping with 5,000 resampling iterations with a significance level of 0.05 [101,106]. The findings of direct and moderating relationships are depicted in Table 3. All the relationships have been found significant, i.e., H1, H2, H3, and H4, positively and remaining negatively linked to the moderation effect.
4.1.4. Coefficient Determination (R2) & Predictive Relevance (Q2) Analysis
The coefficient of determination (R2), with a value of 0.652, indicates that the independent variables explain approximately 65% of the variance in SLD (Table 5). To ensure the construct’s predictive accuracy, the values of Q2 must exceed zero, as evident in the analysis (Table 4).
4.2. Common Method Variance (CMV)/ Common Method Bias (CMB
Common Method Variance (CMV) is a potential threat to internal validity in research, particularly when using self-reported data like surveys. Addressing CMV is crucial to studying reliability and accuracy. Hence, “Haarman Single-Factor” test has been used for this concern, which explains variance in the data in a single underlying factor. 22.86% variance (see Appendix A- Table A2) has been explained below the threshold of 50% that suggests minimum CMV [107,108].
5. Discussion
The statistical results reveal that SC Infrastructure, Agricultural Credit, SC Collaboration, and FPO intervention have direct impact on SLD, which aligns with the existing theory. SC collaboration has been found important factor in the model follwed by agricultural credit and SC infrastructure. The variables stated above play a significant role in supporting the well-being of small-scale farmers by enabling them to achieve numerous forms of security, such as food and nutrition, economic, ecological, social, psychological, and physical security. These factors contribute to HSCE through product development, innovation, planning, forecasting, pre-and post-harvest activities, market access, sourcing, information sharing, and investment decisions, ensuring compliance with food quality and safety standards, and promoting increased returns and livelihoods for smallholder farmers.
Statistical analysis also demonstrates that the FPOI has a very low and negatively significant impact on SLD. This lies in the fact that when FPOs are immature, they fail to pool, coordinate and leverage the infrastructure, credit and collaboration optimally. As a result, FPOs fail to amplify but rather reduce the livelihood benefits with weak financial intermediation, limited governance and coordination. Based on an extensive literature review, expert advice, and in-depth interviews, the following answers may be posited to strengthen the argument:
- FPOs face challenges in obtaining financial resources, market access, infrastructure support, autonomy, information, training, and extension services due to their infancy, ranging from one to three years. It requires time for farmers to register with FPOs to receive equity for routine operations. Due to the low or no equity grants, financing, and credit extended by institutions, the majority of FPOs function exclusively on shareholding price money. The majority of producers obtain financing through the Kishan Credit Card (KCC).
- Through a variety of schemes, machinery, conservatories, and polyhouses are made available to specific producers. Farmers frequently remit exorbitant charges to local leasing agencies for the basic infrastructure. Although FPOs refer to a geographical or regional aggregation, farmers and land are not more closely located in the region, which increases the cost for farmers to utilise the readily available common infrastructure. In areas with fragmented landholdings, uniting farmers into a cohesive FPO presents a hurdle. This fragmentation can hinder economies of scale, hamper collective farming practices, and weaken their bargaining power for both input costs and output prices. Although FPOs rely on various initiatives or subsidies to gain access to critical infrastructure, the majority of them possess transportation facilities but do not have cold chain facilities. Further, not all farmers have access to irrigation facilities; rather, they depend on reservoirs, rivers, or ponds.
- Limited institutional support poses a significant challenge to FPOs to navigate complexities and achieve long-term success.
- The limited technical acumen of FPO members concerning modern farming methods hinders the maximisation of productivity.
- The hilli tarreins and locations of FPOs creates problem to access markets with increased cost.
- Building strong, reliable market linkages and a lack of collective bargaining power in securing fair pricing for their produce remain key challenges for FPOs.
- Mostly, FPOs don’t find local organized sectors profitable, hence sell their products at higher prices in the local unorganized market, which increases the wastage and reduces quality.
- Most of the FPOs in Tripura operate in a supply-driven market at a lower farm gate price, instead of a demand-driven market. However, in a few instances, FPOs sell their products sometimes in foreign markets like Singapore and Dubai at twice or thrice the value of the local market.
- FPOs have immense potential to empower farmers, but with limited governance, leadership and technical skills, makes it vulnerable to internal conflicts. This leads to dysfunction and missing opportunities for collective growth.
- Caste divisions can further creates ingrained hierarchy with trust issues among members, leading to ineffectiveness of FPOs. Scepticism and reluctance to new technology create another level of obstacles compared to Traditional farming practices that have passed down through generations as a sign of cultural norms [109,110,111].
According to the existing literature, the FPOs moderate SC infrastructure, Agricultural Credit, and SC collaboration to ensure smallholders’ livelihoods. In contrast, the moderating effect is optimal, but rather dampening in the context. This may be due to the infancy of operational excellence in the state. The FPOs may moderate the domain in the future for SLD through inexpensive input procurement, reduced intermediary costs, equitable collective market access, and training and extension services that boost output, productivity, and economies of scale. To considerably alter the smallholder’s way of life and means of subsistence, they must substantially increase their contributions. Further, there is a much-needed robust governance structure that includes transparency and good leadership, which will empower members and address conflicts constructively to unlock the true potential of FPOs.
5.1. Theoretical Implications
The data demonstrates that efficient SC helps smallholders improve their standard of living. However, the research did not discover the expected moderate effect of FPO on applying Porter’s Cluster Theory, which might help smallholders overcome the resource curse. There is still confusion among FPOs about fundamental roles and responsibilities under both schemes. Important to the success of FPOs is timely and sufficient government or agency assistance. For smallholders to reap the benefits of the clusters, FPOs must exert additional effort to be seen in meaningful action. As a result, productivity and living standards among rural smallholders will improve. FPOs need institutional backing through internal capacity development and increased authority to effectively execute Cluster-based techniques. FPO intervention in the SC can enhance infrastructure, market intelligence, collaboration, government policy implementation, and credit facilities and reduce intermediaries, resulting in increased efficiency in agriculture and boosting smallholder livelihoods [65,82,83]. FPO uses efficient, cost-effective, and sustainable resource use through training and extension services to maximise income-generative production and productivity. FPOs offer members real-time demand, supply, price, location, spot markets, futures trading, and direct marketing options to reduce market risks [59,60,64,65,66,112].
5.2. Policy Implications
FPOs are crucial for building inclusive and sustainable supply chains by connecting smallholder farmers to markets. Model selection should fit local needs, while FPOs must secure profitable market linkages and access to credit guarantee funds. The RKVY (Rashtriya Krishi Vikas Yojana) scheme’s institutional reforms highlight the importance of FPOs for empowering small and marginal farmers. Government agencies SFAC and NABARD offer support alongside state-level grants, licenses, subsidies, and farm-gate sale policies. Along with the existing schemes and policies, policymakers should establish a multi-tier FPO institutional architecture that may comprise regional and central organisations for FPOs. The regional institutions would coordinate production planning, logistics, cold chain management and local market linkage, while the centre would generate market intelligence, integrated demand from urban, institutional buyers, processing units and export markets. This will form a network of FPOs across regions to meet the demand-supply gaps, enhance price realisation, and minimising post-harvet losses through logistics coordination. This framework at the national level will shift FPOs from isolated operational units to interconnected nodes within a demand-driven SC. This will transform the supply-driven FPOs to demand-driven institutions, which will strengthen the sustainable livelihood of smallholders. Further, an adaptive AI-based agricultural supply chain may be developed to fully automate the process efficiently and effectively.
6. Conclusion & Future Scope
Three independent variables (HSCE1, HSCE2, and HSCE3), one dependent variable (SLD), and one moderating variable (FPOI) make up the conceptual framework for this study. According to the study’s findings, HSCE and FPOI account for around 65% of SLD’s explanatory power variance. Collaboration across SC has significantly influenced SLD, followed by providing agricultural credit, developing SC infrastructure, and the FPO intervention. Therefore, FPOs’ smooth functioning is crucial to the continued well-being of smallholders. It may take some time for these variables to have a moderating role in further developing FPOs. Significant insights into the overall progress across various dimensions can be gained from the success stories of numerous FPOs, including Sahyadri Farmer Producer Company (FPC) in Maharashtra and DHARANI in Telangana, as well as those from Odisha, Rajasthan, Chhattisgarh, Madhya Pradesh, and other states. Leadership, farmer loyalty, efficient internal governance, professionalism, participatory approach, vertical and horizontal integration, non-bureaucratic mode of operation, local culture of farmers, technological and infrastructure advancements, market access, branding, compliances, employee dedication, and capacity building, all these areas must be given priority in overall FPO development [113,114,115]. The moderating impact of FPO intervention on the association between HSCE and SLD may be further understood in future studies witth broader scope utilising a similar research approach. The horticulture SC needs a complete restructuring with the intervention of FPO for efficiency to boost profits, employment, and rural commercialisation [6,116,117]. Policymakers may find the study useful in promoting sustainability, efficiency in SC, and equitable agricultural growth for smallholders.
Author Contributions
Conceptualization, L.K.J. and D.M.; methodology, L.K.J. and D.M.; software, L.K.J.; validation, L.K.J., D.M., S.C. and M.I.; formal analysis, L.K.J. and D.M.; investigation, L.K.J.; resources, M.I.; data curation, L.K.J.; writing—original draft preparation, L.K.J.; writing—review and editing, D.M. and M.I.; visualization, L.K.J.; supervision, D.M. and M.I.; project administration, D.M.; funding acquisition, M.I. All authors have read and agreed to the published version of the manuscript.
Funding
The APC was partially funded by Keimyung University, Daegu, South Korea.
Conflicts of Interest
The authors declare no conflicts of interest.
Appendix A. Instrument Items
Appendix A.1

Table A1.
Items of the Instrument and its sources.
| Variables | Item No | Items | Source (s) |
| Independent Variable (Horticultural Supply Chain Efficiency-HSCE) | |||
| SC Infrastructure (HSCE1) | HSCE1.1 | I have required access to input-based infrastructure (Seed, Fertiliser, pesticides, Farm Equipment, and machinery). | [118] |
| HSCE1.2 | I am satisfied with the access to resource-based infrastructure (Irrigation, electricity). | ||
| HSCE1.3 | I feel satisfied with my access to Physical infrastructure (Road connectivity, Transport, Storage, Processing, and Preservative). | ||
| HSCE1.4 | My access to training and skill development centres makes me feel satisfied. | ||
| Agricultural Credit (HSCE2) | HSCE2.1 | I prefer to take a loan from institutional sources for agricultural credit. | [119] |
| HSCE2.2 | Getting a loan is easier from non-institutional sources than from an institutional source as agricultural credit. | ||
| HSCE2.3 | I feel the rate of interest in Agri-finance is minimal and affordable. | ||
| HSCE2.4 | Banks disburse the credit whenever I require it (pre and post-harvest operations). | ||
| HSCE2.5 | I feel government policies and procedures towards agricultural credit are satisfactory. | ||
| SC Collaboration (HSCE3) | HSCE3.1 | I receive relevant information on demand, price, and place of sale through supply chain collaboration. | [120] |
| HSCE3.2 | I receive information regarding promotion events through supply chain collaboration. | ||
| HSCE3.3 | Collaboration gives me the opportunity for a new variety of horticultural product development. | ||
| HSCE3.4 | Collaboration helps me to access the latest agricultural technology. | ||
| HSCE3.5 | Collaboration gives me delivery status and tracking of goods in transit. | ||
| HSCE3.6 | I keep myself updated with weather information. | [120] | |
| HSCE3.7 | I avoid crop loss using necessary technical information (latest farming equipment and other Agri-related information on time). | ||
| Moderating Variable (FPOIntervention) | |||
| Market risk mitigation (FPOI1) | FPOI1.1 | FPO helps me increase equitable access to established markets for a fair price for my produce. | [121] |
| FPOI1.2 | FPO helps me increase the bargaining power for my products in the market. | ||
| FPOI1.3 | I am satisfied with FPO for Protecting me from the exploitation of intermediaries. | [122] | |
| FPOI1.4 | I am satisfied with FPO for Protecting me from seasonal and non-seasonal price fluctuations. | [123] | |
| FPOI1.5 | I feel satisfied when the government purchases my produce as an intermediary. | [124] | |
| Economies of scale (FPOI2) | FPOI2.1 | FPO helps me in attaining increased productivity in my field through training, development & extension service. | [121] |
| FPOI2.2 | I am satisfied with the increased return for my produce through FPO. | [123] | |
| FPOI2.3 | I am satisfied with FPO for lowering transportation costs. | ||
| FPOI2.4 | FPO helps me in saving time. | ||
| FPOI2.5 | FPO helps me in lowering input & production costs. | ||
| Dependent Variable (Smallholders Livelihood Development) | |||
| Food and nutritional security (SLD1) | SLD1.1 | I feel satisfied that horticulture provides food for my family and me throughout the year. | [125] |
| SLD1.2 | The quality of food available to my family and me makes me feel secure. | ||
| SLD1.3 | I am getting an affordable, balanced diet for my family members and me. | ||
| Economic security (SLD2) | SLD2.1 | I get maximum and stabilised income through farming. | [125] |
| SLD2.2 | I am able to diversify my income through horticultural production. | ||
| SLD2.3 | I am able to save money for my family’s future. | ||
| SLD2.4 | E- The horticultural production ensures my family’s employment. | ||
| Ecological security (SLD3) | SLD3.1 | I am able to use water efficiently. | [125] |
| SLD3.2 | I reuse the horticultural wastage for farming. | ||
| SLD3.3 | I use a minimum amount of chemical fertiliser and pesticides for horticultural production. | ||
| SLD3.4 | I am able to maintain soil fertility and soil health through diversified farming. | ||
| Social security (SLD4) | SLD4.1 | Practicing horticulture production gives me good recognition in the society. | [125] |
| SLD4.2 | I am able to coordinate with government or extension agencies through horticulture. | ||
| SLD4.3 | I am satisfied with the increased coordination with other stakeholders. | ||
| Psychological security (SLD5) | SLD5.1 | I find myself improving my knowledge and skills in horticulture production. | [125] |
| SLD5.2 | Experience in Horticultural production improves my confidence to try new ideas on my farm and interact with others. | ||
| SLD5.3 | Horticulture has created demand among farmers to visit my farm and seek my advice. | ||
| SLD5.4 | I am able to overcome my stress condition through horticultural produce with an increased return. | ||
| Physical security (SLD6) | SLD6.1 | My piece of land for horticulture practice makes me feel secure. | [125] |
| SLD6.2 | My pieces of farm machinery for horticulture practice are a means of security for me. | ||
| SLD6.3 | The availability of an irrigation facility for my land makes me feel secure. | ||
| SLD6.4 | I feel secure in having a logistic infrastructure for marketing my horticultural produce. | ||
Table A2.
Harman single-factor test.
| Total Variance Explained | ||||||
|---|---|---|---|---|---|---|
| Component | Initial Eigenvalues | Extraction Sums of Squared Loadings | ||||
| Total | % of Variance | Cumulative % | Total | % of Variance | Cumulative % | |
| 1 | 20.531 | 22.951 | 22.951 | 20.531 | 22.951 | 22.951 |
| 2 | 4.861 | 5.434 | 28.385 | |||
| 3 | 4.242 | 4.742 | 33.126 | |||
| 4 | 3.767 | 4.211 | 37.338 | |||
| 5 | 3.678 | 4.112 | 41.450 | |||
| 6 | 3.407 | 3.808 | 45.258 | |||
| 7 | 3.029 | 3.386 | 48.644 | |||
| 8 | 2.803 | 3.133 | 51.777 | |||
| 9 | 2.656 | 2.969 | 54.746 | |||
| 10 | 2.327 | 2.602 | 57.348 | |||
| 11 | 2.167 | 2.423 | 59.770 | |||
| 12 | 2.022 | 2.260 | 62.030 | |||
| 13 | 1.970 | 2.202 | 64.232 | |||
| 14 | 1.857 | 2.076 | 66.308 | |||
| 15 | 1.787 | 1.998 | 68.306 | |||
| 16 | 1.737 | 1.942 | 70.248 | |||
| 17 | 1.622 | 1.813 | 72.061 | |||
| 18 | 1.580 | 1.766 | 73.827 | |||
| 19 | 1.545 | 1.727 | 75.555 | |||
| 20 | 1.472 | 1.645 | 77.200 | |||
| 21 | 1.394 | 1.559 | 78.759 | |||
| 22 | 1.356 | 1.516 | 80.275 | |||
| 23 | 1.230 | 1.375 | 81.650 | |||
| 24 | 1.185 | 1.325 | 82.975 | |||
| 25 | 1.145 | 1.279 | 84.254 | |||
| 26 | 1.096 | 1.225 | 85.480 | |||
| 27 | 1.029 | 1.150 | 86.630 | |||
| 28 | 1.013 | 1.133 | 87.763 | |||
| 29 | .996 | 1.113 | 88.876 | |||
| 30 | .933 | 1.043 | 89.919 | |||
| 31 | .878 | .982 | 90.900 | |||
| 32 | .855 | .956 | 91.856 | |||
| 33 | .850 | .950 | 92.807 | |||
| 34 | .776 | .867 | 93.674 | |||
| 35 | .739 | .827 | 94.501 | |||
| 36 | .683 | .763 | 95.264 | |||
| 37 | .665 | .744 | 96.008 | |||
| 38 | .612 | .684 | 96.692 | |||
| 39 | .574 | .641 | 97.333 | |||
| 40 | .535 | .598 | 97.931 | |||
| 41 | .509 | .569 | 98.500 | |||
| 42 | .460 | .515 | 99.015 | |||
| 43 | .448 | .501 | 99.515 | |||
| 44 | .434 | .485 | 100.000 | |||
| Extraction Method: Principal Component Analysis. | ||||||
References
- Kapil, S. Agri Share in GDP Hit 20% after 17 Years: Economic Survey. Down To Earth. 2021. Available online: https://www.downtoearth.org.in/news/agriculture/agri-share-in-gdp-hit-20-after-17-years-economic-survey-75271.
- Ministry of Agriculture; Farmers Welfare (MoAFW). Horticulture Overview. Government of India. 2020. Available online: https://www.agricoop.gov.in/en/divisiontype/horticulture.
- Government of India (GoI). Agricultural Statistics at a Glance 2021; Ministry of Agriculture & Farmers Welfare: New Delhi, India, 2021; Available online: www.agricoop.nic.in.
- Karabhari, R.B.; Patil, R.M. Strengthening Rural Livelihood through Nutrition Gardening. Indian Journal of Applied Research 2015, 5, 4. [Google Scholar]
- Government of Tripura. Annual State Plan 2021–2022; Planning Department, Government of Tripura: Agartala, India, 2021. [Google Scholar]
- Weinberger, K.; Lumpkin, T.A. Diversification into Horticulture and Poverty Reduction: A Research Agenda. World Development 2007, 35, 1464–1480. [Google Scholar] [CrossRef]
- Keatinge, J.D.H.; Virchow, D.; Schreinemachers, P. Horticulture for Sustainable Development: Evidence for Impact of International Vegetable Research and Development. Acta Horticulturae 2018, 1205, 179–190. [Google Scholar] [CrossRef]
- PNBIndia. Horticulture in Tripura . 2015. Available online: https://slbctripura.pnbindia.in/pdf/Horticulture_Tripura.pdf.
- GoI MIDH. Mission for Integrated Development of Horticulture (MIDH) Guidelines; Ministry of Agriculture & Farmers Welfare: New Delhi, India, 2014; Available online: http://www.midh.gov.in/PDF/MIDH_Guidelines(final).pdf.
- RBI. Supply Chain Dynamics and Food Inflation in India . 2019. Available online: https://www.researchgate.net/publication/348993994_Supply_Chain_Dynamics_and_Food_Inflation_in_India.
- Jayalath, M.M.; Ratnayake, R.C.; Perera, H.N.; Thibbotuwawa, A. Waste minimization and performance improvement in vegetable supply chains: A case study from a developing economy. In Proceedings of the 8th International Conference on Business and Industrial Research (ICBIR 2023); IEEE: Bangkok, Thailand, 2023; pp. 948–953. [Google Scholar]
- Islam, M.; Mukherjee, D.; Jena, L.K.; Chakraborty, S.; Hasan, K.K.; Debnath, R. Antecedents of livelihood development using cold chains in the horticultural sector of emerging markets: A systematic literature review. Horticulturae 2022, 8, 1196. [Google Scholar] [CrossRef]
- Dastagiri, M.B.; Ganesh Kumar, B.; Hanumanthaiah, C.V.; Paramsivam, P.; Sidhu, R.S.; Sudha, M.; Mandal, S.; Singh, B.; Chand, K. Marketing efficiency of India’s horticultural commodities under different supply chains. Outlook on Agriculture 2012, 41, 271–278. [Google Scholar] [CrossRef]
- PIB Delhi, & NSO Consumer Price Index Numbers on Base 2012 = 100 for Rural, Urban and Combined for the Month of June 2022. 2022. Available online: https://pib.gov.in.
- Bhagat, D. Some Aspects Concerning Supply Chain of High Value Agricultural Commodities and Smallholders in Garo Hills of Meghalaya . Ph.D. Thesis, Gauhati University, Guwahati, India, 2012. [Google Scholar]
- Kaldate, R.; Singh, S.K.; Guleria, G.; Soni, A.; Naikwad, D.; Kumar, N.; Meshram, S.; Rana, M. Current approaches in horticultural crops to mitigate the effect of drought stress. In Stress Tolerance in Horticultural Crops; Elsevier: Amsterdam, The Netherlands, 2020; pp. 213–240. [Google Scholar] [CrossRef]
- PIB MoAFW. Horticulture sector can play an important role in doubling farmers’ income. 2021. Available online: https://pib.gov.in/PressReleaseIframePage.aspx?PRID=1717447.
- Viswanadham, N. Can India Be the Food Basket for the World? Working Paper; Indian School of Business: Hyderabad, India, 2007; Available online: https://www.csa.iisc.ac.in/~nv/Mypublications/2005-06publications/Thoughtlaedrshippapers/canIndiabethefoodbasket.pdf.
- Kumar, K.K. A study on supply chain management in the Indian horticulture sector: Issues and challenges. Indian Journals 2020, 10, 45–53. [Google Scholar]
- Halder, P.; Pati, S. A need for paradigm shift to improve supply chain management of fruits and vegetables in India. Asian Journal of Agriculture and Rural Development 2011, 1, 1–20. [Google Scholar]
- Negi, S. Developing a Framework to Improve Supply Chain Efficiency of Fruits and Vegetables Sector . Ph.D. Thesis, University of Petroleum and Energy Studies, Dehradun, India, 2018. [Google Scholar]
- NAFPO. State of Sector Report: Farmer Producer Organisations in India; NAFPO: New Delhi, India, 2022; Available online: https://www.nafpo.in/wp-content/uploads/2022/07/SOFPO_Report_(06-07-22)_Hi-res_WCM.pdf.
- Auty, R. Sustaining Development in Mineral Economies: The Resource Curse Thesis; Routledge: London, UK, 1993. [Google Scholar] [CrossRef]
- Auty, R. Resource-Based Industrialisation: Sowing the Oil in Eight Developing Countries; Clarendon Press: Oxford, UK, 1990. [Google Scholar]
- Busse, M.; Gröning, S. The resource curse revisited: Governance and natural resources. Public Choice 2013, 154, 1–20. [Google Scholar] [CrossRef]
- Cappelen, A.W.; Fjeldstad, O.H.; Mmari, D.; Sjursen, I.H.; Tungodden, B. Understanding the resource curse: A large-scale experiment on corruption in Tanzania. Journal of Economic Behavior & Organization 2021, 183, 129–157. [Google Scholar] [CrossRef]
- Iimi, A. Escaping from the resource curse: Evidence from Botswana and the rest of the world. IMF Staff Papers 2007, 54, 663–699. [Google Scholar] [CrossRef]
- Kelley, J. China in Africa: Curing the resource curse with infrastructure and modernisation. Sustainable Development Law & Policy 2012, 12, 35–41. Available online: http://digitalcommons.wcl.american.edu/sdlp.
- Konijn, P. Chinese resources-for-infrastructure (R4I) swaps: An escape from the resource curse? South African Institute of International Affairs. 2014. Available online: www.saiia.org.za.
- McPhail, K. Global governance challenges in industry sectors and supply chains: Contributing to sustainable development through multi-stakeholder processes—Practical steps to avoid the “resource curse”. Corporate Governance 2008, 8, 471–481. [Google Scholar] [CrossRef]
- Poncian, J. Extractive resource ownership and the subnational resource curse: Insights from Tanzania. The Extractive Industries and Society 2019, 6, 332–342. [Google Scholar] [CrossRef]
- Wenar, L. Property rights and the resource curse. Philosophy & Public Affairs 2008, 36, 2–32. [Google Scholar] [CrossRef]
- Shah, A. Natural resources and chronic poverty in India: Interface and policy imperatives. In Environment and Development Economics: Essays in Honour of Sir Partha Dasgupta; Oxford University Press: Oxford, UK, 2014; p. 359. [Google Scholar] [CrossRef]
- Alimov, A.; Boldyreva, S.B.; Alimov, A.K.; Adilchaev, R.T.; Idzhilova, D.V.; Chadlaeva, N.E. On the development of cluster theory. International Journal of Management 2020, 11, 749–759. [Google Scholar] [CrossRef]
- Ayele, G.; Moorman, L.; Wamisho, K.; Zhang, X. Infrastructure and cluster development: A case study of handloom weavers in Ethiopia. International Food Policy Research Institute. 2010. Available online: http://www.ifpri.org.
- Porter, M.E. Clusters and the new economics of competition. Harvard Business Review 1998, 76, 77–90. [Google Scholar]
- Swords, J. Michael Porter’s cluster theory as a local and regional development tool: The rise and fall of cluster policy in the UK. Local Economy 2013, 28, 369–383. [Google Scholar] [CrossRef]
- Lan, W.; Zhangliu, W. Research on the governance of industrial clusters. In Future Wireless Networks and Information Systems; Springer: Berlin, Germany, 2012; pp. 395–401. [Google Scholar] [CrossRef]
- Chambers, R. From PRA to PLA and Pluralism: Practice and Theory; Institute of Development Studies: Brighton, UK, 2007; Available online: www.ids.ac.uk/ids/bookshop.
- Merton, R.K. The focused interview and focus groups: Continuities and discontinuities. Public Opinion Quarterly 1987, 51, 550–566. [Google Scholar] [CrossRef]
- Van der Vorst, J.G.A.J.; Beulens, A.J.M. Identifying sources of uncertainty to generate supply chain redesign strategies. International Journal of Physical Distribution & Logistics Management 2002, 32, 409–430. [Google Scholar] [CrossRef]
- Kumar, K. A study on supply chain management in Indian horticulture sector. ITIHAS—The Journal of Indian Management 2019, 45–53. [Google Scholar]
- Gardas, B.B.; Raut, R.D.; Narkhede, B. Evaluating critical causal factors for post-harvest losses in the fruit and vegetables supply chain in India using the DEMATEL approach. Journal of Cleaner Production 2018, 199, 47–61. [Google Scholar] [CrossRef]
- Rais, M.; Sheoran, A. Scope of supply chain management in fruits and vegetables in India. Journal of Food Processing & Technology 2015, 6, 1–7. [Google Scholar]
- Negi, S. Supply chain efficiency framework to improve business performance in a competitive era. Management Research Review 2021, 44, 477–508. [Google Scholar] [CrossRef]
- Reiner, G.; Hofmann, P. Efficiency analysis of supply chain processes. International Journal of Production Research 2006, 44, 5065–5087. [Google Scholar] [CrossRef]
- Johnson, G.I.; Hofman, P.J. Agriproduct Supply-Chain Management in Developing Countries; ACIAR: Canberra, Australia, 2004. [Google Scholar]
- Fan, J.; Gao, L. Vegetables logistics informationization in supply chain. In Proceedings of the 9th IEEE Conference on Industrial Electronics and Applications; IEEE: Hangzhou, China, 2014; pp. 117–120. [Google Scholar]
- Nath, P.K.; Behera, B. A critical review of impact of and adaptation to climate change in developed and developing economies. Environment, Development and Sustainability 2011, 13, 141–162. [Google Scholar] [CrossRef]
- Pani, B.S.; Mishra, D. Sustainable livelihood security in Odisha, India: A district level analysis. Regional Sustainability 2022, 3, 110–121. [Google Scholar] [CrossRef]
- Galhena, D.H.; Freed, R.; Maredia, K.M. Home gardens: A promising approach to enhance household food security and wellbeing. Agriculture & Food Security 2013, 2, 8. [Google Scholar] [CrossRef]
- Rai, M.K.; Paudel, B.; Zhang, Y.; Khanal, N.R.; Nepal, P.; Koirala, H.L. Vegetable farming and farmers’ livelihood: Insights from Kathmandu Valley, Nepal. Sustainability 2019, 11, 889. [Google Scholar] [CrossRef]
- Ulrich, A. Export-oriented horticultural production in Laikipia, Kenya: Assessing the implications for rural livelihoods. Sustainability 2014, 6, 336–347. [Google Scholar] [CrossRef]
- Yasmin, T.; Khattak, R.; Ngah, I. Eco-friendly kitchen gardening by Pakistani rural women developed through a farmer field school participatory approach. Biological Agriculture & Horticulture 2014, 30, 32–41. [Google Scholar] [CrossRef]
- Zhang, L.; Kono, Y.; Kobayashi, S. The process of expansion in commercial banana cropping in tropical China: A case study at a Dai village, Mengla County. Agricultural Systems 2014, 124, 32–38. [Google Scholar] [CrossRef]
- Alam, G.M.M.; Khatun, M.N. Impact of COVID-19 on vegetable supply chain and food security: Empirical evidence from Bangladesh. PLOS ONE 2021, 16, e0248120. [Google Scholar] [CrossRef] [PubMed]
- Middendorf, B.J.; Traoré, H.; Middendorf, G.; Jha, P.K.; Yonli, D.; Palé, S.; Prasad, P.V.V. Impacts of the COVID-19 pandemic on vegetable production systems and livelihoods: Smallholder farmer experiences in Burkina Faso. Food and Energy Security 2022, 11, e337. [Google Scholar] [CrossRef] [PubMed]
- Sibomana, M.S.; Workneh, T.S.; Audain, K. A review of post-harvest handling and losses in the fresh tomato supply chain: A focus on Sub-Saharan Africa. Food Security 2016, 8, 389–404. [Google Scholar] [CrossRef]
- Ministry of Agriculture; Farmers Welfare (MoAFW). Role of Farmer Producer Organisations (FPOs) in Doubling Farmers’ Income; Press Information Bureau: New Delhi, India, 2021; Available online: https://pib.gov.in/PressReleasePage.aspx?PRID=1740833.
- Möhring, J. Clusters: Definition and methodology. In Competitive Regional Clusters: National Policy Approaches; OECD Publishing: Paris, France, 2006; pp. 21–32. [Google Scholar] [CrossRef]
- Gummagolmath, K.C.; Valamannavar, S.; Darekar, A.; Lakshmi, S.B.R. Role of Farmer Producer Organizations in Empowering Farmers: Case Studies from India; MANAGE: Hyderabad, India, 2022. [Google Scholar]
- Khushbu. What are the benefits of producer company, 2023. Available online: https://vakilsearch.com/blog/benefits-of-producer-company/.
- Bikkina, N.; Turaga, R.M.R.; Bhamoriya, V. Farmer producer organisations as farmer collectives: A case study from India. Development Policy Review 2018, 36, 669–687. [Google Scholar] [CrossRef]
- Birthal, P.S.; Jha, A.K.; Singh, H. Linking farmers to markets for high-value agricultural commodities. Agricultural Economics Research Review 2007, 20, 425–439. [Google Scholar]
- Singh, G.; Vatta, K. Assessing the economic impacts of farmer producer organisations: A case study in Gujarat, India. Agricultural Economics Research Review 2019, 32, 139. [Google Scholar] [CrossRef]
- Singh, S. Contracting out solutions: Political economy of contract farming in the Indian Punjab. World Development 2002, 30, 1621–1638. [Google Scholar] [CrossRef]
- Das, S. Supply chain of millets: An FPO perspective (with special reference to Odisha). Journal of Global Values 2020, 11, 234–257. [Google Scholar]
- Krishnan, R.; Yen, P.; Agarwal, R.; Arshinder, K.; Bajada, C. Collaborative innovation and sustainability in the food supply chain—Evidence from farmer producer organisations. Resources, Conservation & Recycling 2021, 168, 105253. [Google Scholar] [CrossRef]
- Minten, B. Infrastructure, Market Access, and Agricultural Prices: Evidence from Madagascar . 1999. Available online: http://ageconsearch.umn.edu.
- Satish, P. Rural infrastructure and growth: An overview. Indian Journal of Agricultural Economics 2007, 62. [Google Scholar]
- FAO. FAOSTAT Analytical Brief 38: Credit to Agriculture—Global and Regional Trends (2012–2022); FAO: Rome, Italy, 2022; Available online: http://www.fao.org/faostat/en/#data/IC.
- NABARD Capital Market. Agriculture credit to farmers, 2018. Available online: https://www.nabard.org/news-article.aspx?id=25&cid=552&nid=160.
- Kumar, S.; Kumar, S.H.I.V.; Chahal, V.P.; Singh, D.R. Trends and determinants of crop diversification in Uttar Pradesh. Indian Journal of Agricultural Sciences 2018, 88, 1704–1708. [Google Scholar] [CrossRef]
- Chandio, A.A.; Jiang, Y.; Wei, F.; Guangshun, X. Effects of agricultural credit on wheat productivity of small farms in Sindh, Pakistan: Are short-term loans better? Agricultural Finance Review 2018, 78, 592–610. [Google Scholar] [CrossRef]
- Alemu, A.E.; Maertens, M.; Deckers, J.; Bauer, H.; Mathijs, E. Impact of supply chain coordination on honey farmers’ income in Tigray, Northern Ethiopia. Agricultural and Food Economics 2016, 4. [Google Scholar] [CrossRef]
- Dorward, A.; Kydd, J.; Poulton, C.; Bezemer, D. Coordination risk and cost impacts on economic development in poor rural areas. Journal of Development Studies 2009, 45, 1093–1112. [Google Scholar] [CrossRef]
- Weaver, B. Coordination, Co-operation, and Collaboration: Defining the C3 Framework 2011.
- Widadie, F.; Bijman, J.; Trienekens, J. Alignment between vertical and horizontal coordination for food quality and safety in Indonesian vegetable chains. Agricultural and Food Economics 2022, 10. [Google Scholar] [CrossRef]
- Arshinder; Kanda, A.; Deshmukh, S.G. Coordination in supply chains: An evaluation using fuzzy logic. Production Planning & Control 2007, 18, 420–435. [Google Scholar] [CrossRef]
- Arshinder; Balaji, M. Understanding the models of Indian fruit and vegetable supply chains—A case study approach. International Journal of Agricultural Resources, Governance and Ecology 2019, 15, 307. [Google Scholar] [CrossRef]
- Ahoa, E.; Kassahun, A.; Tekinerdogan, B.; Verdouw, C. Analysing and designing business processes in the Ghana cocoa supply chain for supporting inclusiveness. Sustainability 2021, 13, 12440. [Google Scholar] [CrossRef]
- Bunte, J. Farmer producer organisations to improve farmer livelihoods: A look at Karnataka, 2019. Available online: https://medium.com/s3idf/farmer-producer-organizations-to-improve-farmer-livelihood-a-look-at-karnataka-adb2938ad5d3.
- Ton, G.; Bijman, J. The Role of Producer Organisations in the Process of Developing an Integrated Supply Chain: Experiences from Quinoa Chain Development in Bolivia 2006, 1–16.
- PNBIndia. Role of agricultural infrastructure. Ministry of Agriculture & Farmers Welfare, 2021. Available online: https://pib.gov.in/Pressreleaseshare.aspx?PRID=1783870.
- IRMA-NABARD. Handholding (Capacity Building and Facilitation) of FPOs: Framework to Implementation; Institute of Rural Management Anand (IRMA): Anand, India; NABARD: Mumbai, India, 2022; Available online: https://www.nabard.org/auth/writereaddata/tender/2705222930nrs-24-handholding-of-fpos-framework-to-implementation.pdf.
- SFAC. Strategy Paper for Promotion of 10,000 Farmer Producer Organisations (FPOs); SFAC: New Delhi, India, 2019; Available online: http://sfacindia.com/UploadFile/Statistics/Strategy-Paper-on-Promotion-of-10,000-FPOs.pdf.
- NABARD. Farmer Producer Organisations: Frequently Asked Questions (FAQs); NABARD: Mumbai, India, 2015; Available online: https://www.nabard.org/demo/auth/writereaddata/File/FARMER%20PRODUCER%20ORGANISATIONS.pdf.
- Johnson, R.B.; Onwuegbuzie, A.J. Mixed methods research: A research paradigm whose time has come. Educational Researcher 2004, 33, 14–26. Available online: https://www.jstor.org/stable/3700093. [CrossRef]
- Bougie, R.; Sekaran, U. Research Methods for Business: A Skill-Building Approach, 8th ed.; Wiley: Hoboken, NJ, USA, 2019. [Google Scholar]
- Daniel, W. Biostatistics: A Foundation for Analysis in the Health Sciences, 7th ed.; Wiley: New York, NY, USA, 1999. [Google Scholar]
- Naing, L.; Winn, T.; Rusli, B.N. Practical issues in calculating the sample size for prevalence studies. Archives of Orofacial Sciences 2006, 1, 9–14. [Google Scholar]
- Ayodele, J. Validity and reliability issues in educational research. Journal of Educational and Social Research 2012, 2. [Google Scholar] [CrossRef]
- Hamed Taherdoost, A.; Lumpur, K. Validity and reliability of the research instrument: How to test the validation of a questionnaire/survey in a research. International Journal of Academic Research in Management 2016, 5. Available online: https://hal.science/hal-02546799. [CrossRef]
- Strand, S. Discovering statistics using SPSS (2nd edition). Andy Field, London: Sage Publications Ltd 2005. ISBN 0-7619-4452-4. British Journal of Educational Psychology 2006, 76, 423–423. [Google Scholar] [CrossRef]
- Rask, M.; Oscarsson, M.; Ludwig, N.; Swahnberg, K. The Swedish translation and cross-cultural adaptation of the FACIT-CD: Linguistic validity and reliability of the Swedish version. BMC Women’s Health 2017, 17. [Google Scholar] [CrossRef]
- Wild, D.; Grove, A.; Martin, M.; Eremenco, S.; McElroy, S.; Verjee-Lorenz, A.; Erikson, P. Principles of good practice for the translation and cultural adaptation process for patient-reported outcomes measures: Report of the ISPOR task force. 2005. Available online: http://www.ispor.org.
- Chin, W.W. The partial least squares approach to structural equation modeling. In Modern Methods for Business Research; Marcoulides, G.A., Ed.; Lawrence Erlbaum Associates: Mahwah, NJ, USA, 1998; pp. 295–336. [Google Scholar]
- Hair, J.F.; Black, W.C.; Babin, B.J.; Anderson, R.E. Multivariate Data Analysis: A Global Perspective, 7th ed.; Pearson: Upper Saddle River, NJ, USA, 2010. [Google Scholar]
- Hair, J.F.; Hult, G.T.M.; Ringle, C.M.; Sarstedt, M. A Primer on Partial Least Squares Structural Equation Modeling (PLS-SEM); Sage: Thousand Oaks, CA, USA, 2013. [Google Scholar]
- Nunnally, J.C.; Bernstein, I.H. Psychometric Theory; McGraw-Hill: New York, NY, USA, 1994. [Google Scholar]
- Hair, J.F.; Hult, G.T.M.; Ringle, C.M.; Sarstedt, M. A Primer on Partial Least Squares Structural Equation Modeling (PLS-SEM), 2nd ed.; Sage: Thousand Oaks, CA, USA, 2017. [Google Scholar]
- Hair, J.F., Jr.; Matthews, L.M.; Matthews, R.L.; Sarstedt, M. PLS-SEM or CB-SEM: Updated guidelines on which method to use. International Journal of Multivariate Data Analysis 2017, 1, 107–123. [Google Scholar] [CrossRef]
- Henseler, J.; Dijkstra, T.K.; Sarstedt, M.; Ringle, C.M.; Diamantopoulos, A.; Straub, D.W.; Ketchen, D.J.; Hair, J.F.; Tomas, G.; Hult, G.T.M.; Calantone, R.J. Common beliefs and reality about PLS: Comments on Rönkkö and Evermann 2013. Organizational Research Methods 2014, 17, 182–209. [Google Scholar] [CrossRef]
- Henseler, J.; Ringle, C.M.; Sarstedt, M. A new criterion for assessing discriminant validity in variance-based structural equation modeling. Journal of the Academy of Marketing Science 2015, 43, 115–135. [Google Scholar] [CrossRef]
- Kline, R.B. Principles and Practice of Structural Equation Modeling, 3rd ed.; Guilford Press: New York, NY, USA, 2011. [Google Scholar]
- Hair, J.F.; Ringle, C.M.; Sarstedt, M. Partial least squares structural equation modeling: Rigorous applications, better results and higher acceptance. Long Range Planning 2013, 46, 1–12. [Google Scholar] [CrossRef]
- Cooper, B.; Eva, N.; Fazlelahi, F.Z.; Newman, A.; Lee, A.; Obschonka, M. Addressing common method variance and endogeneity in vocational behavior research: A review of the literature and suggestions for future research. Journal of Vocational Behavior 2020, 121, 103472. [Google Scholar] [CrossRef]
- Chang, S.J.; Van Witteloostuijn, A.; Eden, L. Common method variance in international business research. In Research Methods in International Business; Palgrave Macmillan: Cham, Switzerland, 2020; pp. 385–398. [Google Scholar]
- Elamon, J. KILA Journal of Local Governance 2020, Vol-7 No. 1& 2, January-December 2020.
- Qureshi, I.; Pandey, M.; Shukla, D.M.; Pillai, V. Technoficing: Reinterpretation of Gandhian perspectives on technology. In Social Entrepreneurship and Gandhian Thoughts in the Post-COVID World; Springer Nature: Singapore, 2023; pp. 191–214. [Google Scholar]
- Hadley, P.A. Building Co-operation in Farmer Collectives and across ‘Value’ Chains: Institutional Dynamics and Power Relations in Central India . Ph.D. Thesis, SOAS University of London, London, UK, 2023. [Google Scholar]
- INAFI India. Transforming Small Holders Farming into Agri Business Ventures—Role of Producer Companies & Gendering Greenpreneurship . 2013. Available online: http://inafiindia.net/docs/Proceedings_Farmers_Producer_Companies-Madurai.pdf.
- MANAGE. A Case Study of Sahyadri Farmer Producer Company, Nashik, Maharashtra; National Institute of Agricultural Extension Management: Hyderabad, India, 2017; Available online: https://www.manage.gov.in/publications/reports/Sahyadri-report.pdf.
- Nayak, A. Case Studies of FPOs in India; NABARD: Mumbai, India, 2019; Available online: https://www.nabard.org/auth/writereaddata/tender/0306220035case-studies-of-fpos-in-india-2019-21.pdf.
- Singh, S. Case Study of Dharani Farmer Producer Organisation . 2019. Available online: http://www.apmas.org/pdf/fpo-csaestudy-long.pdf.
- von Braun, J.; Swaminathan, M.S.; Rosegrant, M.W. Agriculture, Food Security, Nutrition and the Millennium Development Goals; 2004. [Google Scholar]
- Islam, M.; Mukherjee, D.; Chatterjee, R.; Mitra, S. A self-reliant tea economy offering inclusive growth: A case of Tripureswari Tea, India. Agronomy 2022, 12, 2935. [Google Scholar] [CrossRef]
- Banumathi, T.; Kaliraj, S. A Study on the Role of Rural Infrastructure in Agricultural Development in Kanchipuram District, Tamil Nadu . Ph.D. Thesis, University of Madras, Chennai, India, 2013. Available online: http://hdl.handle.net/10603/201056.
- Sahoo, A.K.; Dash, S. Issues and Challenges of Agricultural Financing in Western Odisha for Inclusive and Sustainable Rural Development: An Empirical Study . Ph.D. Thesis, Gangadhar Meher University, Sambalpur, India, 2022. Available online: http://hdl.handle.net/10603/371437.
- Simatupang, T.M.; Sridharan, R. The collaboration index: A measure for supply chain collaboration. International Journal of Physical Distribution & Logistics Management 2005, 35, 44–62. [Google Scholar] [CrossRef]
- Pandian, J.; Ganesan, M. Sustainability Factors of Farmer Producer Organisations for Farmers’ Empowerment . Ph.D. Thesis, Anna University, Chennai, India, 2021. Available online: http://hdl.handle.net/10603/427641.
- Chandran, D.; Francis, F. A Study on the Problems and Farmer Linkage Scheme of the Coconut Processing Sector in Kerala . Ph.D. Thesis, University of Calicut, Malappuram, India, 2018. Available online: http://hdl.handle.net/10603/270268.
- Suriyapriya, E.; Kavaskar, M. A Study on Impact of Farmer Producer Organisations (FPOs) among the Small and Marginal Farmers of Tamil Nadu . Ph.D. Thesis, Annamalai University, Tamil Nadu, India, 2022. Available online: http://hdl.handle.net/10603/392087.
- Amrutlal, P.A.; Sharma, M. An In-Depth Comparative Study of Supply Chain Management Practices at Selected Agriculture Produce Marketing Committees of North Gujarat . Ph.D. Thesis, Ganpat University, Mehsana, India, 2010. Available online: http://hdl.handle.net/10603/39624.
- Shwetha, N.V.; Shivalingaiah, Y.N. Development of scale to measure livelihood security of farmers practicing different farming systems in Southern Karnataka. International Journal of Current Microbiology and Applied Sciences 2019, 8, 521–527. [Google Scholar] [CrossRef]
Figure 1.
Resource Curse & Clustering Interpretation, Source; Self.
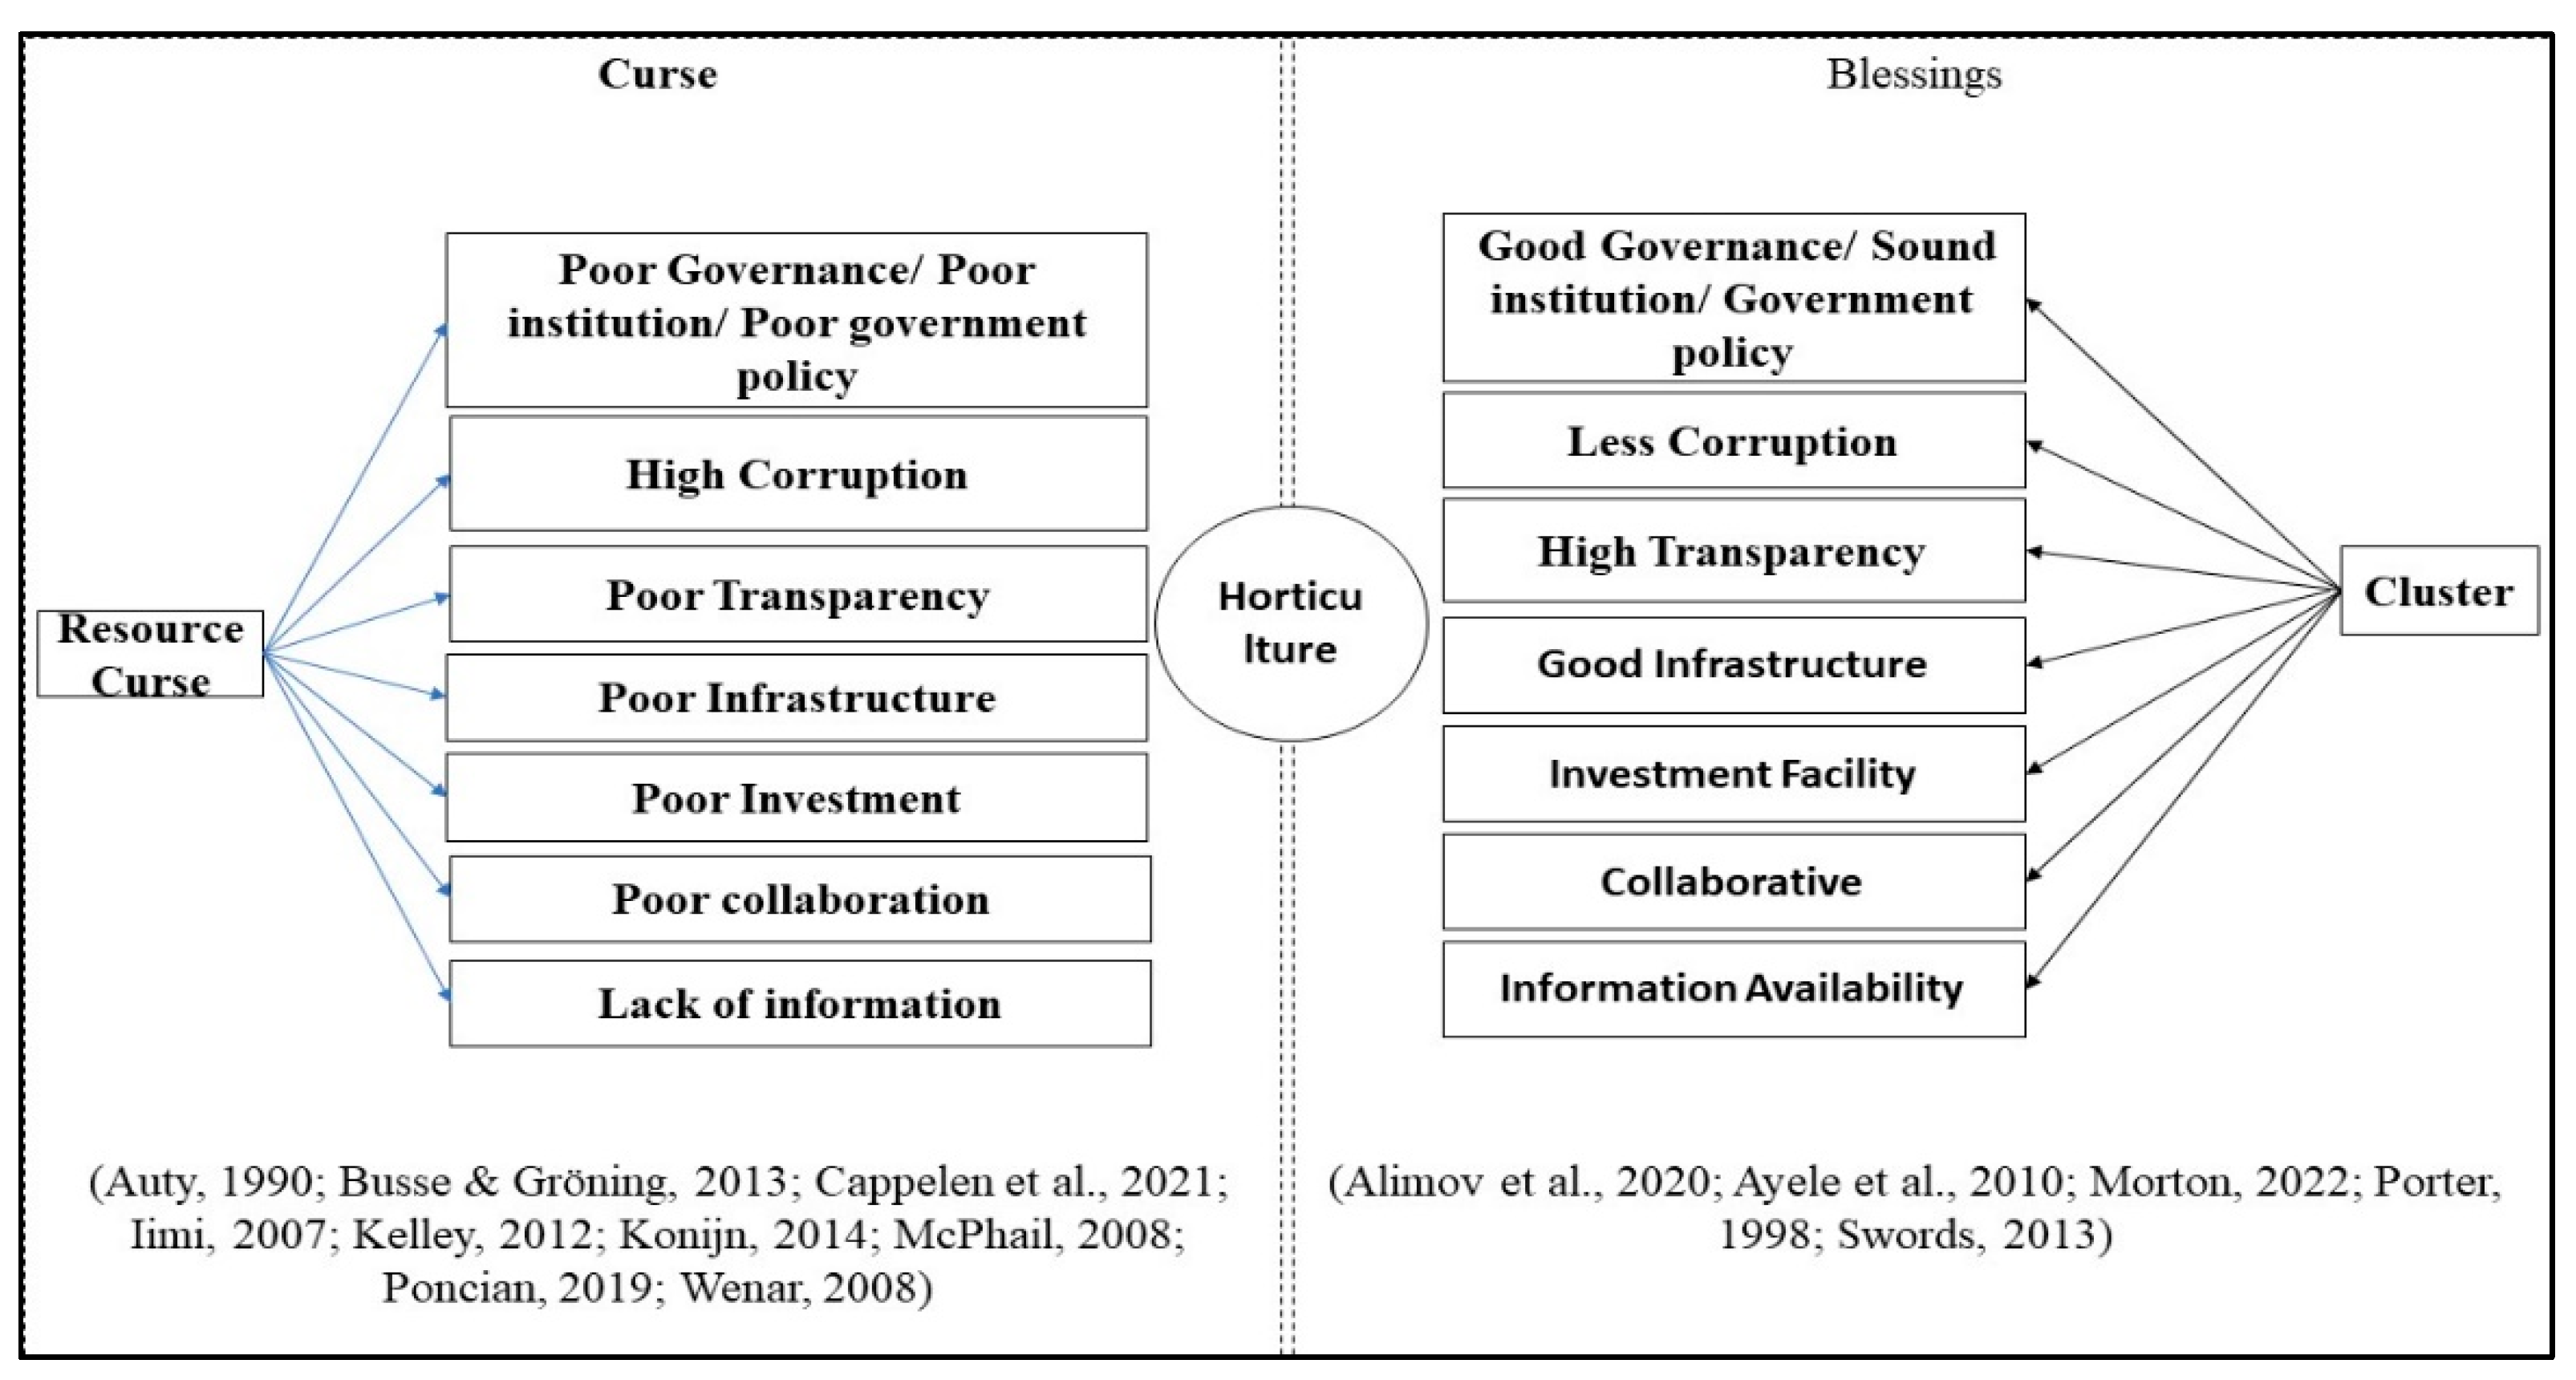
Figure 2.
Proposed Research Model, Source; Self.
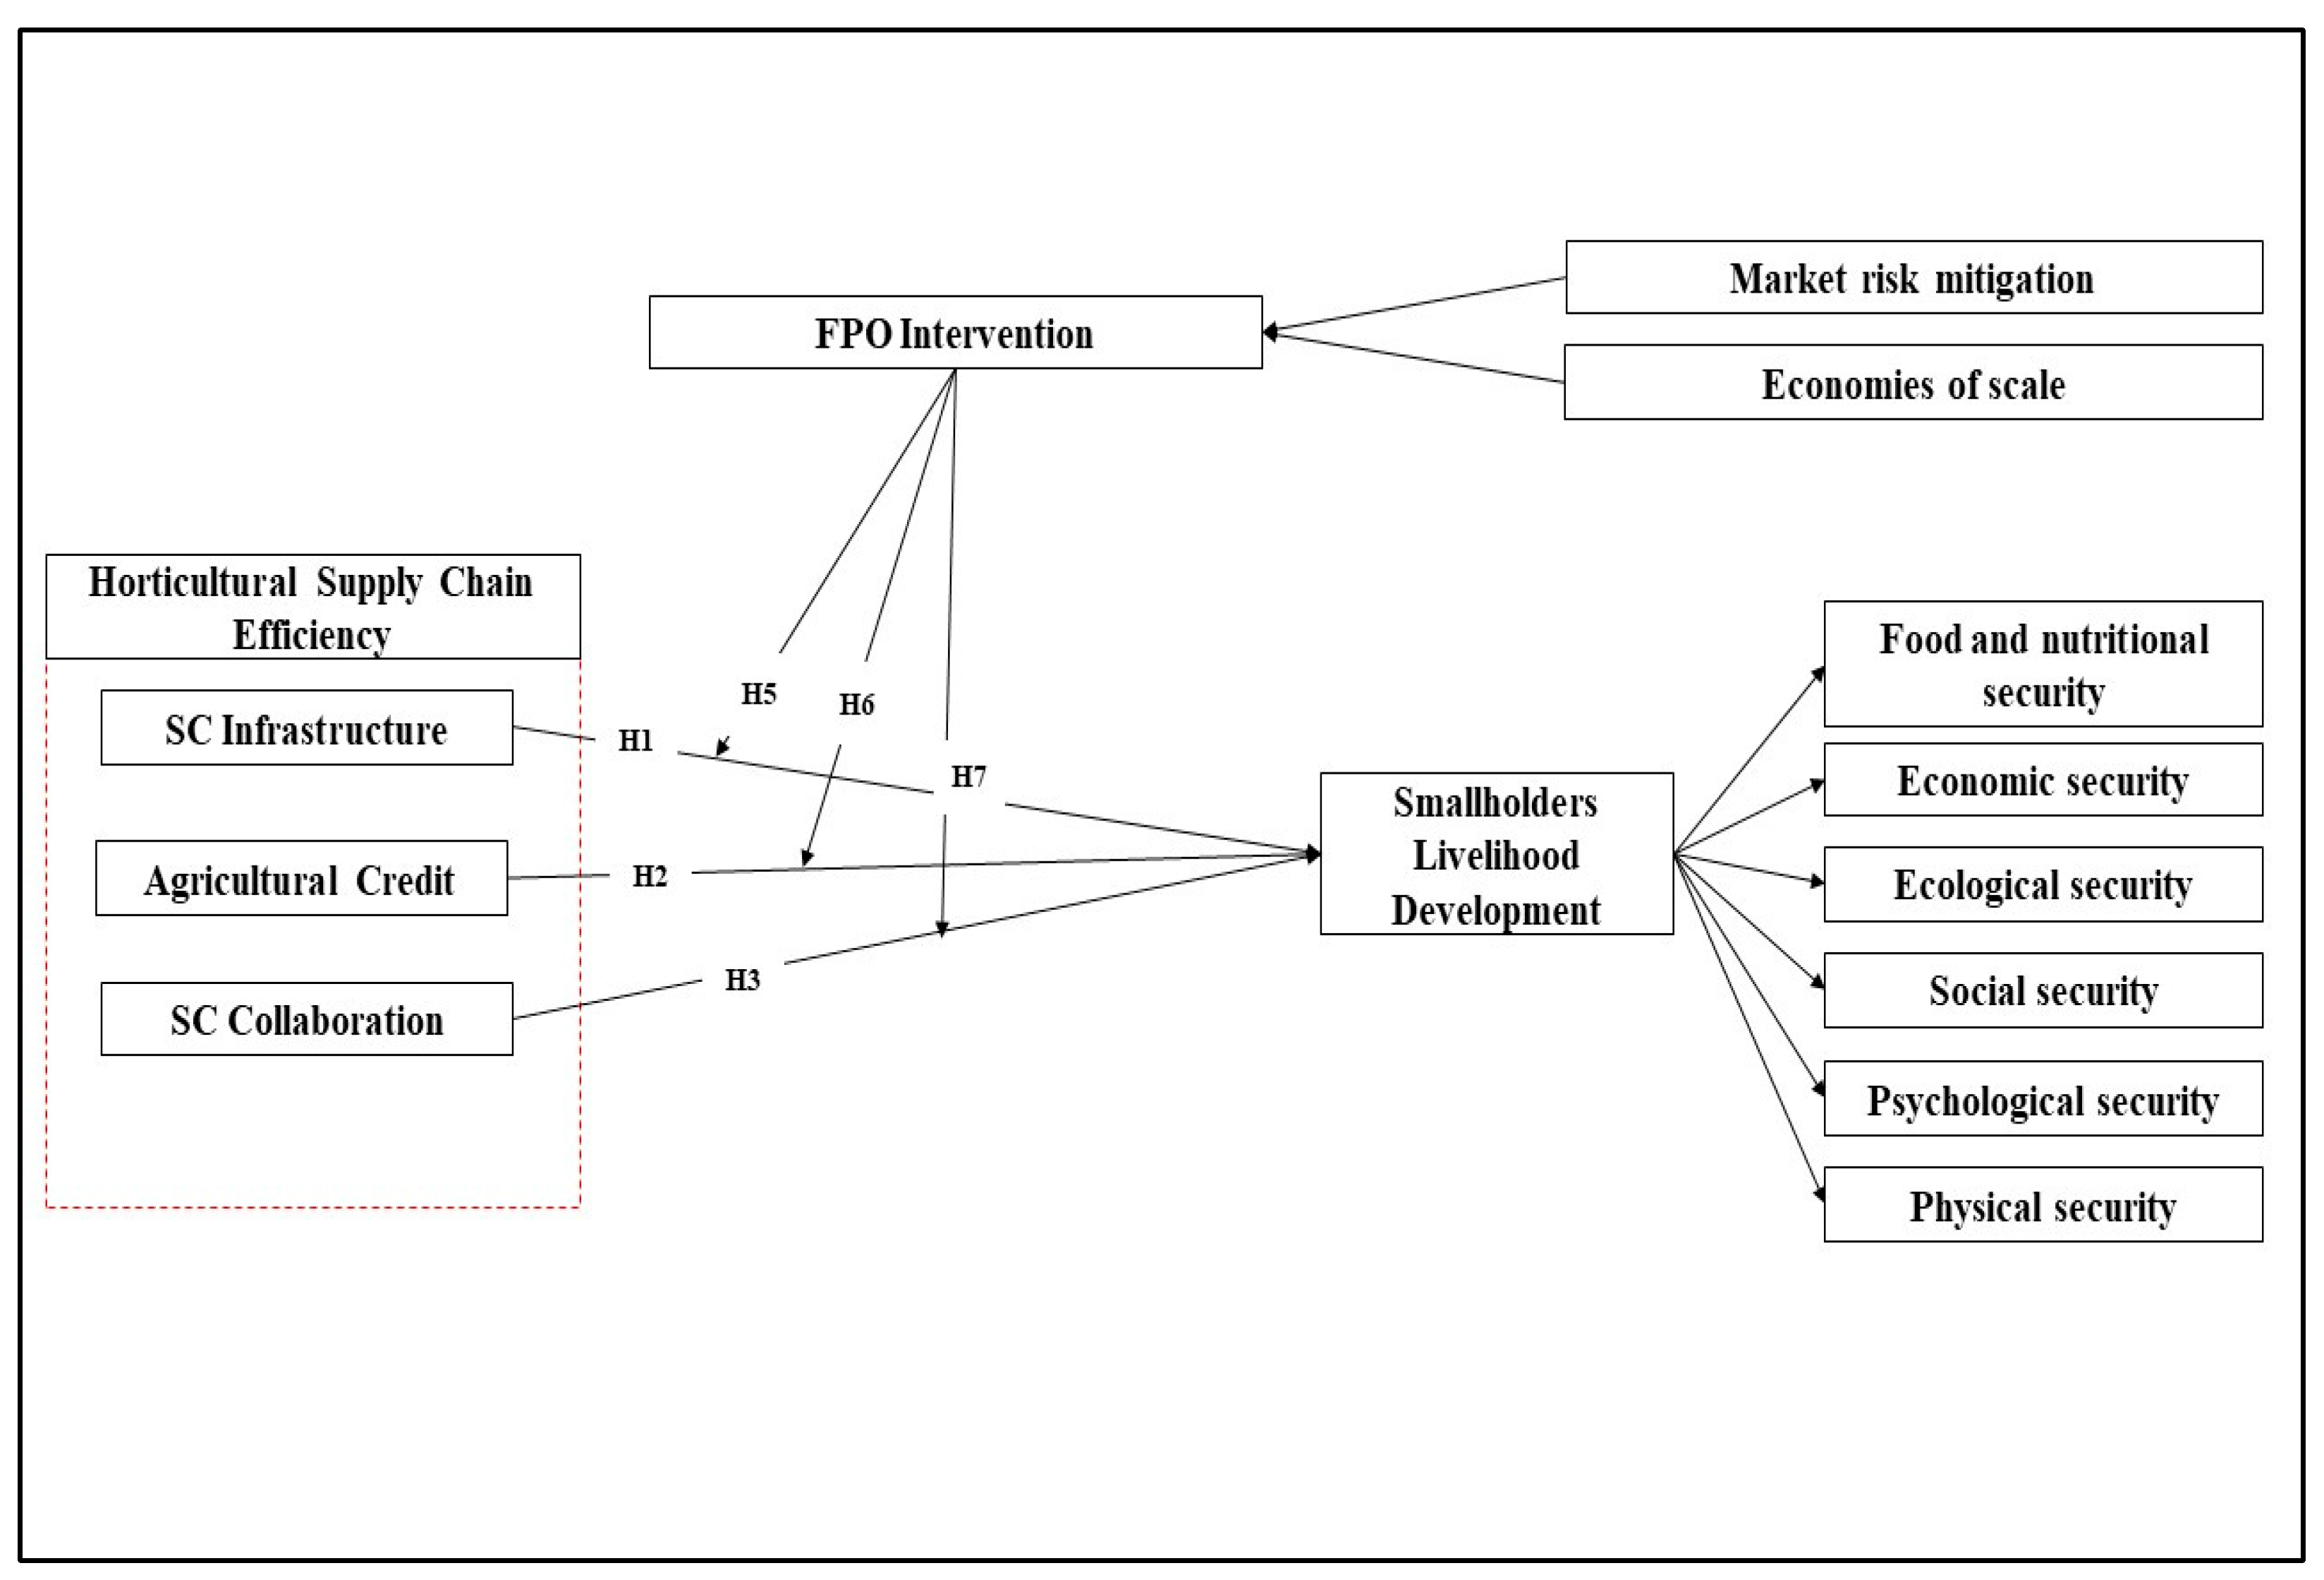
Figure 3.
Measurement Model.
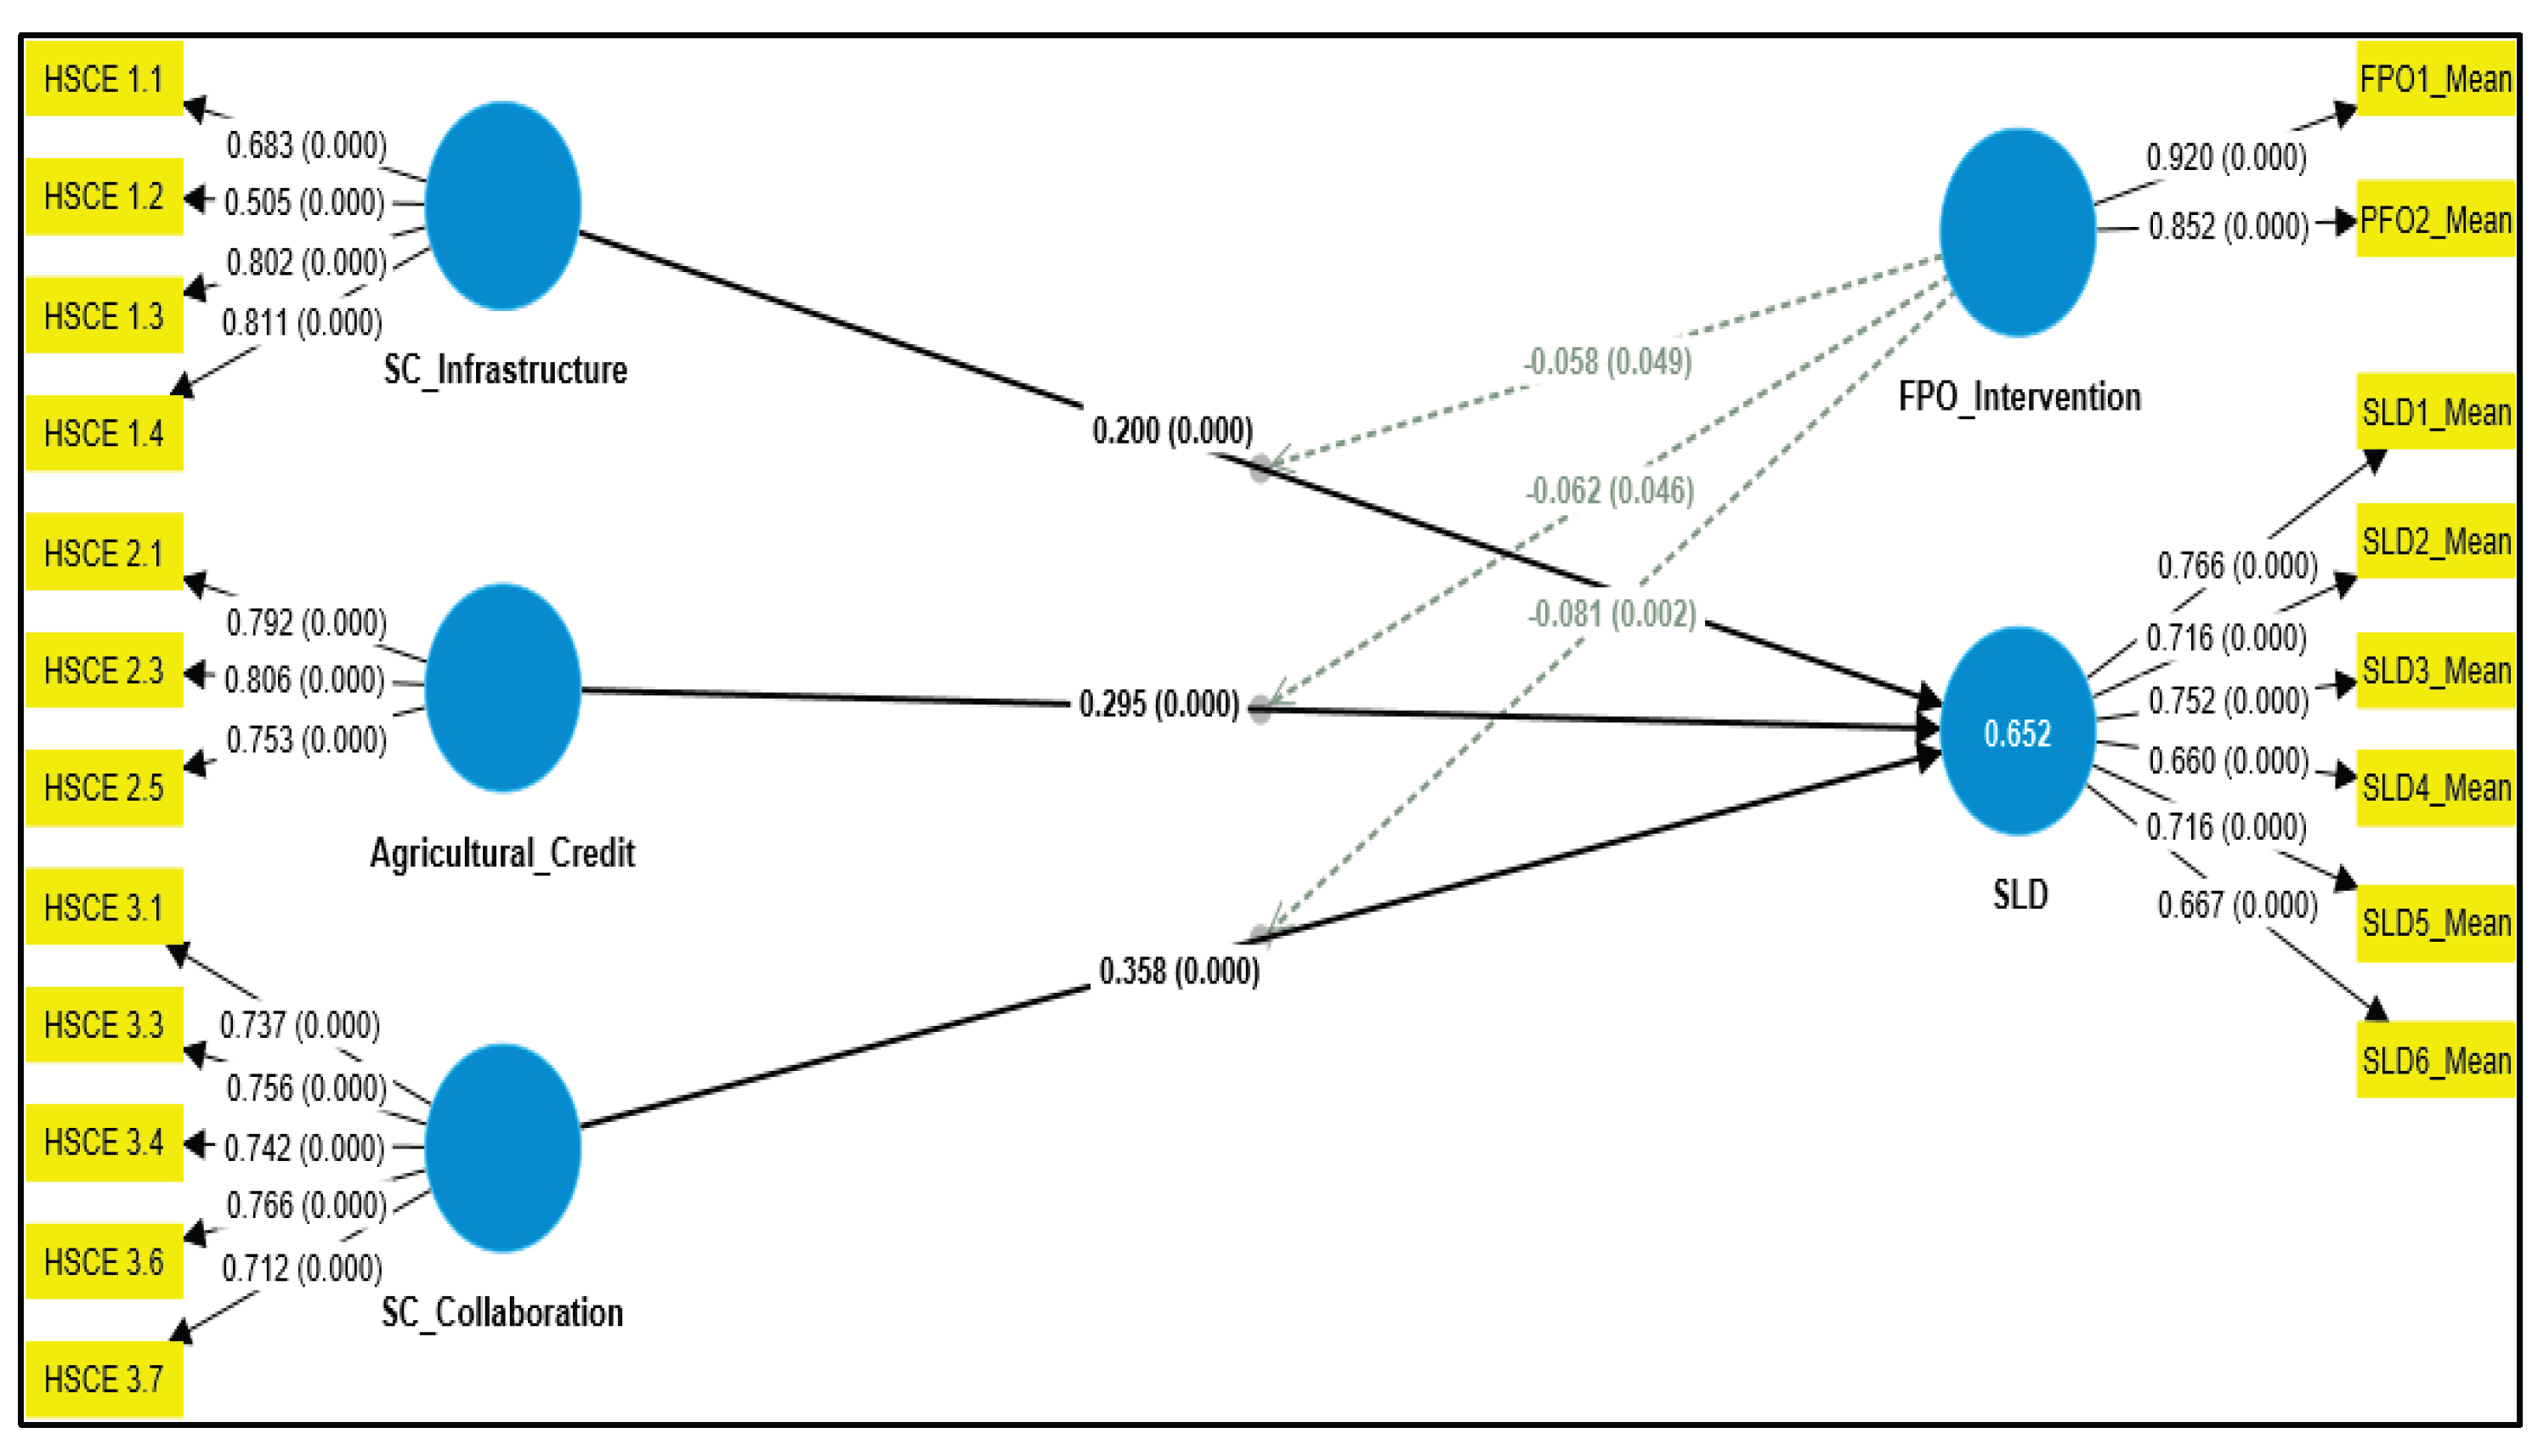
Table 1.
Construct validity, Reliability, Convergent Validity.
| Constructs | Items | Outer loadings |
Cronbach’s Alpha | rho_A | CR | AVE |
|---|---|---|---|---|---|---|
| SC_Infrastructure | HSCE 1.1 | 0.683 | 0.665 | 0.710 | 0.798 | 0.505 |
| HSCE 1.2 | 0.505 | |||||
| HSCE 1.3 | 0.802 | |||||
| HSCE 1.4 | 0.811 | |||||
| Agricultural_Credit | HSCE 2.1 | 0.792 | 0.687 | 0.690 | 0.827 | 0.615 |
| HSCE 2.3 | 0.806 | |||||
| HSCE 2.5 | 0.753 | |||||
| SC_Collaboration | HSCE 3.1 | 0.737 | 0.798 | 0.801 | 0.860 | 0.552 |
| HSCE 3.3 | 0.756 | |||||
| HSCE 3.4 | 0.742 | |||||
| HSCE 3.6 | 0.766 | |||||
| HSCE 3.7 | 0.712 | |||||
| FPO_Intervention | FPOI1_Mean | 0.920 | 0.733 | 0.775 | 0.880 | 0.786 |
| FPOI2_Mean | 0.852 | |||||
| SLD | SLD1_Mean | 0.766 | 0.807 | 0.809 | 0.861 | 0.510 |
| SLD2_Mean | 0.716 | |||||
| SLD3_Mean | 0.752 | |||||
| SLD4_Mean | 0.660 | |||||
| SLD5_Mean | 0.716 | |||||
| SLD6_Mean | 0.667 |
(Note: For FPO1_Mean, FPO2_Mean, SLD1_Mean, SLD2_Mean, SLD3_Mean, SLD4_Mean, SLD5_Mean, and SLD6_Mean are taken as the mean of the item scores present under the sub-constructs FPO1, FPO2, SLD1, SLD2, SLD3, SLD4, SLD5, and SLD6, respectively).
Table 2.
HTMT-based discriminant validity.
| Constructs | HSCE1 | HSCE2 | HSCE3 | FPOI | SLD |
| HSCE1 | |||||
| HSCE2 | 0.564 | ||||
| HSCE3 | 0.429 | 0.384 | |||
| FPOI | 0.548 | 0.493 | 0.438 | ||
| SLD | 0.757 | 0.762 | 0.751 | 0.646 | |
| FPO_Intervention x SC_Infrastructure | 0.609 | 0.279 | 0.217 | 0.352 | 456 |
| FPO_Intervention x Agricultural_Credit | 0.351 | 0.310 | 0.078 | 0.317 | 0.331 |
| FPO_Intervention x SC_Collaboration | 0.261 | 0.092 | 0.414 | 0.173 | 0.368 |
Found Discriminant Validity (correlation), i.e., <0.85.
Table 3.
Result of the structural model assessment for direct and moderating relations.
| H | Relationships. | Beta | Std. | T Value | P Value | BCI LL | BCI UL | Decision | F2 | VIF |
|---|---|---|---|---|---|---|---|---|---|---|
| H1 | SCInfrastructure -> SLD | 0.200 | 0.043 | 4.665 | 0.001 | 0.114 | 0.283 | S | 0.071 | 1.625 |
| H2 | AgriculturalCredit -> SLD | 0.295 | 0.037 | 8.043 | 0.000 | 0.222 | 0.366 | S | 0.189 | 1.327 |
| H3 | SCCollaboration -> SLD | 0.358 | 0.034 | 10.436 | 0.000 | 0.291 | 0.424 | S | 0.267 | 1.379 |
| H4 | FPOIntervention -> SLD | 0.147 | 0.034 | 4.379 | 0.000 | 0.078 | 0.209 | S | 0.045 | 1.365 |
| H5 | FPOintervention x SCInfrastructure -> SLD | -0.058 | 0.029 | 1.969 | 0.049 | -0.114 | 0.000 | S | 0.009 | 1.644 |
| H6 | FPOintervention x AgriculturalCredit -> SLD | -0.062 | 0.031 | 1.995 | 0.046 | -0.123 | -0.001 | S | 0.009 | 1.324 |
| H7 | FPOIntervention x SCCollaboration -> SLD | -0.081 | 0.026 | 3.055 | 0.002 | -0.134 | -0.030 | S | 0.018 | 1.281 |
(Note: S-Supported, BCI LL - Confidence Intervals Bias-Corrected at Lower Limit; &BCI UL - Confidence Intervals Bias-Corrected at Upper Limit).
Table 4.
Results of Coefficient of Determination (R2) and Predictive Relevance (Q2).
| Construct | R2 | Adjusted R2 | Q2 |
|---|---|---|---|
| SLD | 0.652 | 0.646 | 0.321 |
Disclaimer/Publisher’s Note: The statements, opinions and data contained in all publications are solely those of the individual author(s) and contributor(s) and not of MDPI and/or the editor(s). MDPI and/or the editor(s) disclaim responsibility for any injury to people or property resulting from any ideas, methods, instructions or products referred to in the content. |
© 2026 by the authors. Licensee MDPI, Basel, Switzerland. This article is an open access article distributed under the terms and conditions of the Creative Commons Attribution (CC BY) license.
Copyright: This open access article is published under a Creative Commons CC BY 4.0 license, which permit the free download, distribution, and reuse, provided that the author and preprint are cited in any reuse.


