Submitted:
21 February 2026
Posted:
23 February 2026
You are already at the latest version
Abstract
La Paz Bay (BLP), Baja California Sur, Mexico, is one of the country's most important destinations for fishing tournament, with recreational fishing considered a significant tourist activity in terms of ecosystem services and the economic benefits it provides to participants. The purpose of this study was to estimate the demand for sport fishing tournaments and the monetary benefit of this activity through the willingness to pay (WTP) for access to fishing tournaments by anglers and based on it make some proposal of tourism promotion and recreational fisheries management. A total of 184 surveys were conducted at tournaments held in 2022 and 2023; the collected data were used to apply the individual travel cost method. The data enabled the description of the profile of anglers participating in fishing tournaments in BLP. The demand function for fishing tournaments was estimated, which includes seven determinants. With this information, the individual DAP per angler was estimated at USD 608.63, and the recreational economic value of fishing tournaments in La Paz is estimated at USD 1.08 million. Strategies for conserving species reserved for sport fishing and promoting tourism are discussed, which could help improve tournament activity and promote the rational use of natural resources.
Keywords:
economic value
; reserved species
; willingness-to-pay
; demand function
; cultural ecosystem services
1. Introduction
Sport fishing is an essential activity in tourism, since it is linked to coastal zones. Sport fishing is practiced for both competition and recreation, fostering a bond between humans and marine and fisheries resources [25]. Sport fishing is a very profitable economic activity due to three reasons: i) the income generated, ii) it fosters a bond that is socially crucial for employment, causing a very high multiplier effect in several economic sectors like fishing, tourism, and industry [2,36,81]. There are two distinguishable segments in sport fishing: regular sport fishing and tournament fishing. The first one is conducted individually or in small groups under a non-competitive scheme, in accordance with federal regulations, for recreational purposes, and occasionally involves catch-and-release practices to conserve sport-fishing species [17,28]. On the other hand, sport fishing tournaments are conducted under a competitive, organized scheme, where participants aim to win based on the weight, number, or size of their catch. These tournaments are conducted under specific rules, verified by supervising committees, and subject to particular areas and time constraints. In these sports events, anglers typically compete for prizes in several categories. Tournaments also bring economic benefits to the communities where they take place [24,75]. To win a tournament category, essential factors include team expertise, fishing gear, and boat type, as well as environmental elements that increase the odds of catching a large, heavy fish (13). Several communities organized fishing tournaments to attract anglers, spectators, and non-resident tourists, thereby promoting local economic development [57,76].
Benefits from recreational activities linked to natural resources are known as cultural ecosystem services [19]. Because of this, sport fishing is classified as a cultural ecosystem service, as it results from anthropic interactions with marine resources and the functions of marine ecosystems for recreational purposes [9,20]. The ecosystem service provided by sport fishing could be seen from two perspectives. One, as a growing and popular activity in specific conservation or protection areas for natural resources, in which recreational and sport fishing is performed. Two, as an important yearly generator of direct and indirect global economic revenues of 44 and 100 US$ billion, respectively [29].
In 2023, Mexico sold 262,634 individual recreational and sport fishing permits, collecting approximately 109 million MXN [15]. In Baja California Sur (BCS), around 75% of these permits were sold [16]. According to information provided by the Marine Resources Protection Trust Fund (FONMAR, by its acronym in Spanish), Baja California Sur sold about 171 thousand sport fishing permits, collecting around 71.4 million MXN, with a surplus of 10.1 million MXN compared with the year 2023 [31].
One of the most important factors of Mexican sport fishing regulations is the angler’s right over the caught species. According to federal regulations, the angler may keep and take the caught fish for personal consumption. Catch-and-release is rarely practiced in Mexico due to this regulation. This duality reflects both the individual dimension of enjoyment and the challenge of sustaining ecosystem services [7,18]. Thus, it is also important to consider that the benefits of sport fishing depend on the stock abundance and the sustainability of fishing resources. Sport fishing usually markets recreational ecosystem services, which are enjoyed freely, since they are taken for granted and lack value or price.
When cultural ecosystem services provided by marine ecosystems lack value, they face the dilemma of public goods. Most fishing resources are considered public goods, as they are non-rival and non-exclusive; these characteristics can lead to unsustainable use of natural resources and the ecosystem services they provide [43]. One widely used method for assigning value to public goods is the travel cost method [30,33,38,51]. The method has two basic assumptions, one, the need of an individual to travel to a specific site to enjoy its recreational services. Two, even when access to public leisure sites is free of charge, visitors pay an implicit price for the cultural and recreational services provided by the site, which may include transport costs, equipment, meals, lodging, and other expenses. The travel cost method is an indirect revealed preference method, as it uses information on time (opportunity cost) and money (real cost) that individuals, families, or groups spend to visit a natural place [54]. The visitor’s precedence diversity provides enough information to estimate the site’s demand function, in which visits are associated with travel, or trip, cost [80].
There are several Valuation studies for sport fishing in BCS (Table 1). These studies estimate the consumer surplus (CS), or willingness to pay (WTP), as the individual economic benefit perceived by the consumer above the price paid. Which is the maximum monetary value an individual is willing to pay to participate in the activity [19,33].
Nevertheless, to date, there are no valuation studies regarding sport fishing tournaments in La Paz Bay. Being aware of its value could ease the burden on marine resources management authorities by facilitating sustainable management through more efficient promotional and awareness campaigns, promoting local economic development, fostering management strategies for sport-fishing reserved species, and forecasting future demand. Due to this latter, this research aims to estimate the economic value of sport fishing tournaments in La Paz Bay and how this outcome could be used to support tourist promotion and enhance management strategies.
1.1. Recreational-Sport Fishing Management
Recreational-sport fisheries management is an essential component for securing the sustainability of aquatic resources and the continuity of the ecological, recreational, and economic benefits they provide [7]. Unlike commercial fisheries, recreational-sport fishing combines competitive and recreational components; as a result, the activity requires specific regulations to balance anthropogenic uses with ecosystem and species conservation. Among the main objectives of resource management are: i) avoiding over-exploitation, ii) maintaining biodiversity, iii) protecting critical habitats, iv) ensuring long-run socioeconomic benefits at different scales (local, regional, and national [18,28]. This comprehensive approach recognizes that sport fishing not only depends on fish abundance but also on ecosystem quality and the user’s positive perception of resource management. Therefore, recreational-sport fishing management included regulations and incentives to promote responsible participation by anglers. Among the most common management measures are: i) catch quotas, ii) minimum sizes, iii) temporary closures, iv) fishing effort limitation, v) no-take and protected areas, and vi) catch and release fostering; these measures contribute to fish stock conservation without limiting the leisure experience [7,18,25]. Besides, using permits and electronic records allows managers to assess ecological impacts and ensure the collection of funds that could be reinvested in conservation actions and tourism infrastructure. Besides, environmental education programs and sensitization campaigns strengthen these management strategies for sustainable fisheries practices.
1.2. Sustainable Tourism Promoting Policies
Some of the most effective strategies for nature-based tourist product diversification are: i) responsible tour operators’ certifications, ii) promoting low environmental impact activities, and iii) digital platforms implementation, aimed to ease tourists’ access to information about regulations and sustainable practices [26,37]. Linking these strategies to sport fishing facilitates the promotion of environmental education and the conservation of fisheries resources and enhances tourist destination perception. Furthermore, well-regulated fishing tournaments, promotions, and leisure events incentivize tourist visitation, fostering local economic development without compromising ecosystems.
Sustainable tourism policies design and implementation require monitoring and assessment systems that measure economic performance and environmental and social impacts. Data collection on tourist flows, the impacts of natural resources, and local communities’ perceptions is critical for assessing these policies [11]. On the other hand, coordination among authorities, tour operators, and communities enables policy adaptation, ensuring that leisure tourism, including sport fishing, remains a compatible economic development driver with environmental conservation and the promotion of recreational-cultural ecosystem services.
2. Materials and Methods
2.1. Study Area
La Paz Bay is located within the Gulf of California (GC) (Figure 1), on the eastern coast of the BCS State. It is an important area of the GC and the largest bay on the eastern side of the peninsula [22]. This area offers various opportunities for developing sport fishing tournaments, with fishing areas located near the port, in the vicinity of the Espíritu Santo and Cerralvo islands, and in the navigation channels. It is recognized for its high primary productivity and species diversity, with more than 530 species of bony and cartilaginous fish, including high-value species in recreational fishing such as dorado (Coryphaena hippurus), striped marlin (Kajikia audax), blue marlin (Makaira nigricans), yellowfin tuna (Thunnus albacares), and yellowtail (Seriola lalandi) [36].
2.2. Sample
To estimate the sample size, information on the number of registered anglers in fishing tournaments for 2022 and 2023 was used; this information was provided by FONMAR. Applying a stratified random sample for a known population and with no repetition [49], each month was considered as a stratum.
where n is the sample size, N is the population (a total of 1,775 anglers), is the value for the normal distribution for a 95% confidence level, is the maximum estimation error (7% in this case), is the success probability (50% in this case), and . The estimated sample was 184 surveys. After that, the sample by stratum was estimated using:
where is the stratum’s sample size, is the size of the i-th stratus and is the population size. With these parameters, a total of 19 strata was used, corresponding to the number of tournaments in 2022 and 2023 (Appendix A). The surveys were applied to anglers who participated in the fishing tournaments organized in La Paz Bay from April to October 2024. A database of survey information was gathered and analyzed using Stata 13.
2.3. Survey
A semi-structured survey was made, this included open and close questions [1] which are informative, evaluative and socioeconomic, a total of 29 questions are included in the survey, divides in five sections: i) general data, ii) trip, iii) anglers’ activities, iv) anglers’ economic information, and v) opinion regarding management of the activity (Appendix B). A pilot survey was conducted to identify errors and adjust the survey. The final version was then administered face-to-face at fishing tournaments to collect anonymous, representative information about anglers’ preferences and characteristics.
2.4. Travel Cost Method
The travel cost method (TC) has been widely and frequently applied to estimate the economic values of recreational and cultural ecosystem services [4,69]. It is considered an indirect method because most recreational environmental assets and their ecosystem services are public goods, meaning they lack a market price [63]. To determine the value of ecosystem services, the TC uses the costs incurred by tourists and their visits to the site [60]. Several studies have applied the TC to estimate the economic value of outdoor recreational activities and the variables influencing visitation to natural protected areas [4,65,70,71,78,79,83].
This approach is beneficial because it integrates visitors’ real behavior, such as transport, lodging, meal expenses, and travel time, providing a more objective estimate of the value individuals assign to recreational experience. Additionally, facility users are disaggregated by their socioeconomic characteristics, travel distance, and visitation frequency [85].
The TC is based upon six basic assumptions [33]. One, the individual’s wage is a proxy for the opportunity cost of the time spent traveling to the recreational site. Secondly, all visitors spend the same amount of time at the site. It is assumed that each visit involves a fixed length of stay at the site. This simplifies the model by making the total cost of the visit a constant parameter. If visitors were free to choose how long to stay, the cost would no longer be exogenous. Third, no utility or disutility is derived from travel time. The model assumes that travel itself does not generate pleasure or discomfort. This can lead to errors, such as overestimating the pleasantness of the trip (e.g., landscapes) or underestimating the discomfort (e.g., crying children, traffic).
Fourth, the visit has a single purpose: the recreational site. It is assumed that the purpose of the trip is exclusively to visit the site in question. If other places are visited or purposes combined (such as visiting a relative), the trip costs are shared and difficult to allocate accurately to the recreational site. Fifth, there are no substitute recreational sites. It is assumed that no other similar alternatives are available. The presence of substitute sites may affect visit frequency, and omitting their consideration may bias the model’s results (e.g., by underestimating price sensitivity). Sixth, the choice of place of residence is independent of recreational preferences. The model posits that living near a recreational site is unrelated to the preference to visit it. If people choose where to live based on their recreational interests, then travel costs are not exogenous and may introduce bias into demand estimates.
Regarding TC limitations, [55] note that individuals respond to variations in travel costs in the same way they would to variations in prices or access fees to the recreational area. Moreover, it isn’t easy to define and measure the opportunity cost, or the value of the time used during the trip. If individuals enjoy the travel time, then time is a benefit rather than a cost; this could lead to overestimation. Another aspect that could affect the estimated value is the availability of alternative ecosystem services to practice sport fishing, e.g., if two individuals travel the same distance, it is assumed that they have the same value; however, if an individual has different substitute sites and moves to a specific one, then the site is assigned a higher-value.
[72] mentions that TC has some limitations. First, enthusiasts of such recreational activities often invest in durable goods such as vehicles and specialized equipment, the use of which extends beyond a single trip. Second, the costs of acquisition for specific trips and equipment maintenance are generally arbitrary. Third, in the case of trips with multiple purposes or destinations, the allocation of expenses to specific locations lacks an accepted theoretical basis, which limits the accuracy of the economic analysis. Fourth, expenses for lodging and meals are highly discretionary, raising methodological questions about their inclusion as direct trip costs. Fifth, the existence of recreational alternatives influences the welfare estimates obtained using the TC, since there is no rigorous criterion for defining them. Sixth, it challenges the assumption that distance traveled and cost per kilometer are exogenous variables, since recreational preferences may have influenced previous decisions such as place of residence or type of vehicle. Seventh, while recognizing the importance of considering the opportunity cost, its empirical measurement remains still not theoretically defined.
[38] mention that over the years, there have been two TC variants: zones and individual. Both seek to estimate the average marginal propensity to visit a site. Due to technical issues, the zonal TC was abandoned by the environmental economists and replaced by individual TC instead. Individual TC seeks to estimate the demand function for recreational ecosystem services at a specific site using face-to-face surveys of visitors [27,62,82]. Also, the individual TC allows the inclusion of visitors’ sociodemographic characteristics (e.g., income, age, scholarship) and preferences, avoiding zonal grouping, the risk of errors due to averages that can conceal significant individual variation, and gives more robust econometric models outcomes. The individual TC uses Poisson distribution models. Nonetheless, individual TC require more detailed surveys, which could increase operational costs and the research’s complexity. Since it relies on information provided by respondents, it is highly vulnerable to recall bias and inaccurate answers, and it may be impractical to analyze high-traffic sites where the origin of each individual visitor is unknown [33].
The general form of the individual travel cost method is:
where is the number of visits to the site by the individual in a specific period, is the individual’s travel/trip cost to the site, is a vector of socioeconomic and environmental explanatory variables associated with the site, and is the stochastic term.
The Poisson regression model is the most used in individual TC [33], the conditional probability density function for the demand of the number of travels/trips is:
where is the Poisson parameter corresponding to its mean (expected number of travels/trips), as well as the variance of the distribution, xi is associated with the number of travels/trips each individual made.
[38] indicate some violations of the Poisson distribution are: i) if data is generated by a mechanism that excludes zero counts, and ii) if the survey is applied in situ. If one of the latter two situations happens, then a truncated Poisson distribution fits better. When the assumption of equal mean and variance is not fulfilled, it is necessary to check for data overdispersion. The overdispersion () is considered a special type of data heteroskedasticity, defined as the excess of variance over the corresponding conditional mean of the independent variable (when the variance-mean ratio is greater than 1). In the presence of overdispersion, the negative binomial distribution fits the analysis better. Finally, if (or ), there is no overdispersion; given this condition, the negative binomial distribution is reduced to a Poisson distribution.
Once the Poisson or negative binomial model is estimated, the access willingness-to-pay (WTP) can be calculated. This is represented by the area below the demand curve and above the average price (consumer surplus), from the price that could reduce the travel/trips to zero (choke price).
where represents the average number of travels/trips, and is the coefficient of the travel cost parameter. After calculating the WTP, the site’s recreational economic value could be estimated by multiplying the WTP by the number of visitors during the analyzed period.
The model selection was conducted by comparing the Pseudo-R2 value, a measure of goodness of fit for Poisson regression that represents how well the model fits the observed data [48]. The Akaike and Bayesian information criteria (AIC and BIC) were also used to select the best model; both criteria assess the balance between model fit and complexity by penalizing the number of estimated parameters [12,47]. Generally, the model with a lower AIC and BIC is selected, as these indicate a better balance between precision and parsimony. While AIC tends to favor models with a more precise fit, although more complex, the BIC more rigorously penalizes complexity, promoting simpler models when large samples are available [12,47]. Finally, the decision must consider aspects such as model interpretability, coefficient significance, and consistency with the theoretical framework, and include a diagnosis to ensure that model assumptions are satisfied. This way, the decision based on AIC and BIC makes it easier to identify the best model for explaining or predicting the dependent variable, thereby avoiding over-adjustment [12].
where is the value of the model’s maximum likelihood, is the number of estimated parameters for each model, and is the sample size. Table 2 shows the variables used in the estimated TC models of this research. Three models were estimated with their corresponding parameters to explain the dependent variable (sftp).
3. Results
3.1. Descriptives
54% of anglers perceive their fishing expertise as intermediate, and 31% as expert. Regarding precedence, 12% of the anglers are foreign, disaggregating as follows: 8% from the USA, 4% from Canada, and 88% from Baja California Sur. 89% of interviewed anglers declare owning fishing gear, and 74% owns fishing boat. The gender proportion is 93% male and 7% female. The average age of the anglers’ sample is 42 years. 77% of the interviewed anglers have college or postgraduate studies. In addition, 95% are currently working, 4% are retired, and 1% are still in school. The main motive for participating in a fishing tournament is spending time with family or friends (54%), and only 18% are motivated by winning the tournament; 7% are motivated by just competing, and 4% are motivated by the fight with the prey. The preferences for national anglers regarding prey catch are disaggregated as follows: 35% marlin, 34% mahi-mahi, 16% yellowtail, 11% tuna, and 4% wahoo.
In terms of tournament participation, 184 respondents averaged 1.95 tournaments per year, with the most common attendance at a single tournament (46%), followed by two (24%) and three (21%); only 9% attended more than three. In more than 77% of cases, anglers have more than two years of tournament experience, with an average of 9 years of participation. In addition, 79% purchased an annual fishing license, compared with 16% who opted for daily and 5% who chose weekly permits. The average number of fishing days was one day, with an average cost per tournament of $824.32 USD.
3.2. Econometrics
The first step to estimate models was to test the data for overdispersion (), the alpha coefficient for overdispersion was close to zero (2.12e-12), indicating there is no evidence of this characteristic. After that, a histogram for sftp was constructed to determine whether the distribution begins at zero counts (Figure 2). Distribution starts at 1; therefore, a truncated Poisson regression model could be used, since the negative binomial distribution collapses into a Poisson distribution as .
Except for model 1, the estimated models for the number of anglers’ tournament participation are determined by a group of socioeconomic, demographic, and previous experience factors (Table 3). The fishing trip cost is statistically significant at the 0.01% level; the parameter has a negative expected sign across three models, suggesting a strong sensitivity of the number of tournaments to participation costs. This implies that, when costs (registration, transport, lodging, among others) increase, the odds of participating in a fishing tournament decrease. This backs the economic hypothesis known as the Demand Law [38,39].
In models 2 and 3, the variable amateur shows a negative coefficient and is statistically significant, indicating that anglers who self-perceive themselves as amateurs have a lower odd of participating in fishing tournaments than more experienced anglers. Likewise, the income coefficient indicates that participating in a fishing tournament is an inferior good, i.e., its demand decreases as income increases. Owning a fishing boat will increase the odds of participating in a fishing tournament. If the angler’s experience (in years) increases exponentially, then the angler tends to decrease their participation in future fishing tournaments by 47% and 29%, respectively. The angler’s age is negatively associated with participation in fishing tournaments.
In model 3, the variable gender indicates that if the angler is male, the probability of sftp will increase. A positive occurs on the dependent if the angler’s precedence is from usa. If the fishing motive increases in one category, the probability of sftp will drop. The fact that the angler owns fishing gear is not statistically significant for participation in fishing tournaments. If the level of education increases, the odds of sftp will decrease. As the duration of the fishing permit increases, so does the possibility of sftp.
Statistical tests of model fit allow for the comparison of model selection criteria. Model 2 offers the best statistical performance in explaining participation in sport fishing tournaments (pseudo-R2=0.33), achieves the highest likelihood (-498.13), and has the lowest AIC (1,012.28) and BIC (1,046.98) values among the three models, reflecting an adequate balance between fit and parsimony. In contrast, model 1, limited solely to the cost of the trip, presents a lower fit as indicated by the pseudo-R2, AIC, and BIC contrast tests. Meanwhile, Model 3, which incorporates more variables, does not improve the model’s explanatory capacity when considering the same contrast tests. This suggests that including additional variables in this model increases its complexity without substantially improving the fit. Therefore, the best-fitting model is model 2.
The fitting values obtained for pseudo-R2 are considered adequate, bearing in mind that for nonlinear models, the value of this indicator provides us with an approximation of goodness of fit, which is not entirely analogous to R2 [40,56,77]. Several authors have argued that predictive value is low in models that include predictors associated with human behavior [50,73]. This is particularly true in economic valuation models based on travel costs or the creation of hypothetical markets, as some explanatory variables are based on subjective considerations and assessments, and on the value judgments of the subject of study. Under these assumptions, inferences must be drawn from the regression coefficients for each independent variable and their interpretation within economic theory [5,46].
One disadvantage of semi-logarithmic models is that they preclude estimating WTP using equation 5. To solve this problem, [14,41] indicate that first, the price elasticity (or cost elasticity in this case) must be calculated by using , where, the parameter is the estimated coefficient associated with the total cost of participation in fishing tournaments, and is the angler’s average participation in tournaments, and is the average travel cost. After that, the estimation of the WTP could be calculate by using . The calculated elasticity in the three models is inelastic (Table 4), indicating that fishing tournaments in La Paz Bay are inferior goods, meaning that demand falls as income rises. Regarding WTP, this ranges from 505. 96 to 625.63 USD/tournament, likewise for the REV, which ranges from 0.89 to 1.11 million USD, showing an increase of a little more than 19% from Model 1 to Model 3.
4. Discussion
4.1. Economic Valuation
It is important to consider that, according to the results, skills and experience influence the success of fishing expectations. In addition, the fact of having been skunked in previous participations appears as a strong disincentive to future fishing tournaments, reflecting the importance of the satisfaction gained during the fishing trip and the desire to return to another one. The angler’s age is negatively associated with the intention of participating in fishing tournaments. This outcome may reflect that getting older is a progressive process of deterioration and loss of interest, that the physical decline is associated with aging, or a transition to less competitive forms of recreational fishing, as reported [6].
The monthly income coefficient is associated with the demand-income elasticity, implying that the demand for fishing tournaments decreases as income increases. This is because when consumers have more disposable income, they tend to substitute the inferior good for a higher-quality, more expensive alternative, contrary to the general belief that higher income implies greater participation in fishing tournaments [33]. Perhaps this is due to diversification of recreational interests among anglers with higher incomes, or to time constraints (i.e., more important job obligations) that limit their availability to attend or travel to fishing events; however, there is no evidence for this argument.
If anglers own a fishing boat, it positively affects participation in fishing tournaments; this may be due to the boat’s fishing facilities. On the contrary, owning fishing gear apparently does not affect fishing tournament demand; this suggests that access to fishing gear is less important than ownership of a fishing boat, since the gear could be rented. Lastly, participation in fishing tournaments is not determined by the type of fishing permit the angler purchases.
Integration of WTP to planning and management of recreational areas is a valuable tool to balance accessibility, conservation, and local economic benefits, aligning with economic valuation of recreational ecosystem services studies [19,41,52,63,65]. Thus, it is recommended that WTP studies be updated periodically, as visitors’ preferences and payment capacity may vary due to economic, social, and environmental factors. The estimated WTP in this research may serve as a baseline for implementing a wide range of environmental and economic instruments for marine resource conservation, such as access fees, permits, bonds, fines, and offsets. The potential collection of implementing access fees is derived from the estimated REV, ranging from 0.89 to 1.11 million USD.
Nevertheless, there are methodological limitations to consider. The estimated WTP may be biased because respondents may overestimate or underestimate their actual WTP depending on personal perceptions or expectations [45]. To obtain more reliable outcomes, [58] recommends that surveys must include three sections: i) informative, describing the change (real or hypothetical) of the environmental good being valued (mainly for contingent valuation studies), ii) wellbeing, which must include the WTP question or about travel cost, and iii) sociodemographic, oriented to explain interviewee’s behavior. Therefore, the monetary approach tends to oversimplify anglers’ motivations, which also include social, cultural, and identity benefits, which are difficult to assess with a single measure [8].
According to [42], environmental valuation is static and reflects the site’s status at the time it was conducted; furthermore, it cannot be extrapolated to other sites or to different environmental, social, and economic conditions other than those that were predominant at the time. Together, the outcomes indicate that fishing tournament participation is not random but responds to economic costs, gained experience, angler self-perception of skill, and personal economic and sociodemographic conditions.
The analysis of the recreational economic value of leisure activities linked to cultural recreational ecosystem services is essential to understanding the magnitude of the utility that users assign to ecosystems [53,59,64]. In addition to sport fishing tournaments, many other recreational activities take advantage of the ecosystem benefits provided by nature, such as marine wildlife watching and swimming, diving, visits to islands, protected natural areas, or national parks [21,46,59,61,66,68]. These studies enable the intangible benefits of recreational ecosystem services to be translated into monetary terms, facilitating their incorporation into planning and decision-making processes [19,33,74].
This valuation performs an important role in decisions related to natural resources. By allowing for monetary comparison and measurement, the gain or loss in social well-being resulting from environmental improvement or damage. In addition, it may help determine an approximate amount to strengthen conservation schemes or compensate for environmental damage. It may also be used to strengthen the design and implementation of monitoring, surveillance, and management plans of protected sites [42].
The results of this research differ from those of other BCS studies that focused only on recreational fishing. As a result, the number of anglers participating in recreational fishing and sport fishing tournaments may differ, and the WTP and the REV may differ as well.
4.2. Management of Sport and Recreational Fisheries
The results obtained are relevant to leisure tourism promotion policies and allow policymakers to identify market sectors that are more sensitive to price changes, related services, and resource access [70,74,79,81]. In this regard, it has been shown that using differentiated access fees and phased permits can help increase collection without reducing sport anglers’ participation [43]. Likewise, the importance of reinvesting part of the revenue collected from access fees and fishing permits must be highlighted; this amount could be invested in infrastructure, services, and improvements to conservation schemes to strengthen tourist perception and guarantee resource sustainability in the long term [65].
Estimating the economic value of sport fishing tournaments is a key tool for managing sport and recreational fisheries. This indicator allows us to quantify, in monetary terms, the benefits that fishermen attribute to recreational fishing, providing valuable information for designing conservation financing schemes. For example, if the WTP is high, authorities and tournament organizers can justify implementing access fees, permits, or environmental offsets, which can in turn be reinvested in monitoring programs, habitat restoration, and fisheries surveillance [33,52].
In addition, the sport fishing estimated economic value helps to visualize the activity’s relevance compared to other uses of marine resources. Providing solid arguments for public and private resource allocation to the tourism sector. Integrating this value into management contributes to the enforcement of ecosystem-based management, in which sustainability is measured not only by the ecosystem’s health but also by the social and economic well-being provided to communities. In this sense, WTP and REV serve as strategic inputs that guide public policymaking toward a responsible and sustainable tourism model [19,74].
Recreational sport fishing management success depends significantly on the collaborative governance between authorities, anglers, communities, and conservation organizations. Users’ participation in decision-making, regulation design, and surveillance of regulation compliance increases the effectiveness of the adopted measures and strengthens local resource governance [57,76,84]. Likewise, periodic fish abundance assessments, trend analyses, and economic valuations of the activity enable adaptive adjustment of management policies in response to ecological, social, and economic changes. This integrative approach ensures that sport-recreational fishing remains a sustainable cultural-recreational ecosystem service, generating economic benefits and conserving the ecological wealth for future generations.
4.3. Sustainable Strategies of Tourism Promotion
The design of sustainable tourism promotion strategies seeks to balance attracting visitors with preserving ecosystems and the well-being of local communities. One of the main lines of action is to focus promotion on market segments that are sensitive to environmental conservation, such as ecotourism, nature tourism, and recreational activities with low ecological impact, including recreational fishing. This encourages a visitor profile that values cultural ecosystem services and is willing to contribute to their maintenance, reducing the risk of tourism overexploitation that degrades resources [11].
Another key strategy is to integrate certification mechanisms and sustainability labels to ensure that destinations and tour operators comply with criteria for environmental protection, social responsibility, and economic viability. These market tools not only strengthen the competitiveness of tourist destinations but also build confidence among visitors by differentiating authentic, responsible experiences from the 3S industry’s products [32]. In the case of sport fishing, promoting tournaments that adhere to good practices, such as catch-and-release techniques or reinvestment in marine conservation, reinforces the image of recreational tourism compatible with sustainability [7,10,44].
5. Conclusions
The results of this study indicate that, given the high willingness to pay (WTP) to participate in fishing tournaments in BLP (USD 608.63), this value provides a solid basis for the implementation of environmental economic instruments aimed at conservation. There is ample scope for actions that could be channeled into infrastructure improvements, conservation measures, and tourism promotion. This would not have a significant negative impact on demand, representing an opportunity for growth and sustainable financing, if the advantages of the domestic market are exploited and structural conditions are improved. Economic valuation not only serves to justify investments but also to establish payment mechanisms for environmental services, such as compensation or fines for damage to species or habitats.
Considering the study results, this paper proposes the following policy strategies to promote tourism and conserve species targeted for sport fishing in the BLP, thereby boosting tournament activity and maximizing the use of natural resources. First, mandatory promotion of catch-and-release fishing in tournaments, since almost three-quarters of the interviewed anglers would be willing to continue participating, even if they could not keep their catch. Catch-and-release could be established as a rule in all tournaments endorsed by federal or local authorities. This measure would help reduce pressure on target species such as marlin, mahi-mahi, and tuna. Second, differentiated regulations by season for species, considering the possibility of implementing temporary closures or catch quotas for species, based on biological monitoring data, especially for high-demand species such as marlin and mahi-mahi. This will allow for the preservation of vulnerable populations without halting recreational activity.
Third, participatory biological monitoring may be conducted by recreational anglers, leveraging their high educational profile to engage them in community monitoring and citizen science programs. This can raise awareness about the status of target species and encourage sustainable practices. Fourth, implement a licensing system with conservation components, such as a voluntary or mandatory additional payment on sport fishing licenses, based on the type of license purchased, that could be directly allocated to conservation, monitoring, and marine surveillance schemes. Fifth, diversify the offer towards national family and recreational tourism, given that just over half of the sample stated that the main reason for participating in tournaments is to spend time with friends and family. It is therefore recommended to promote sport fishing as an active family tourism activity, complemented by cultural, gastronomic, and nature activities.
Sixth, promotional campaigns differentiated by segment, considering the different profiles of anglers, such as amateurs vs. experts, nationals vs. foreigners. Specific campaigns can be designed for national anglers, such as affordable packages for beginner tournaments, with a recreational and family focus. For foreign anglers, premium packages might include catch-and-release experiences, conservation efforts, eco-friendly accommodation, and different fishing license rates. Implement different rates for nationals and foreigners. The extra income could finance conservation and tourism promotion programs.
Seventh, create an eco-label or badge, such as “responsible tournament” or “sustainable tournament,” to recognize events that implement good practices, including catch-and-release, environmental education, and plastic waste reduction. This can attract more conscious anglers and improve the destination’s international image. Eighth, create environmentally responsible tourism infrastructure so that investments can be made in sustainable tourism services such as eco-friendly docks, electric or hybrid boats, dry toilets, and marine waste collection points, aligned with the demands of the sport fishing market.
Author Contributions
Conceptualization, D.H.P.C., L.C.A.H., V.H.T, U.J.C., M.J.Z.R. and M.D.H.P.; methodology, L.C.A.H. and V.H.T; validation, L.C.A.H., V.H.T, U.J.C., M.J.Z.R. and M.D.H.P.; formal analysis, D.H.P.C.; investigation, D.H.P.C., L.C.A.H. and V.H.T.; data curation, D.H.P.C.; writing—original draft preparation, D.H.P.C.; writing—review and editing, D.H.P.C., L.C.A.H. and V.H.T.; supervision, L.C.A.H., V.H.T, U.J.C., M.J.Z.R. and M.D.H.P. All authors have read and agreed to the published version of the manuscript.
Data Availability Statement
The raw data supporting the conclusions of this article will be made available by the authors on request.
Acknowledgments
The first author, Daily Hernández Pérez de Corcho, would like to thank the Secretaría de Ciencia, Humanidades, Tecnología e Innovación (SECIHTI) for awarding her a scholarship for her doctoral studies (CVU 1147690), which made this research possible.
Conflicts of Interest
The authors declare no conflicts of interest.
Appendix A

Table A1.
Number of applied surveys in the years 2022 and 2023.
| Month | Tournament | Specie | Surveys |
|---|---|---|---|
| 2022 | |||
| April | Rotario | Yellowtail | 11 |
| May | First Annual La Paz Charity | Yellowtail | 8 |
| June | Fish In The Five | Marlin, mahi-mahi and tuna | 10 |
| July | Torneo de Los Electricistas | Mahi-mahi | 6 |
| July | Sindicato del Seguro | Mahi-mahi | 5 |
| July | Copa Dorado Gavilanes | Mahi-mahi | 8 |
| September | Torneo de La Independencia | Mahi-mahi and marlín | 5 |
| October | Tradicional Torneo Bahía de La Paz | Marlin | 7 |
| November | Torneo de Electricistas Privado | Marlin | 5 |
| 2023 | |||
| April | Rotario La Paz Balandra | Yellowtail | 10 |
| May | First Annual La Paz Charity Yellowtail | Yellowtail | 7 |
| July | El Grande Pescando en La Paz | Mahi-mahi | 37 |
| July | Torneo de Los Electricistas | Mahi-mahi | 7 |
| July | Copa Dorado Los Gavilanes | Mahi-mahi | 11 |
| August | Color Laser Fishing Tournament | Mahi-mahi | 8 |
| August | Bahía de La Paz Club Gavilanes | Marlin | 9 |
| September | Torneo La Independencia | Marlin | 10 |
| October | Dorado La Paz | Mahi-mahi | 9 |
| October | Tradicional Torneo Bahía de La Paz | Marlin | 11 |
Appendix B
Table B1.
Variables in the survey.
| Variable | Description |
|---|---|
| General information | |
| Gender | Male/Female |
| Age | |
| Nationality | Country |
| Education | Last level of education |
| Precedence | Country of residence |
| Ocupation | Job |
| About tournaments | |
| The number of hours it took him to reach the fishing spot using the boat | |
| Number of times you participated in tournaments in the area (last 12 months) | |
| Motivation | Winning the tournament/ The prize/ Fighting the animal/ Spending time with friends and family/ The competition/ Playing a sport/ Other |
| Repetition | Since what year have you been fishing in La Paz? |
| Angler’s activities | |
| Skill | Amateur/ Middle/ Expert |
| Fishing zone | Bajo/ Cerralvo Norte/ Cerralvo Sur/ El Coyote/ Punta Arena/ Otro |
| Years in tournaments | Number of years participating in tournaments in the area |
| Fishing gear | Owning fishing equipment |
| Fishing boat | Owning a fishing boat |
| Number of anglers in the team | Not counting the interviewee |
| Species preferred for capture, in order of importance from highest to lowest, on a scale of 1 to 5 | Marlin/ Mahi-mahi/ Tuna / Yellowtail / Wahoo/ Other |
| Released fishes | Number of fish caught and released, and species |
| Skunked | No fish caught |
| No Fishing days | Days without going fishing |
| Lincese | Daily/Weekly/Monthly/Annual |
| Economic information | |
| Income | Gross monthly income in US dollars (USD) |
| Travel cost | Total cost of the tournament (USD) |
| Registration fee | USD |
| If they were prohibited from keeping their catch, would you still participate in tournaments? | Y/N |
| Places where you can participate in tournaments with the same budget | Cabo San Lucas/ Mazatlán/ Loreto/ USA/ Costa Rica/ Other |
| Management | |
| Place where you purchased your fishing license | Internet/Fishing guide/Hotel/Harbor master’s office/Fishing service provider/Other |
| Willingness to pay to collaborate in managing the activity | Y/N |
| Willingness to pay based on an improvement in the capture rate | Y/N |
References
- Abascal, E.; Grande, I. Análisis de encuestas; ESIC: Madrid, España, 2005. [Google Scholar]
- Almendarez Hernández, L.C. Perfil del pescador deportivo que visita Isla Cerralvo y localidades contiguas, Baja California Sur, México. El Periplo sustentable 2023, 44, 212–228. [Google Scholar] [CrossRef]
- Almendarez Hernández, L.C.; Rodríguez Fuentes, M.; Vergara Solana, F.J.; Almendarez Hernández, M.A. Economic valuation of sportfishing in the surroundings of Cerralvo Island, Baja California Sur, Mexico using the travel cost method. Lat. am. j. aquat. res. 2020, 48, 370–380. https://www.scielo.cl/scielo.php?pid=S0718-560X2020000300370&script=sci_arttext. [CrossRef]
- Anderson, C.L.; Skytta, B.; Jesswein, W. A.; Fleischman, W. The Economic Value of Derby Fishing: An Application of Travel-Cost Methodology in Lake Superior. J. Reg. Anal. Policy 1988, 18, 3–18. [Google Scholar]
- Anna, Z.; Saputra, D.S. Economic valuation of whale shark tourism in cenderawasih bay National Park, Papua, Indonesia. Biodiversitas 2017, 18, 1026–1034. [Google Scholar] [CrossRef]
- Arlinghaus, R.; Mehner, T.; Cowx, I.G. Reconciling traditional inland fisheries management and sustainability in industrialized countries, with emphasis on Europe. Fish. Fish. 2002, 3, 261–316. [Google Scholar] [CrossRef]
- Arlinghaus, R.; Cooke, S.J.; Lyman, J.; Policansky, D.; Schwab, A.; Suski, C.; Sutton, S.G.; Thorstad, E.B. Understanding the complexity of catch-and-release in recreational fishing: An integrative synthesis of global knowledge from historical, ethical, social, and biological perspectives. Rev. Fish. Sci. 2007, 15, 75–167. [Google Scholar] [CrossRef]
- Arlinghaus, R.; Tillner, R.; Bork, M. Explaining participation rates in recreational fishing across industrialized countries. Fish. Manage. Ecol. 2015, 22, 45–55. [Google Scholar] [CrossRef]
- Avendaño Leadem, D.F.; Cedeño Montoya, B.P.; Arroyo Zeledón, M.S. Integrando el concepto de servicios ecosistémicos en el ordenamiento territorial. Rev. Geog. Amer. Central 2020, 65, 63–90. https://www.scielo.sa.cr/pdf/rge/n65/2215-2563-rge-65-63.pdf. [CrossRef]
- Barnett, A.; Abrantes, K.G.; Baker, R.; Diedrich, A.S.; Farr, M.; Kuilboer, A.; Mahony, T.; McLeod, I.; Moscardo, G.; Prideaux, M.; Stoeckl, N.; van Luyn, A.; Sheaves, M. Sportfisheries, conservation and sustainable livelihoods: a multidisciplinary guide to developing best practice. Fish. Fish. 2016, 17, 696–713. [Google Scholar] [CrossRef]
- Bramwell, B.; Lane, B. Critical research on the governance of tourism and sustainability. J. Sustain. Tour. 2011, 19(4-5), 411–421. [Google Scholar] [CrossRef]
- Burnham, K.P.; Anderson, D.R. Model Selection and Inference: A Practical Information-Theoretic Approach; Springer: New York, USA, 1998. [Google Scholar]
- Carrasco Águila, M.A.; Salas Maldonado, M.; Macías Zamora, R. Análisis descriptivo de la pesca en torneos de pesca deportiva en Puerto Vallarta, Jalisco. In La pesca deportiva en la Bahía de Banderas; Universidad de Guadalajara: Puerto Vallarta, Jalisco, México, 2018; pp. 117–153. https://www.researchgate.net/profile/Rosa-Chavez-Dagostino/publication/329191680_La_Pesca_deportiva_en_la_Bahia_de_Banderas/links/5bfc110e299bf10737f8c002/La-Pesca-deportiva-en-la-Bahia-de-Banderas.pdf#page=118.
- Christiernsson, A. An economic Valuation of the Coral Reefs at Phi-Phi Island: AT travel Cost Approach. Master’s Thesis, Lulea University of Technology, Norrbotten County, Sweden, 2003. https://www.diva-portal.org/smash/get/diva2:1028821/FULLTEXT01.pdf.
- CONAPESCA. Anuario Estadístico de Acuacultura y Pesca 2023; Comisión Nacional de Acuacultura y Pesca. Comisión Nacional de Acuacultura y Pesca, 2023; https://www.gob.mx/conapesca/documentos/anuario-estadistico-de-acuacultura-y-pesca.
- CONAPESCA. Expide CONAPESCA más de 250 mil permisos individuales para Pesca Deportiva-Recreativa del 2020 al 2023. Comisión Nacional de Acuacultura y Pesca. Available online: https://www.gob.mx/conapesca/prensa/expide-conapesca-mas-de-250-mil-permisos-individuales-para-pesca-deportiva-recreativa-del-2020-al-2023 (accessed on 18 January 2024).
- Cooke, S.J.; Cowx, I.G. The role of recreational fishing in global fish crises. BioScience 2004, 54, 857–859. [Google Scholar] [CrossRef]
- Cooke, S.J.; Cowx, I.G. Contrasting recreational and commercial fishing: Searching for common issues to promote unified conservation of fisheries resources and aquatic environments. Biol. Conserv. 2006, 128, 93–108. [Google Scholar] [CrossRef]
- Costanza, R.; d’Arge, R.; de Groot, R.; Farber, S.; Grasso, M.; Hannon, B.; Limburg, K.; Naeem, S.; O’Neill, R.V.; Paruelo, J.; Raskin, R.G.; Sutton, P.; van den Belt, M. The value of the world’s ecosystem services and natural capital. Nature 1997, 387, 253–260. [Google Scholar] [CrossRef]
- Daily, G.C. Nature’s services: societal dependence on natural ecosystems; Island Press: Washington, DC, USA, 1997. [Google Scholar]
- del Castillo Cárdenas, P.A.Á.; Pérezrul, M.D.H.; Bonilla, H.R.; Magaña, A.L.C. Valoración económica por servicios ambientales de recreación, el caso del buceo autónomo y esnórquel en el Parque Nacional Cabo Pulmo. El Periplo Sustentable 2020, (39), 410–432. [Google Scholar] [CrossRef]
- del Monte Luna, P.; Arreguín Sánchez, F.; Godínez Orta, L.; López Ferreira, C.A. Batimetría actualizada de la Bahía de La Paz, Baja California Sur, México. CICIMAR Oceánides 2005, 20, 75–77. [Google Scholar] [CrossRef]
- Ditton, R.B.; Grimes, S.R.; Finkelstein, L.D. A social and economic study of the recreational billfish fishery in the Southern Baja area of Mexico; Texas A & M University: USA, 1996. [Google Scholar]
- Ditton, R.B.; Holland, S.M.; Anderson, D.K. Recreational fishing as tourism. Fisheries 2002, 27, 17–24. [Google Scholar] [CrossRef]
- DOF. Diario Oficial de la Federación. Modificación a la Norma Oficial Mexicana NOM-017-PESC-1994, Para regular las actividades de pesca deportivo-recreativa en las aguas de jurisdicción federal de los Estados Unidos Mexicanos, publicada el 9 de mayo de 1995. Gobierno Federal, Diario Oficial (Primera Sección). 2013. https://www.dof.gob.mx/nota_detalle.php?codigo=5323155&fecha=25/11/2013#gsc.tab=0.
- Eagles, P.F.; McCool, S.F.; Haynes, C.D. Sustainable Tourism in Protected Areas: Guidelines for Planning and Management; IUCN Gland, Switzerland and Cambridge, UK, 2002; p. 26. https://wedocs.unep.org/bitstream/handle/20.500.11822/7861/-Sustainable%20Tourism%20in%20Protected%20Areas%20_%20Guidelines%20for%20Planning%20and%20Management-2002154.pdf?sequence=3&%3BisAllowed=.
- Egbenta, R.I. Application of Travel Cost Method to Valuation of Historic Building: Old Residence in Calabar, Nigeria. Middle East J. Sci. Res. 2017, 25, 1925–1933. https://www.researchgate.net/profile/Idu-Egbenta/publication/323772183_Application_of_Travel_Cost_Method_to_Valuation_of_Historic_Building_Old_Residence_in_Calabar_Nigeria/links/5abba6ca45851507a5ca75a4/Application-of-Travel-Cost-Method-to-Valuation-of-Historic-Building-Old-Residence-in-Calabar-Nigeria.pdf.
- FAO. Technical guidelines for responsible fisheries. In Recreational fisheries. Food and Agriculture Organization of the United Nations; 2012; https://www.fao.org/4/i2708e/i2708e00.pdf.
- FAO. Pesca recreativa. 2025. https://www.fao.org/inland-fisheries/background/pesca-recreativa/es/.
- Farber, S.; Costanza, R.; Childers, D.L.; Ericson, J.; Gross, K.; Grove, M.; Hopknson, C.S.; Khan, J.; Pincetl, S.; Troy, A.; Warren, P.; Wilson, M. Linking Ecology and Economics for Ecosystem Management. Bioscience 2006, 56, 34–47. [Google Scholar] [CrossRef]
- FONMAR. Recaudó FONMAR 71.4 mdp en permisos de pesca deportiva durante 2023; Fondo para la Protección de Recursos Marinos. Available online: https://fonmar.gob.mx/recaudo-fonmar-71-4-mdp-en-permisos-de-pesca-deportiva-durante-2023/ (accessed on 9 February 2024).
- Font, X. Environmental certification in tourism and hospitality: progress, process and prospects. Tour. Manag. 2002, 23, 197–205. [Google Scholar] [CrossRef]
- Freeman, A.M., III; Herriges, J.A.; Kling, C.L. The measurement of environmental and resource values: Theory and methods, 3rd ed.; RFF Press: Routledge: New York, USA, 2014. [Google Scholar] [CrossRef]
- Gómez, I.; Ivanova, A.; Ponce, G.; Ángeles, M. Economic valuation of sport fisheries in Los Cabos, Baja California Sur, Mexico. WIT Transactions on Ecology and the Environment, Sustainable Development and Planning V 2011, 150, 517–524. https://www.witpress.com/elibrary/wit-transactions-on-ecology-and-the-environment/150/22517.
- Gómez Cabrera, I.D.; Ivanova Boncheva, A. Valor económico de la pesca deportiva como fuente principal de atracción turística en Los Cabos, Baja California Sur, México. TURyDES 2013, 6, 1–25. https://revistaturydes.com/index.php/turydes/article/view/1220/1418.
- González Acosta, A.F.; Balart, E.F.; Ruiz Campos, G.; Espinosa Pérez, H.; Cruz Escalona, V.H.; Hernández López, A. Diversidad y conservación de los peces de la bahía de La Paz, Baja California Sur, México. Rev. Mex. Biodivers. 2018, 89, 705–740. [Google Scholar] [CrossRef]
- Gössling, S.; Hall, C.M.; Ekström, F.; Engeset, A.B.; Aall, C. Transition management: A tool for implementing sustainable tourism scenarios? Journal of Sustainable Tourism 2012, 20, 899–916. [Google Scholar] [CrossRef]
- Haab, T.C.; McConnell, K.E. Valuing environmental and natural resources: the econometrics of non-market valuation; Edward Elgar Publishing: Cheltenham, UK, 2002. [Google Scholar] [CrossRef]
- Hanley, N.; Shogren, J.F.; White, B. Introduction to Environmental Economics, 3rd ed.; Oxford University Press: Oxford, UK, 2019. [Google Scholar]
- Hemmert, G.A.; Schons, L.M.; Wieseke, J.; Schimmelpfennig, H. Log-likelihood-based pseudo-R2 in logistic regression: deriving sample-sensitive benchmarks. Sociol. Methods Res. 2018, 47, 507–531. [Google Scholar] [CrossRef]
- Hernández Trejo, V.; Urciaga García, J.; Hernández Vicent, M.; Palos Arocha, L. Valoración económica del Parque Nacional Bahía de Loreto a través de los servicios de recreación de pesca deportiva. Reg. Soc. 2009, 21, 195–224. https://www.scielo.org.mx/pdf/regsoc/v21n44/v21n44a8.pdf. [CrossRef]
- Hernández Trejo, V.A.; Germán, G.P.D.; Lluch Belda, D.; Beltrán Morales, L.F. Economic benefits of sport fishing in e relative Los Cabos, Mexico: is the abundance a determinant. WIT Transactions on Ecology and the Environment, Sustainable Tourism V 2012, 161, 165–176. https://www.witpress.com/elibrary/wit-transactions-on-ecology-and-the-environment/161/23432.
- Hernández Trejo, V.; Avilés Polanco, G.; Ponce Díaz, G.; Lluch Belda, D. Estimación de cuotas diferenciadas para permisos de pesca deportiva en Los Cabos, México. Un enfoque de costo de viaje. Economía: teoría y práctica 2017, (46), 139–171. [Google Scholar] [CrossRef]
- Holland, S.M.; Ditton, R.B.; Graefe, A.R. An Ecotourism Perspective on Billfish Fisheries. J. Sustain. Tour. 1998, 6, 97–116. [Google Scholar] [CrossRef]
- Johnston, R.J.; Boyle, K.J.; Adamowicz, W.; Bennett, J.; Brouwer, R.; Cameron, T.A.; Hanemann, W.M.; Hanley, N.; Ryan, M.; Scarpa, R.; Tourangeau, R.; Vossler, C.A. Contemporary guidance for stated preference studies. J. Assoc. Environ. Resour. Econ. 2017, 4, 319–405. [Google Scholar] [CrossRef]
- Kouztnetsov Prudnikov, E.; Robles Zavala, E. La experiencia de nado con tiburón ballena Rhincodon typus en el Caribe mexicano: Valoración económica y satisfacción del turista. El Periplo Sustentable 2022, 43, 469–498. [Google Scholar] [CrossRef]
- Kuha, J. AIC and BIC: Comparisons of assumptions and performance. Sociol. Method. Res. 2004, 33, 188–229. [Google Scholar] [CrossRef]
- Kutner, M.H.; Nachtsheim, C.J.; Neter, J.; Li, W. Applied linear statistical models, 5th ed.; McGraw-Hill/Irwin: New York, USA, 2005; https://users.stat.ufl.edu/~winner/sta4211/ALSM_5Ed_Kutner.pdf.
- Levin, R.I.; Rubin, D.S. Estadística para administración y economía, 7th ed; Pearson: Estado de México, México, 2010. [Google Scholar]
- Liu, A. Building Regression Models in Social Sciences; RM Institute: California, USA, 2009. [Google Scholar]
- Loomis, J.B.; Walsh, R.G. Recreation economic decisions: comparing benefits and costs, 2nd ed.; Venture Publishing: Pennsylvania, USA, 1997. [Google Scholar]
- Loomis, J. B. Integrated public lands management: Principles and applications to national forests, parks, wildlife refuges, and BLM lands, 2nd ed.; Columbia University Press: New York, USA, 2002. [Google Scholar]
- López Castañeda, L.; Hernández Ramos, I.; Borroto Escuela, D.Y.; Falcón Méndez, A.; Caraballo, I.J.A.; Hernández López, N.V.; González Díaz, P.; Vázquez Sánchez, V.; Rangel Rivero, A.; Ramenzoni, V.C.; Besonen, M.; Yoskowitz, D.W. Estimación del valor económico total de los bienes y servicios ecosistémicos que provee el Parque Nacional Caguanes. Rev. Invest. Mar. 2021, 41, 137–157. https://www.researchgate.net/publication/358433836.
- Martínez Alier, J.; Roca Jusmet, J. Economía ecológica y política ambiental, 3rd ed.; Fondo de Cultura Económica: Distrito Federal, México, 2013. [Google Scholar]
- McConnell, K.E.; Strand, I. Measuring the cost of time in recreation demand analysis: An application to sportfishing. Am. J. Agric. Econ. 1981, 63, 153–156. [Google Scholar] [CrossRef]
- McFadden, D. Conditional logit analysis of qualitative choice behavior. 1972. https://escholarship.org/content/qt61s3q2xr/qt61s3q2xr.pdf.
- McKean, J.R.; Johnson, D.; Taylor, R.G. Estimating tournament effects on sportfishing demand. Tourism Economics 2014, 20, 1067–1086. [Google Scholar] [CrossRef]
- Méndez Heras, L.B.; Rivera Medina, J.G.; Medina Alvarado, J.E. Enfoque Teórico-Matemático de los Métodos de Valoración Contingente y Costo de Viaje. Matemática 2020, 18. https://www.revistas.espol.edu.ec/index.php/matematica/article/view/705/633.
- Mendoza Martínez, I.; Ponce Gutiérrez, B.E.; Valdivia Alcala, R.; Sandoval Romero, F. Estimación econométrica del excedente del consumidor de servicios recreativos ambientales. Rev. Mex. Cienc. Agríc 2025, 16. [Google Scholar] [CrossRef]
- Meza Cuellar, N.C. Valoración socioeconómica de la pesca deportiva y preferencia por capturar el dorado (Coryphaena hippurus) en la zona de los Barriles- Buena Vista, Baja California Sur, por el Método Costo de Viaje. Master’s Thesis, Centro de Investigaciones Biológicas del Noroeste, La Paz, Baja California Sur, México, 2017. http://cibnor.repositorioinstitucional.mx/jspui/handle/1001/878.
- Miranda Torres, A.; Revollo Fernández, D.A.; Beltrán Morales, L.F.; Almendarez Hernández, M.A. Valoración económica del servicio ecosistémico recreativo provisto por el tiburón ballena (Rhincodon typus, Smith, 1829) en la Bahía de La Paz, BCS, para la temporada de observación 2019-2020. Estudios sociales. Revista de alimentación contemporánea y desarrollo regional 2021, 31. [Google Scholar] [CrossRef]
- Mohammadi Limaei, S.; Ghesmati, H.; Rashidi, R.; Yamini, N. Economic evaluation of natural forest park using the travel cost method (case study; Masouleh forest park, north of Iran). J. For. Sci. 2014, 60, 254–261. [Google Scholar] [CrossRef]
- Morales Zarate, M.V.; Almendarez Hernández, M.A.; Sánchez Brito, I.; Salinas-Zavala, C. A. Valoración económica del servicio ecosistémico recreativo de playa en Los Cabos, Baja California Sur (BCS), México: Una aplicación del Método de Costo de Viaje. El periplo sustentable 2019, 36, 447–469. https://www.scielo.org.mx/scielo.php?pid=S1870-90362019000100447&script=sci_arttext. [CrossRef]
- Moreno Díaz, M.L.; Jiménez Elizondo, K. Beneficios económicos provenientes de servicios ecosistémicos del Área Marina de Manejo Montes Submarinos (AMM MS), Costa Rica. Mar. fish. sci. 2022, 35, 49–65. https://dialnet.unirioja.es/servlet/articulo?codigo=8808983.
- Moreno Gutiérrez, M.; Hernández Trejo, V.; Valdivia Alcalá, R.; Juárez Mancilla, J.; Cruz Chávez, P.R.; Jakes Cota, U. Linking Tourist Willingness to Pay and Beach Management: A Travel Cost Analysis for Balandra Marine Park, Mexico. Tour. Hosp. 2024, 5, 922–941. [Google Scholar] [CrossRef]
- Oropeza, G.; Hernández Trejo, V.; Romero Vadillo, E. Valoración económica del servicio recreativo de avistamiento de ballena gris en Laguna San Ignacio, México. El Periplo Sustentable 2023, 45, 183–200. [Google Scholar] [CrossRef]
- Parsons, G.R. The travel cost model. In A primer on nonmarket valuation; Champ, P.A., Boyle, K.J., Brown, T.C., Eds.; Springer Science+Business Media: New York, USA, 2003; Volume 3, pp. 269–329. [Google Scholar] [CrossRef]
- Pasos-Acuña, C.; Almendarez-Hernández, M.A.; Hoyos-Padilla, E.M.; Blázquez, M.C.; Ketchum, J.T. Economic Valuation of Diving with Bull Sharks in Natural Conditions: A Recent Activity in Cabo Pulmo National Park, Gulf of California, Mexico. In Socio-ecological Studies in Natural Protected Areas. Linking Community Development and Conservation in Mexico; Ortega-Rubio, A., Ed.; Springer Nature: Cham, Switzerland, 2020; pp. 485–509. [Google Scholar] [CrossRef]
- Prayaga, P.; Rolfe, J.; Stoeckl, N. The value of recreational fishing in the Great Barrier Reef, Australia: A pooled revealed preference and contingent behaviour model. Mar. Policy 2010, 34, 244–251. [Google Scholar] [CrossRef]
- Prochazka, P.; Abrham, J. Evaluation of Environmental Assets Value on Borneo Using the Travel Cost Method. BioResources 2024, 19, 5811–5824. https://www.proquest.com/openview/11f061e3e219f16aaa432a9e6bde84ce/1?pq-origsite=gscholar&cbl=5038271. [CrossRef]
- Rahat, K.M.R.; Amin, M.A.; Ahmed, M.T. Comparing tourists’ travel cost and consumer surplus to estimate the recreational values of Kuakata Sea Beach in Bangladesh. J. Tourism Hospit. 2024, 13, 541. https://www.researchgate.net/profile/Md-Al-Amin-76/publication/378658159_Comparing_Tourists’_Travel_Cost_and_Consumer_Surplus_to_Estimate_the_Recreational_Values_of_Kuakata_Sea_Beach_in_Bangladesh/links/65e2ad75e7670d36abeb8440/Comparing-Tourists-Travel-Cost-and-Consumer-Surplus-to-Estimate-the-Recreational-Values-of-Kuakata-Sea-Beach-in-Bangladesh.pdf.
- Randall, A. A Difficulty with the Travel Cost Method. Land Econ. 1994, 70, 88–96. [Google Scholar] [CrossRef]
- Ron, A. Regression analysis and the philosophy of social science: A critical realist view. J. Crit. Realism 2002, 1, 119–142. [Google Scholar] [CrossRef]
- Scheufele, G.; Pascoe, S. Estimation and use of recreational fishing values in management decisions. Ambio 2022, 51, 1275–1286. [Google Scholar] [CrossRef]
- Schramm, H.L.; Armstrong, M.L.; Funicelli, N.A.; Green, D.M.; Lee, D.P.; Manns, R.E.; Taubert, B.D.; Waters, S.J. The status of competitive fishing in the United States. Fisheries 1991, 16, 4–12. [Google Scholar] [CrossRef]
- Schramm, H.L.; Hunt, K.M. Issues, benefits, and problems associated with fishing tournaments in inland waters of the United States: a survey of fishery agency administrators. Fisheries 2007, 32, 234–243. [Google Scholar] [CrossRef]
- Shtatland, E.S. Logistic Regression: Pseudo -R 2 Statistics vs Base Rate Simulations Results and Analytical Approach. 2025. https://www.researchgate.net/publication/394292183.
- Shrestha, R.K.; Seidl, A.F.; Moraes, A.S. Value of recreational fishing in the Brazilian Pantanal: a travel cost analysis using count data models. Ecological economics 2002, 42, 289–299. [Google Scholar] [CrossRef]
- Skarakis, N.; Skiniti, G.; Tournaki, S.; Tsoutsos, T. Necessity to assess the sustainability of sensitive ecosystems: A comprehensive review of tourism pressures and the travel cost method. Sustainability 2023, 15, 12064. [Google Scholar] [CrossRef]
- Smith, V.K.; Desvousges, W.H.; Fisher, A. A comparison of direct and indirect methods for estimating environmental benefits. Am. J. Agric. Econ. 1986, 68, 280–290. [Google Scholar] [CrossRef]
- Southwick, R.; Nelson, R.; Arean, J.A. The economic contributions of anglers to the Los Cabos economy: quantifying value in a sustainable fishery. Interdiscip. Environ. Rev. 2010, 11, 69–89. [Google Scholar] [CrossRef]
- Voltaire, L.; Lévi, L.; Alban, F.; Boncoeur, J. Valuing cultural world heritage sites: an application of the travel cost method to Mont-Saint-Michel. Appl. Econ. 2016, 49, 1593–1605. [Google Scholar] [CrossRef]
- Von Borstel Juárez, O.S. Análisis bioeconómico de pesca deportivo-recreativa de marlin rayado en la región de Los Cabos, BCS. Doctoral Thesis, Centro de Investigaciones Biológicas del Noroeste, La Paz, Baja California Sur, México, 2020. http://cibnor.repositorioinstitucional.mx/jspui/handle/1001/1922.
- Wood, A.L.; Butler, J.R.; Sheaves, M.; Wani, J. Sport fisheries: Opportunities and challenges for diversifying coastal livelihoods in the Pacific. Mar. Policy 2013, 42, 305–314. [Google Scholar] [CrossRef]
- Wubalem, A.; Woldeamanuel, T.; Nigussie, Z. Economic valuation of Lake Tana: A recreational use value estimation through the travel cost method. Sustainability 2023, 15, 6468. [Google Scholar] [CrossRef]
Figure 1.
La Paz Bay is in the Gulf of California. Source: Author’s self-elaboration.
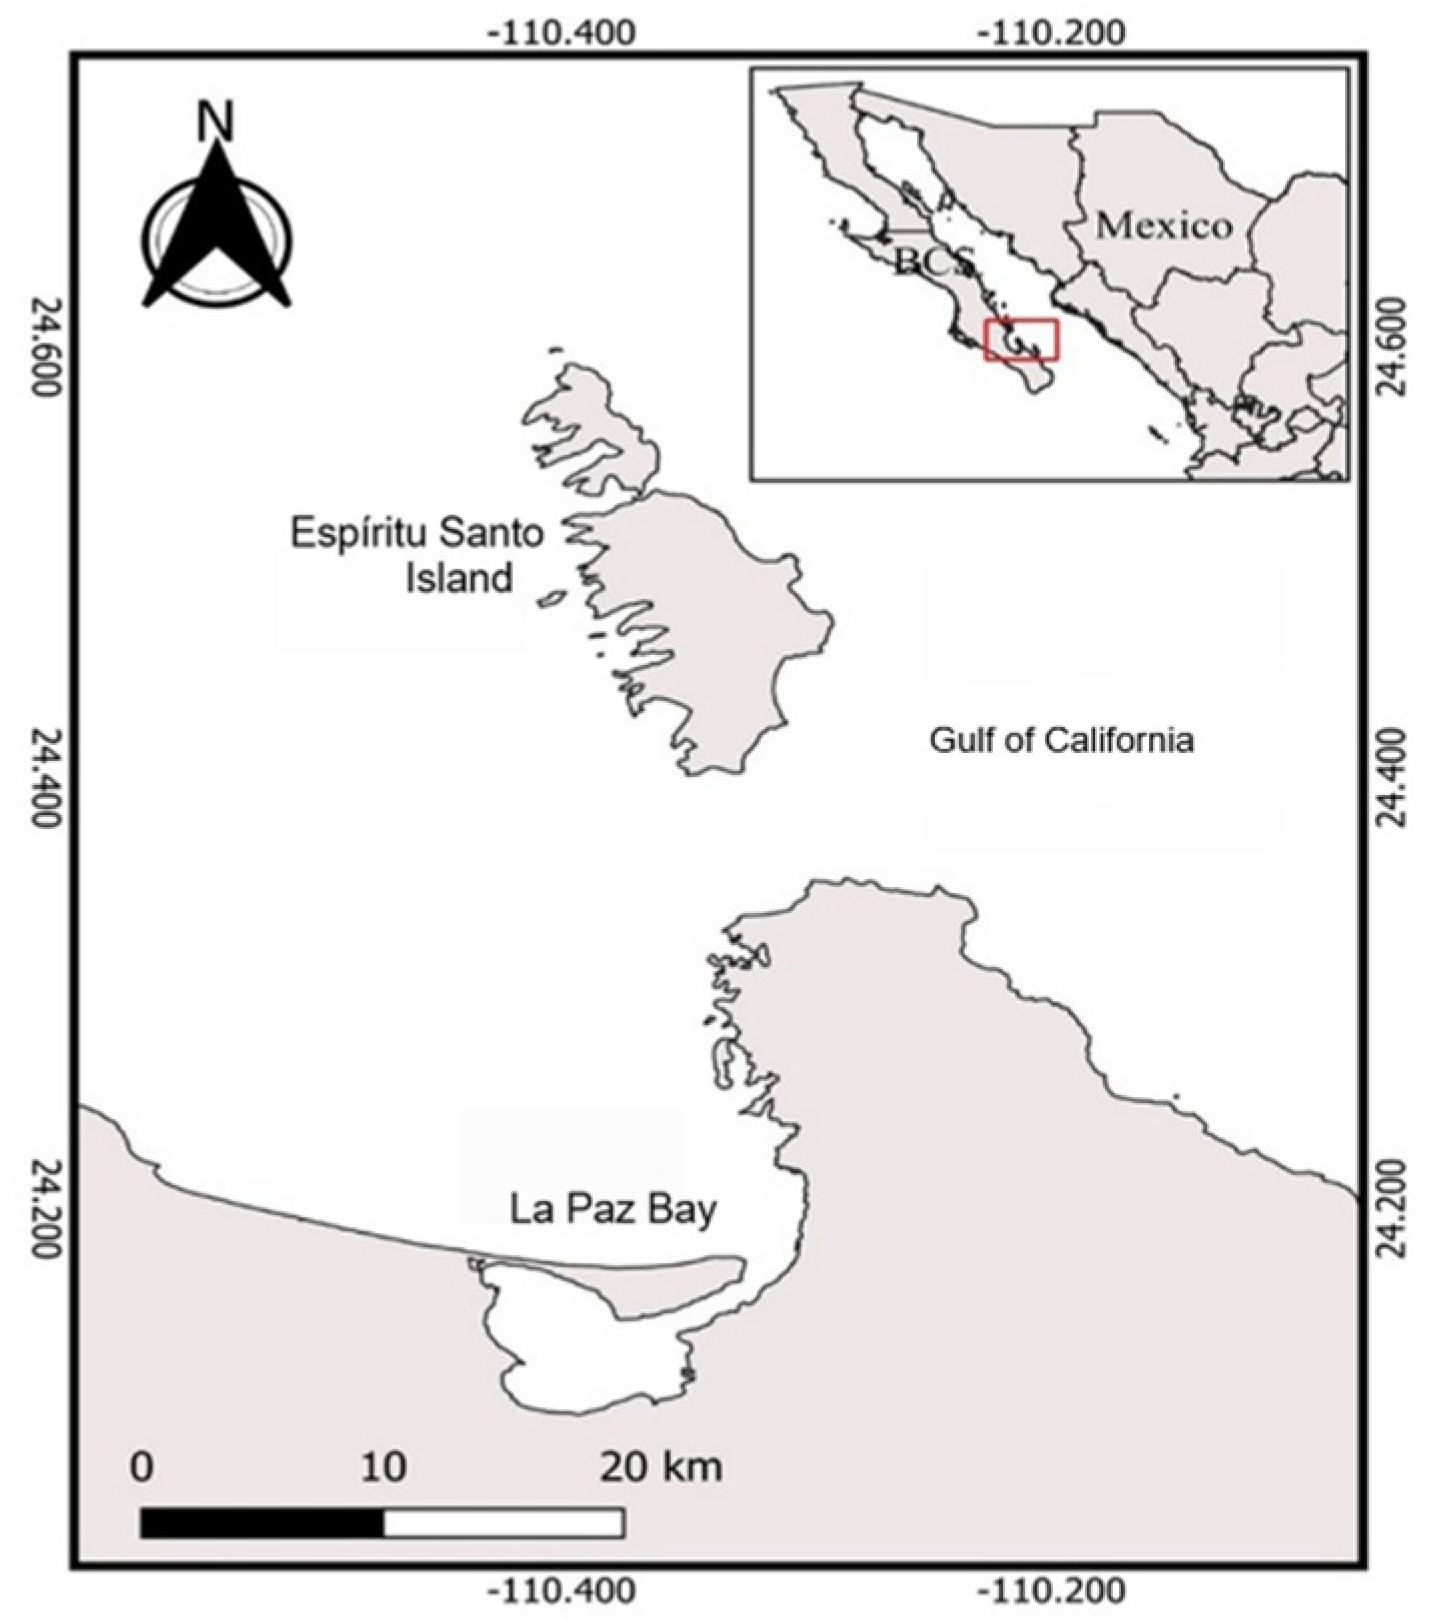
Figure 2.
Histogram for sftp. Source: Author’s self-elaboration.
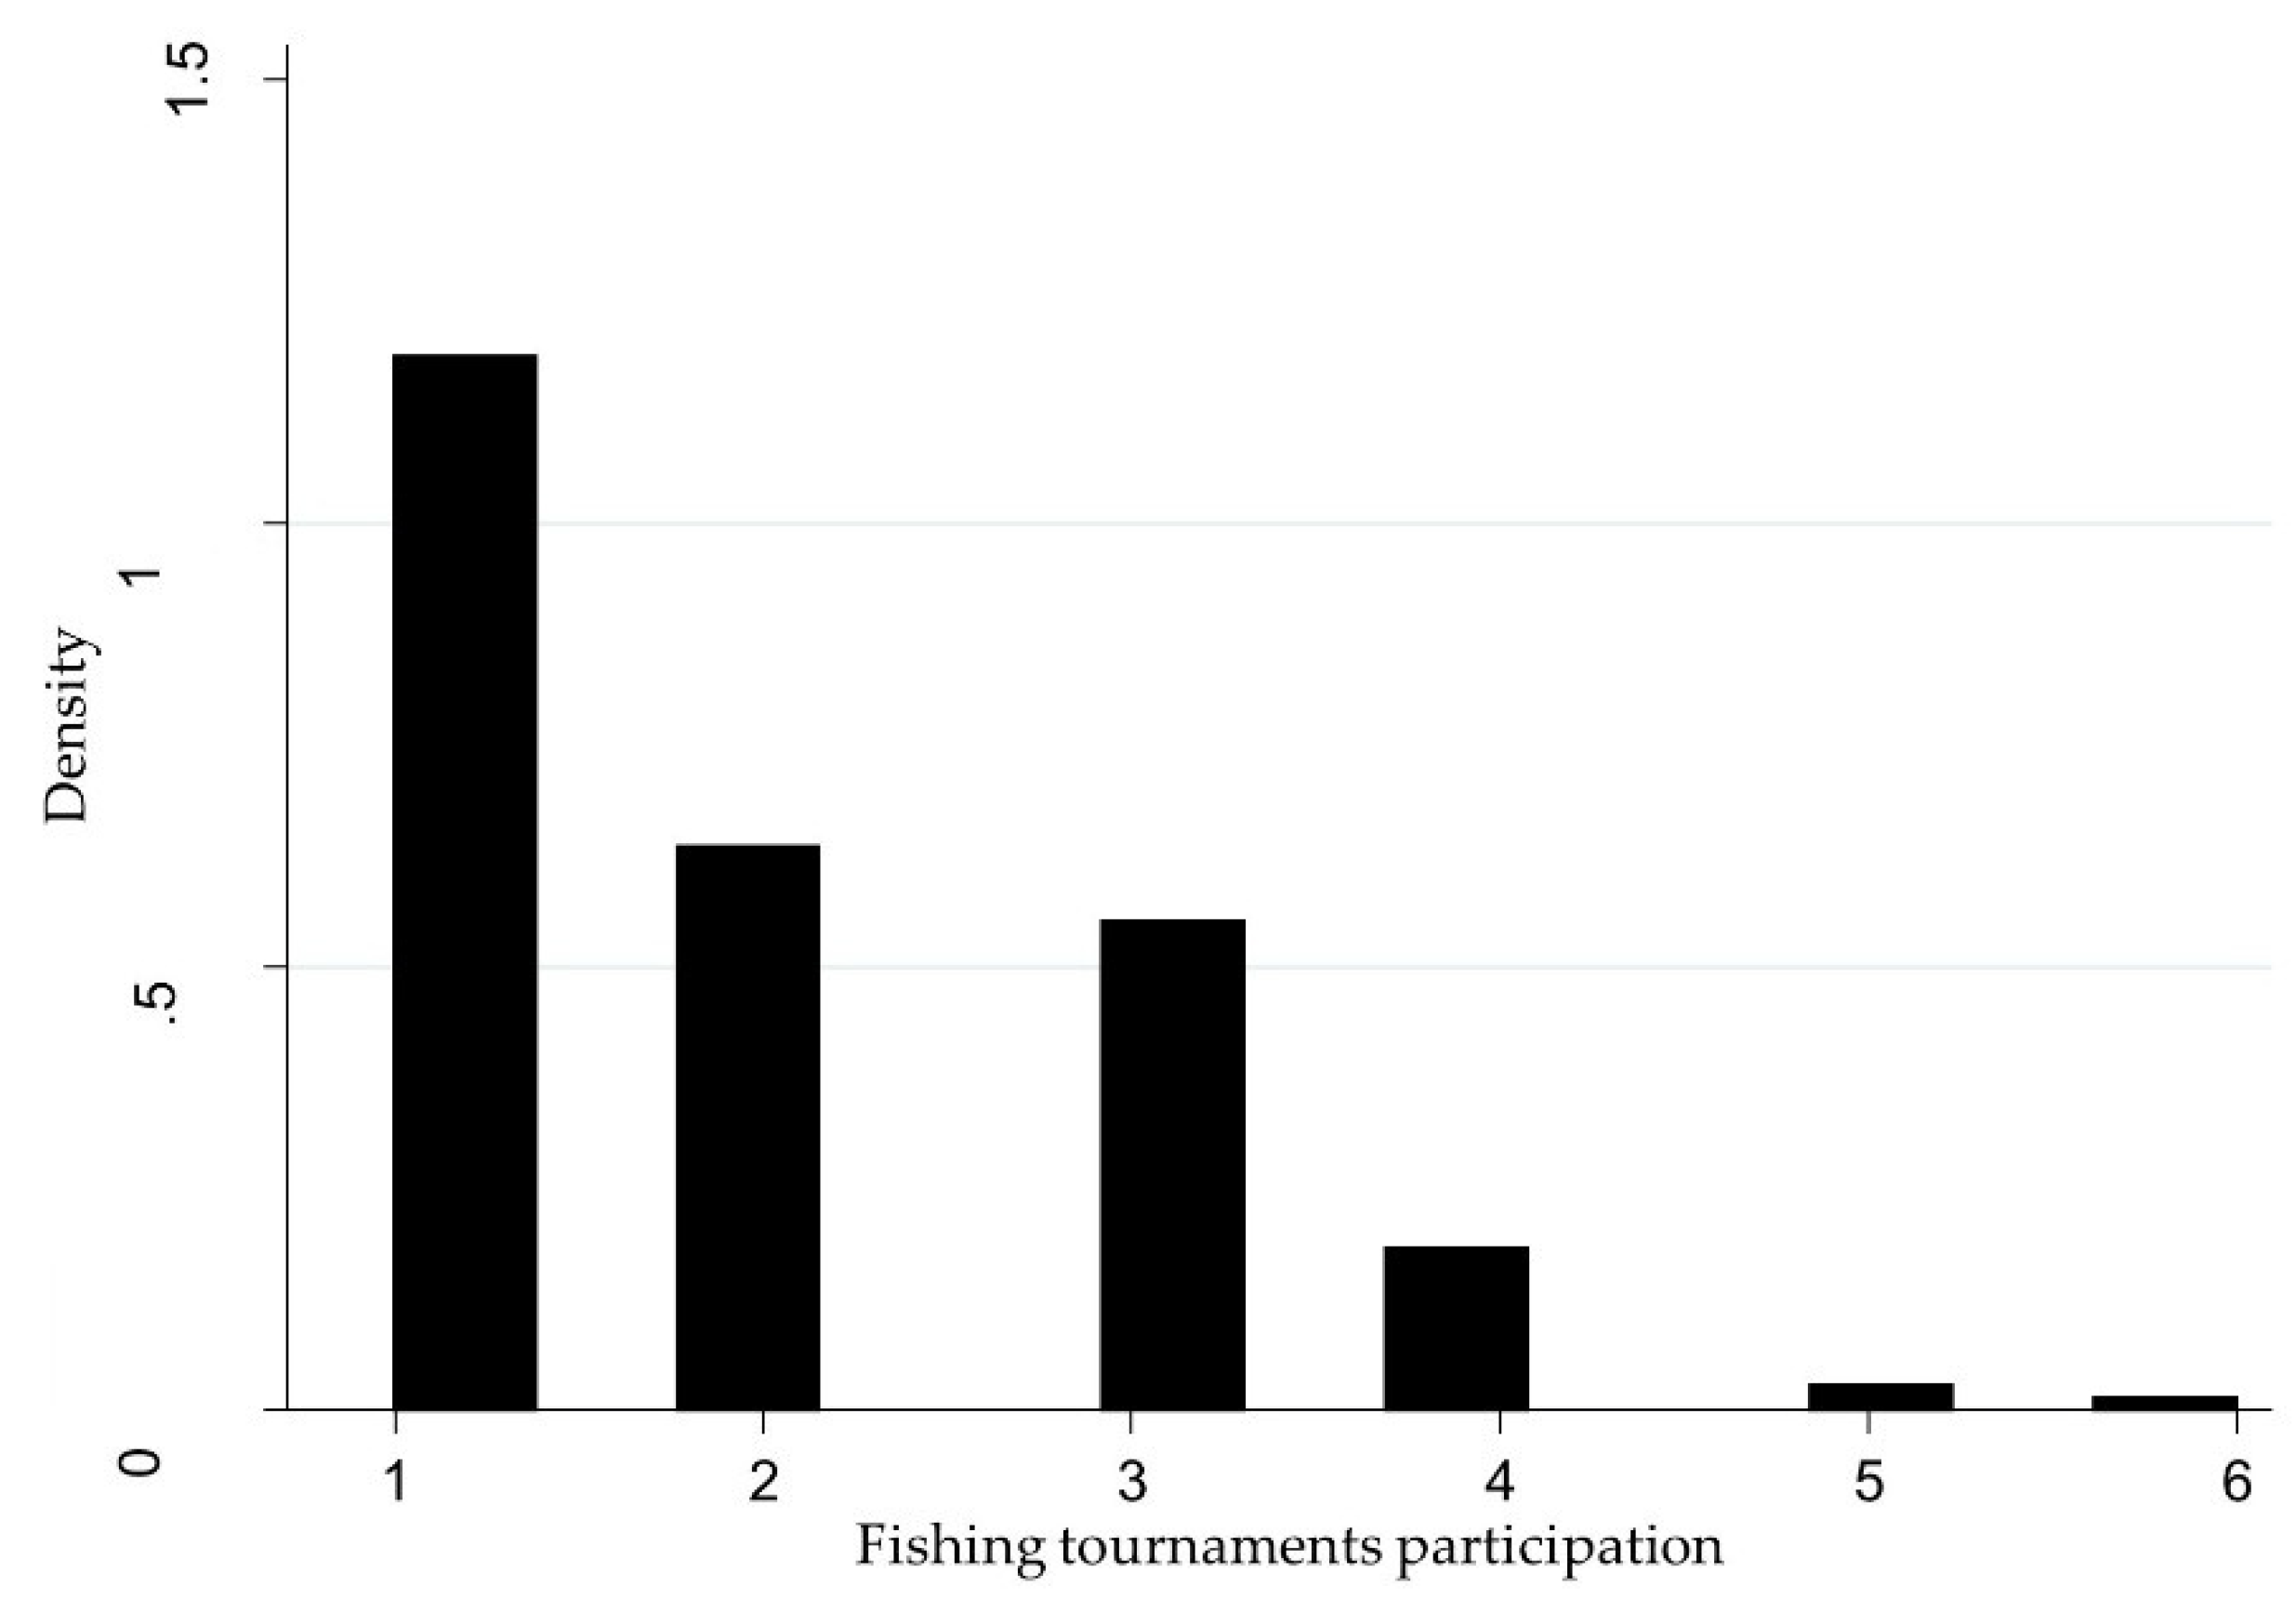
Table 1.
Economic valuation studies of sport and recreational fishing in Mexico.
| Author | Year | Area | WTP (USD) |
Economic Benefit (million USD) |
|---|---|---|---|---|
| Ditton et al. | 1996 | Los Cabos | 547 | 15.50 |
| Hernández Trejo et al. | 2009 | Loreto | 752 | 10.40 |
| Gómez et al. | 2011 | Los Cabos | 517 | 72.00 |
| Hernández Trejo et al. | 2012 | Los Cabos | 22.7-70.55 | 2.10-6.65 |
| Meza Cuellar | 2017 | Los Barriles-Buenavista | 500 | 3.00 |
| Hernández Trejo et al. | 2017 | Los Cabos | 41.6 USD/day (license) |
3.00 |
| Almendarez Hernández et al. | 2020 | Isla Cerralvo | 1,886 | 54.40 |
| Von Borstel Juárez | 2020 | Los Cabos | 82.00 | |
| Source: Author’s self-elaboration. | ||||
Table 2.
Variables used in the estimated models for sport fishing participation in La Paz Bay.
| Variable | Description |
|---|---|
| sftp | Number of sport fishing tournaments in which the interviewee participated in the year 2024 (sftp>0). |
| cost | The total cost of a fishing trip for participating in the sport fishing tournament (in natural logarithm). |
| amateur | 1: If the anglers classified their expertise as amateur, 0: other. |
| nocatch | 1: If the angler got skunked during the fishing tournament, 0: Other. |
| income | Angler’s monthly income in USD (in natural logarithm). |
| boat | 1: If the angler owns a fishing boat, 0: Other. |
| years | Reciprocal of the number of years the anglers have participated in fishing tournaments. |
| age | Angler’s age (in natural logarithm). |
| gender | 1: Male, 0: Other. |
| usa | 1: If angler’s precedence is from the United States of America, 0: Other. |
| motive | Angler’s fishing declared motivation. 1: Winning the tournament, 2: Winning a prize, 3: Fighting the prey, 4: Spending time with family and/or friends, 5: Just participating in the tournament, 6: Practicing a sport, 7: Other. |
| gear | 1: If the angler owns fishing gear, 0: Other. |
| education | 1: Middle school, 2: High school, 3: College, 4: Postgraduate. |
| permit | License type. 1: Day, 2: Week, 3: Month, 4: Year |
Table 3.
Estimated models. Dependent: sftp.
| Variables | Model 1 | Model 2 | Model 3 | ||||
| n=184 | n=184 | n=184 | |||||
| Coef. | P>z | Coef. | P>z | Coef. | P>z | ||
| _const | 9.21 | 0.000 | 10.58 | 0.000 | 9.16 | 0.000 | |
| cost | -1.39 | 0.000 | -1.16 | 0.000 | -1.13 | 0.000 | |
| amateur | ---- | ---- | -1.31 | 0.000 | -0.98 | 0.000 | |
| nocatch | ---- | ---- | -13.36 | 0.000 | -12.64 | 0.000 | |
| income | ---- | ---- | -0.10 | 0.004 | -0.07 | 0.031 | |
| boat | ---- | ---- | 0.72 | 0.000 | 0.50 | 0.000 | |
| years | ---- | ---- | -0.47 | 0.000 | -0.29 | 0.000 | |
| age | ---- | ---- | -0.56 | 0.000 | -0.33 | 0.000 | |
| gender | ---- | ---- | ---- | ---- | 0.30 | 0.083 | |
| usa | ---- | ---- | ---- | ---- | 0.09 | 0.466 | |
| motive | ---- | ---- | ---- | ---- | -0.04 | 0.002 | |
| gear | ---- | ---- | ---- | ---- | -0.14 | 0.287 | |
| education | ---- | ---- | ---- | ---- | -0.06 | 0.027 | |
| permit | ---- | ---- | ---- | ---- | 0.04 | 0.578 | |
| Pseudo R2 | 0.28 | 0.33 | 0.29 | ||||
| Pseudo LL | -629.18 | -498.13 | -550.50 | ||||
| AIC | 1,262.37 | 1,012.28 | 1,045.50 | ||||
| BIC | 1,271.36 | 1,046.98 | 1,106.77 | ||||
|
Source: Author’s self-elaboration LL: Log-likelihood |
|||||||
Table 4.
Elasticity, WTP, and REV for fishing tournaments in La Paz Bay (USD).
| Concept | Model 1 | Model 2 | Model 3 |
|---|---|---|---|
| Elasticity | -0.71 | -0.59 | -0.58 |
| WTP | 505.96 | 608.63 | 625.63 |
| REV | 0.89 | 1.08 | 1.11 |
|
Source
: Author’s self-elaboration.#break#
REV: Million USD | |||
Disclaimer/Publisher’s Note: The statements, opinions and data contained in all publications are solely those of the individual author(s) and contributor(s) and not of MDPI and/or the editor(s). MDPI and/or the editor(s) disclaim responsibility for any injury to people or property resulting from any ideas, methods, instructions or products referred to in the content. |
© 2026 by the authors. Licensee MDPI, Basel, Switzerland. This article is an open access article distributed under the terms and conditions of the Creative Commons Attribution (CC BY) license (http://creativecommons.org/licenses/by/4.0/).
Copyright: This open access article is published under a Creative Commons CC BY 4.0 license, which permit the free download, distribution, and reuse, provided that the author and preprint are cited in any reuse.


