

Submitted:
13 June 2026
Posted:
15 June 2026
You are already at the latest version
Abstract
Artificial intelligence weather models achieve forecast skill comparable to numerical weather prediction at far lower computational cost, yet their reliability for high-impact extremes remains largely uncharacterized. We evaluate Aurora, a state-of-the-art deterministic AI model, using an event-based framework spanning tropical cyclones, freezes, heatwaves, atmospheric rivers, and extreme precipitation at lead times from 1 to 21 days. Aurora demonstrates strong short-range (1–7 day) skill: mean tropical cyclone track errors of 20–60 km at 1–3 day leads, high spatial agreement for temperature extremes (IoU ≥ 0.78), and accurate atmospheric river structure reproduction. Beyond 7–10 days, amplitude collapses as surface fields regress toward climatology, consistent with theoretical Lorenz predictability limits, while large-scale circulation patterns remain moderately skillful (pattern correlations 0.57–0.85 at 14–21 days for temperature extremes). This pattern–amplitude divergence, where synoptic-scale structure persists but threshold-based extremes collapse, is the central finding; event-specific failures include catastrophic TC recurvature errors, systematic intensity underestimation, and pronounced in-sample versus out-of-sample precipitation skill degradation. Aurora provides reliable deterministic guidance within 7–10 days, positioning it as a computational anchor for hybrid probabilistic forecasting systems rather than a standalone operational replacement.
Keywords:
AI weather forecasting
; extreme weather predictability
; Aurora
; tropical cyclones
; temperature extremes
; atmospheric rivers
; extreme precipitation
; subseasonal forecasting
1. Introduction
Over the past three years, there has been a blossoming of deep learning-based foundation models for weather forecasting, emerging as a powerful complement to traditional numerical weather prediction (NWP) systems. Pangu-Weather [1] and GraphCast [2] demonstrated that data-driven models trained on historical reanalysis can rival state-of-the-art NWP for medium-range global forecasting. Since then, the field has expanded further with GenCast [3], AIFS [4], and Aurora [5]. These models differ in architecture (e.g., graph neural networks, transformers, diffusion models), training datasets, forecast horizons, and computational design (Supporting Information S1), but signal a trend toward data-centric approaches for operational forecasting.
Traditional NWP systems remain grounded in the physical laws governing atmospheric dynamics and thermodynamics. Operational models such as the European Centre for Medium-Range Weather Forecasts (ECMWF) Integrated Forecasting System (IFS), the National Centers for Environmental Prediction (NCEP) Global Forecast System (GFS), and regional models including the Weather Research and Forecasting (WRF) Model continue to form the backbone of global and regional weather prediction. Their strengths and limitations have been extensively benchmarked against emerging AI forecast models, which show that while NWP remains the operational standard, challenges persist in predicting the timing, intensity, and spatial structure of certain high-impact weather phenomena [6,7,8].
The computational advantages of AI weather models are substantial. Pangu-Weather achieved 11% improvement over IFS at 5-day Z500 forecasts while running >10,000× faster on a single GPU [1]. GraphCast outperformed IFS-HRES on 90% of 1,380 targets with sub-minute 10-day forecasts [2]. GenCast, the first probabilistic AI ensemble, surpassed IFS-ENS on 97.2% of targets, generating a 15-day 50-member ensemble in ∼8 minutes [3]. This speed advantage enables rapid ensemble generation, real-time scenario testing, and integration into operational workflows at a fraction of traditional supercomputing costs.
Despite these computational gains, fundamental questions remain about AI model predictability horizons for high-impact extremes. Published error growth rates for AI models are less characterized than for NWP ensembles, where ensemble spread saturation occurs around 8–10 days for deterministic large-scale features [9,10], tied to the atmospheric Lyapunov time of approximately 2–3 days for midlatitude synoptic systems [11,12].
Aurora represents the current state-of-the-art deterministic AI weather model. At 0.25° resolution, Aurora outperforms IFS-HRES and GraphCast on >91% of verification targets; at 0.1° fine-tuned resolution, it exceeds operational IFS on 92% of targets [5]. Aurora is also the first AI model to surpass all operational tropical cyclone (TC) forecast systems at 1–5 day leads, outperforming the National Hurricane Center by 6% at 1 day and 20–25% at 2–5 days in the North Atlantic [5]. Aurora’s transformer architecture (1.3 billion parameters) is trained on ERA5, IFS high-resolution forecasts, wave analyses, and climate simulations comprising over one million hours of Earth system data [5,13]. Unlike direct-forecast architectures, Aurora uses autoregressive rollout: each 6-hour step initializes the next rather than re-anchoring to observations, enabling arbitrary lead times but compounding errors across up to 84 steps at 21-day leads, a key mechanism we examine.
Multi-model comparisons confirm Aurora’s leading performance for synoptic-scale fields (e.g., 500-hPa geopotential height, 850-hPa temperature); performance for precipitation and extreme intensities is systematically weaker across all AI models. Evaluating four AI models across 50 tropical cyclones, Sahu et al. [14] found all achieved mean 96-hour track errors <200 km, consistently outperforming GFS and IFS, with Aurora showing the strongest TC dynamics representation. However, systematic limitations emerge for extreme intensities: AI models underestimate TC peak winds and central pressure relative to observations, likely due to smoothed extremes in ERA5 training data [14,15]. For precipitation, Gupta et al. [16] found AI model errors against observations were 15–45% larger than against reanalysis for South Asian monsoon forecasts, indicating standard reanalysis-centric benchmarks may overstate operational skill.
These findings motivate event-based validation focused on high-impact extremes. Existing Aurora evaluations rely on aggregate global metrics (e.g., domain-mean RMSE across all grid points and timesteps) or single-category assessments (e.g., TC-only studies). Such approaches obscure event-specific failure modes and provide limited insight into operational reliability for societally consequential extremes. Aggregate metrics weight common synoptic patterns heavily while providing minimal information about rare, high-amplitude events that drive societal impacts and emergency response decisions.
Furthermore, different extreme weather types present fundamentally distinct predictability challenges. Tropical cyclones require accurate steering flow and diabatic heating representation. Temperature extremes depend on blocking persistence and surface-atmosphere coupling. Atmospheric rivers involve moisture transport and orographic precipitation. Extreme precipitation reflects convective organization and mesoscale dynamics. These phenomena span scales from mesoscale (<100 km) convection to planetary wave patterns (>1000 km) and timescales from hours (flash floods) to weeks (blocking duration). Event-based evaluation enables targeted diagnosis of failure modes (does Aurora struggle with TC intensity but not tracks? Are blocking onset and recovery equally skillful? Does precipitation skill vary by convective regime?), essential for operational deployment decisions.
Subseasonal prediction (14–21 day leads) carries particular operational significance for emergency management, agricultural planning, water management, and energy sector preparations. Traditional NWP ensemble skill degrades substantially beyond 10 days, with operational subseasonal forecasts providing primarily regime-scale information rather than deterministic event guidance. Whether AI models extend skillful prediction to 14–21 days or encounter analogous limits is a central open question that determines future development priorities and operational deployment strategies.
We evaluate Aurora across 16 high-impact events spanning tropical cyclones, freezes, heatwaves, atmospheric rivers, and extreme precipitation. Events were selected for documented societal consequences, meteorological intensity, and representation of distinct dynamical regimes. The inventory includes both in-sample and out-of-sample cases relative to Aurora’s ERA5 training period (Section 2.1), testing temporal generalization. Forecast skill is evaluated at lead times from 1 to 21 days, spanning short-range deterministic guidance (1–3 days), medium-range prediction (5–7 days), and subseasonal outlooks (14–21 days). The remainder of this paper is organized as follows: Section 2 describes methods and data; Section 3 presents results; Section 4 discusses implications, mechanisms, and future directions; Section 5 summarizes conclusions.
2. Materials and Methods
2.1. Event Selection
We select 16 high-impact extreme weather cases spanning distinct geographic regions and dynamical mechanisms. The framework prioritizes physical interpretability and forecast evolution diagnostics over sample size maximization, contrasting with aggregate global verification that weights common synoptic patterns heavily while obscuring rare, high-amplitude events.
Events were selected according to four criteria: documented societal impact (fatalities, economic losses, or infrastructure disruption), meteorological intensity (record-breaking or multi-standard-deviation extremes), ERA5 data availability at required temporal resolution, and representation of distinct dynamical regimes (tropical convection, midlatitude blocking, baroclinic systems, orographic precipitation). The inventory includes both in-sample (pre-2020) and out-of-sample (post-2020) cases relative to Aurora’s ERA5 training period (1979–2020), enabling assessment of temporal generalization (Table 1).
Prior to model evaluation, ERA5 fields were verified to accurately represent event timing and magnitude through comparison with observational data (Section 2.4). All event onset, peak, and recovery times are defined from ERA5 following this verification step, ensuring consistency between forecast initialization and verification reference.
Subseasonal lead times (14 and 21 days) are evaluated exclusively for temperature extremes (freeze and heatwave events), whose slow-evolving large-scale forcing is compatible with extended-range assessment. Tropical cyclone, atmospheric river, and precipitation events are evaluated at 1–7 day leads only, consistent with their shorter predictability windows and rapidly evolving dynamics.
A two-stage framework (Figure 1) is applied uniformly across event categories, enabling structured cross-event comparison. Stage 1 evaluates lead-time dependence by varying initialization dates while targeting a fixed critical phase (e.g., landfall for tropical cyclones; onset or peak for temperature extremes and atmospheric rivers). Stage 2 examines either sub-daily initialization sensitivity (for rapidly evolving tropical cyclones) or extended spatial and physical diagnostics (for slower-evolving events).
2.2. Aurora Model Configuration
We use the Aurora 0.25° pretrained model [5] without fine-tuning or event-specific adaptation. The model operates on a 721 × 1440 global grid at 6-hour intervals (00, 06, 12, 18 UTC) using rollout-based autoregressive prediction. This 0.25° resolution (approximately 28 km at the equator) matches ECMWF IFS-HRES operational resolution and enables representation of synoptic-scale circulation, frontal systems, and large-scale convective organization, but does not resolve mesoscale features below ∼100 km.
Forecasts are initialized from ERA5 atmospheric states. In-sample/out-of-sample classification follows the definitions in Section 2.1 (Supporting Information S2). Aurora is treated as a fixed forecasting system throughout; no event-specific tuning, bias correction, or retraining is performed.
Model inputs include surface variables (2-m temperature, 10-m zonal and meridional winds, mean sea level pressure), atmospheric fields at 13 pressure levels spanning 50–1000 hPa (temperature, horizontal winds, specific humidity, geopotential height), and time-invariant surface fields (land-sea mask, soil type, and surface geopotential representing terrain elevation/orography). Prognostic outputs include the full 3D atmospheric state at each 6-hour step, from which event-specific diagnostics (storm center location, threshold exceedance, integrated vapor transport) are derived using standard meteorological algorithms.
2.3. Experimental Design by Event Type
Tropical Cyclones. Four cases spanning three ocean basins sample distinct steering regimes and intensification environments: Hurricane Sandy (2012, extratropical transition), Cyclone Amphan (2020, rapid intensification), Hurricane Ian (2022, Loop Current intensification), and Typhoon Hinnamnor (2022, recurvature and midlatitude interaction) [17,18,19,20]. Stage 1 initializes forecasts at 1-, 3-, 5-, and 7-day leads prior to landfall. Stage 2 tests sub-daily (00, 06, 12, 18 UTC) initialization sensitivity.
Storm centers are identified from local MSLP minima in Aurora output using an automated tracking algorithm and compared against IBTrACS best-track positions [21,22]. Verification metrics include track error (great-circle distance at each 6-hour step), landfall position error, and intensity biases (MSLP in hPa, maximum 10-m wind speed in m/s).
Temperature Extremes. Two freeze events (Beast from the East 2018, driven by Ural blocking and polar vortex displacement [23]; Texas 2021, associated with a weakened stratospheric polar vortex [24]) and two heatwaves (British Columbia 2021, persistent blocking ridge [25]; Southwest Europe 2023, amplified subtropical ridge [26]) enable comparison across opposite extremes under analogous large-scale forcing.
Stage 1 tests 1-, 7-, 14-, and 21-day leads targeting event onset, peak intensity, and recovery phases. Stage 2 characterizes spatial extent, intensity evolution, and governing synoptic patterns including Z500 blocking identification and T850 air-mass tracking.
Primary metrics are T2m RMSE, pattern correlation, spatial extent (fraction of domain exceeding threshold), and Intersection over Union (IoU) for threshold exceedance at operationally relevant levels (0°C, −5°C, −10°C for freezes; 30°C, 35°C, 40°C for heatwaves).
Atmospheric Rivers. Three high-impact AR events (Iran March 2019, affecting >25 provinces [27]; California December 2022 and 2023, leading to widespread flooding [28]) test predictability of moisture transport structure and landfall characteristics. ARs are characterized through spatial integrated vapor transport (IVT) fields. Stage 1 initializes at 1-, 3-, 5-, and 7-day leads prior to peak IVT at landfall. Metrics include IVT RMSE, bias, and pattern correlation over synoptic and regional domains.
Extreme Precipitation. Five flood events spanning monsoon (Pakistan 2010, Sudan 2020), extratropical cutoff (Western Europe 2021), mesoscale convective (Appalachian 2022), and hybrid monsoon-cutoff (Arizona 2025) regimes test decoder-based precipitation prediction across distinct mechanisms [29,30,31,32,33].
Precipitation is not a native Aurora output variable. We use an auxiliary precipitation decoder [34] that maps Aurora’s latent atmospheric representation to 6-hourly precipitation without modifying the pretrained Aurora weights. This decoder was trained on MSWEP V3 [35]; accordingly, all precipitation verification is performed against MSWEP (except Arizona 2025, where MSWEP data were unavailable for this near-real-time event and ERA5 is used instead; see Section 3.1.5), and skill metrics reflect consistency with the decoder’s training target rather than fully independent observational validation. Extended decoder details are in Supporting Information S3.
Stage 1 tests 1-, 3-, 5-, and 7-day leads targeting the 6-hour accumulation period with highest regional totals. Metrics include precipitation RMSE, pattern correlation, and IoU at 1 mm/6h threshold.
2.4. Forecast Verification and Computational Implementation
Forecast accuracy is quantified against ERA5 reanalysis using RMSE, pattern correlation, and threshold-based metrics computed at event peak times over regional domains. We use ERA5 as the verification reference because: (1) ERA5 assimilates the same observational data streams as operational forecast centers, providing a consistent global baseline [36]; (2) all forecasts are ERA5-initialized, isolating Aurora’s predictive skill degradation with lead time; and (3) Aurora was pretrained on ERA5 (1979–2020), making it the consistent reference for both in-sample and out-of-sample assessment.
Field Metrics. RMSE quantifies overall gridded field accuracy; mean bias measures directional over- or underprediction; pattern correlation (Pearson correlation over all grid points) assesses spatial structure independent of amplitude. Complete metric definitions are in Supporting Information S4.
Threshold Metrics. Spatial extent is the fraction of grid points exceeding the hazard threshold. IoU measures overlap between forecast and observed extreme regions (0 = no overlap; 1 = perfect agreement), requiring both correct location and areal extent simultaneously.
Metric Interpretation. Pattern correlation can remain moderately high even when IoU collapses, a systematic divergence we observe at subseasonal leads (Section 3.2). High pattern correlation without threshold skill provides limited actionable information for impact-based warnings, which require probabilistic threshold exceedance estimates.
Event-Specific Metrics. TC track errors are great-circle distances between Aurora-predicted and IBTrACS storm centers at each 6-hour timestep. Landfall position errors measure distance between forecast and observed landfall locations. Intensity errors quantify biases in storm-center MSLP and maximum 10-m wind speed. For ARs, IVT magnitude RMSE and spatial displacement metrics are computed.
Baseline Event Verification. Prior to forecast evaluation, ERA5 was confirmed to accurately represent each event. For TCs, IBTrACS best-track positions were overlaid on ERA5 MSLP fields to verify storm centers match within 50 km. For temperature extremes, ERA5 T2m was compared against surface station observations. For ARs, ERA5-derived IVT was verified against satellite-based estimates.
Operational Forecast Comparison Scope. Direct comparison against archived IFS or GFS operational forecasts for all 16 events was not undertaken; uniform archival access was unavailable for the full event inventory, and running IFS/GFS from scratch exceeded available computational resources. Where published operational verification statistics exist for specific events, we provide contextualized comparisons in Section 4.1.
Computational Implementation. All forecasts were generated on a single NVIDIA A100 GPU (80 GB memory). Complete run-time statistics are reported in Section 3.5.
3. Results
3.1. Short-Range Skill (1–7 Days): Cross-Event Summary
Aurora demonstrates strong short-range forecast skill across all extreme event types at 1–7 day leads. Skill levels and degradation rates differ consistently by event type, as summarized below.
3.1.1. Tropical Cyclone Track and Landfall
As a baseline, ERA5 storm centers deviate from IBTrACS best-track positions by approximately 20–50 km for these events, reflecting the smoothing inherent in reanalysis; Aurora track errors are assessed against IBTrACS in this context. For well-behaved tropical cyclones following relatively steady tracks, Aurora achieves mean track errors of 20–60 km at 1–3 day leads (Figure 2). Hurricane Sandy (2012) shows 21.5 km error at 1-day lead and 33.8 km at 3-day lead. Hurricane Ian (2022) demonstrates 22.4 km at 1-day and 5.6 km at 3-day leads; the unusually low 3-day error reflects the high predictability of Ian’s straight-track segment across the Gulf of Mexico before final intensification and landfall rather than exceptional model performance. Cyclone Amphan (2020) exhibits 56.7 km at 1-day and 42.2 km at 3-day leads. Landfall position errors for these three systems range from 0–60 km at 1–3 day leads; by 5–7 day leads, track errors grow to 20–70 km.
Typhoon Hinnamnor (2022) represents a catastrophic failure mode. The automated center tracker failed at 1-day lead due to coastal topography proximity; at 3-day lead, landfall position error reaches 1,690 km, growing to 1,845–1,925 km at 5–7 days.
3.1.2. Tropical Cyclone Intensity
Aurora persistently underestimates TC intensity across all cases and lead times. Central pressure biases relative to ERA5 range from +2 to +9 hPa at 1–3 day leads; 10-m wind speed biases relative to ERA5 range from −8 to +6 m/s. Hurricane Ian shows MSLP bias of +2.3 hPa and wind bias of −4.0 m/s at 1-day lead; Sandy exhibits +3.6 hPa and −1.7 m/s biases. These biases are assessed relative to ERA5; because ERA5 itself smooths convective-scale TC structure and underestimates peak intensities relative to IBTrACS observations [14,15], real Aurora biases against direct observations would be correspondingly larger. Track skill and intensity skill are uncoupled: landfall positions are accurate for Ian and Sandy while storm strength is consistently underestimated.
Aurora’s short-range track errors fall within published National Hurricane Center (NHC) verification ranges for Atlantic basin TCs during 2020–2023 (30–40 km at 24 h; 60–80 km at 48 h) [37] for well-behaved systems (Sandy, Ian, Amphan). The catastrophic Hinnamnor failure (>1,600 km landfall error) and persistent intensity underestimation indicate Aurora does not uniformly match operational dynamical-statistical consensus, particularly for recurving storms and intensity prediction.
3.1.3. Temperature Extremes: High Spatial Agreement
Temperature extremes demonstrate Aurora’s strongest short-range spatial skill. At 1-day lead, freeze and heatwave events achieve IoU values of 0.78–0.98; pattern correlations exceed 0.90 for all cases. For the Texas 2021 freeze, 1-day IoU reaches 0.95 with pattern correlation 0.976 (Figure 3). For the Beast from the East 2018, 1-day IoU is 0.98 and pattern correlation is 0.994. Heatwave events show comparable spatial skill: British Columbia 2021 achieves 1-day IoU of 0.94 and pattern correlation of 0.942; Southwest Europe 2023 reaches IoU of 0.78 and pattern correlation of 0.950.
Aurora shows consistent intensity underestimation at 1-day lead relative to ERA5: heatwave events exhibit cold biases of 2–3°C at peak phase (e.g., Southwest Europe 2023: −2.20°C bias relative to ERA5 peak, i.e., Aurora forecasts temperatures 2.20°C too low; Figure 4), while freeze events show analogous warm biases of similar magnitude (Aurora forecasts temperatures too high relative to ERA5 cold anomalies). By 7-day lead, IoU values decline to 0.62–0.86 and pattern correlations to 0.86–0.97 (all metrics vs. ERA5).
3.1.4. Atmospheric Rivers: Structure Preservation
For AR events, forecasts at 1–3 day leads accurately reproduce IVT plume structure relative to ERA5 (full skill progression in Supporting Information S6). For California December 2023, Aurora maintains coupled dynamical structure more effectively than the six models evaluated by Zhang et al. [38]: while those models exhibit rapid degradation of cyclonic circulation and IVT underestimation beyond 5-day leads, Aurora retains coherent geopotential height structure with errors arising primarily from phase shifts rather than mechanism collapse (Figure 5; Supporting Information S6). Operational subseasonal AR forecasts exhibit similar behavior: experimental forecasts for the December 2022–23 California sequence skillfully captured regime shifts at 2–3 week leads but consistently underpredicted precipitation magnitude [39], paralleling Aurora’s pattern–amplitude divergence at extended leads.
3.1.5. Extreme Precipitation: In-Sample vs. Out-of-Sample Contrast
Precipitation forecasts exhibit pronounced in-sample versus out-of-sample performance divergence. Because the precipitation decoder was trained on MSWEP V3 (Section 2.3), all skill metrics here reflect decoder consistency with its training target rather than independent observational accuracy.
In-sample monsoon events (Pakistan 2010, Sudan 2020) achieve 1-day pattern correlations of 0.54–0.56 (vs. MSWEP); IoU at the 1 mm/6h threshold is 0.69 for Pakistan and 0.25 for Sudan, reflecting the spatial extent of organized monsoon precipitation in each case. Out-of-sample events show substantially degraded skill: Western Europe 2021 achieves 1-day pattern correlation of 0.39 and IoU of 0.32; Appalachian 2022 (quasi-stationary mesoscale convective training event) shows pattern correlation of 0.03 and IoU of 0.22; Arizona 2025 shows 1-day pattern correlation of 0.21 and IoU of 0.01 at the 5 mm/6h threshold (IoU = 0.42 at the 1 mm/6h threshold; SI Table S7), with peak accumulations underestimated by approximately 7× (5.2 mm forecast vs. 34.8 mm in ERA5, bias −29.6 mm/6h; Figure 6). Note that Arizona 2025 metrics are verified against ERA5 rather than MSWEP because real-time MSWEP data were unavailable for this 2025 event. The Arizona 2025 event represents a rare monsoon-cutoff low interaction producing unprecedented regional totals (an extreme outlier in Aurora’s training distribution), and the intensity underestimation reflects both the out-of-sample dynamical regime and Aurora’s inability to resolve mesoscale orographic convection at 0.25° resolution.
Poor skill for convectively driven events is not unique to Aurora; IFS and GFS similarly show their largest forecast deficits for convective precipitation, reflecting fundamental resolution and parameterization limits shared across deterministic models e.g., [6]. Operational NWS forecasts at the time of the Appalachian 2022 event also exhibited large errors, contextualizing Aurora’s failure as partly reflecting fundamental atmospheric predictability limits. By 5–7 day leads, in-sample precipitation skill degrades substantially: Pakistan and Sudan pattern correlations decline to 0.26–0.32 with IoU dropping to 0.20–0.28. Out-of-sample events show substantially degraded skill beyond 3-day leads, with pattern correlations declining to 0.02–0.16 by day 7 (Supporting Information S7).
3.2. Extended-Range Skill Degradation: Pattern–Amplitude Divergence
We define pattern–amplitude divergence as the systematic persistence of large-scale circulation skill alongside threshold-based amplitude collapse. This divergence emerges clearly at subseasonal leads for temperature extremes and at 5–7 day leads for ARs and precipitation, consistent with their shorter predictability windows. All skill metrics in this section are assessed against ERA5 for temperature extremes and ARs, and against MSWEP for precipitation.
At subseasonal lead times (14–21 days), Aurora maintains moderate skill in reproducing large-scale atmospheric circulation patterns but loses surface temperature amplitude prediction (Figure 7). Pattern correlations decline gradually from ∼0.95 at 1-day to 0.57–0.85 at 14–21 days (vs. ERA5), while IoU collapses sharply from 0.78–0.98 (1–7 days) to <0.04–0.29 (14–21 days).
For the Beast from the East at 14-day lead, pattern correlation remains 0.875, yet spatial extent of sub-zero temperatures collapses to 10.6% versus 68.5% in ERA5 (IoU 0.157), with warm bias +6.88°C relative to ERA5. T2m RMSE (2.82°C) and Intensity Bias (+6.88°C) measure different aspects at different times (see Supporting Information S5 footnote): RMSE is a spatial snapshot across all regional grid points at the fixed calendar peak date, while Intensity Bias compares Aurora’s coldest regional mean achieved at any point during the forecast period against ERA5’s observed seasonal minimum. Aurora never produces a cold event at 14-day lead, so its regional minimum stays near climatology (+4.3°C vs. ERA5’s −2.57°C for Beast from East), yielding a large scalar gap; the RMSE at the calendar peak date can be smaller because Aurora’s mildly warm-biased uniform forecast may have limited spatial variance relative to the strong spatial gradients of the observed extreme. Texas 2021 shows 14-day pattern correlation 0.728, but freezing extent drops to 0.2% (IoU 0.002) despite 78.7% in ERA5, with +11.62°C warm bias relative to ERA5; at 21 days, pattern correlation rebounds to 0.852 but extent remains 3.2% (IoU 0.038) with +7.15°C bias. Operational records indicate multiple winter weather advisories were issued for the Texas 2021 event during the approach phase [40,41], consistent with Aurora’s strong 1–7 day skill and highlighting the subseasonal amplitude collapse as an operationally significant limitation.
Heatwaves exhibit analogous behavior. Southwest Europe 2023 maintains 14-day pattern correlation 0.738 (vs. ERA5), but T > 30°C extent drops to 50.1% (IoU 0.625) from 72.5% in ERA5; by 21 days, extent collapses to 1.3% (IoU 0.018) with pattern correlation 0.793. British Columbia shows 14-day IoU 0.024 with pattern correlation 0.800 and −10.63°C cold bias relative to ERA5. ECMWF extended-range ensemble forecasts for the August 2023 event crossed the 99th percentile approximately six days before the 22–24 August core period [26], aligning with Aurora’s 1–7 day skill window while highlighting shared subseasonal amplitude collapse.
Z500 and MSLP fields at 14–21 days show that blocking ridge positions and circulation anomalies remain broadly consistent with ERA5 even as T2m and T850 extremes weaken substantially. For Beast from East, Aurora reproduces the Scandinavian blocking ridge (Z500 anomalies >150 m) and southward jet displacement; for Texas, Aurora captures the anomalous ridge and southward-displaced polar jet, but surface temperatures fail to drop below freezing despite favorable dynamical configuration.
ARs and precipitation show the same pattern–amplitude divergence at shorter leads (5–7 days rather than 14–21 days), consistent with their briefer predictability windows. AR IVT spatial structure remains recognizable at 5–7 days (pattern correlation 0.74–0.84 vs. ERA5) but intensity is underestimated by >60% (California IVT bias −314.9 kg m−1 s−1 relative to ERA5). Pakistan monsoon floods show 7-day pattern correlation 0.26 (vs. MSWEP) with dry-biased, spatially overextended precipitation.
This pattern–amplitude divergence is the study’s central finding, occurring independently of event type or predictability timescale.
3.3. Event-Specific Failure Modes
3.3.1. Tropical Cyclone Recurvature: The Hinnamnor Catastrophe
Evaluated at 3-, 5-, and 7-day leads (the 1-day automated tracker failed near the coast), Aurora consistently predicts Hinnamnor continuing westward toward southern China rather than recurving northeastward toward South Korea and Japan. Landfall position errors reach 1,690–1,925 km at 3–7 day leads; mean track errors of 132–171 km during ocean phases confirm the failure stems from incorrect recurvature timing rather than complete track loss.
This catastrophic error stems from failed representation of midlatitude trough-subtropical ridge interaction. Hinnamnor’s observed recurvature resulted from phasing between a westward-propagating subtropical high and an eastward-moving midlatitude trough. Aurora maintains the subtropical ridge as continuous, trapping the storm on a westward track.
3.3.2. Convective Precipitation: Resolution and Physical Process Limits
The Appalachian July 2022 flood exemplifies Aurora’s failure for convectively driven precipitation. At 1-day lead, pattern correlation is 0.03 despite accurate synoptic-scale moisture and instability representation. Aurora forecasts widespread light-to-moderate precipitation across the broader Ohio Valley region, whereas MSWEP shows intense, localized accumulations concentrated in the Kentucky River headwaters (Supporting Information S8). Aurora’s 0.25° resolution (∼28 km) cannot resolve mesoscale convective systems (MCS), which organize on scales of 10–50 km; the observed event resulted from quasi-stationary convective cells that repeatedly moved over the same terrain, amplifying orographic precipitation.
In the Arizona 2025 case, the monsoon-cutoff low interaction produced intense orographic precipitation that Aurora underestimates by approximately 7× (see Section 3.1.5) despite capturing the synoptic setup.
3.3.3. Systematic Temperature Extreme Biases
Beyond the universal amplitude collapse at 14–21 days, temperature extremes show systematic directional biases that grow with lead time. Freeze events exhibit warm biases reaching +6 to +11°C at 14–21 days; heatwave events exhibit cold biases of −5 to −11°C. Aurora consistently forecasts weaker extremes in both directions, regressing toward seasonal climatology.
3.4. Initialization Sensitivity
Sub-daily initialization sensitivity tests reveal generally low sensitivity for most events. For Hurricane Ian and Sandy, track errors vary by <20 km across 00, 06, 12, 18 UTC initializations at 3-day lead; landfall timing differences remain within ±6 hours.
Hinnamnor represents an exception: initialization time sensitivity exceeds 100 km standard deviation across the four daily initializations at 3-day lead, reflecting the marginal nature of the recurvature decision.
Precipitation initialization sensitivity is modest for synoptic-scale events (Pakistan, Sudan, Western Europe: <10% variation in regional totals) but significant for convectively driven cases. Appalachian flood forecasts show >30% variation in accumulation placement with 6-hour initialization shifts.
3.5. Computational Performance
All forecasts were generated on a single NVIDIA A100 GPU (80 GB memory) with total wall-clock time of approximately 35 minutes across all experiments. Individual TC forecasts (7-day rollout, ∼28 six-hour steps) complete in ∼30–40 seconds. Temperature extreme forecasts (21-day rollout, ∼84 steps) require 90–120 seconds. Precipitation forecasts with decoder inference add ∼20% overhead but remain under 2 minutes for 7-day forecasts.
4. Discussion
4.1. The 7–10 Day Practical Predictability Horizon
The central finding of this study is not the amplitude collapse at subseasonal leads (theoretically expected from the Lorenz [11] predictability limit, where positive Lyapunov exponents drive error saturation within 1–2 weeks and forecasts revert toward climatological mean states) but rather that Aurora’s large-scale circulation pattern skill (pattern correlations 0.57–0.85) persists beyond the expected error-growth timescale. Aurora skill degrades consistently beyond 7–10 days across all event types (Section 3.1–3.3), reflecting fundamental atmospheric dynamical constraints. Aurora’s autoregressive rollout (Section 1) compounds errors across up to 84 sequential 6-hour steps at 21-day leads; fine-tuning separate decoder heads for specific target lead times is a direct path to reducing this compounding while retaining the backbone’s demonstrated pattern skill. Quantitatively, Aurora’s pattern correlation decays from ∼0.95 at day 1 to 0.57–0.85 by day 14–21, a rate broadly consistent with published error growth curves for deterministic large-scale AI forecasts [1,2], confirming that Aurora’s predictability horizon is governed by the same atmospheric dynamics rather than architecture-specific deficiencies.
This 7–10 day limit matches atmospheric predictability constraints from ensemble NWP and theoretical studies [10,11,42,43]. ECMWF ensemble spread growth saturates around 8–10 days for deterministic large-scale features [9,10,44]. The atmosphere’s Lyapunov time is approximately 2–3 days for midlatitude synoptic systems [12,45]; by 7–10 days, initial uncertainty has amplified by factors of 10–100, reaching magnitudes where nonlinear error saturation and phase decoherence dominate [43]. AI models trained on deterministic targets (ERA5) inherit these limits: they learn flow regime structure that persists through nonlinear error growth but cannot maintain amplitude information lost to chaos [1,2].
Aurora’s performance relative to operational systems varies by event type. For tropical cyclones, short-range track skill falls within published NHC verification ranges (Section 3.1.2), indicating competitive deterministic guidance for well-behaved systems but catastrophic failure for recurving storms. For temperature extremes, direct comparison with GFS operational forecasts for the Texas 2021 freeze (Supporting Information S9) shows comparable 1-day skill but reveals Aurora lags physics-based NWP by approximately 26% at 7-day lead. For the Southwest Europe 2023 heatwave, ECMWF extended-range ensembles crossed the 99th percentile approximately six days before peak [26], aligning with Aurora’s 1–7 day skill window. Atmospheric river forecasts exhibit parallel behavior: Aurora’s coherent IVT structure at 3–5 days mirrors operational subseasonal systems that skillfully capture regime shifts but systematically underpredict magnitude [39]. Overall, Aurora provides competitive short-range guidance but does not yet uniformly surpass operational NWP across all event types and lead times.
4.2. In-Sample vs. Out-of-Sample Performance and Generalization
The precipitation performance contrast between in-sample and out-of-sample events (Section 3.1.5) is partly a temporal generalization effect but is substantially confounded by event-type differences: in-sample cases (Pakistan 2010, Sudan 2020) are large-scale monsoon events, while out-of-sample cases (Appalachian 2022, Arizona 2025) involve mesoscale convective organization and hybrid monsoon-cutoff dynamics that present fundamentally different predictability challenges independent of training period. The measured skill gap (1-day pattern correlation 0.54–0.56 for in-sample versus 0.03–0.39 for out-of-sample; vs. MSWEP except Arizona 2025 which is vs. ERA5) reflects both temporal generalization and process-type generalization conflated together. Disentangling these effects requires additional in-sample convective events, a direction for future work. The temporal generalization conclusion should accordingly be read as preliminary: out-of-sample events underperform, but they are also dynamically distinct phenomena.
Temperature extremes show less pronounced in-sample/out-of-sample differences. The British Columbia 2021 heat dome and Southwest Europe 2023 heatwave (both out-of-sample) achieve 1-day IoU of 0.94 and 0.79, comparable to in-sample freeze events (Beast from East 2018: 0.98; Texas 2021: 0.95). Temperature extremes driven by large-scale blocking are more robustly represented than convectively modulated precipitation, because blocking dynamics are constrained by resolved large-scale flow rather than mesoscale convective organization.
Tropical cyclone performance shows mixed out-of-sample behavior. Ian 2022 and Hinnamnor 2022 (both out-of-sample) produce track errors spanning a wide range, suggesting temporal generalization for TCs depends more on synoptic regime (recurvature vs. straight-moving) than on training period.
Regional fine-tuning on observational precipitation data may improve convective precipitation skill regardless of whether the primary limitation is temporal generalization or process-type generalization. The robust temperature extreme performance for out-of-sample events suggests pretrained foundation models generalize well for large-scale thermodynamic extremes, provided subseasonal amplitude collapse is accounted for through calibration or ensemble post-processing.
4.3. Physical Mechanisms of Observed Failure Modes
The failure patterns across event types (Section 3.2, 3.3) reflect both atmospheric predictability limits and AI model training characteristics.
Pattern–amplitude divergence. The subseasonal failure mode (Section 3.2) arises from MSE loss function properties. MSE minimization yields the conditional mean prediction; when forecast uncertainty grows large (beyond 7–10 days), the conditional mean reverts toward the training climatology, particularly for rare extremes that are underrepresented in the training distribution. Aurora therefore maintains moderately skillful pattern structure (which reflects the dominant synoptic regime) but loses amplitude information (which requires accurate prediction of the low-probability tail). This regression toward training-set climatology is mathematically expected under MSE with high uncertainty.
Intensity underestimation. Systematic TC intensity and temperature amplitude biases (Section 3.1.2, 3.1.3) likely reflect ERA5 training data characteristics. Reanalysis smooths convective-scale features and peak intensities relative to observations [14,15]; training on these smoothed targets teaches Aurora to reproduce them. The track-intensity skill dissociation for TCs indicates Aurora has learned large-scale steering flow dynamics robustly but struggles with moist thermodynamic processes that determine intensity.
Recurvature failures. The Hinnamnor failure (Section 3.3.1) stems from sensitivity to midlatitude trough-subtropical ridge phasing. Similar recurvature scenarios within the training period (e.g., Hurricane Sandy 2012) are handled more accurately, indicating that the failure reflects sensitivity to specific flow configurations rather than a general recurvature deficiency.
Convective precipitation failures. Aurora’s 0.25° resolution cannot represent mesoscale convective organization (10–50 km scales; Section 3.3.2). The precipitation decoder, despite training on observational MSWEP data, relies on Aurora’s smoothed atmospheric state; intense convective events are rare in the training distribution and consistently underestimated. Furthermore, Aurora’s input variables do not include convective instability indices such as CAPE (Convective Available Potential Energy), which ERA5 provides but the Aurora training dataset excludes; incorporating CAPE could improve convective precipitation representation for organized mesoscale events where large-scale moisture and wind fields alone are insufficient. This benefit would extend beyond purely convective cases: most high-impact precipitation events involve embedded convection within synoptic-scale systems (e.g., cutoff lows, fronts), so CAPE inclusion could partially address intensity underestimation even in principally frontal regimes such as the Western Europe 2021 event. ERA5 precipitation fields also differ systematically from MSWEP at the same spatial resolution; to the extent that this ERA5–MSWEP discrepancy is comparable in magnitude to the Aurora–MSWEP gap, part of the observed underperformance may reflect the underlying ERA5 training target rather than AI architectural limitations per se.
These mechanisms indicate observed limitations arise from a combination of fundamental atmospheric chaos (the 7–10 day horizon), smoothed ERA5 training data, and resolution constraints (unresolved convection), rather than solely from transformer architecture deficiencies.
4.4. Operational Implications
Aurora’s sub-minute inference on a single A100 GPU (Section 3.5) positions it as a valuable complement to physics-based NWP for three distinct roles. First, for rapid ensemble generation at 1–7 days: Aurora enables large perturbed-initialization ensembles at a fraction of the computational cost of the ECMWF IFS ensemble (51 members at ∼9 km) or NCEP GEFS (31 members) [46,47], supporting ensemble-of-opportunity frameworks that combine AI and NWP members [4,48]. Second, for regime identification at extended range: even though surface amplitude collapses beyond 7–10 days, Aurora’s retained synoptic-scale pattern skill (Section 3.2) can identify whether blocking, cutoff lows, or other regime configurations are likely, informing probabilistic subseasonal outlooks. Third, for real-time scenario exploration: the rapid inference cycle allows real-time “what-if” testing (e.g., how sensitive is TC landfall to 6-hour initialization shifts? what range of freeze onset dates is plausible?) at timescales impossible with operational NWP.
Standalone deployment for impact-based warnings requires addressing three limitations. Temperature extremes carry directional biases that grow with lead time (warm biases up to +11°C for freezes, cold biases up to −11°C for heatwaves; Section 3.3.3), demanding post-processing through quantile mapping or neural-network bias correction. TC intensity is persistently underestimated (Section 3.1.2), suggesting hybrid approaches (AI track prediction combined with statistical-dynamical intensity schemes) as the near-term path forward. Across all event types, deterministic forecasts provide insufficient uncertainty quantification for high-stakes emergency decisions; probabilistic extensions (e.g., via GenCast-style diffusion or the latent-space ensemble approach described in Section 4.5) are required. Finally, all verification here is against ERA5; direct validation against station observations, satellite retrievals, and operational radar for independent quality assessment remains an important outstanding task.
4.5. Future Directions
Two complementary directions emerge from the failure modes identified here. Mechanistic interpretability is needed to understand why amplitude information is lost beyond 7–10 days and why specific recurvature regimes fail; this requires analysis of Aurora’s internal representations. Recent work has made progress: ? ] showed that Aurora’s backbone encodes 3D storm structures without explicit supervision, Richards and Balan [49] characterized encoder spatial features, and MacMillan and Ouellette [50] demonstrated that sparse autoencoders applied to GraphCast’s activations isolate physically interpretable features for TCs and ARs. Applying similar mechanistic analysis to Aurora’s bottleneck layer may reveal which internal features govern the pattern persistence and amplitude collapse documented in Section 3.2. Lead-time-specific fine-tuning is perhaps the most tractable near-term architectural improvement: keeping the transformer backbone frozen and training separate decoder heads for 1-, 3-, 5-, 7-, and 14-day target lead times would reduce the compounding errors of autoregressive rollout while retaining the backbone’s demonstrated pattern skill. These multi-step decoders could simultaneously adopt quantile or probability-weighted loss functions rather than MSE, directly countering the regression-to-climatology bias at subseasonal leads.
Probabilistic and process-specific extensions address the remaining operational shortfalls. Ensemble generation via the latent space offers a computationally lightweight path to uncertainty quantification: modeling each output variable as a log-normal process and fine-tuning the decoder under a likelihood objective would yield stochastic ensemble members with physically consistent spatial structure, a substantially lighter approach than training a full diffusion model such as GenCast. Fine-tuning for underrepresented extreme processes addresses the precipitation and TC intensity shortfalls. Lehmann et al. [34] established that lightweight decoders can recover unseen variables from a frozen Aurora backbone; gradient-based perturbation methods have generated extreme TC scenarios by steering model states toward targeted configurations [51]; and AI-enabled conditional nonlinear optimal perturbations have improved ensemble prediction of extreme El Niño events [52]. Extending these approaches to ARs and convective precipitation, including instability-aware steering guided by finite-time Lyapunov exponents [53,54,55], opens a path toward AI-guided predictability assessment beyond the diagnostic framework presented here.
5. Conclusions
This study provides a cross-regime, event-based evaluation of Aurora’s ability to predict extreme weather, spanning tropical cyclones, temperature extremes, atmospheric rivers, and extreme precipitation. Aurora captures large-scale dynamical structures with high fidelity at short lead times but consistently underestimates extreme intensity and loses surface-impact amplitude at longer leads.
The central result is that large-scale circulation patterns remain moderately skillful at 14–21 day leads (pattern correlations 0.57–0.85) even as surface-impact amplitude collapses; the pattern persisting beyond expected error-growth timescales is the novel finding, while the amplitude collapse itself is consistent with positive Lyapunov exponents and MSE-trained reversion to climatological mean states.
Actionable predictability is largely confined to 7–10 days, with shorter horizons for convectively driven precipitation and longer horizons for large-scale temperature patterns. Performance varies consistently by process scale: phenomena governed by large-scale dynamics are more robustly predicted than those driven by mesoscale or convective processes. The in-sample versus out-of-sample precipitation skill contrast is substantially confounded by event-type differences, and the temporal generalization conclusion remains preliminary.
The pattern–amplitude divergence documented here reflects two distinct bottlenecks: for slow-evolving thermodynamic extremes beyond 7–10 days, the dominant constraint is physical: positive Lyapunov exponents drive exponential error growth until saturation, collapsing amplitude toward climatological mean states consistent with the Lorenz predictability limit. For TC recurvature errors and convective precipitation failures, architectural constraints dominate, specifically limited spatial resolution and incomplete representation of convective instability in the training inputs. In both regimes, deterministic refinement reaches diminishing returns; the most productive path forward is probabilistic. Aurora should be viewed as a building block for hybrid forecasting systems: a fast, skillful source of short- to medium-range dynamical guidance that anchors ensemble methods capable of extending uncertainty quantification to longer leads and rarer intensities.
Supplementary Materials
The following supporting information can be downloaded at the website of this paper posted on Preprints.org. The following supporting information is available online: S1: Comparison of leading AI weather forecast models (Table); S2: Aurora pretraining datasets and configurations; S3: Precipitation MLP decoder implementation; S4: Extended explanation of performance metrics (RMSE, pattern correlation, IoU); S5: Temperature extremes performance summary table (all four events, 1–21 day leads); S6: Atmospheric river performance summary table (all three events, 1–7 day leads); S7: Extreme precipitation performance summary table (all five events, 1–7 day leads); S8: Aurora and MSWEP spatial comparison for the Appalachian 2022 event; S9: GFS–Aurora–ERA5 comparison for Texas Freeze 2021.
Author Contributions
Conceptualization, Q.H. and U.L.; Methodology, Q.H., M.L. and Y.K.; Software, Q.H., M.L. and Y.K.; Investigation, Q.H. (tropical cyclones, temperature extremes, Arizona 2025 storm), M.L. (atmospheric rivers), and Y.K. (extreme precipitation events); Data Curation, Q.H., M.L. and Y.K.; Formal Analysis, Q.H., M.L. and Y.K.; Writing—Original Draft Preparation, Q.H.; Writing—Review & Editing, Q.H. and U.L.; Visualization, Q.H., M.L. and Y.K.; Supervision, U.L. All authors have read and agreed to the published version of the manuscript.
Funding
This research received no external funding.
Institutional Review Board Statement
Not applicable.
Informed Consent Statement
Not applicable.
Data Availability Statement
ERA5 reanalysis datasets are publicly available from the Copernicus Climate Data Store: ERA5 hourly data on single levels (https://doi.org/10.24381/cds.adbb2d47) and pressure levels (https://doi.org/10.24381/cds.bd0915c6). The Aurora pretrained model is publicly available at https://github.com/microsoft/aurora. The auxiliary precipitation decoder is available at https://github.com/lehmannfa/aurora-lite-decoder [34]. MSWEP Version 3 (hourly 0.1°, 1979–present) is available via Wang et al. [35]: https://www.gloh2o.org/. IBTrACS best-track data are available from NOAA NCEI: https://www.ncei.noaa.gov/products/international-best-track-archive. All processed data, derived metrics, and event-based evaluation outputs are available from the corresponding author upon reasonable request.
Acknowledgments
We thank Microsoft Research for developing and openly sharing the Aurora model and training weights, and Lehmann et al. for the precipitation decoder. We acknowledge the ECMWF for ERA5 data through the Copernicus Climate Data Store. Computational resources were provided by ASU Research Computing (SOL). In preparing this manuscript, the authors used Claude (Anthropic) to assist with manuscript editing and LaTeX formatting. After using this tool, the authors reviewed and edited all content and take full responsibility for the published article.
Conflicts of Interest
The authors declare no conflicts of interest.
Abbreviations
The following abbreviations are used in this manuscript:
| AI | Artificial Intelligence |
| AR | Atmospheric River |
| CAPE | Convective Available Potential Energy |
| ERA5 | ECMWF Reanalysis version 5 |
| GFS | Global Forecast System |
| IBTrACS | International Best Track Archive for Climate Stewardship |
| IFS | Integrated Forecasting System |
| IoU | Intersection over Union |
| IVT | Integrated Vapor Transport |
| MCS | Mesoscale Convective System |
| MSLP | Mean Sea Level Pressure |
| MSWEP | Multi-Source Weighted-Ensemble Precipitation |
| NHC | National Hurricane Center |
| NWP | Numerical Weather Prediction |
| RMSE | Root Mean Square Error |
| SSW | Stratospheric Sudden Warming |
| TC | Tropical Cyclone |
References
- Bi, K.; Xie, L.; Zhang, H.; Chen, X.; Gu, X.; Tian, Q. Accurate medium-range global weather forecasting with 3D neural networks. Nature 2023, 619, 533–538. [Google Scholar] [CrossRef] [PubMed]
- Lam, R.; Sanchez-Gonzalez, A.; Willson, M.; Wirnsberger, P.; Fortunato, M.; Alet, F.; et al. Learning skillful medium-range global weather forecasting. Science 2023, 382, 1416–1421. [Google Scholar] [CrossRef] [PubMed]
- Price, I.; Sanchez-Gonzalez, A.; Alet, F.; Andersson, T.R.; El-Kadi, A.; Masters, D.; et al. Probabilistic weather forecasting with machine learning. Nature 2025, 637, 84–90. [Google Scholar] [CrossRef] [PubMed]
- Lang, S.; Alexe, M.; Chrust, M.; Dramsch, J.; Pinault, F.; Raoult, B.; et al. AIFS – ECMWF’s data-driven forecasting system. Technical Memorandum 920, ECMWF, 2025. [Google Scholar]
- Bodnar, C.; Bruinsma, W.P.; Lucic, A.; et al. A foundation model for the Earth system. Nature 2025, 641, 1180–1187. [Google Scholar] [CrossRef] [PubMed]
- Brotzge, J.A.; Berchoff, D.; Carlis, D.L.; Carr, F.H.; Carr, R.H.; Gerth, J.J.; et al. Challenges and opportunities in numerical weather prediction. Bull. Am. Meteorol. Soc. 2023, 104, E698–E705. [Google Scholar] [CrossRef]
- Bouallègue, Z.B.; Clare, M.C.A.; Magnusson, L.; Gascón, E.; Maier-Gerber, M.; Janoušek, M.; et al. The rise of data-driven weather forecasting: A first statistical assessment of machine learning-based weather forecasts in an operational-like context. Bull. Am. Meteorol. Soc. 2024, 105, E1593–E1612. [Google Scholar] [CrossRef]
- Allen, A.; Markou, S.; Tebbutt, W.; Requeima, J.; Bruinsma, W.P.; Andersson, T.R.; Herzog, M.; Lane, N.D.; Chantry, M.; Hosking, J.S.; et al. End-to-end data-driven weather prediction. Nature 2025, 641, 1172–1179. [Google Scholar] [CrossRef] [PubMed]
- Leutbecher, M.; Palmer, T.N. Ensemble Forecasting. J. Comput. Phys. 2008, 227, 3515–3539. [Google Scholar] [CrossRef]
- Palmer, T.N. The ECMWF Ensemble Prediction System: Looking Back (More than) 25 Years and Projecting Forward 25 Years. Q. J. R. Meteorol. Soc. 2018, 144, 3–9. [Google Scholar] [CrossRef]
- Lorenz, E.N. Atmospheric Predictability as Revealed by Naturally Occurring Analogues. J. Atmos. Sci. 1969, 26, 636–646. [Google Scholar] [CrossRef]
- Kalnay, E. Atmospheric Modeling, Data Assimilation and Predictability; Cambridge University Press, 2003. [Google Scholar] [CrossRef]
- Zhao, S.; Xiong, Z.; Zhao, J.; Zhu, X.X. ExEBench: Benchmarking foundation models on extreme Earth events. arXiv 2025, arXiv:2505.08529. [Google Scholar] [CrossRef]
- Sahu, P.L.; Sandeep, S.; Kodamana, H. Evaluating global machine learning models for tropical cyclone dynamics and thermodynamics. J. Geophys. Res. Mach. Learn. Comput. 2025, 2, e2025JH000594. [Google Scholar] [CrossRef]
- DeMaria, M.; Franklin, J.L.; Chirokova, G.; Radford, J.; DeMaria, R.; Musgrave, K.D.; Ebert-Uphoff, I. An Operations-Based Evaluation of Tropical Cyclone Track and Intensity Forecasts from Artificial Intelligence Weather Prediction Models. Artif. Intell. Earth Syst. 2025, 4, 240085. [Google Scholar] [CrossRef]
- Gupta, A.; Sheshadri, A.; Suri, D. MAUSAM: An observations-focused assessment of global AI weather prediction models during the South Asian monsoon. arXiv 2025, arXiv:2509.01879. [Google Scholar] [CrossRef]
- Blake, E.S.; Kimberlain, T.B.; Berg, R.J.; Cangialosi, J.P.; Beven, J.L., II. Tropical Cyclone Report: Hurricane Sandy (AL182012); Technical report; National Hurricane Center, 2013. [Google Scholar]
- India Meteorological Department. Super Cyclonic Storm “AMPHAN” over Southeast Bay of Bengal (16–21 May 2020) – Summary. published on; Government of India / IMD; ReliefWeb, 2020; Technical report. [Google Scholar]
- Bucci, L.R.; Alaka, L.; Hagen, A.; Delgado, S.; Beven, J.L. Tropical Cyclone Report: Hurricane Ian (AL092022); Technical report; National Hurricane Center, 2023. [Google Scholar]
- Wang, Q.; Zhao, D.; Duan, Y.; Guan, S.; Dong, L.; Xu, H.; Wang, H. Super Typhoon Hinnamnor (2022) with a Record-Breaking Lifespan over the Western North Pacific. Adv. Atmos. Sci. 2023, 40, 1558–1566. [Google Scholar] [CrossRef]
- Knapp, K.R.; Kruk, M.C.; Levinson, D.H.; Diamond, H.J.; Neumann, C.J. The International Best Track Archive for Climate Stewardship (IBTrACS): Unifying tropical cyclone data. Bull. Am. Meteorol. Soc. 2010, 91, 363–376. [Google Scholar] [CrossRef]
- Gahtan, J.; Knapp, K.R.; Kruk, M.C.; Levinson, D.H.; Diamond, H.J.; Neumann, C.J. International Best Track Archive for Climate Stewardship (IBTrACS) Project, Version 4. 2024. [Google Scholar] [CrossRef]
- Huang, J.; Hitchcock, P.; Tian, W.; Sillin, J. Stratospheric influence on the development of the 2018 late winter European cold air outbreak. J. Geophys. Res. Atmos. 2022, 127, e2021JD035877. [Google Scholar] [CrossRef]
- Doss-Gollin, J.; Farnham, D.J.; Lall, U.; Modi, V. How unprecedented was the February 2021 Texas cold snap? Environ. Res. Lett. 2021, 16, 064056. [Google Scholar] [CrossRef]
- White, R.H.; Anderson, S.; Booth, J.F.; Braich, G.; Draeger, C.; Fei, C.; Harley, C.D.G.; Henderson, S.B.; et al. The unprecedented Pacific Northwest heatwave of June 2021. Nat. Commun. 2023, 14, 2738. [Google Scholar] [CrossRef] [PubMed]
- Magnusson, L.; Napoli, D.C. Heatwave over southwest Europe in August 2023. ECMWF Newsl. 2023, No. 177. [Google Scholar]
- Dezfuli, A. Rare atmospheric river caused record floods across the Middle East. Bull. Am. Meteorol. Soc. 2020, 101, E394–E400. [Google Scholar] [CrossRef]
- Schubert, S.D.; Chang, Y.; DeAngelis, A.M.; Lim, Y.K.; Thomas, N.P.; Koster, R.D.; et al. Insights into the Causes and Predictability of the 2022/23 California Flooding. J. Clim. 2024, 37, 3613–3629. [Google Scholar] [CrossRef]
- Houze, R.A.; Rasmussen, K.L.; Medina, S.; Brodzik, S.R.; Romatschke, U. Anomalous Atmospheric Events Leading to the Summer 2010 Floods in Pakistan. Bull. Am. Meteorol. Soc. 2011, 92, 291–298. [Google Scholar] [CrossRef]
- Food and Agriculture Organization. The Sudan 2020 Flood Impact Rapid Assessment, September 2020 – Rapid Assessment Report. FAO, Technical report. Rome, 2020. [Google Scholar]
- Copernicus Climate Change Service. European State of the Climate (ESOTC) 2021. Flooding in Europe. 2021. [Google Scholar] [PubMed]
- National Weather Service. Historic July 26th-July 30th, 2022 Eastern Kentucky Flooding, 2022.
- National Weather Service. Review of the 2025 Monsoon Across the Southwest U.S. 2025. [Google Scholar]
- Lehmann, F.; Ozdemir, F.; Soja, B.; Hoefler, T.; Mishra, S.; Schemm, S. Finetuning a Weather Foundation Model with Lightweight Decoders for Unseen Physical Processes. arXiv 2025, arXiv:2506.19088. [Google Scholar] [CrossRef]
- Wang, X.; Alharbi, R.S.; Baez-Villanueva, O.M.; Miralles, D.G.; Ma, J.; Xu, S.; et al. MSWEP V3: Machine Learning-Powered Global Precipitation Estimates at 0.1∘ Hourly Resolution (1979–Present). arXiv 2026, arXiv:2602.01436. [Google Scholar] [CrossRef]
- European Centre for Medium-Range Weather Forecasts. ERA5 Reanalysis (ECMWF Reanalysis v5), 2019.
- Cangialosi, J.P. National Hurricane Center Forecast Verification Report. 2022 Hurricane Season; Technical report; National Hurricane Center, 2023. [Google Scholar]
- Zhang, L.; Lu, M.; Bao, Q.; Zhao, Y.; Yang, J. Global performance benchmarking of artificial intelligence models in atmospheric river forecasting. Commun. Earth Environ. 2025, 6, 894. [Google Scholar] [CrossRef]
- DeFlorio, M.J.; Sengupta, A.; Castellano, C.M.; Wang, J.; Zhang, Z.; Gershunov, A.; et al. From California’s Extreme Drought to Major Flooding: Evaluating and Synthesizing Experimental Seasonal and Subseasonal Forecasts of Landfalling Atmospheric Rivers and Extreme Precipitation during Winter 2022/23. Bull. Am. Meteorol. Soc. 2024, 105, E84–E104. [Google Scholar] [CrossRef]
- National Weather Service. Valentine’s Week Winter Outbreak 2021: Snow, Ice, & Record Cold, 2021; NWS Houston/Galveston operational summary.
- National Centers for Environmental Information. The Great Texas Freeze: February 11-20, 2021, 2023.
- Zhang, F.; Sun, Y.Q.; Magnusson, L.; Buizza, R.; Lin, S.; Chen, J.; Emanuel, K. What Is the Predictability Limit of Midlatitude Weather? J. Atmos. Sci. 2019, 76, 1077–1091. [Google Scholar] [CrossRef]
- Palmer, T.N. Predicting Uncertainty in Forecasts of Weather and Climate. Rep. Prog. Phys. 2000, 63, 71–116. [Google Scholar] [CrossRef]
- Matsueda, M.; Palmer, T.N. Estimates of Flow-Dependent Predictability of Wintertime Euro-Atlantic Weather Regimes in Medium-Range Forecasts. Q. J. R. Meteorol. Soc. 2018, 144, 1012–1027. [Google Scholar] [CrossRef]
- Lorenz, E.N. Deterministic Nonperiodic Flow. J. Atmos. Sci. 1963, 20, 130–141. [Google Scholar] [CrossRef]
- European Centre for Medium-Range Weather Forecasts. IFS documentation, 2024.
- National Centers for Environmental Information. Global Ensemble Forecast System (GEFS). 2025. [Google Scholar] [CrossRef] [PubMed]
- National Oceanic and Atmospheric Administration. NOAA deploys new generation of AI-driven global weather models. 2025. [Google Scholar]
- Richards, B.; Balan, P.K. Latent Representations of Land–Sea Boundaries and Extreme Temperature in Aurora’s Encoder (Student Abstract). Proc. Proc. AAAI Conf. Artif. Intell. 2026, Vol. 40, 41368–41369. [Google Scholar] [CrossRef]
- MacMillan, T.; Ouellette, N.T. Towards mechanistic understanding in a data-driven weather model: internal activations reveal interpretable physical features. arXiv 2025, arXiv:2512.24440. [Google Scholar] [CrossRef]
- Hakim, G.J.; Agrawal, A. Gray Swan Factory: Making Extreme Events from Ordinary Cyclones. arXiv 2026, arXiv:2604.00348. [Google Scholar] [CrossRef]
- Zhou, L.; Zhang, R.H.; Tao, L. AI-enabled conditional nonlinear optimal perturbation enhances ensemble prediction of extreme El Niño events. npj Clim. Atmos. Sci. 2026, 9, 30. [Google Scholar] [CrossRef]
- Huang, Q.; Liu, M.; Kwon, Y.; Lall, U. Steering Tropical Cyclones Using Small Perturbations in an AI Weather Model, 2026. arXiv arXiv:physics.ao. [CrossRef]
- Liu, M.; Huang, Q.; Lall, U. Regime Identification and Control of Extremes in the Nonautonomous Lorenz Model with Chaos and Intransitivity. Physical Review E. Accepted. 2026. [CrossRef]
- Huang, Q.; Liu, M.; Lall, U. Weather Jiu-Jitsu: Prospects for Atmospheric Nudging to Defuse the Impact of Catastrophic Weather Extremes. PLoS Water 2026. [Google Scholar] [CrossRef]
Figure 1.
Two-stage evaluation framework. Stage 1 evaluates lead-time dependence by varying initialization dates while targeting fixed critical phases (landfall for TCs; onset/peak for temperature extremes and ARs). Stage 2 examines sub-daily initialization sensitivity (TCs) or extended spatial/physical diagnostics (temperature extremes, ARs, precipitation).
Figure 1.
Two-stage evaluation framework. Stage 1 evaluates lead-time dependence by varying initialization dates while targeting fixed critical phases (landfall for TCs; onset/peak for temperature extremes and ARs). Stage 2 examines sub-daily initialization sensitivity (TCs) or extended spatial/physical diagnostics (temperature extremes, ARs, precipitation).
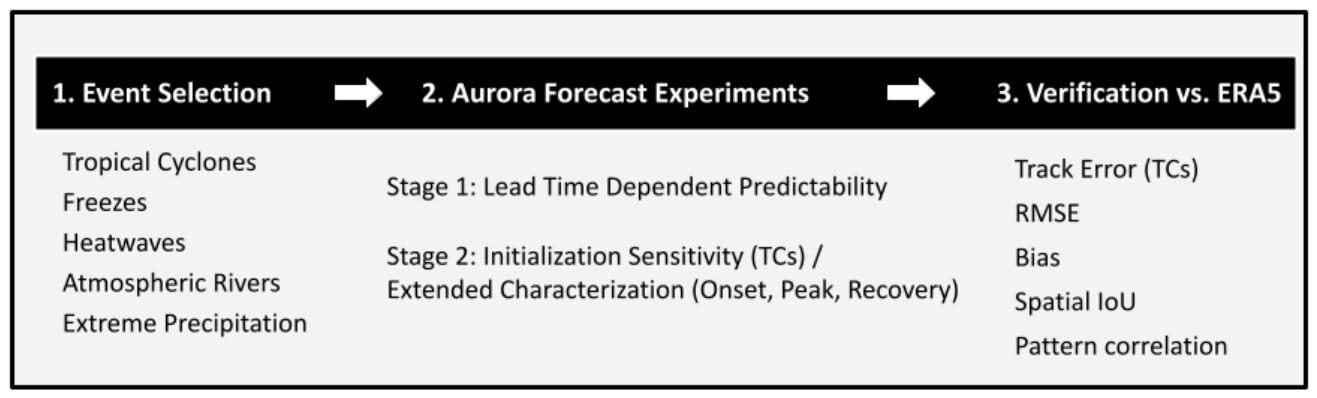
Figure 2.
Tropical cyclone track forecasts for Cyclone Amphan 2020, Hurricane Sandy 2012, Hinnamnor 2022, and Ian 2022. Red lines show IBTrACS best track; blue, purple, green, and yellow lines show Aurora forecasts at 1-, 3-, 5-, and 7-day leads respectively.
Figure 2.
Tropical cyclone track forecasts for Cyclone Amphan 2020, Hurricane Sandy 2012, Hinnamnor 2022, and Ian 2022. Red lines show IBTrACS best track; blue, purple, green, and yellow lines show Aurora forecasts at 1-, 3-, 5-, and 7-day leads respectively.
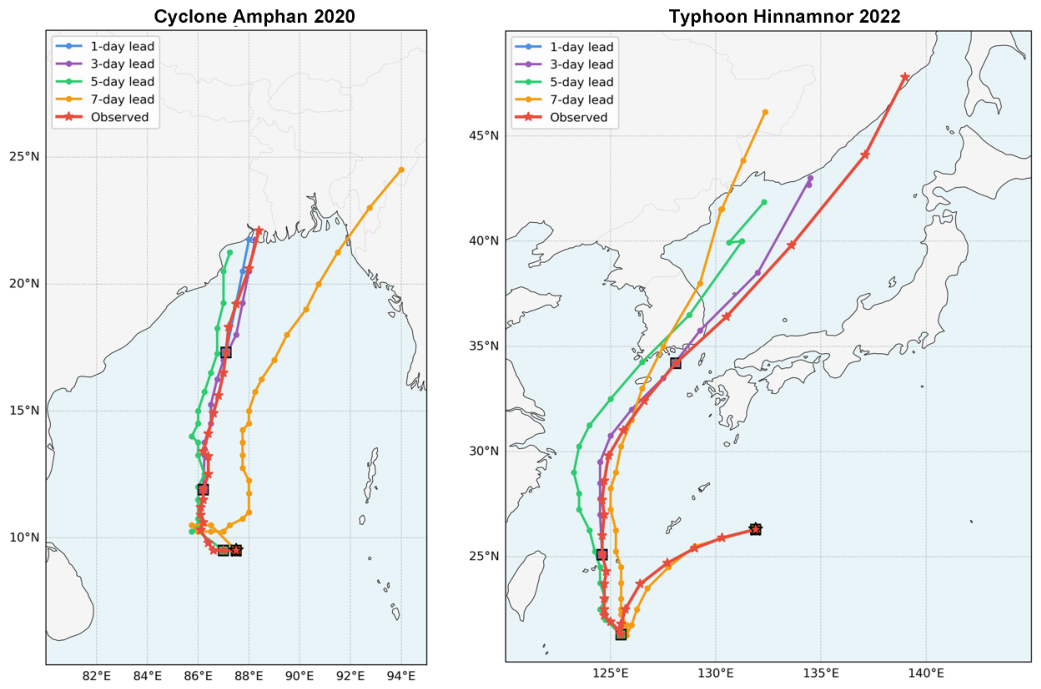
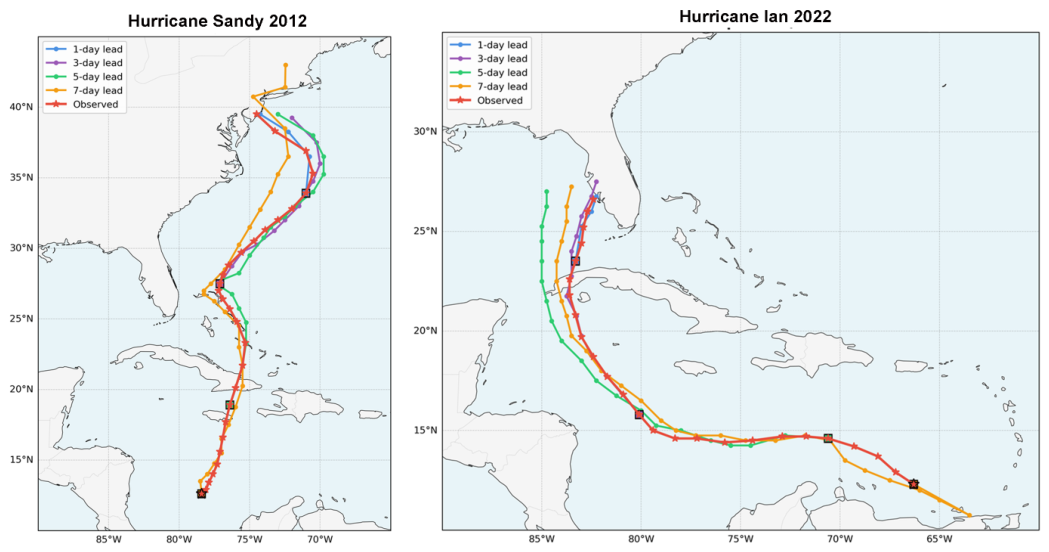
Figure 3.
North America outlook (left) and Texas region (right) prediction of 2-meter temperature for Texas Freeze 2021 (out-of-sample), comparing ERA5 (top row) and Aurora forecasts at 1-, 7-, 14-, and 21-day lead times. Corresponding results for Beast from the East 2018 (in-sample) are in Supporting Information S5.
Figure 3.
North America outlook (left) and Texas region (right) prediction of 2-meter temperature for Texas Freeze 2021 (out-of-sample), comparing ERA5 (top row) and Aurora forecasts at 1-, 7-, 14-, and 21-day lead times. Corresponding results for Beast from the East 2018 (in-sample) are in Supporting Information S5.
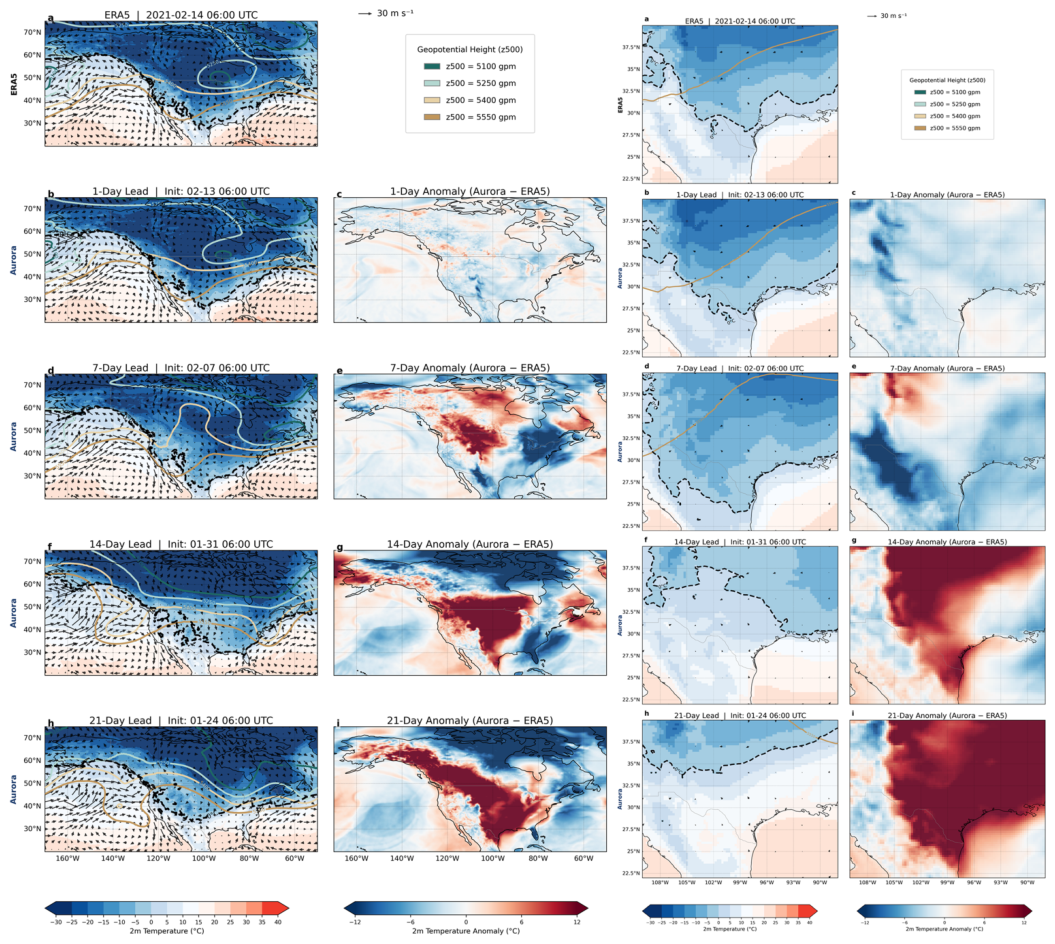
Figure 4.
Euro-Atlantic outlook (left) and Southwestern Europe region (right) prediction of 2-meter temperature for SW Europe Heatwave 2023, comparing ERA5 and Aurora forecasts at 1-, 7-, 14-, and 21-day lead times.
Figure 4.
Euro-Atlantic outlook (left) and Southwestern Europe region (right) prediction of 2-meter temperature for SW Europe Heatwave 2023, comparing ERA5 and Aurora forecasts at 1-, 7-, 14-, and 21-day lead times.
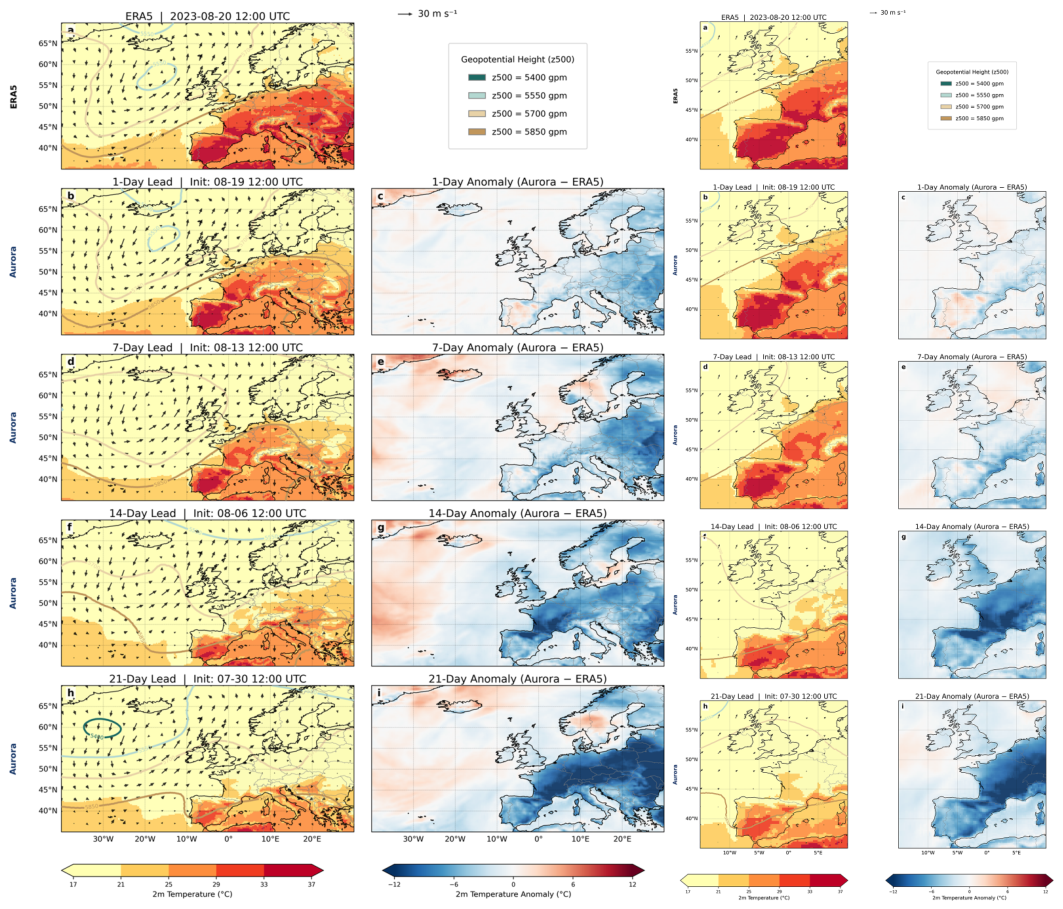
Figure 5.
Pacific outlook (left) and U.S. West Coast (right) prediction of IVT for the December 2023 California atmospheric river, comparing ERA5 and Aurora forecasts at 1-, 3-, 5-, and 7-day lead times.
Figure 5.
Pacific outlook (left) and U.S. West Coast (right) prediction of IVT for the December 2023 California atmospheric river, comparing ERA5 and Aurora forecasts at 1-, 3-, 5-, and 7-day lead times.
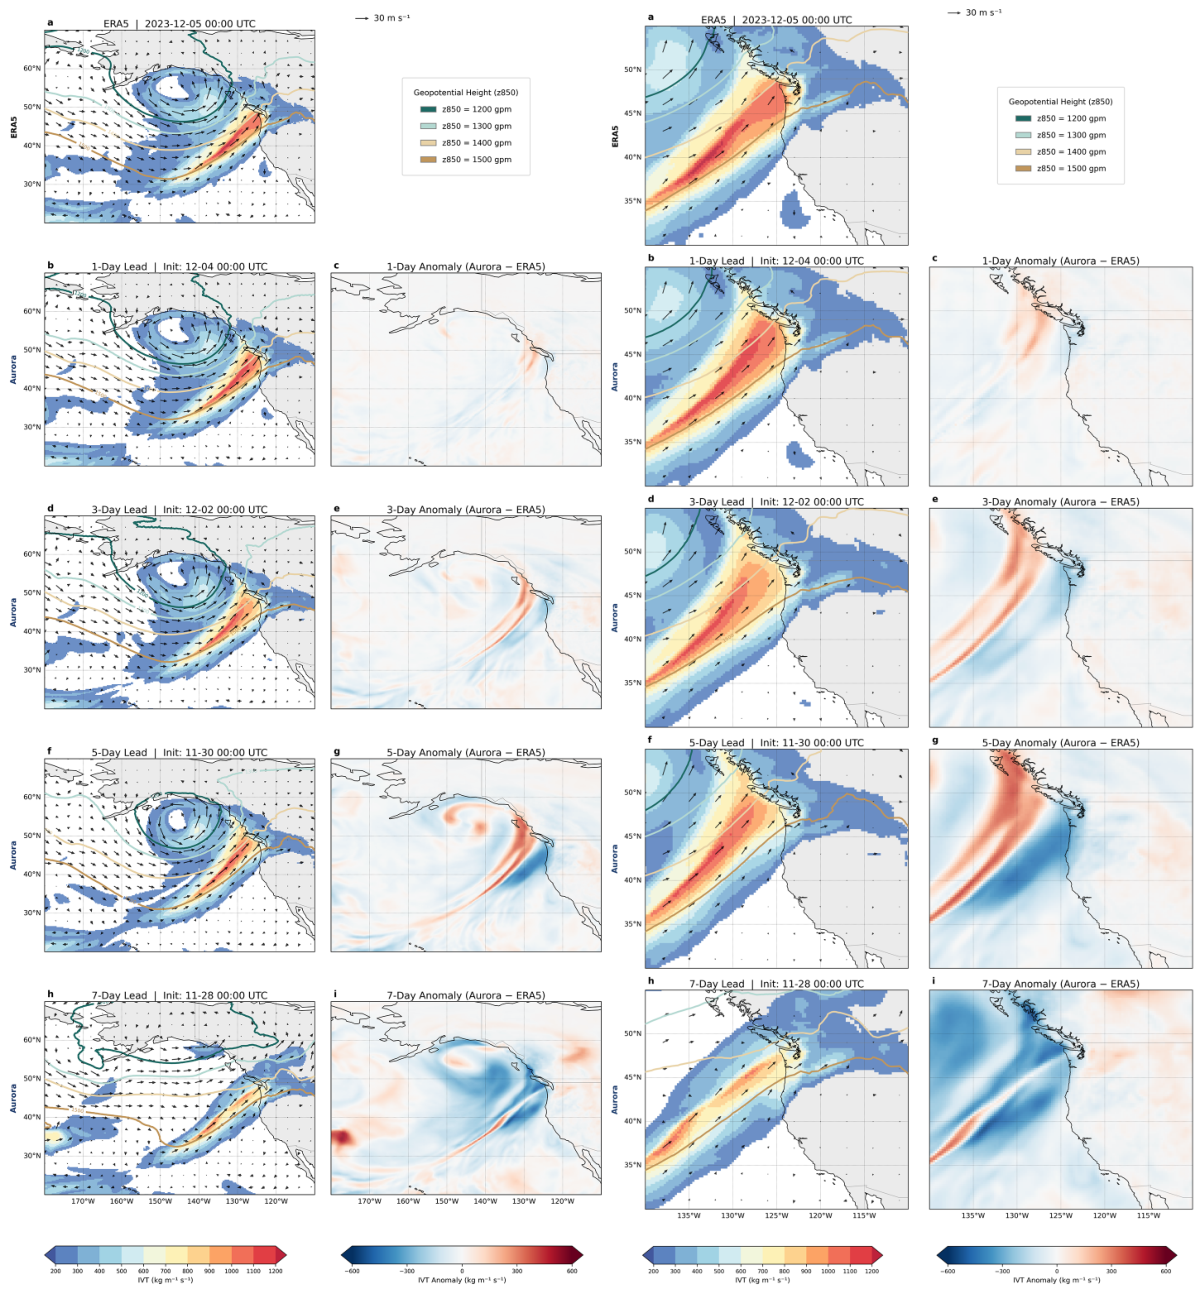
Figure 6.
Western US (left) and Arizona (right) prediction of precipitation for Arizona 2025 storms, comparing ERA5 and Aurora forecasts at 1-, 3-, 5-, and 7-day lead times.
Figure 6.
Western US (left) and Arizona (right) prediction of precipitation for Arizona 2025 storms, comparing ERA5 and Aurora forecasts at 1-, 3-, 5-, and 7-day lead times.
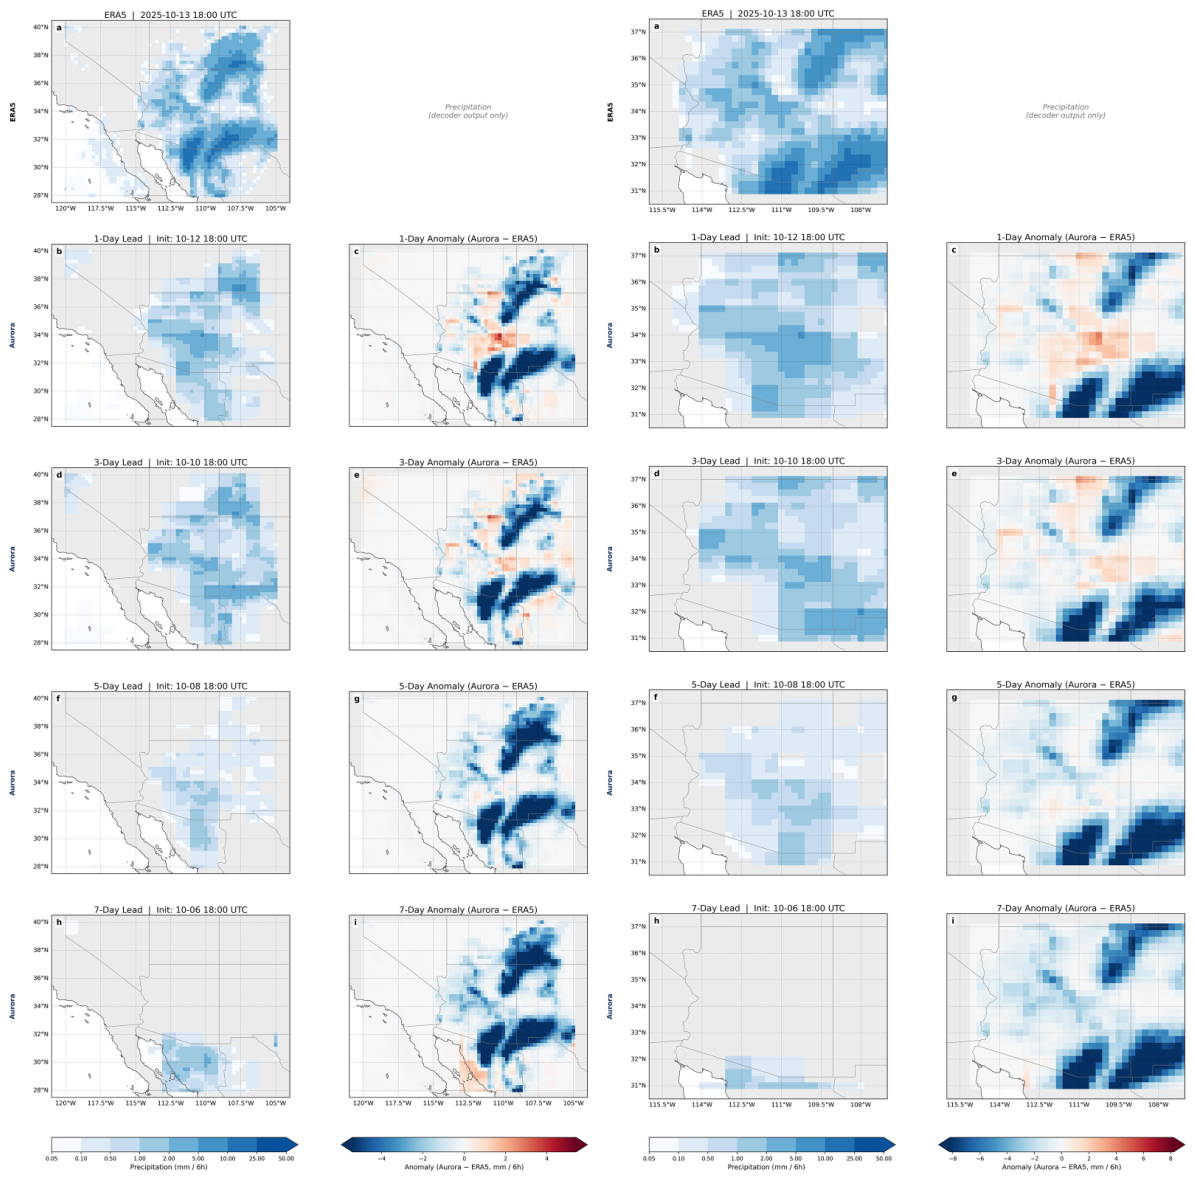
Figure 7.
Comprehensive lead-time skill summary showing RMSE, Pattern Correlation, and Bias/IoU vs. lead time for freeze events (Beast from East 2018, Texas 2021), heatwave events (British Columbia 2021, SW Europe 2023), and precipitation events (Pakistan 2010, Sudan 2020, Western Europe 2021, Appalachian 2022, Arizona 2025). All temperature and AR metrics are vs. ERA5; precipitation metrics are vs. MSWEP (except Arizona 2025, which is vs. ERA5; see Section 3.1.5). Full numerical tables are in Supporting Information S5–S7.
Figure 7.
Comprehensive lead-time skill summary showing RMSE, Pattern Correlation, and Bias/IoU vs. lead time for freeze events (Beast from East 2018, Texas 2021), heatwave events (British Columbia 2021, SW Europe 2023), and precipitation events (Pakistan 2010, Sudan 2020, Western Europe 2021, Appalachian 2022, Arizona 2025). All temperature and AR metrics are vs. ERA5; precipitation metrics are vs. MSWEP (except Arizona 2025, which is vs. ERA5; see Section 3.1.5). Full numerical tables are in Supporting Information S5–S7.
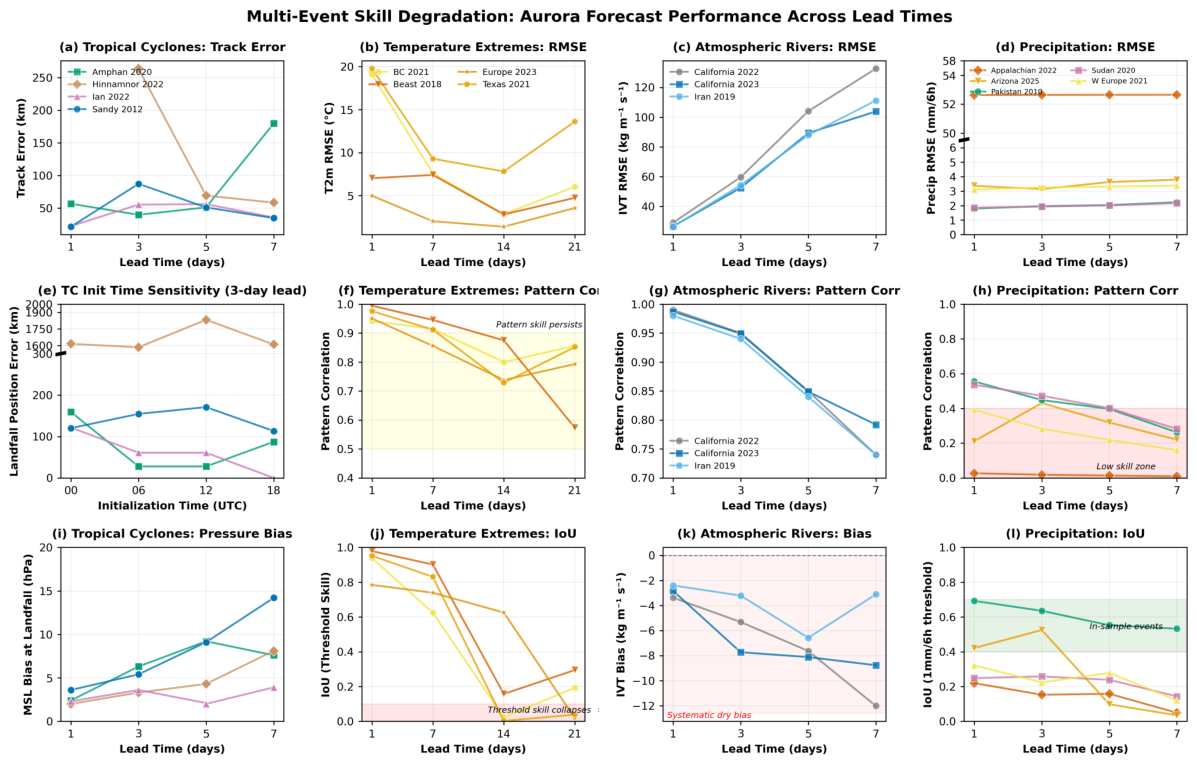

Table 1.
Event Inventory. †14- and 21-day leads evaluated for temperature extremes only; all other categories evaluated at 1–7 days.
Table 1.
Event Inventory. †14- and 21-day leads evaluated for temperature extremes only; all other categories evaluated at 1–7 days.
| Event | Region & Dominant Mechanism | Lead Times | In/Out |
|---|---|---|---|
| Tropical Cyclones | |||
| Sandy 2012 | Atlantic, U.S. Northeast; TC-extratropical transition | 1, 3, 5, 7 d | In |
| Amphan 2020 | N. Indian Ocean; Rapid intensification, low shear | 1, 3, 5, 7 d | In |
| Ian 2022 | Atlantic, Gulf of Mexico; Loop Current intensification | 1, 3, 5, 7 d | Out |
| Hinnamnor 2022 | W. Pacific; Subtropical ridge steering, recurvature | 1, 3, 5, 7 d‡ | Out |
| Freeze | |||
| Beast from East 2018 | W. Europe; Ural blocking, SSW polar vortex | 1, 7, 14, 21 d† | In |
| Texas 2021 | S. United States; Stratospheric vortex weakening | 1, 7, 14, 21 d† | Out |
| Heatwave | |||
| British Columbia 2021 | W. Canada; Persistent blocking ridge | 1, 7, 14, 21 d† | Out |
| SW Europe 2023 | S./W. Europe; Persistent subtropical ridge | 1, 7, 14, 21 d† | Out |
| Atmospheric Rivers | |||
| Iran 2019 | SW Iran; Arabian Sea AR, orographic forcing | 1, 3, 5, 7 d | In |
| California 2022–23 | U.S. West Coast; Successive high-IVT ARs | 1, 3, 5, 7 d | Out |
| California 2023 | U.S. West Coast; Strong westerly moisture transport and jet coupling | 1, 3, 5, 7 d | Out |
| Extreme Precipitation | |||
| Pakistan 2010 | South Asia; Enhanced monsoon circulation | 1, 3, 5, 7 d | In |
| Sudan 2020 | East Africa; Intensified monsoon with SST anomalies | 1, 3, 5, 7 d | In |
| Western Europe 2021 | W. Europe; Quasi-stationary cutoff low | 1, 3, 5, 7 d | Out |
| Appalachian 2022 | E. Kentucky; Mesoscale convective training | 1, 3, 5, 7 d | Out |
| Arizona 2025 | SW United States; Monsoon-cutoff interaction | 1, 3, 5, 7 d | Out |
Note: In/Out refers to in-sample (pre-2020) vs. out-of-sample (post-2020) relative to Aurora’s ERA5 training period. ‡1-day lead omitted: automated storm tracker failed near the coast. SSW = Stratospheric Sudden Warming; AR = Atmospheric River; IVT = Integrated Vapor Transport; SST = Sea Surface Temperature.
Disclaimer/Publisher’s Note: The statements, opinions and data contained in all publications are solely those of the individual author(s) and contributor(s) and not of MDPI and/or the editor(s). MDPI and/or the editor(s) disclaim responsibility for any injury to people or property resulting from any ideas, methods, instructions or products referred to in the content. |
© 2026 by the authors. Licensee MDPI, Basel, Switzerland. This article is an open access article distributed under the terms and conditions of the Creative Commons Attribution (CC BY) license (http://creativecommons.org/licenses/by/4.0/).
Copyright: This open access article is published under a Creative Commons CC BY 4.0 license, which permit the free download, distribution, and reuse, provided that the author and preprint are cited in any reuse.


