Submitted:
01 September 2023
Posted:
05 September 2023
Read the latest preprint version here
Abstract
Optical networks, characterized by their use of optical fibers as a transmission medium, constitute the fundamental infrastructure employed by network operators today to deliver services to users. As total network capacity is one of the key factors influencing optical network performance, it is important to comprehend its limitations and have the capability to estimate its value. In this context, we revisit the concepts of capacity from various aspects, encompassing channel capacity, link capacity, and network capacity, thus providing an integrated view of the problem. Furthermore, we review the fundamental concepts underpinning optical networks, along with the basic physical phenomena present in optical fiber transmission. Additionally, we also provide capacity estimations using mainly formulations found in the literature and compare our estimations with select published experimental results.
Keywords:
network capacity
; optical networks
; optical fiber communications
1. Introduction
In recent years, the volume of network traffic has been experiencing almost exponential growth. This phenomenon can be attributed to various factors, such as the widespread adoption of cloud services, the expansion of video distribution platforms and social media, and the emergence of new technologies like 5G and beyond (5G++)[1].
To address this situation, optical networks emerge as a crucial asset. Optical networks are high-capacity communication infrastructures that utilize light for the transmission, processing, and routing of information These networks vary in terms of distance and capacity, falling into several categories: 1) Long-haul networks, such as submarine cables and core networks, span extensive geographic distances and offer huge capacities (in the order of dozens of Tbit/s); 2) Medium-haul networks, like metro networks, cover cities or metropolitan areas, handling data transmission in the range of hundreds of Gbit/s; 3) Short-haul networks, such as access networks, also called 'last-mile networks,' encompass small areas, connecting end-users to the network providers and delivering data rates on the order of a few Gbit/s [2].
The most remarkable feature of optical networks is the fact that they use optical fibers as a transmission medium. An optical fiber is a very thin glass filament with a diameter of the size of a human hair, that as a tremendous advantage of introducing very small losses as the light propagates through it. The first proposal to use optical fibers to carry information took place in 1966 and is due to Charles K. Kao [3]. Since that proposal optical fiber communications have witnessed enormous progress over the last six decades. Several breakthroughs have contributed to that progress. Among them one can refer to the emergence during the 1990s of erbium doped optical amplifiers (EDFA) and wavelength division multiplexing (WDM), as well as optical coherent detection in the early 20th century [4,5].
Optical amplifiers make it possible to compensate for the fiber losses in the optical domain avoiding the use of expensive repeaters. Optical coherent detection allows to increase the number of degrees of freedom to carry information in comparison with the traditional direct detection, since it makes uses of both amplitude and phase of optical signals like, for example, M-ary quadrature amplitude modulation (M-QAM), while direction detection relies only on intensity.
WDM is a fundamental technology in the optical networking field, as it enables the transmission of large amounts of data across long distances. It works by simultaneously transmitting multiple optical signals, often referred to as optical channels, through a single optical fiber, with each channel utilizing its own wavelength. Note that, the wavelength is related with the frequency through , where is the speed of the light in the vacuum (approximately ). When the spacing between the different wavelengths is very narrow (in the of order of tenths of a nanometer, or tens of GHz) that technique is designated as DWDM (Dense WDM). This is typically employed in long-haul and high-capacity applications, where it can support over 100 optical channels per fiber. Intuitively, it is expected that the number of channels provided depends on both the spacing between wavelengths and WDM signal bandwidth, which in turn is limited by EDFA bandwidth. Most of the currently deployed DWDM networks operate in the C-band, which is a wavelength range centered around the wavelength of 1548 nm. Nowadays, standard EDFA technology offers a bandwidth of approximately 4800 GHz, although more advanced solutions can achieve values up to 6000 GHz. It's worth mentioning that for a channel spacing of 50 GHz, the first solution can support up to 96 channels, while the second one can accommodate up to 120 channels [6].
An optical network is structured using interconnected nodes and DWDM links in a suitable configuration. Typically, the nodes are based on wavelength selective switches (WSSs) for their functionality (see Section 3). These WSSs enable the establishment of paths that traverse the network in optical form, known as lightpaths. In this way, a lightpath can also be seen as an optical channel.
The channel capacity is an important parameter of optical channels. The concept of channel capacity was introduced by Claude Shannon in 1948 [7]. It was defined as the maximum rate at which the information can be reliably transmitted through a noisy channel without errors. The fundamental assumptions behind this definition are that the noise is additive, white, and Gaussian (AWGN) and that the channel is linear, i.e. the capacity always increases with increasing signal power. However, the last assumption does not hold for optical fiber channels, which are non-linear by nature. This behavior implies that the fiber channel capacity does not grow indefinitely; instead, it is limited and reaches a maximum value as the signal power increases [4,8,9,10]. The analysis of this problem can be quite complex, but fortunately, there are analytical expressions available in the literature that facilitate the study [11,12].
Although the topic of network capacity has received less attention in the literature, there still exists some publications on the matter (see, for example, [13,14]). A distinctive feature of studies on this topic is that they involve not only physical layer aspects, as is typical in optical fiber channel analysis, but also networking issues.
The goal of this paper is to revisit the concept of capacity in the context of optical networks by adopting an integrated approach to the problem. This approach considers various interrelated aspects such as channel capacity, link capacity, and network capacity. As a result, it differs from the majority of studies published in the field that have primarily focused on a singular aspect, whether it be channel capacity [4,8,9,10,11,12], or network capacity [13,14].
The rest of the paper is organized as follows: Section 2 reviews the concepts of channel capacity and introduces the necessary background for determining the spectral efficiency and capacity of an optical channel. In addition, it presents numerical results related to these topics. Section 3 evaluates the link capacity and presents a suitable methodology for computing the network capacity. Finally, Section 4 summarizes and concludes the paper.
2. Channel Capacity
2.1. Capacity of a Communication Channel
According with the Shannon's theory [7] the capacity of a band limited communication channel in the presence of AWGN is given by
where is the channel capacity in bits per second (bit/s), is the channel bandwidth in Hz, is the average signal power in Watt, and is the noise power spectral density (PSD) in Watt/Hz. The signal transmitted through the channel is assumed to be based on a sequence of symbols at the rate of symbols per second (symbol rate also called baud rate). Each symbol encodes multiple bits of information using the amplitude and the phase of the signal. This process is known as modulation. In a modulation scheme with a symbol constellation of size , each symbol corresponds to bits of information. Examples of modulation schemes used in digital communication include M-PSK, which utilizes the phase of the signals, and M-QAM, which utilizes both the phase and amplitude.
The minimum bandwidth that a modulated signal can have to allow transmission without inter-symbol interference is equal to the symbol rate [4]. For such minimum bandwidth the signal-to-noise ratio becomes
and the channel capacity can be written as
2.2. Capacity of an Optical Channel
An optical channel can be seen as a communication pathway through which information is transmitted in optical domain from a sender to a receiver, utilizing an optical fiber as a transmission medium. This channel is characterized by its carrier frequency denoted as , and occupied bandwidth, denoted as , whose minimum value, as discussed early, is equal to , the symbol rate. The capacity of an optical channel is defined as the maximum data rate at which the information can be effectively transmitted through the channel. This capacity is typically expressed in bit/s. Equation 3 can also be applied to compute the capacity of an optical channel, denoted as , under the assumption that the noise sources present in these channels are modelled as AWGN sources.
One important noise source in optical systems is the amplified spontaneous emission (ASE) noise. This noise is generated inside of optical amplifiers simultaneously with signal amplification and can be effectively described by a random optical field with statistical properties similar to those of AWGN noise [9]. Optical amplifiers are used to compensate for the optical fiber losses. To achieve this, optical amplifiers, typically Erbium Dopped Amplifiers (EDFAs), are placed at discrete intervals along an optical link, with each amplifier exactly compensating the loss incurred by each fiber span. For a link with the length , made up of identical spans, the span length is and the span attenuation is , where α is the fiber attenuation coefficient in dB/km (typically in the 1550-nm wavelength region). The PSD of the ASE noise at the end of the chain of amplifiers is given by
where is the photon energy (with being the Plank's constant) is the noise figure (, with in dB), and .
Another significant noise source is nonlinear interference (NLI) resulting from the Kerr effect in optical fibers. The Kerr effect refers to the dependence of the refractive index of the fiber on the transmitted signal power. This characteristic makes the optical fiber channel intrinsically non-linear and, in this sense, different from other transmission media used for information transfer that have a linear behavior. Interestingly, it has been demonstrated in [15] through simulations and experiments that the impact of NLI noise on WDM links, supported in dispersion uncompensated fibers, can also be modeled as additive Gaussian noise. Furthermore, it was shown in [12] that under specific conditions, such as the Nyquist limit, the white noise assumption leads to quite accurate results. Note that, such limit is achieved when all the WDM signal channels have a rectangular spectral width and a frequency spacing equal to . This permits the characterization of the NLI noise also as a AWGN process with power spectral density of . As the ASE and NLI noises are assumed to be uncorrelated their power spectral densities simply add, resulting in . In these circumstances, the signal-to-noise ratio of an optical channel can be described as
where denotes the launched average optical power per channel.
A rigorous characterization of is not an easy task, and many studies have been published on this topic (see, for example [12,15]). Fortunately, some closed-form approximations have also been published [12,16], which facilitates the evaluation of One of these approximations, which is based on the white noise assumption, allows to write the PSD of the NLI at the end of a fiber link with spans in the following way:
In that equation, one can identify parameters related with the optical fiber, such as , the fiber nonlinear coefficient in, the fiber dispersion in and, the span effective length in km, as well as parameters related with the signal, such as , the optical bandwidth in Hz of the WDM signal, assumed to be composed of channels spaced by . In addition, the span effective length is given as
where is the span length and is the fibre attenuation coefficient in Neper/km, i,e. . Another relevant parameter to characterize the optical channel is spectral efficiency, measured in bit/s/Hz, which is defined as [9,11]
where the factor 2 stems from the fact that the optical fiber channel supports 2 optical channels with orthogonal polarizations, commonly referred to as polarization multiplexed (PM) optical channels. The spectral efficiency can be estimated through closed-form calculations using Equations (4)-(8), by noting that. The obtained results, considering the parameters given in Table 1, are depicted in Figure 1. This figure plots the spectral efficiency as the function of the channel power for different link lengths, considering (Fig. 1a) and (Fig. 1b). As can be seen, there is a value of the channel power that maximizes the spectral efficiency (). It can be shown that the value of the optimum launch power per channel is given as [12]
For we have and , while for we have and bit/s/Hz . These results show that decreases of about 2 bit/s/Hz when the span length increases from 80 km to 100 km, because of the increase in the ASE noise power. Another conclusion, we can draw from the figure, is that decreases also of about 2 bit/s/Hz for every doubling of the link length, and the value of is approximately independent of link lengths. These trends had already been identified in [11].
Figure 2 shows the variation of the maximum values of spectral efficiency( as a function of the total link length. As seen, decreases in a linear fashion as a function of the link length, when plotted in a logarithmic scale. The spectral efficiency values were computed using Equation (8), which is derived under the hypothesis that the amplitude and phase of the signal at the channel input has an ideal Gaussian distribution, i.e. a continuous Gaussian constellation (GC). However, in real systems the input constellations are based on a set of discrete symbols. For a constellation with symbols, corresponding for example to a PM-M-QAM modulation format, the ideal spectral efficiency is given by in bit/s/Hz, where the 2 is due to the presence of two polarizations in the channel. Figure 2 also shows the ideal value of SE for different values of . The crossing points between each the modulation's SE and the Gaussian constellation' SE enables to evaluate an upper bound for the maximum reach achieved for each set of symbols (see Table 2).
The results of Table 2 clearly evidence the trade-off between the cardinality of the constellation (number of symbols) and the maximum reach: as the number of symbols increases, reach decreases significantly. For example, one observes a reach reduction between 75% to 80% when the number of symbols quadruple, i. e. when the spectral efficiency duplicates. This reduction, even reaches about 95% , when the number of symbols increases 16 times. The values of the maximum reach also decrease when the span length increases. By moving from= 80 km to = 100 km one observes a reach reduction of about 37 %. It is also worth mentioning the fact that the results given in Table 2 are closer to the results of Figure 2 of [17], despite these results having been obtained with a more rigorous approach. The current SE record of 17.3 bit/s/Hz was obtained using a modulation format with 4096 symbols and polarization multiplexing (PM-4096-QAM) over 50 km [18]. Another remarkable experimental result was the achievement of a SE of 14.1 bit/s/Hz at a reach of 500 km using PM-256-QAM) [19]. These two experimental results confirm the previously mentioned trend: a reduction in the reach by approximately 90% when the number of symbols increases by a factor of 16.
According to Equation (8) the optical channel capacity is related to the channel spacing which depends on the symbol rate , this is , with being the roll-off parameter of the modulation scheme. Therefore, the optical channel capacity can be defined as
Given that in the Nyquist limit , it can be concluded from Equation (10) that two strategies can be employed to increase : 1) Augmenting the spectral efficiency; 2) Increasing the symbol rate. The first strategy suffers from the limitations of spectral efficiency already referred. In this way, it is expected a huge reach reduction for increasing values of the capacity. To understand the tradeoffs between the two strategies Figure 3 plots the channel capacity as a function of link length for two values of (32 Gbaud and 64 Gbaud) using the data given in [20]. This data was computed using a channel spacing of 50 GHz for the 32 GBaud case and 75 GHz for the 64 Gbaud case. By examining this figure we confirm an approximate 80% reduction in reach when the doubling of the channel capacity's value is achieved by doubling the number of bits per symbol (doubling the spectral efficiency). On the other hand, when we achieved a doubling in capacity by doubling the symbol rate, we observed a reach reduction ranging between 30% to 40%. This behavior demonstrates that increasing the symbol rate exhibits a greater tolerance to ASE and NLI noises compared to enhancing spectral efficiency. These trends suggest that the optimal strategy for achieving greater optical channel capacities, especially in long-haul networks, is to prioritize increasing symbol rates rather than focusing primarily on spectral efficiencies. Of course, the increase in the symbol rates comes at the cost of requiring larger channel bandwidths, which in turn implies a reduction in the number of channels in DWDM transmission.
3. Link and Network Capacity
In an abstract way, an optical network can be described as a graph with } denoting a set of nodes and } denoting a set of links, where is the number of nodes and is the number of links. In transparent optical networks, all node functionalities (such as multiplexing, switching, routing) take place in optical domain, and the node structure is built upon WSSs. Meanwhile, an optical link represents a physical interconnection between two nodes, implemented using optical fibers and optical amplifiers, with these links supporting DWDM signals. Optical networks are designed using various physical topologies, such as mesh, ring, etc., with the goal of efficiently routing data among different nodes.
The capacity of an optical link is determined by both the capacity of individual optical channels and the count of optical channels, denoted as , that it can accommodate. This count is constrained by either the available bandwidth or the maximum output power of optical amplifiers. Specifically, is related to and the channel spacing through the equation , while is limited by the total power carried by channels, where . When considering the Nyquist limit (= and assuming that all the channels have the same modulation format and symbol rate, one can arrive by using (8) and (10) to the following expression for the link capacity:
where is evaluated through Equations (5)-(7).
Figure 4 plots the link capacity as a function of the channel power for four different symbol rate values. The primary conclusion drawn from this figure is that the maximum link capacity ( remains constant regardless of the symbol rate. However, this maximum capacity value shifts to higher power levels with increasing symbol rates. This trend is independent of the link length, although the maximum link capacity decreases when the link length increases. As seen, for , , while for we have . Table 3 presents several parameters in order to giving insight, including the optical channel power value that maximizes the link capacity ( for each symbol rate. Interestingly, the total optical power value remains the same for all the symbol rates. This value is equal to 19.6 dBm, which is well within the capabilities of commercial EDFAs. Furthermore, Table 4 gives an idea about some experimental results, reported in the literaturem for both the channel and links capacities for various symbol rates. In particular, the results for a symbol rate of 128 Gb/s are quite impressive, revealing values of 1.49 Tb/s and 52.1Tb/s for the channel and links capacities, respectively. However, a drawback of these results is the achieve distance of only 80 km.
Network capacity can be defined as the maximum amount of data that a network can handle per unit of time. This capacity depends on various network properties such as the physical and logical topology, link capacity, and node structure. The physical topology describes the interconnection pattern of nodes, while the logical topology defines how the information flows between the nodes.
A possible approach to address the issue of optical network capacity evaluation is to consider a logical full-mesh topology. In such a configuration, each node is logically connected to every other node within the network [27]. Under these circumstances, it is possible to find a path for each logical connection in the physical topology. Since there are multiple paths between each pair of nodes, the idea is to determine the shortest path using a heuristic like the Dijkstra's algorithm. The shortest path corresponds to the one that minimizes the total path length, defined as the sum of the weights (lengths) of all the links traversed by the path. Furthermore, it is possible to assume that each path (also denoted as lightpath) is established using an optical channel with a specific wavelength. In other words, a channel has an associated path and wavelength , and belongs to the set of optical channels required to implement a logical full mesh topology . In this case, one can apply the concepts of channel capacity introduced in Section 2 to compute the total network capacity, which can be written as [28]
where is the capacity of channel , which according to (8) and (10) becomes
with being the of channel . The can be readily evaluated using (5), assuming that the optical nodes do not significantly affect the calculations. In this context, the number of spans for channel is denoted as , with representing the length of . Another strategy, that although leading to a rough approximation permits the simplification of the analysis, consists in considering the dependency of the channel capacity on the reach as analyzed in Section 2. By considering this dependency, it becomes possible to determine a capacity value for each corresponding value of . An additional important metric for network analysis is the network-wide average channel capacity, defined as [13]
where denotes the expected utilization ratio of channel . For the sake of simplicity, it is assumed that for all . As a results, the sum in the denominator of (14) equals the total number of paths in the network, which for a full-mesh logical topology, amounts to With this simplification, the network capacity for a full-mesh logical topology reduces to
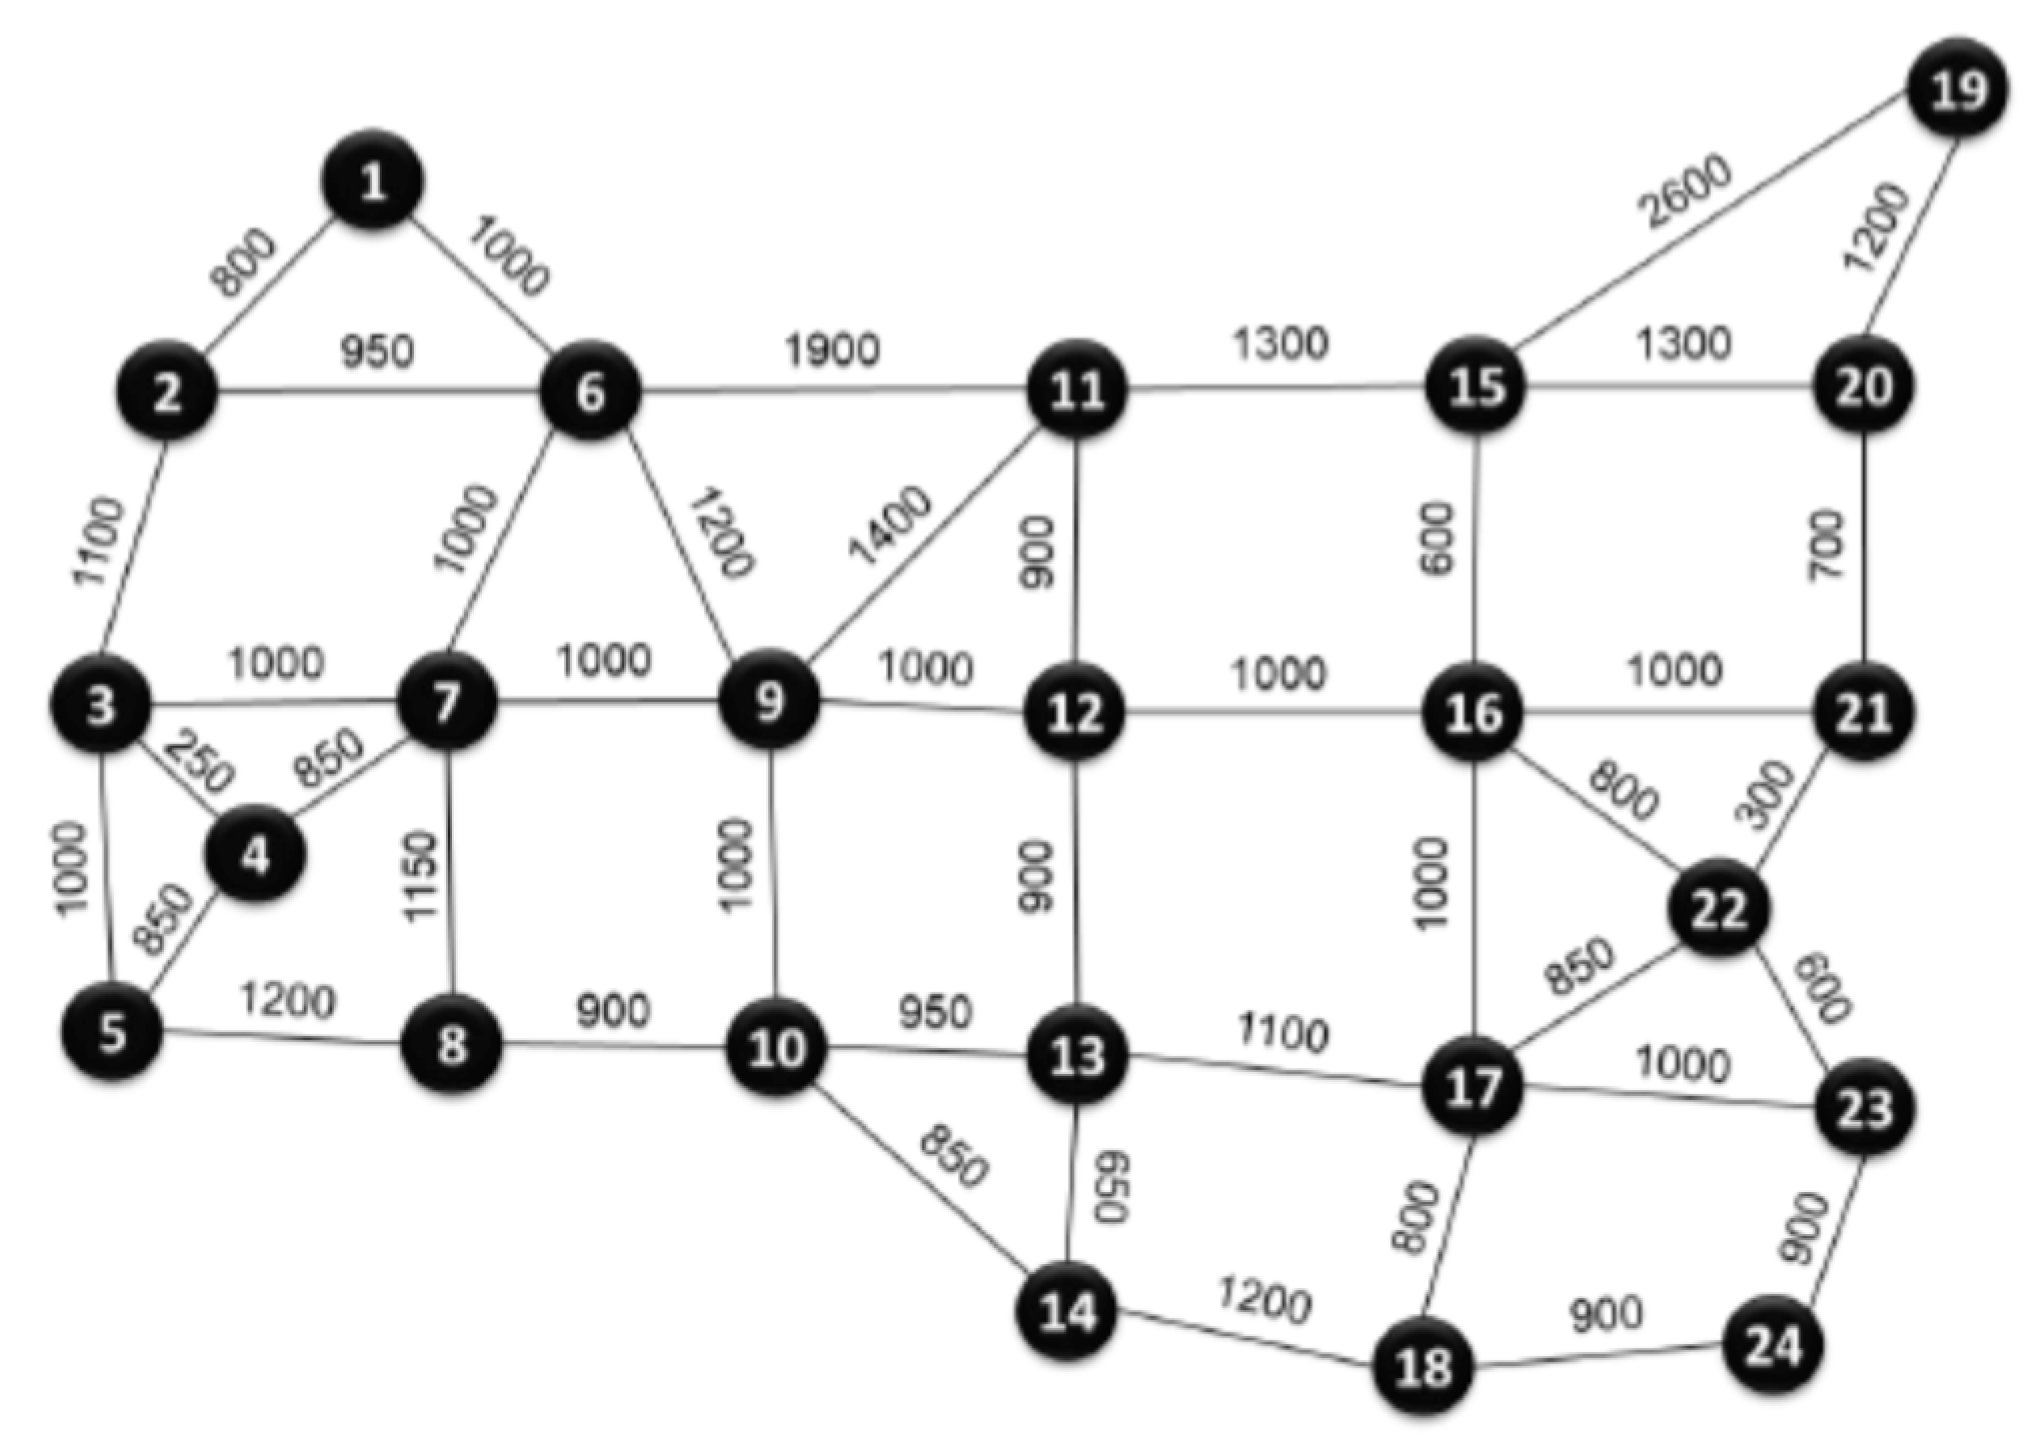
For illustrative purposes, Table 5 gives the values of and , along with other relevant network parameters, for the three network physical topologies given in Appendix A. Note that was computed using the reach values given in Figure 3 for a symbol rate of 64 Gbaud, while was obtained using Equation 15. As seen, the channel capacities in the COST239 network are higher than those in the other networks due to its shorter link and path lengths. On the other hand, the UBN network offers a significantly larger capacity compared to the other two networks, despite having the smallest value of . This is attributed to its capability to support a larger number of optical channels. In practice, the UBN network accommodates 552 optical channels, whereas the NSFNET supports 182 and COST239 supports 110.
4. Conclusions
This paper has revisited the problem of estimating the capacity of optical networks, giving attention not only to the channel capacity but also to link and network capacity.
After reviewing the fundamental principles of optical networks and describing the main physical impairments present in these networks, the calculation of spectral efficiency and optical channel capacity was carried out using the Shannon's theory, together with close-form equations available in the literature.
It was found that, although the maximum values of the spectral efficiency in real networks fall well short of the ideal values, the recent record result of 17.3 b/s/Hz achieved with M=4096 symbols (DM-4096QAM) came closer to the theoretical values. The paper also discussed the relationship between channel capacity and variations in the spectral efficiency and symbol rates. It showed that doubling the capacity through a two-fold increase in spectral efficiency leads to a 90% reduction in the reach (the maximum distance at which the signal can propagate while maintaining quality). Similarly, doubling the capacity by doubling the symbol rate results in reach reductions ranging from 30 to 40%.
The link capacity was also a focal point of our investigation. This capacity was determined by multiplying the optical channel capacity by the number of channels present in an optical fiber. While the experimental results were not on par with the theoretical predictions, a remarkable value of 52.1 Tb/s has recently been reported. Finally, the network capacity of three reference networks was computed. It was found that this capacity is mainly impacted by the path lengths and by the number of optical channels accommodated by the network.
Funding
This research received no external funding.
Data Availability Statement
Not applicable.
Conflicts of Interest
The authors declare no conflict of interest.
Appendix A
This appendix presents the physical topologies of three networks [29]:
Figure A1.
Physical topology of the COST239 Network (link lengths in km).
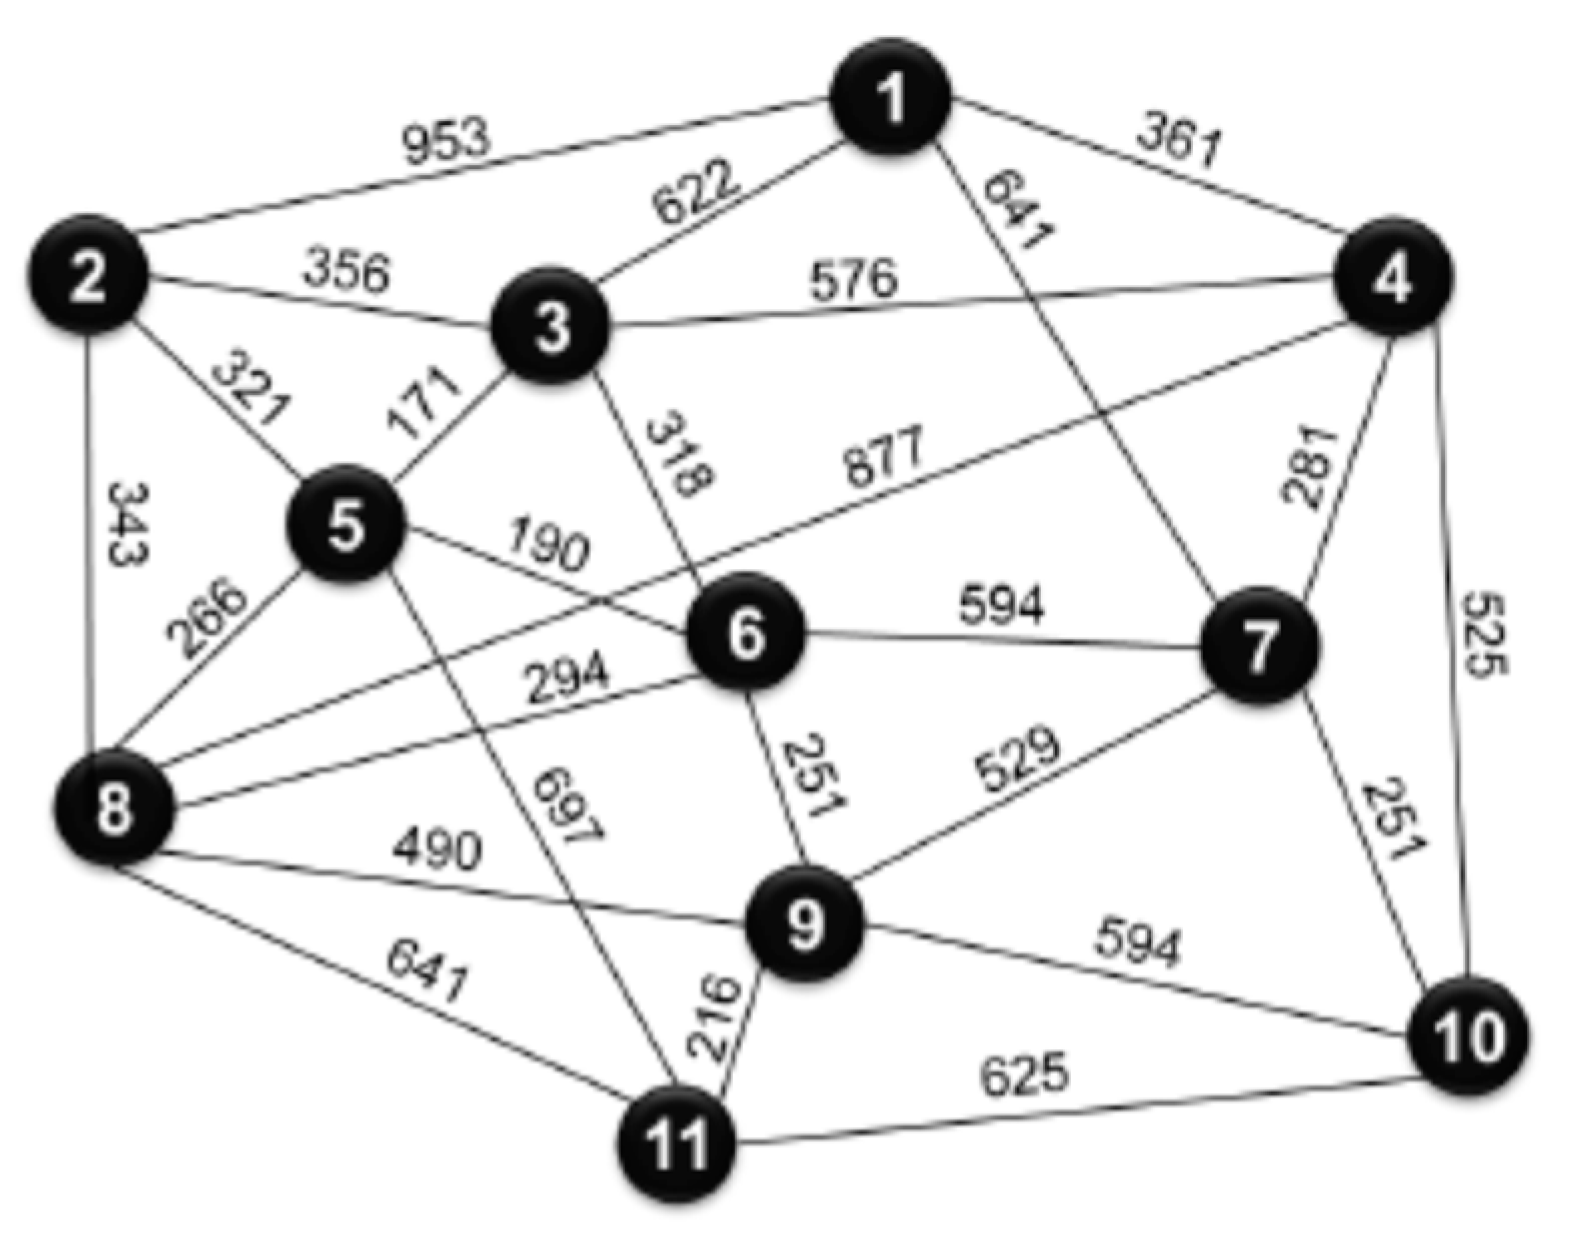
Figure A2.
Physical topology of the National Science Foundation Network (NSFNET) (link lengths in km).
Figure A2.
Physical topology of the National Science Foundation Network (NSFNET) (link lengths in km).
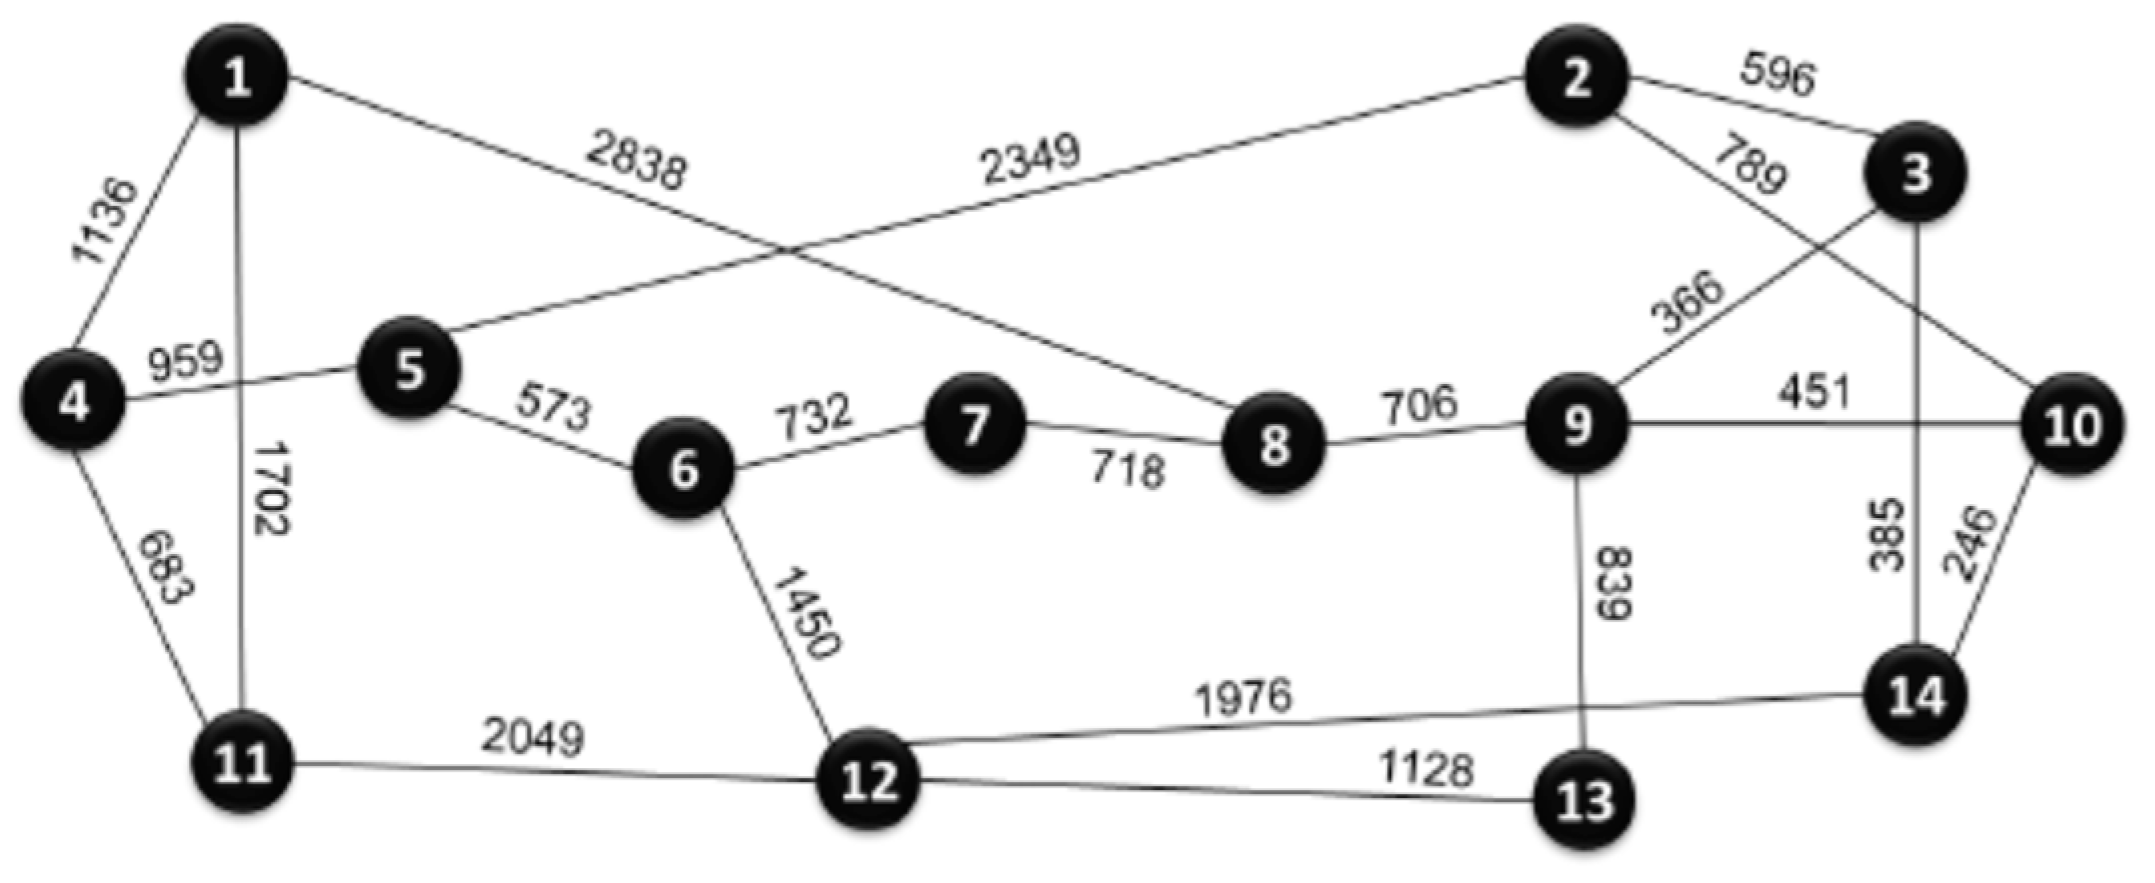
Figure A3.
Physical topology of the USA Backbone Network (UBN) ( link lengths in km).
References
- Winzer, P. J.; Neilson, D. T. From Scaling Disparities to Integrated Parallelism: A Decathlon for a Decade. J. Lightw.Technol. 2017, 35, 1099–1115. [Google Scholar] [CrossRef]
- Jia, Z.; Campos, L. A. Coherent Optics Ready for Prime Time in Short-Haul Networks. IEEE Network 2021, March/April, 8-14.
- Kao, K. C.; Hockham, G. A. Dielectric-fibre surface waveguides for optical frequencies. Proceedings of the IEE 1966, 113, 1151–1158. [Google Scholar] [CrossRef]
- Essiambre, R.-J.; Tkach, R. W. Capacity Trends and Limits of Optical Communication Networks. Proceedings of the IEEE 2012, 100, 1035–1055. [Google Scholar] [CrossRef]
- Winzer, P. J.; Neilson D., T.; Chraplyvy, A. R. Fiber-optic transmission and networking: the previous 20 and the next 20 years. Optics Express 2018, 26, 24190–24239. [Google Scholar] [CrossRef] [PubMed]
- Deng, N.; Zong, L.; Jiang, H.; Duan, Y.; Zhang, K. Challenges and Enabling Technologies for Multi-Band WDM Optical Networks. J. Lightw. Technol. 2022, 40, 3385–3394. [Google Scholar] [CrossRef]
- Shannon C., E. A Mathematical Theory of Communication. The Bell System Technical J. 1948, 27, 349–423, 626–656.
- Mitra, P. P.; Stark, J. B. Nonlinear limits to the information capacity of optical fiber communications. Nature 2001, 411, 1027–1030. [Google Scholar] [CrossRef] [PubMed]
- Essiambre, R.-J.; Kramer, G.; Winzer P., J.; Foschini G., J.; Goebel, B. Capacity limits of optical fiber networks. J. Lightw.Technol. 2010, 28, 662–701. [Google Scholar] [CrossRef]
- Ellis, A. D.; Zhao, J.; Cotter, D. Approaching the Non-Linear Shannon Limit. J. Lightw.Technol. 2010, 28, 423–433. [Google Scholar] [CrossRef]
- Bosco, G.; Poggiolini, P.; Carena, A.; Curri, V.; Forghieri, F. Analytical results on channel capacity in uncompensated optical links with coherent detection. Opt. Express 2011, 19, B438–B449. [Google Scholar] [CrossRef] [PubMed]
- Poggiolini, P; Bosco, G.; Carena A.; Curri, V.; Jiang Y.; Forghieri F. The GN-Model of Fiber Non-Linear Propagation and its Applications. J. Lightw.Technol. 2014, 32, 694–721.
- Souza, A.; Correia, B.; Costa, N.; Pedro, J.; Pires, J. Accurate and scalable quality of transmission estimation for wideband optical systems. Proc. IEEE 26th Int. Work. on Comp. Aid. Mod. and Design. of Comm. Links and Networks, 25-27 Oct. 2021. [Google Scholar]
- Matzner, R.; Semrau, D.; Luo, R.; Zervas, G.; Bayvel, P. Making intelligent topology design choices: understanding structural and physical property performance implications in optical networks. J. Opt. Commun. Netw. 2021, 13, D53–D67. [Google Scholar] [CrossRef]
- Carena, A.; Curri, V.; Bosco, G.; Poggiolini, P.; Forghieri, F. Modeling of the Impact of Nonlinear Propagation Effects in Uncompensated Optical Coherent Transmission Links. J. Lightw.Technol. 2012, 30, 1524–1539. [Google Scholar] [CrossRef]
- Poggiolini P; Carena, A.; Curri, V; Bosco, G.; Forghierim F. Analytical Modeling of Nonlinear Propagation in Uncompensated Optical Transmission Links. IEEE Photonics Technol. Lett. 2011, 23, 742–744.
- Gené, J. M.; Perelló, J.; Cho, J.; Spadaro, S. Practical Spectral Efficiency Estimation for Optical Networking. Proc. Int. Conf. Transp. Opt. Networ. Paper Tu.A3.1, Bucharest, Romania, 2-6 July 2023 .
- Olsson, S. L. I; Cho, J.; Chandrasekhar, S.; Chen, X. ; Burrows, E C.; Winzer, P. J. Record-High 17.3-bit/s/Hz Spectral Efficiency Transmission over 50 km Using Probabilistically Shaped PDM 4096-QAM. Proc. Opt. Fiber Commun. Conf., Paper Th4C.5, San Diego, California, USA, 11-15 March 2018. 15 March.
- Chandrasekhar, S.; Li, B.; Cho, J.; Chen, X.; Burrows, E. C.; Raybon, G.; Winzer, P. J. High-spectral-efficiency transmission of PDM 256-QAM with Parallel Probabilistic Shaping at Record Rate-Reach Trade-offs. Proc. Eur. Conf. Opt. Commun. Paper Th.3.C, Dusseldorf, Germany, 18-22, Sept. 2016.
- Zami, T.; Lavigne, B.; Bertolini, M. How 64 GBaud Optical Carriers Maximize the Capacity in Core Elastic WDM Networks with Fewer Transponders per Gb/s. J. Opt. Commun. Netw. 2019, 11, A20–A32. [Google Scholar] [CrossRef]
- Li, S.-A, et al. Enabling Technology in High-Baud-Rate Coherent Optical Communication Systems. IEEE Access 2020, 8, 2020.
- Chen, X.; Raybon, G.; Che D.; Cho, J.; Kim, K. W. Transmission of 200-GBaud PDM Probabilistically Shaped 64-QAM Signals Modulated via a 100-GHz Thin-film LiNbO3 I/Q Modulator. Proc. Opt. Fiber Commun. Conf. Paper F3C.5, São Francisco, Califórnia, USA, 6-10 June 2021.
- Yamazaki, H. et al. Transmission of 160.7-GBaud 1.64-Tbps Signal Using Phase-Interleaving Optical Modulator and Digital Spectral Weaver. Proc. Eur. Conf. Opt. Commun. Paper We3D.2, Basel, Switzerland, 18–22 Sep. 2022.
- Idler, A.; Buchali, F.; Schuh K., Experimental Study of Symbol-Rates and MQAM Formats for Single Carrier 400 Gb/s and Few Carrier 1 Tb/s Options. Proc. Opt. Fiber Commun. Conf. Paper Tu3A.7, Anaheim, California, United USA, 20-24 March 2026.
- Matsushita, A.; Nakamura, M.; Yamamoto, S.; Hamaoka, F.; Kisaka, Y. 41-Tbps C-Band WDM Transmission With 10-bps/Hz Spectral Efficiency Using1-Tbps/λ Signals. J. Lightw.Technol. 2020, 38, 2905– 2911.
- Buchali, F.; Aref, V.; Chagnon, M.; Dischler, R.; Hettrich, H.; Schmid, R.; Moeller, M. 52.1 Tb/s C-band DCI transmission over DCI distances at 1.49 Tb/s/λ. Proc. Eur. Conf. Opt. Commun. Paper Mo1E-4, Brussels, Belgium, 6-20 Dec., 2020.
- Pires, J. J. O.; O´Mahony, M.; Parnis, N.; Jones, E. Scaling limitations in full-mesh WDM ring networks using arrayed-waveguide grating OADMs. Electronics Letters 1999, 35, 73–75. [Google Scholar] [CrossRef]
- Matzner, R.; Semrau, D.; Luo, R.; Zervas, G.; Bayvel, P. Making intelligent topology design choices: understanding structural and physical property performance implications in optical networks [Invited]. J. Opt. Commun. Netw. 2021, 13, D53–D67. [Google Scholar] [CrossRef]
- Ribeiro, J. Machine Learning Techniques for Designing Optical Networks to Face Future Challenges. MSc Thesis, on Electrical and Computer Engineering, IST, University of Lisboa, Lisboa, Portugal, June 2023. [Google Scholar]
Figure 1.
Spectral efficiency versus channel power for various link lengths: (a) Span length of 80 km; (b) Span length of 100 km.
Figure 1.
Spectral efficiency versus channel power for various link lengths: (a) Span length of 80 km; (b) Span length of 100 km.
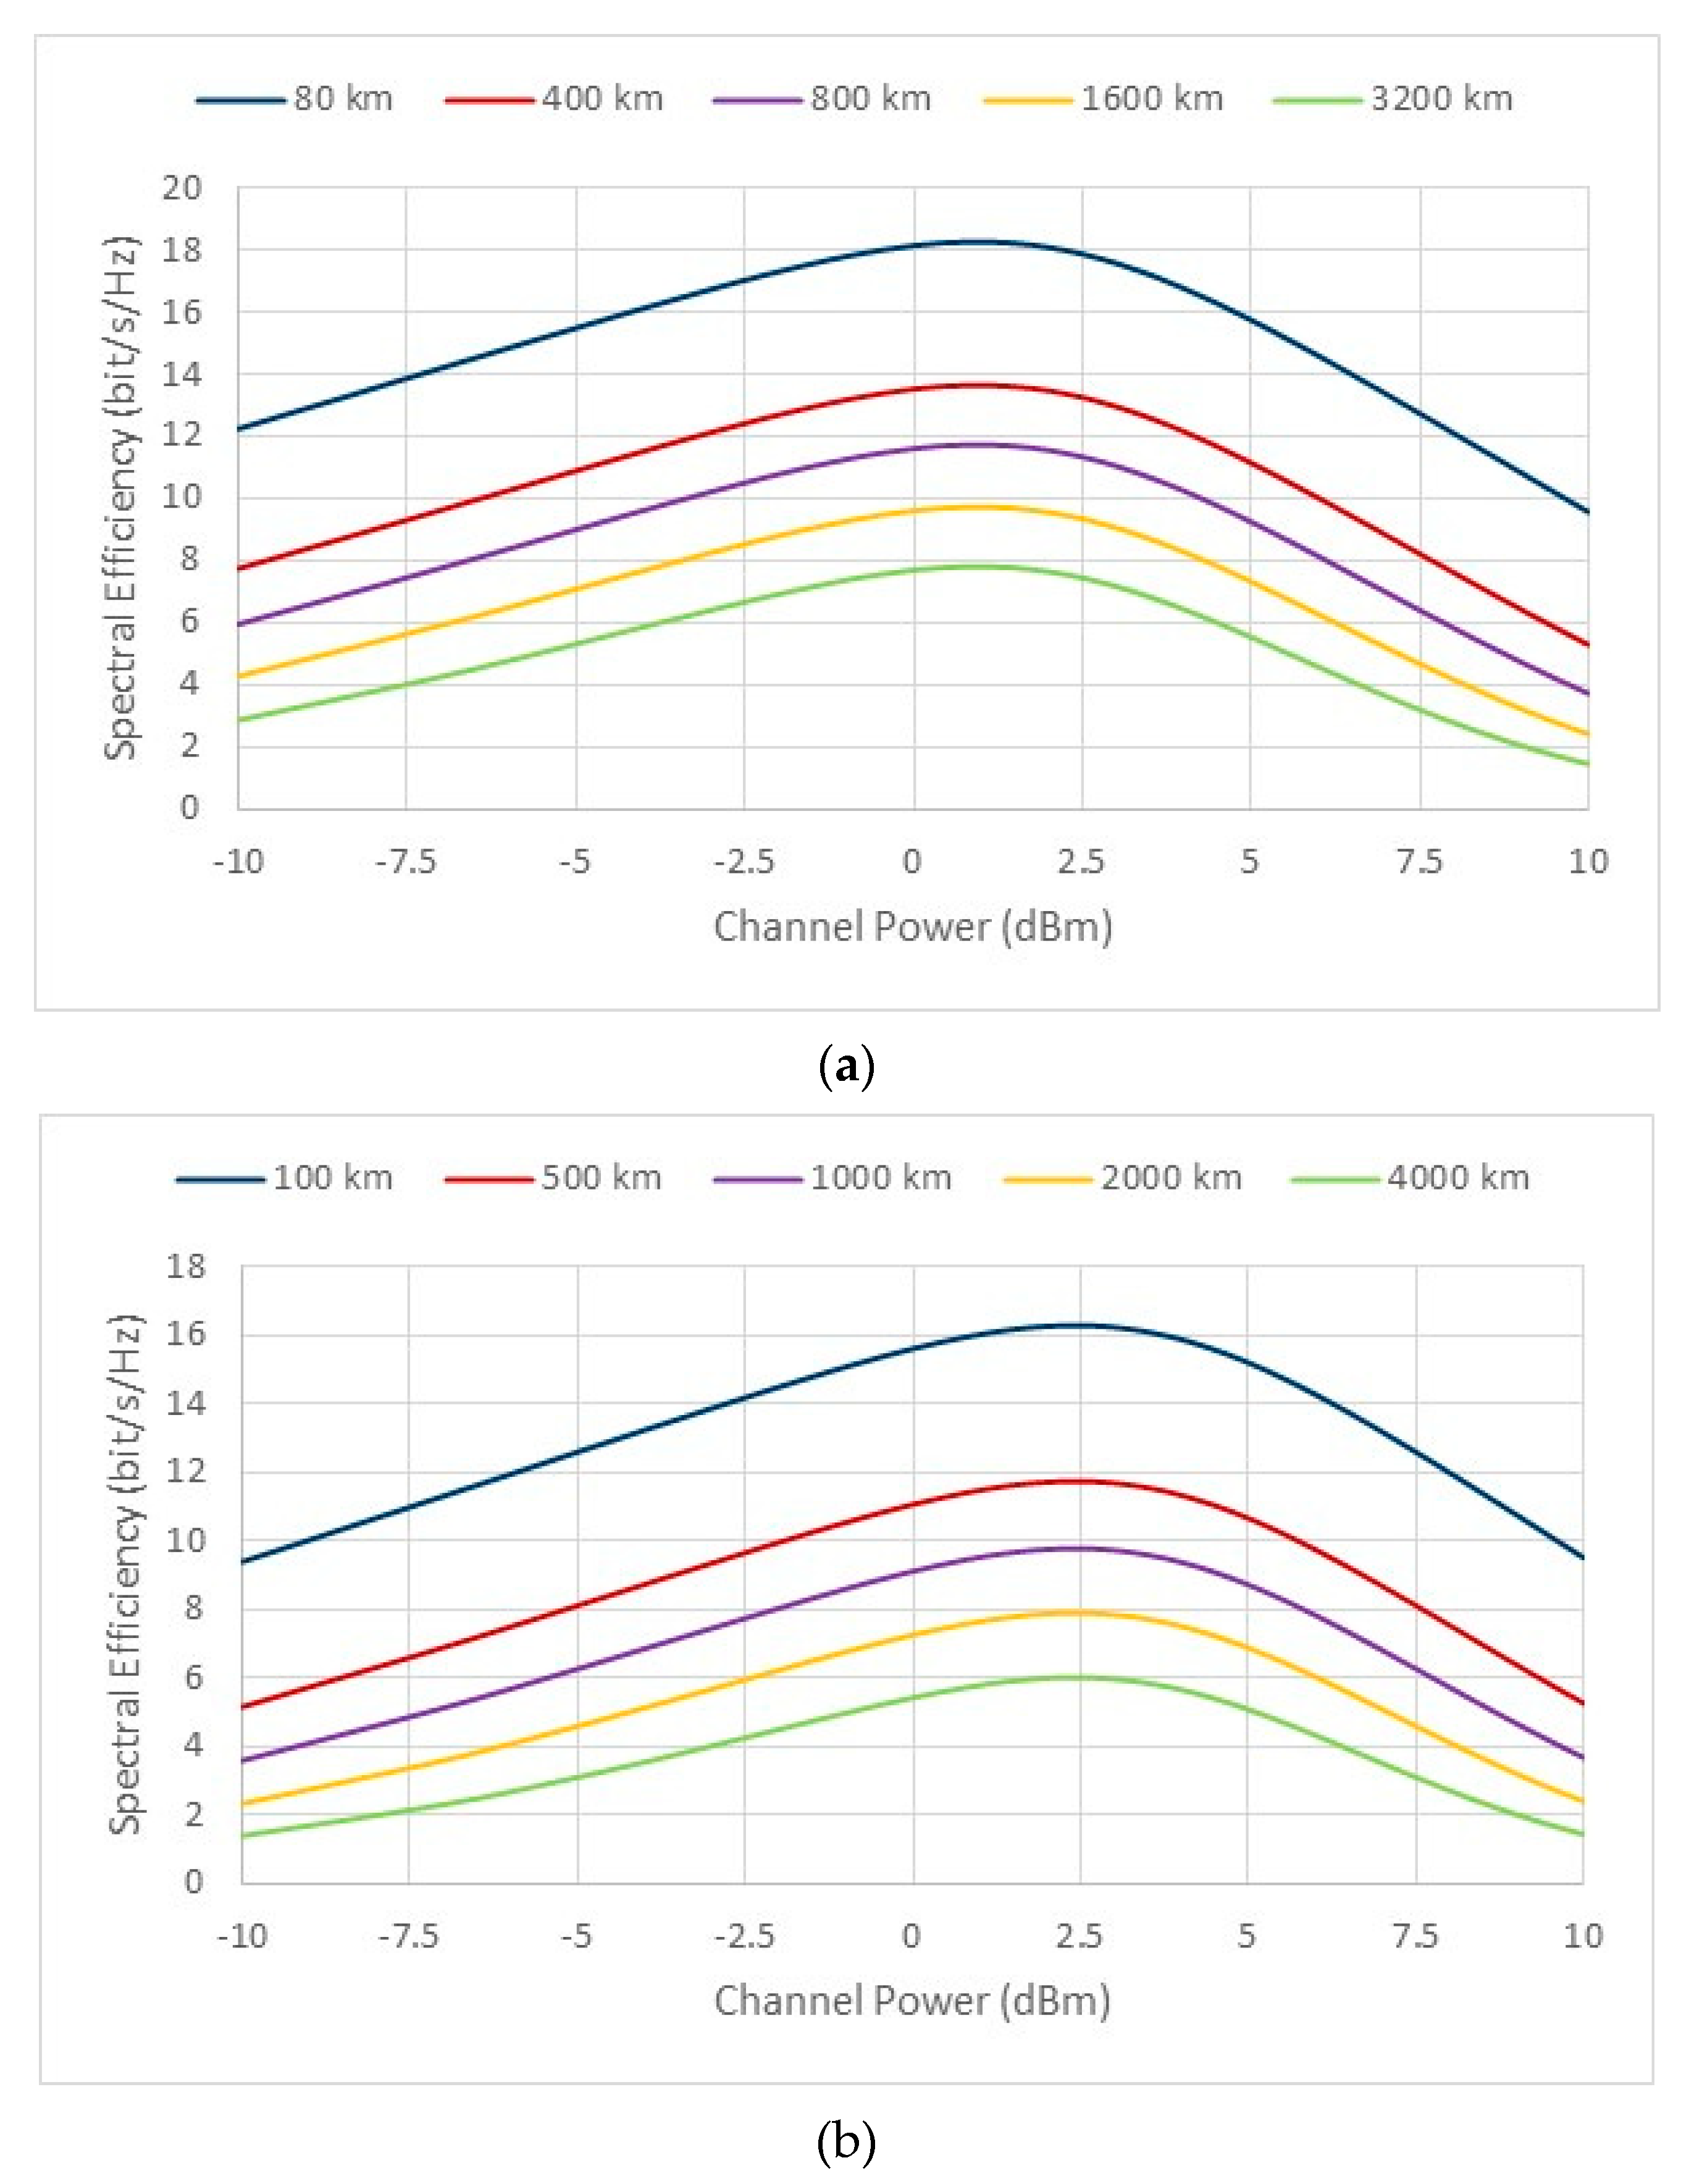
Figure 2.
Maximum value of the spectral efficient (
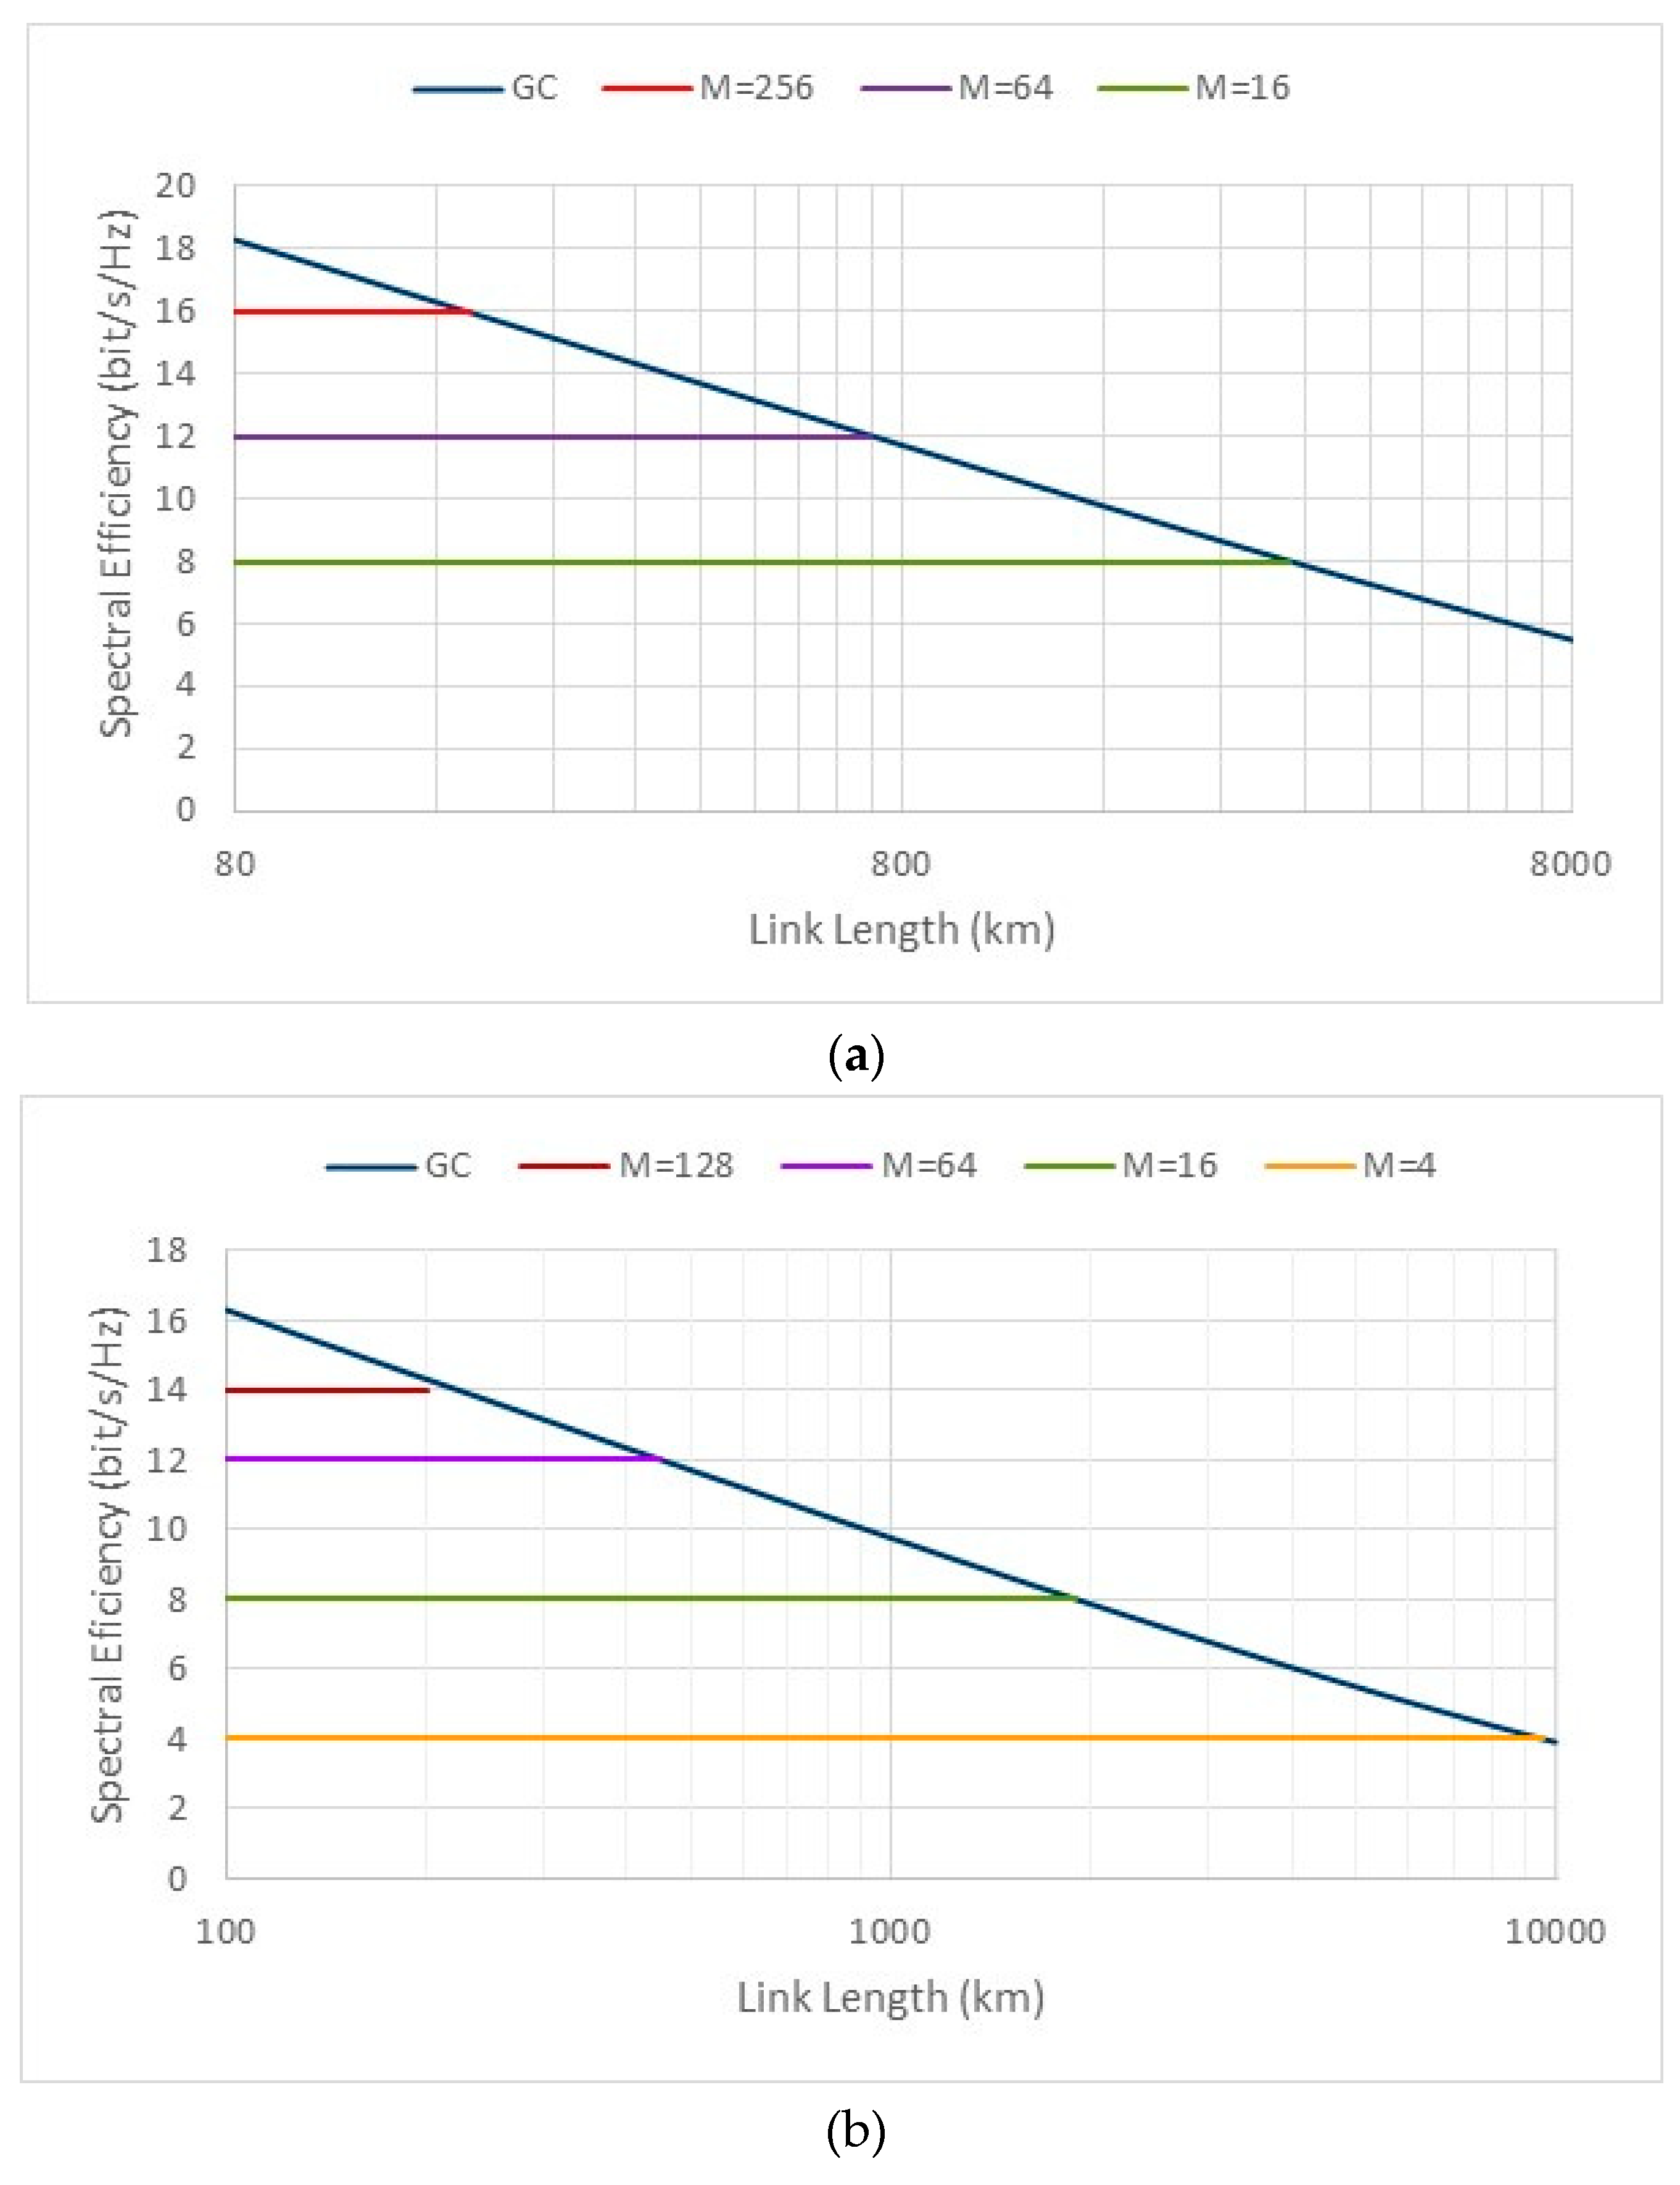
Figure 3.
Channel capacity as a function of link length for two values of the symbol rate (data obtained from [20]).
Figure 3.
Channel capacity as a function of link length for two values of the symbol rate (data obtained from [20]).
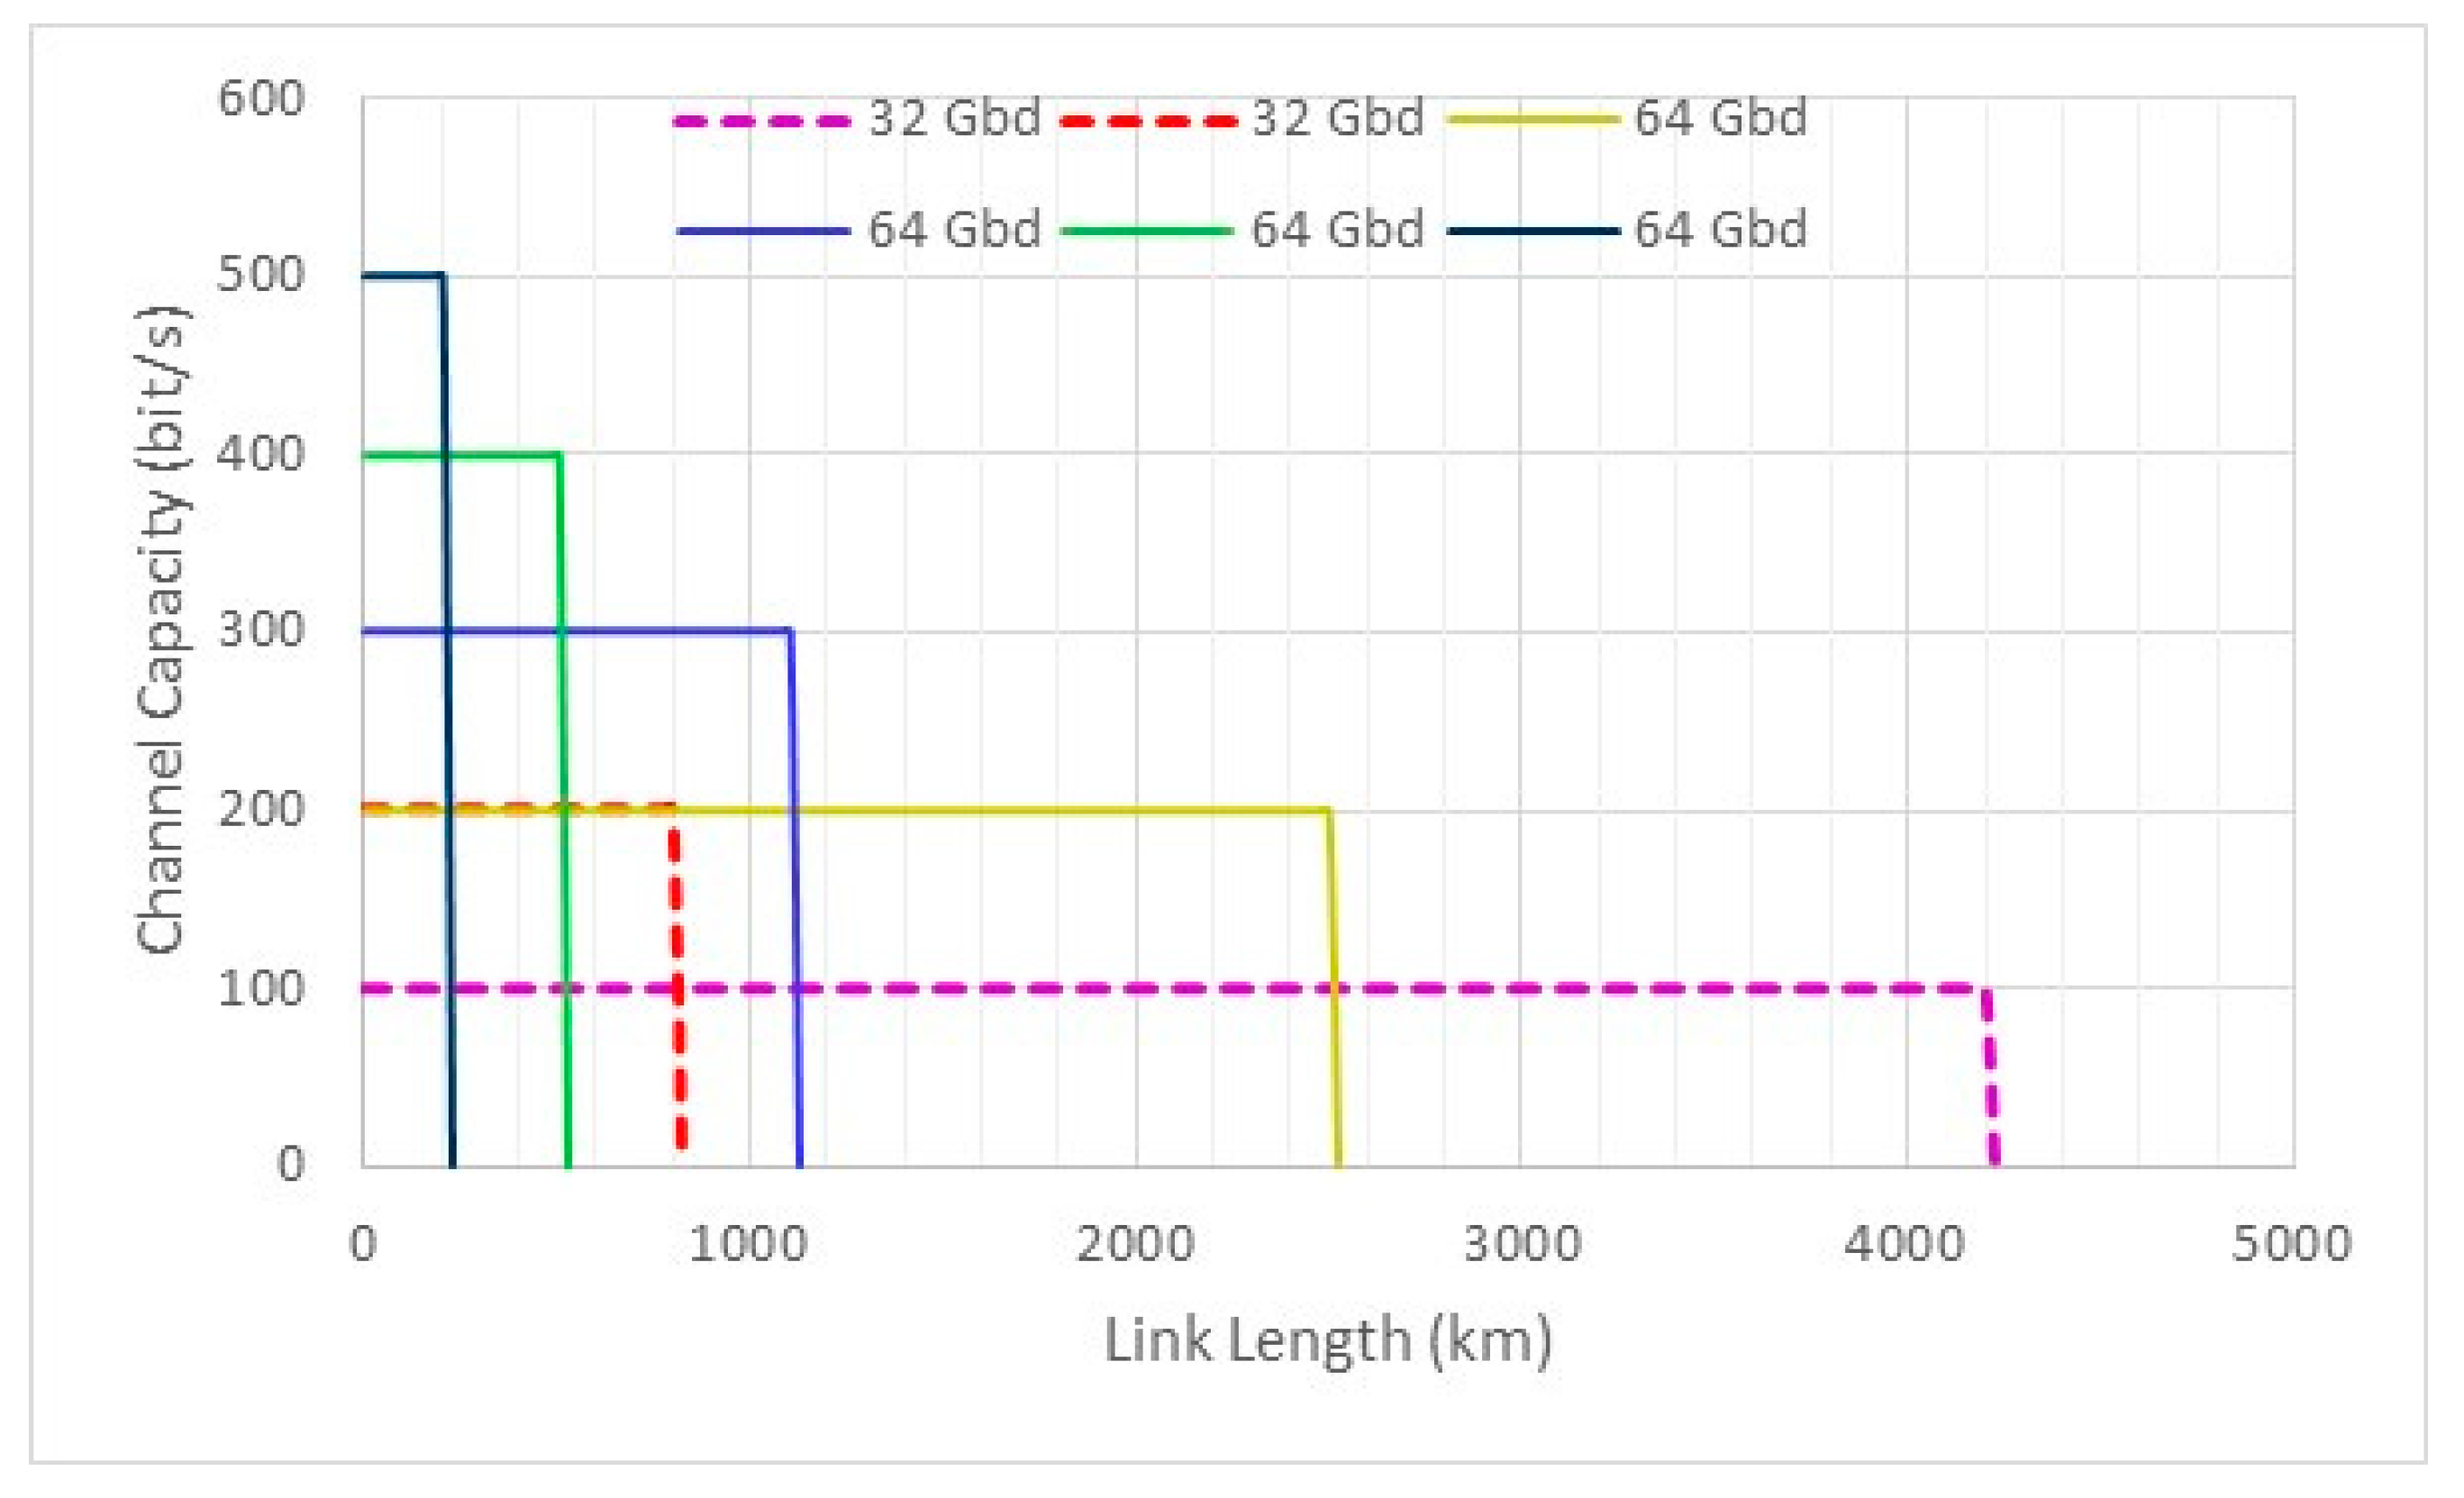
Figure 4.
Link capacity versus the optical channel power for various symbol rates. (a) Link length of 400 km; (b) Link length of 800 km.
Figure 4.
Link capacity versus the optical channel power for various symbol rates. (a) Link length of 400 km; (b) Link length of 800 km.
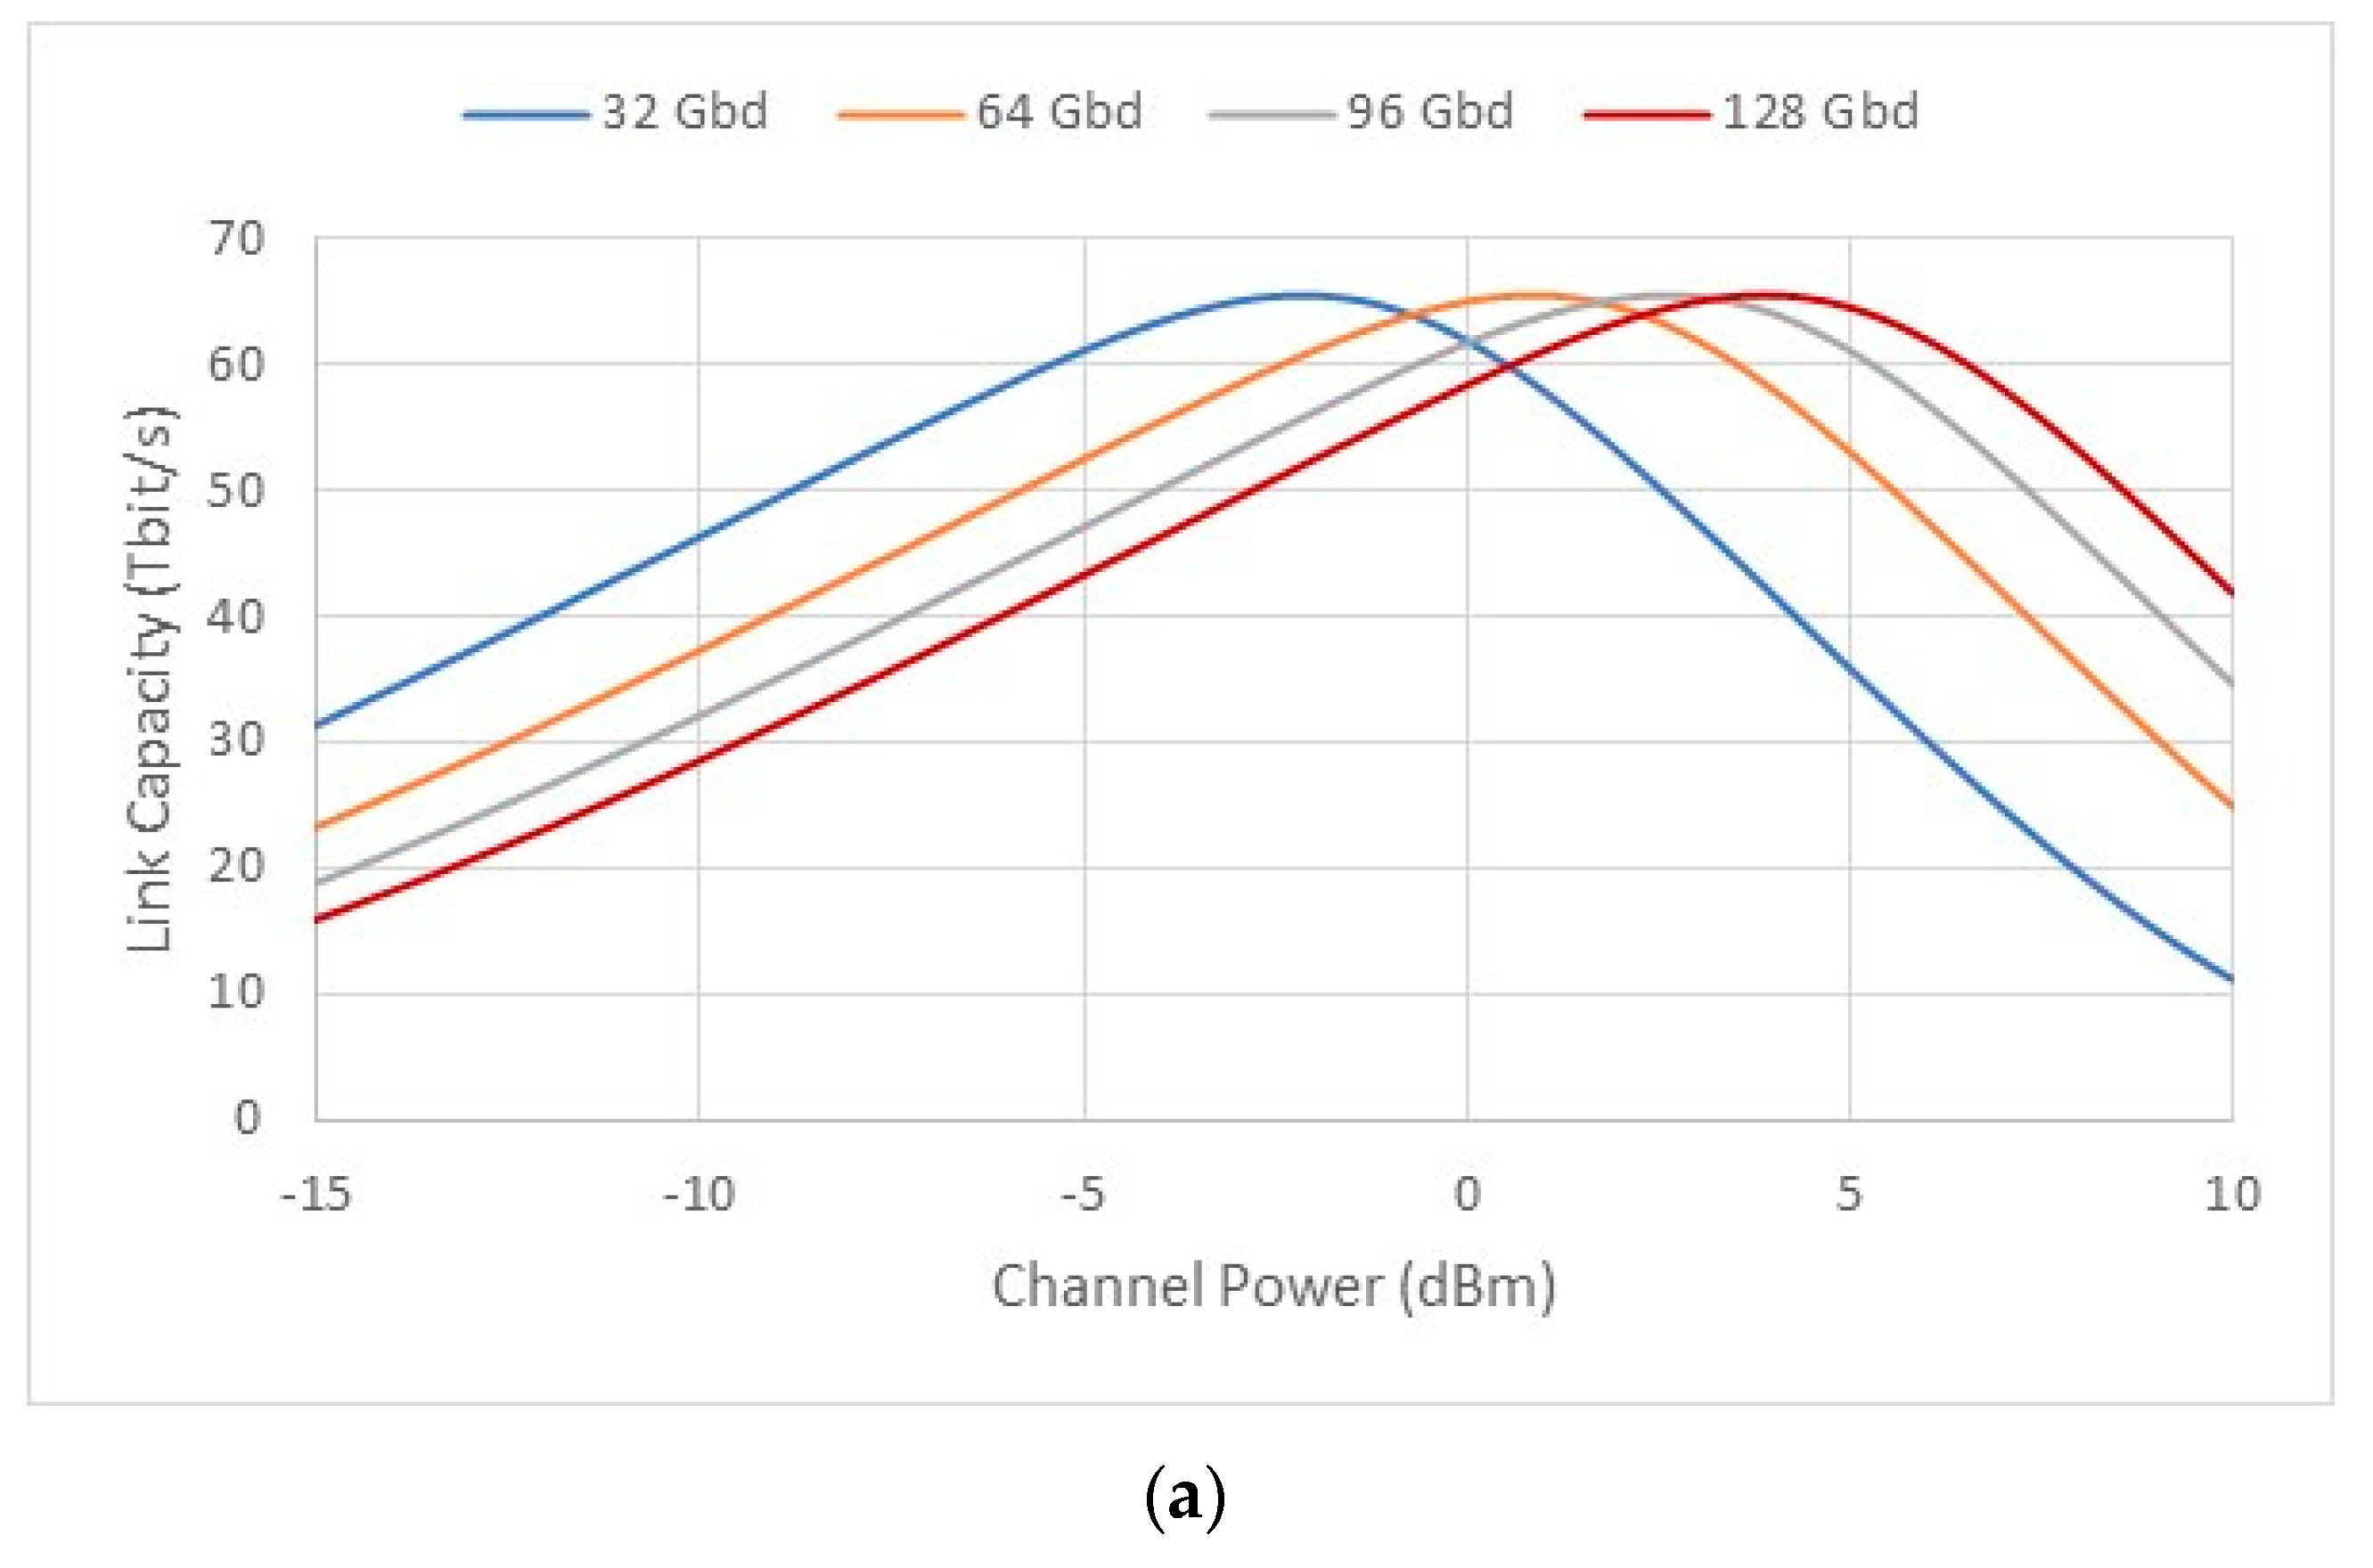
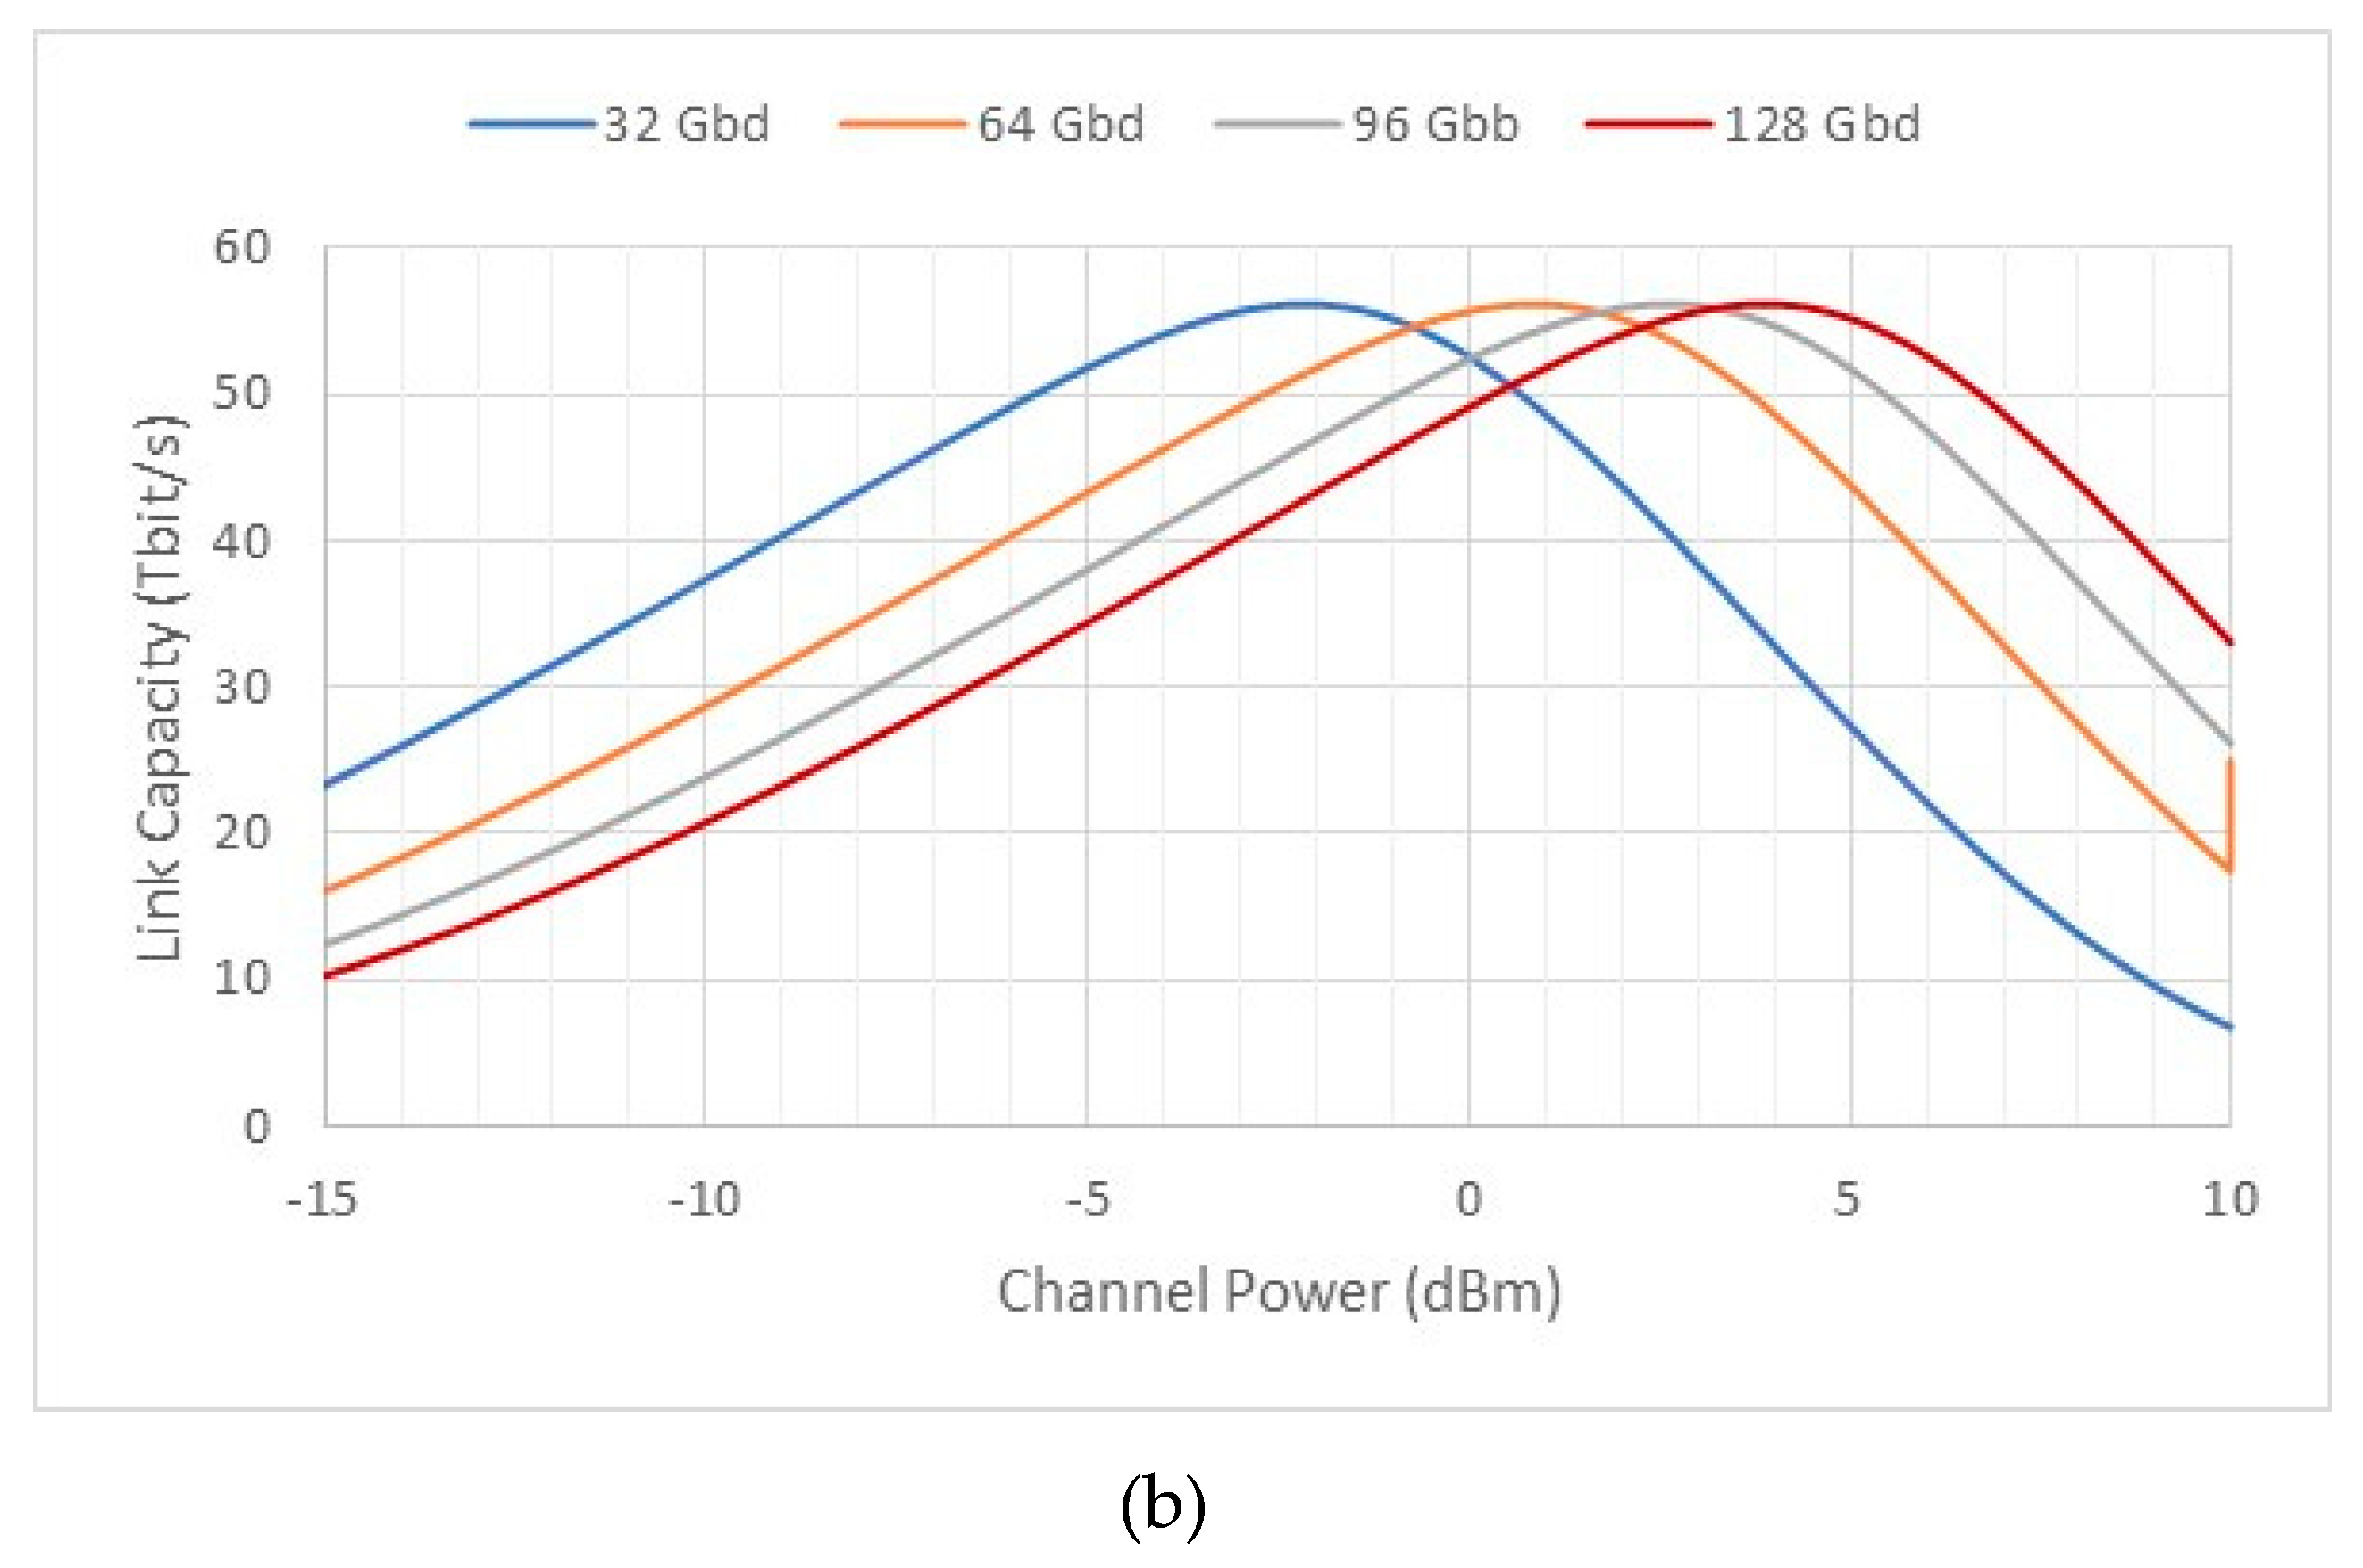

Table 1.
Optical fiber and system parameters.
| Parameter | Symbol | Value |
| Fiber Attenuation Coefficient | ||
| Fiber Dispersion Parameter | ||
| Fiber Nonlinear Coefficient | ||
| Carrier Frequency | ||
| Carrier Wavelength | ||
| Span length | ||
| EDFA noise figure | ||
| Symbol rate | ||
| Channel Spacing | ||
| Number of Channels | ||
| WDM bandwidth |
Table 2.
Values of the reach as a function of the number of symbols for a PM-M-QAM scheme.
| Number of Symbols (M) |
Reach (km) = 80 km |
Reach (km) = 100 km |
| 4 | 15100 | 9500 |
| 16 | 3020 | 1900 |
| 64 | 720 | 450 |
| 128 | 360 | 225 |
| 256 | 180 | -------- |
Table 3.
Channel capacities and optical powers per channel.
|
Symbol rate (Gbaud) |
(Tb/s) |
(Tb/s) |
(dBm) | (dBm) | |
| 32 | 150 | 0.437 | 0.374 | -2.15 | 19.61 |
| 64 | 75 | 0.875 | 0.748 | 0.89 | 19.64 |
| 96 | 50 | 1,312 | 1,122 | 2.65 | 19.64 |
| 128 | 37 | 1.773 | 1.516 | 3.89 | 19.57 |
Table 4.
Published experimental results for the channel and links capacities.
|
Symbol (Gbaud) |
|
(b/s/Hz) |
(Tb/s) |
(Tb/s) |
L (km) | Ref. | ||
| 32 | 117 | 4400 | 37.5 | 6.7 | 0.250 | 29.3 | 1600 | [24] |
| 64 | 59 | 4400 | 75 GHz | 6.7 | 0.500 | 29.5 | 650 | [24] |
| 96 | 41 | 4100 | 100 | 10 | 1 | 41 | 100 | [25] |
| 128 | 35 | 4800 | 137.5 | 10.85 | 1.49 | 52.1 | 80 | [26] |
Table 5.
Network parameters.
| Networks |
Number Nodes (N) |
Number Links (L) |
Avg Link Length (km) |
(Gb/s) |
(Tb/s) |
| COST239 | 11 | 26 | 462.6 | 387.4 | 42.6 |
| NSFNET | 14 | 21 | 1211.3 | 286.2 | 52.1 |
| UBN | 24 | 43 | 993.2 | 270.1 | 149.1 |
Disclaimer/Publisher’s Note: The statements, opinions and data contained in all publications are solely those of the individual author(s) and contributor(s) and not of MDPI and/or the editor(s). MDPI and/or the editor(s) disclaim responsibility for any injury to people or property resulting from any ideas, methods, instructions or products referred to in the content. |
© 2023 by the authors. Licensee MDPI, Basel, Switzerland. This article is an open access article distributed under the terms and conditions of the Creative Commons Attribution (CC BY) license (http://creativecommons.org/licenses/by/4.0/).
Copyright: This open access article is published under a Creative Commons CC BY 4.0 license, which permit the free download, distribution, and reuse, provided that the author and preprint are cited in any reuse.


