Submitted:
30 April 2024
Posted:
01 May 2024
Read the latest preprint version here
Abstract
This study investigated the adaptability of Dunaliella salina to different salinity levels, with emphasis on growth, pigment concentration, and desalination potential. It was found that among the 21 salinity levels (0-20%), 75‰ salinity produced consistently favorable results in cell count (13.08 x 10³ ± 1.41 x 10³ cells/mL), dry biomass (2.46 ± 0.06 g/L), pigment content (chlorophyll a = 9.75 ± 0.01 µg/L, chlorophyll b = 12.36 ± 0.03 µg/L), and desalination (9.32 ± 0.47 % reduction). Therefore, 75‰ salinity level was selected for the final trial (scale-up), which revealed unanticipatedly high cell counts (58.96 x 10³ ± 535.22 cells/mL), with dry biomass weight being statistically extremely different (higher) than the expected (4.21 ± 0.02 g/L) (p<0.0001), most likely due to high cell count and energy reserve storage for high salinity adaption in the form of bio-compounds. Pigment growth continued (chlorophyll a = 9.54 ± 0.2 µg/L, chlorophyll b = 12.81 ± 0.51 µg/L), indicating pigment production under salt stress. Notably, desalination did not occur in this stage, possibly due to the necessity for a bigger initial inoculate, prolonged exposure or bioaccumulation becoming the prevailing mechanism over desalination. Despite this, the microalgae thrived in high salinity conditions. These findings point to further study into the mechanics of salt build-up within cells, which might lead to successful desalination technologies. Dunaliella salina adaptation to high salinity settings suggests its possible usage in natural pools or soils that are normally inappropriate for traditional production, giving a chance for enterprises to function in rough extreme salinity conditions.
Keywords:
Dunaliella salina
; Desalination
; Upscaling
; Pigment
; Dry biomass
; Cell count
1. Introduction
Water plays a pivotal role in driving economic and social development [1]. In current times, the world faces a range of water-related challenges, including limited access to freshwater, declining water quality, reduced financial resources, and fragmented water management efforts [2]. Water scarcity not only hinders economic development but also poses significant threats to human health, environmental degradation, and political stability [3,4,5]. Nations from arid environments are already experiencing water crisis and it is expected to worsen with population rates and expansion of industrial and agricultural sectors, resulting in a higher demand, raising cost of water and intensifying competition for the resource across various sectors [6]. These nations may see desalinating saline water from rivers and seas as an unavoidable solution for meeting water supply needs [7,8,9,10].
To address the growing demand for freshwater, it has become increasingly important to explore alternative solutions. One such solution is saltwater desalination, which has emerged as a crucial method to ensure a sustainable future for generations worldwide. In recent years, there has been considerable attention focused on the potential and possibilities of desalination technology in addressing the global water scarcity crisis [10]. In its simplest form, this technology has the potential to significantly mitigate water scarcity by tapping into limitless reserves of seawater and abundant reserves of brackish groundwater as new sources of freshwater supply.
Using algae to treat water for diverse applications is an innovative cost-efficient approach. This proposed solution holds the potential to address the challenge of minimal expense desalination [11,12]. These microorganisms are incredibly diverse, ranging from tiny single-celled organisms to larger, more complex species that can thrive in a wide range of environments, from different aquatic environments to arid environments [13]. Most algae species exhibit a capacity to thrive in saline waters that are saturated with water-soluble substances [14]. Through this process, these living organisms, whether plant or animal, assimilate water salts along with other nutrients into their biomass, ultimately decreasing the salt content in the water due to this absorption [15,16]. Some organisms tend to absorb more water-soluble substances than they require for their nutritional needs, making them effective in reducing water salinity [17].
The desalination or reduction of water salinity through biological means involves the utilization of various macrophytes (aquatic plants), microphytes (algae), microorganisms, or their combinations, which has been reported to lower water salinity [18]. Unlike typical terrestrial plants, algae can complete their life cycle across a wide range of salinity levels. Microalgae, for instance, have been employed for many years in tertiary wastewater treatment to remove nitrogen and phosphorus compounds following a reduction in BOD (Biochemical Oxygen Demand) and COD (Chemical Oxygen Demand) levels [19]. Numerous microalgae, including species like Scenedesmus obliquus, are mixotrophic, meaning they can utilize both organic matter and minerals during their growth process. This characteristic enables them to serve as an alternative secondary treatment method, effectively reducing organic matter and nutrient content [20].
Dunaliella salina, a species of microalgae, has shown remarkable resilience to high salinity levels and are commonly found in saline environments like lakes and saltwater lagoons. The findings suggest that the effectiveness of this algae in high salinity conditions can be harnessed to reduce the salinity of various water sources, including seawater, sewage, and industrial wastewater recycling. Overall, bibliography indicates that the utilization of algae can be advantageous for mitigating water salinity. It's worth noting that fluctuations in physical and chemical factors, such as salinity, have substantial impacts on the growth and biochemical composition of green microalgae [13,14,16].
D. salina belongs to the Chlorophyceae category, the Volvocales order, and the Chlorophyta branch. Initially, these microalgae were categorized under the family Polyblepharidaceae. However, owing to their resemblance to Chlamydomonas algae, they were subsequently reclassified into the Chlamydomonadaceae family [21]. Still, there are not many studies that shows how the microalgae reacts to different salinities, from none to extremely salty.
This study aims to fill in the gap in literature regarding D. salina response to high salinity in terms of culture growth, pigment concentration and desalination. Exploring the possibility of this microalgae being fit to use in desalination of salty sludges or waters, and if this culturing environment could implement a biorefinery approach in terms of productivity changes implemented by the salty conditions.
2. Materials and Methods
2.1. Sample Preparation for the Preliminary Trial
For the preliminary trial, conical flasks with 150mL of ASN-III media [22] (3.5g MgSO4 x 7H2O, 2g MgCl2 x 6H2O, 0.5g CaCl2 x 2H2O, 0.5g KCl, 3mg citric acid, 3mg fe-Amm-Citrate, 0.5mg EDTA, 1mL A5 trace metals mix, 0.75g NaNO3, 0.75g K2HPO4 x 3H2O, 0.02g Na2CO3, 1000 mL Deionized Water and NaCl) were prepared and each had a different salinity (Table 1). Every bioreactor was inoculated with 20mL of D. salina (CCAP 19/20, from Culture collection of algae and protozoa) solution (25x104 cells per mL) previously cultivated in its normal salinity range. All bioreactors were placed in a seesaw rocker with constant rocking motion, light intensity of 2300 Lux, and light/dark cycle of 14:10.
2.1.2. Salinity Assessment
A refractometer (Autoutlet, China) was used to measure salinity [23]. No-salt ASN-III media was used to calibrate the refractometer. A sample volume of 1.5 mL was collected and subsequently centrifuged at 3500 rpm for 5 minutes to ensure the microalgae cells would not interfere with the salinity measurement. The supernatant was collected, and salinity assessed in the refractometer.
2.1.3. Cell Counting
Cell counting was performed with a flow cytometer (MACSQuant, Germany). Gating strategy was based on photosynthetic pigment chlorophyll and FITC channel used to count viable cells.
2.1.4. Dry Weight Assessment
To measure dry weight of microalgae per liter, 20mL of the culture were placed in a 50mL vial tube, pre-weighed empty. The solution was centrifuged at 3500rpm for 10min and supernatant discarded. The tube with the formed pellet was placed to dry overnight at 60°C and the next day would be weighed. The resulting difference observed showed us the dry weight of cells per 20ml of solution. By multiplying this number by 50, we would obtain the weight of dry biomass per liter of solution (g/L) [24].
2.1.5. Chlorophyll Assessment
To quantify chlorophyll a and b, procedures described by Caspers, 1970 were used[25]. A 2ml sample of the cell solution was collected and placed into a 15ml tube already containing 5ml of acetone/water (9:1). This mixture was vortexed and then centrifuged at 3000 x g for 3 minutes. The resulting supernatant was analyzed using a spectrophotometer at wavelengths of 630nm, 647nm, and 664nm. The following equations were employed to convert the absorbance values into concentration measurements (µg/L) [26]:
Chlorophyll a = (11.85 * DO664) + (-1.54 *DO647) + (-0.08 * DO630)
Chlorophyll b = (-5.47 * DO664) + (21.03 * DO647) + (-2.66 * DO630)
2.2. Upscaling
For the final trial, after checking the preliminary results, a chosen salinity was upscaled to a 5L bioreactor. This bioreactor was prepared with constant magnetic stirring at 120 rpm, air flow into an airstone (1.8L/minute) and light intensity of 2300 Lux with a light/dark cycle of 14:10. Salinity, cell count, dry weight and chlorophyll assessments were conducted all throughout the trial (initially every 30 min, then daily).
2.3. Statistical Analysis
Statistical analysis was performed using one-way analysis of variance (ANOVA) with a Tukey Post hoc test to determine differences. The software used to perform statistical analysis was Graphpad PRISM v.8.0.2 for Windows. All data collected in this study were expressed as mean ± standard deviation. Difference significances were attributed as follows: Not significant (ns: p≥0.05), Significant (*: p=0.01 to 0.05), Very significant (**: p= 0.001 to 0.01) and extremely significant (***: p= 0.0001 to 0.001, and ****=p<0.0001).
3. Results
3.1. Initial Trial
After 14 days, the cultures in the initial trial were analyzed and the results for salt removal (a), cell count (b), dry biomass (c), chlorophyll a (d), and chlorophyll b (e) are presented in Figure 1.
Desalination was measured in percentage of salt removed. The best desalination was in salinity 60‰ (11.67‰ ± 0.58), followed by 83‰ (10.67‰ ± 0.58) and 75/83‰ (9.33‰ ± 0.58). Desalination in the salinity levels of 105, 110, 124, 134, 140 and 144‰ did not occur. This was expected for such a high salt level, being that even the desalinations achieved in salinities 120‰ (1.58‰ ± 0.47) and 165‰ (1.44‰ ± 0.94) were not significant.
When analyzing the cell count results, salinities close to 2.5% were expected to be among the highest due to it being the traditionally used salinity for D. salina media [22]. This was indeed observed for the 27‰ salinity culture, obtaining a much higher cell count than the others, showing statistically significant differences from all other bioreactors in this regard. Besides this, salinities 9‰ (11.6 x 10³ ± 140 cells/L), 35‰ (14.2 x 10³ ± 320 cells/L), 75‰ (13 x 103 ± 1408 cells/L), 96‰ (14.6 x 10³ ± 544 cells/L), 124‰ (15.3 x 10³ ± 1882 cells/L) and 144‰ (10 x 103 ± 753 cells/L) all presented cell counts above 10 x 103 cells per milliliter. This proves these salinities can be used for culturing, being that salinities 9, 35, 75, 96 and 124‰ show no statitically significant differences.
As for dry biomass, the highest cell count culture (salinity 27‰) obtained an acceptable value of 1.56g of dry biomass per liter of culture. Salinities 67‰ (2.01 ± 0.016 g/L), 75‰ (2.46 ± 0.056 g/L), 87‰ (2.06 ± 0.003 g/L), 96‰ (2.33 ± 0.014 g/L), 103‰ (2.2 ± 0.077 g/L) and 105‰ (2.01 ± 0.037 g/L) all surpassed the 2 g/L mark. Salinity 75‰ expressed the maximum value of this trial with 2.4g/L, presenting no significant differences from salinities 96‰ and 103‰ (second and third highest values) while being significantly statistically different from all other bioreactors. Salt concentration and user error when washing the cells of salt may be involved in such discrepancy.
Pigment assessment exhibited interesting results since there is a clear pattern with 3 peaks in pigment productivity; these are shown at salinity 9‰ (chlorophyll a: 11.69 ± 0.014 µg/L, b: 13.62 ± 0.012 µg/L), 75‰ (chlorophyll a: 9.75 ± 0.012 µg/L, b: 12.36 ± 0.028 µg/L) and 124‰ (chlorophyll a: 7.07 ± 0.015 µg/L, b: 8.83 ± 0.038 µg/L). The highest peak observed was at salinity 9%o, expressing significant differences from all other bioreactors. The second highest peak was shown in salinity 75, also demonstrating statistically significant differences from all other bioreactors. When taking into consideration the ammount of pigment per number of cells, the most productive salinities were 9‰ (0.000001008 µg/cell, of chlorophyll a; 0.000001175 µg/cell, of chlorophyll b), 19‰ (0.000001025 µg/cell, of chlorophyll a; 0.000001308 µg/cell, of chlorophyll b), 67‰ (0.000000927 µg/cell, of chlorophyll a; 0.000001159 µg/cell, of chlorophyll b), 75‰ (0.000000745 µg/cell, of chlorophyll a; 0.000000945 µg/cell, of chlorophyll b), 120‰ (0.000000964 µg/cell, of chlorophyll a; 0.000001179 µg/cell, of chlorophyll b) and 134‰ (0.000002433 µg/cell, of chlorophyll a; 0.000002995 µg/cell, of chlorophyll b).
Reviewing these 4 parameters in the initial trial, the conclusion was to use salinity 75‰ as a model for upscaling, since it produced positively highlighted results throughout all assessments (cell count, dry biomass, pigment content and desalination).
3.2. Upscaling
75‰ salinity was selected as the model for upscaling in the final trial due to its performance in every metric we had available. Results were divided in the first 5 hours after inoculation (to check for quick responses to upscaling) and after the first day (with daily analysis whenever possible). The results obtained were expressed in graph (Figure 2).
When analyzing the cell count results, these were highly productive. The cell count reached double the initial assessment after 5 hours of trial, and in the last day of the assessment (21st day) the cell count was 59.95 x 10³ ± 535.22 cells/mL. When assessing continuous results for the first 5h (from one 30-minute sample to the next), statistically significant differences were observed between the 3 first samplings (from 0h to 00:30, and 00:30 to 1h), indicating that there was a good initial adaptation by D. salina to these new conditions. As for the remaining trial (21 days), although significant difference can be observed from day 2 to day 3, it becomes apparent that the microalgae were going through an adaptation period untill the 16th day. Every day after this one showed statistically significant differences from the next, demonstrating good daily growth until the end of the trial (21st day).
As for dry biomass, the final value was higher than the initial trial. This may indicate that salt is increasing the cell weight, probably because of the necessity of storing energy reserves as a necessity for high salinity adaptation. After 21 days we obtained 4.2g of dry biomass per liter of culture. In the first 5 hours there was significant growth with some adaptation periods (such as 00:30 – 1h and 1:30 – 2:30). As for the remaining days there was continuous growth with the first day-to-day samples presenting significant differences being from day 9 to day 10. After this, the microalgae reached a point of continuous significant growth on day 16 all the way to the end of the trial.
Pigment assessment exhibited that there was continuous pigment development throughout the whole study. For chlorophyll a, the first sample showing statistically significant growth from sample 0h was the one collected at the 3 hour and 30 minutes mark, this was 30 minutes after the significant ascending trend started in dry biomass, implying that first the microalgae grew in mass, and then started developing its chlorophyll a content. There were no significant differences in chlorophyll b content (from 0h) for the first 5h of the trial. As for the remaining 21 days, both pigments presented the same trends with a significant jump in production from day 14 to day 15, a three-day stabilization period, and statistically significant pigment production from day 18 to the end of the trial. Reaching a final maximum value of 9.54 ± 0.2 µg/L of chlorophyll a and 12.81 ± 0.51 µg/L of chlorophyll b. In the current trial, the maximum production in terms of pigment per cell were observed in the final day (day 21 - 0.000000162 µg/cell, of chlorophyll a; 0.000000217 µg/cell, of chlorophyll b). This may indicate that the quantity of pigment in the cell was still increasing, and therefore the cell was still continuosly producing pigment.
Curiously, desalination did not occur throughout the upscalling section of the study (data not shown).
Reviewing these 4 parameters, one may conclude that the microalgae is still comfortable at 75‰ salinity, reproducing and producing pigment, but as a desalination agent, no activity was shown.
4. Discussion
When analyzing desalination in the initial trial with the highest desalinations occurring in salinity 60‰ (11.67‰ ± 0.58), followed by 83‰ (10.67‰ ± 0.58) and 67/75‰ (9.33‰ ± 0.58), results were positive but still inferior to past studies as reported by Maoyedi et al. achieved around 20‰ desalination on a 130mS/cm solution in 2021, in a 5L setup with ligh intensity of 3500 lux at 25°C [27]. Yet this desalination action could not be replicated in the upscaling process. This might be attributed to the long adaptation period the microalgae went through (16 days), as it is a slow process to induce metabolic and physiological activities in microalgae when under high saline condition [28]. This could also be attributed to the adsorption of ions to the cells surface, previous to inoculation. The large surface and strong binding properties of the cell wall in D. salina increase this adsorption [29,30]. The continuous cell multiplication, dry biomass increase and pigment production suggest that bioaccumulation became the prevailing mechanism[31,32,33], over desalination[34]. This indicates a problem to overcome with the microalgae desalination strategy and the need for future studies in a larger scale, controlling and monitoring culture conditions, with a focus on salt uptake by the cell, and different origins of inoculate.
Cell count was positive in both stages of the study, as there was an increase from the initial dilution of inoculate. In the initial trial, salinities 9‰ (11.6 x 10³ ± 0.140 x 10³ cells/L), 35‰ (14.2 x 10³ ± 0.320 x 10³ cells/L), 75‰ (13 x 103 ± 1.4 x 10³ cells/L), 96‰ (14.6 x 10³ ± 0.544 x 10³ cells/L) and 124‰ (15.3 x 10³ ± 1.882 x 10³ cells/L) showed no statistically significant differences while all presenting cell counts above 10 x 103 cells/mL. For the upscaling, although there was a long period of adaptation, cells quickly multiplied on a daily basis from the 16th day (32.6 x 10³ ± 0.095 x 10³ cells/mL) to the 21st and final day of the trial (59.95 x 10³ ± 0.535 x 10³ cells/mL). These results are successful for cell culturing, and positive when compared to past literature, for example, Sedjati et al observed 1.231 ± 0.025 x 10⁴ and 0.892 ± 0.005 x 10⁴ cells/mL at 2% and 4% salinities, respectively [35]. These results prove highly interesting since higher cell count could account for a higher productivity in every parameter, including desalination potential.
Dry biomass was also a highlight of this study, with various bioreactors in the initial trial surpassing the 2g/L mark. These were salinities 67‰ (2.01 ± 0.016 g/l), 75‰ (2.46 ± 0.056 g/l), 87‰ (2.06 ± 0.003 g/l), 96‰ (2.33 ± 0.014 g/l), 103‰ (2.21 ± 0.077 g/l) and 105‰ (2.01 ± 0.037 g/l). The upscaling section of this study showed much higher results, with the last day (21st) presenting a dry biomass result of 4.21 ± 0.016 g/l. These results were highly positive when compared to past literature, such as the study by Morowvat and Ghasemi were the maximum concentration of D. salina in optimized Johnson culture and basic culture medium were 0.997 and 0.571 g/L, respectively [36]. Previous studies had reported this boost in biomass production when the culture is subjected to high salinities [37]. The favorable biomass findings are particularly intriguing as microalgal biomass holds significant biotechnological promise for utilization in integrated multi-product biorefineries [38].
As for the pigment assessment, an interesting pattern can be observed in figure 1 (d) and (e), referring to the initial trial. There are 3 peaks that represent hotspots for pigment production. These are in salinity 9‰ (chlorophyll a: 11.69 ± 0.014 µg/L, b: 13.62 ± 0.012 µg/L), 75‰ (chlorophyll a: 9.75 ± 0.012 µg/L, b: 12.36 ± 0.028 µg/L) and 124‰ (chlorophyll a: 7.07 ± 0.015 µg/L, b: 8.83 ± 0.038 µg/L). These results could be interesting for the industry since we demonstrate 3 potential salinities to boost production. As for the upscaling section of this study, for the final day, a pigment production of 9.53 ± 0.199 µg/L for chlorophyll a and 12.81 ± 0.511 µg/L for chlorophyll b was reached. Colusse et al. in 2020 measured a chlorophyll content of 3.92 ± 0.43 µg/L, using Conway medium [39]. The difference between medias can be explained by the fact that Conway medium is relatively simple compared to ASNIII medium, which contains a broader range of nutrients and more closely resembles natural seawater.
Although not considered in this study, another route could be using a carrier, such as an alginate bead encapsulating the microalgae, to introduce D. salina to the salty environment. Similar approaches have been successful for removal of ammonia and phosphorus from aquaculture wastewater [40].
5. Conclusions
The findings from the upscaling phase indicate a lack of desalination activity, however, the trial reveals the robust adaptation of D. salina to diverse salinity levels. This observation underscores an interesting area for future desalination research, focusing on elucidating mechanisms driving salt accumulation within the cell. Moreover, these results present the potential exploration of microalgae as a viable resource in saline-rich environments unsuitable for conventional agricultural practices, thereby facilitating industrial adaptation to adverse conditions.
This experiment raises additional critical concerns that will be addressed in future studies.
D. salina was utilized since it is one of the most investigated halophytes in terms of desalination, although other halophytes may be more suited or even more adapted for the end goal.
The amount of inoculate undoubtedly plays a significant part in the effectiveness of the microalgae in its new media; a future study may introduce additional inoculate or directly add the NaCl to the culture, while ensuring that all other parameters are maintained.
In terms of industry, the final results were highly successful. Proving 75%o to be an excellent salinity for cell count increase, higher dry biomass values and viable pigment production.
Temperature control was not considered. For a more realistic picture of the final application, temperature should be observed in the field and constantly monitored in the laboratory.
Author Contributions
Conceptualization, JRT and GWF; methodology, JRT and GWF; validation, JRT and GWF; formal analysis, JRT; investigation, JRT and GWF; resources, YC, PM and RP; data curation, JRT; writing—original draft preparation, JRT; writing—review and editing, JRT, GWF, PM, RP and YC; visualization, JRT; supervision, PM, RP and YC; project administration, JRT and GWF; funding acquisition, YC, PM and RP. All authors have read and agreed to the published version of the manuscript.
Funding
This research was funded by Regional University Network – European Union.
Data Availability Statement
Data is contained within the article or supplementary material.
Conflicts of Interest
The authors declare no conflicts of interest.
References
- J. Chenoweth, “Minimum water requirement for social and economic development,” Desalination, vol. 229, no. 1–3, pp. 245–256, Sep. 2008. [CrossRef]
- U. Lall, T. Heikkila, and T. Siegfried, “WATER IN THE 21ST CENTURY: DEFINING THE ELEMENTS OF GLOBAL CRISES AND POTENTIAL SOLUTIONS on JSTOR,” J. Int. Aff. Editor. Board, 2008, Accessed: Dec. 13, 2023. [Online]. Available: https://www.jstor.org/stable/24358108.
- D. W. Bromley, D. C. Taylor, and D. E. Parker, “Water Reform and Economic Development: Institutional Aspects of Water Management in the Developing Countries,” vol. 28, no. 2, pp. 365–387, Jan. 1980. [CrossRef]
- C. Brown and U. Lall, “Water and economic development: The role of variability and a framework for resilience,” Nat. Resour. Forum, vol. 30, no. 4, pp. 306–317, Nov. 2006. [CrossRef]
- R. Bhateria and D. Jain, “Water quality assessment of lake water: a review,” Sustain. Water Resour. Manag., vol. 2, no. 2, pp. 161–173, Jun. 2016. [CrossRef]
- J. Ayoub and R. Alward, “Water requirements and remote arid areas: the need for small-scale desalination,” Desalination, vol. 107, no. 2, pp. 131–147, Oct. 1996. [CrossRef]
- P. J. McGinn et al., “Assessment of the bioenergy and bioremediation potentials of the microalga Scenedesmus sp. AMDD cultivated in municipal wastewater effluent in batch and continuous mode,” Algal Res., vol. 1, no. 2, pp. 155–165, Oct. 2012. [CrossRef]
- J. K. Pittman, A. P. Dean, and O. Osundeko, “The potential of sustainable algal biofuel production using wastewater resources,” Bioresour. Technol., vol. 102, no. 1, pp. 17–25, Jan. 2011. [CrossRef]
- N. Abdel-Raouf, A. A. Al-Homaidan, and I. B. M. Ibraheem, “Microalgae and wastewater treatment,” Saudi J. Biol. Sci., vol. 19, no. 3, pp. 257–275, Jul. 2012. [CrossRef]
- D. Curto, V. Franzitta, and A. Guercio, “A Review of the Water Desalination Technologies,” Appl. Sci. 2021, Vol. 11, Page 670, vol. 11, no. 2, p. 670, Jan. 2021. [CrossRef]
- S. F. Mohsenpour, S. Hennige, N. Willoughby, A. Adeloye, and T. Gutierrez, “Integrating micro-algae into wastewater treatment: A review,” Sci. Total Environ., vol. 752, p. 142168, Jan. 2021. [CrossRef]
- L. Gao, X. Zhang, L. Fan, S. Gray, and M. Li, “Algae-Based Approach for Desalination: An Emerging Energy-Passive and Environmentally Friendly Desalination Technology,” ACS Sustain. Chem. Eng., vol. 9, no. 26, pp. 8663–8678, Jul. 2021, doi: 10.1021/ACSSUSCHEMENG.1C00603/ASSET/IMAGES/MEDIUM/SC1C00603_0008.GIF. [CrossRef]
- L. E. de-Bashan and Y. Bashan, “Immobilized microalgae for removing pollutants: Review of practical aspects,” Bioresour. Technol., vol. 101, no. 6, pp. 1611–1627, Mar. 2010. [CrossRef]
- R. Muñoz and B. Guieysse, “Algal–bacterial processes for the treatment of hazardous contaminants: A review,” Water Res., vol. 40, no. 15, pp. 2799–2815, Aug. 2006. [CrossRef]
- L. Uma, K. Selvaraj, G. Subramanian, S. Nagarkar, and R. Manjula, “Biotechnological Potential of Marine Cyanobacteria in Wastewater Treatment - Disinfection of Raw Sewage by Oscillatoria willei BDU 130511,” J. Microbiol. Biotechnol., vol. 12, no. 4, pp. 699–701, Aug. 2002, Accessed: Dec. 13, 2023. [Online]. Available: https://www.jmb.or.kr/journal/view.html?spage=699&volume=12&number=4.
- N. Mallick, “Biotechnological potential of immobilized algae for wastewater N, P and metal removal: A review,” BioMetals, vol. 15, no. 4, pp. 377–390, Dec. 2002. [CrossRef]
- Moayedi, B. Yargholi, E. Pazira, and H. Babazadeh, “Investigated of Desalination of Saline Waters by Using Dunaliella Salina Algae and Its Effect on Water Ions,” Civ. Eng. J., vol. 5, no. 11, pp. 2450–2460, Nov. 2019. [CrossRef]
- E. Sergany, E. Hosseiny, and E. Nadi, “The Optimum Algae Dose in Water Desalination by Algae Ponds,” Int. Res. J. Adv. Eng. Sci., vol. 4, no. 2, pp. 152–154, 2019.
- G. Laliberté, P. Lessard, J. De la Noüe, and S. Sylvestre, “Effect of phosphorus addition on nutrient removal from wastewater with the cyanobacterium Phormidium bohneri,” Bioresour. Technol., vol. 59, no. 2–3, pp. 227–233, Feb. 1997. [CrossRef]
- M. E. Martínez, S. Sánchez, J. M. Jiménez, F. El Yousfi, and L. Muñoz, “Nitrogen and phosphorus removal from urban wastewater by the microalga Scenedesmus obliquus,” Bioresour. Technol., vol. 73, no. 3, pp. 263–272, Jul. 2000. [CrossRef]
- Oren, “A hundred years of Dunaliella research: 1905–2005,” Saline Systems, vol. 1, no. 1, p. 2, Dec. 2005. [CrossRef]
- R. Rippka, “Isolation and Purification of Cyanobacteria,” Methods Enzymol., vol. 167, no. C, pp. 3–27, 1988. [CrossRef]
- C. J. Carr et al., “An Audit and Comparison of pH, Measured Concentration, and Particulate Matter in Mannitol and Hypertonic Saline Solutions,” Front. Neurol., vol. 12, p. 667842, May 2021. [CrossRef]
- N. Reza Moheimani, M. A. Borowitzka, A. Isdepsky, and S. Fon Sing, “Standard methods for measuring growth of algae and their composition,” Algae for Biofuels and Energy, pp. 265–284, Jan. 2013. [CrossRef]
- H. Caspers, “J. D. H. Strickland and T. R. Parsons: A Practical Handbook of Seawater Analysis. Ottawa: Fisheries Research Board of Canada, Bulletin 167, 1968. 293 pp. $ 7.50,” Int. Rev. der gesamten Hydrobiol. und Hydrogr., vol. 55, no. 1, pp. 167–167, Jan. 1970. [CrossRef]
- S. W. Jeffrey and G. F. Humphrey, “New spectrophotometric equations for determining chlorophylls a, b, c1 and c2 in higher plants, algae and natural phytoplankton,” Biochem. und Physiol. der Pflanz., vol. 167, no. 2, pp. 191–194, Jan. 1975. [CrossRef]
- Moayedi, B. Yargholi, E. Pazira, and H. Babazadeh, “Investigation of bio-desalination potential algae and their effect on water quality,” 2021. [CrossRef]
- D. Kaplan, “Absorption and Adsorption of Heavy Metals by Microalgae,” Handb. Microalgal Cult. Appl. Phycol. Biotechnol. Second Ed., pp. 602–611, Jan. 2013. [CrossRef]
- K. Priya, L. Gnanasekaran, K. Dutta, S. Rajendran, D. Balakrishnan, and M. Soto-Moscoso, “Biosorption of heavy metals by microorganisms: Evaluation of different underlying mechanisms,” Chemosphere, vol. 307, p. 135957, Nov. 2022. [CrossRef]
- B. Ramesh et al., “A review on algae biosorption for the removal of hazardous pollutants from wastewater: Limiting factors, prospects and recommendations,” Environ. Pollut., vol. 327, p. 121572, Jun. 2023. [CrossRef]
- M. O. I. Ghobashy, O. Bahattab, A. Alatawi, M. M. Aljohani, and M. M. I. Helal, “A Novel Approach for the Biological Desalination of Major Anions in Seawater Using Three Microalgal Species: A Kinetic Study,” Sustain. 2022, Vol. 14, Page 7018, vol. 14, no. 12, p. 7018, Jun. 2022. [CrossRef]
- J. Wei, L. Gao, G. Shen, X. Yang, and M. Li, “The role of adsorption in microalgae biological desalination: Salt removal from brackish water using Scenedesmus obliquus,” Desalination, vol. 493, p. 114616, Nov. 2020. [CrossRef]
- Çelekli and H. Bozkurt, “Bio-sorption of cadmium and nickel ions using Spirulina platensis: Kinetic and equilibrium studies,” Desalination, vol. 275, no. 1–3, pp. 141–147, Jul. 2011. [CrossRef]
- M. Mirzaei, M. Jazini, G. Aminiershad, and D. Refardt, “Biodesalination of saline aquaculture wastewater with simultaneous nutrient removal and biomass production using the microalgae Arthrospira and Dunaliella in a circular economy approach,” Desalination, vol. 581, p. 117564, Jul. 2024. [CrossRef]
- S. Sedjati, G. W. Santosa, E. Yudiati, E. Supriyantini, A. Ridlo, and F. D. Kimberly, “Chlorophyll and Carotenoid Content of Dunaliella salina at Various Salinity Stress and Harvesting Time,” IOP Conf. Ser. Earth Environ. Sci., vol. 246, no. 1, p. 012025, Mar. 2019. [CrossRef]
- M. H. Morowvat and Y. Ghasemi, “Culture medium optimization for enhanced β-carotene and biomass production by Dunaliella salina in mixotrophic culture,” Biocatal. Agric. Biotechnol., vol. 7, pp. 217–223, Jul. 2016. [CrossRef]
- Djunaedi, C. A. Suryono, and S. Sardjito, “Kandungan Pigmen Polar Dan Biomassa Pada Mikroalga Dunaliella Salina Dengan Salinitas Berbeda,” J. Kelaut. Trop., vol. 20, no. 1, pp. 1–6, Jul. 2017. [CrossRef]
- F. C. C. de S. Félix, V. B. Hidalgo, A. K. F. de Carvalho, N. de S. Caetano, and P. C. M. Da Rós, “Assessing the application of marine microalgae Dunaliella salina in a biorefinery context: production of value-added biobased products,” Biofuels, Bioprod. Biorefining, vol. 18, no. 2, pp. 439–452, Mar. 2024. [CrossRef]
- G. A. Colusse, C. R. B. Mendes, M. E. R. Duarte, J. C. de Carvalho, and M. D. Noseda, “Effects of different culture media on physiological features and laboratory scale production cost of Dunaliella salina,” Biotechnol. Reports, vol. 27, p. e00508, Sep. 2020. [CrossRef]
- M. Sarkheil, M. Ameri, and O. Safari, “Application of alginate-immobilized microalgae beads as biosorbent for removal of total ammonia and phosphorus from water of African cichlid (Labidochromis lividus) recirculating aquaculture system,” Environ. Sci. Pollut. Res., vol. 29, no. 8, pp. 11432–11444, Feb. 2022. [CrossRef]
Figure 1.
All results obtained from Initial Trial. Difference significances were attributed as follows: Not significant (ns: p≥0.05), Significant (*: p=0.01 to 0.05), Very significant (**: p= 0.001 to 0.01) and Extremely significant (***: p= 0.0001 to 0.001, and ****=p<0.0001). (a) – Result of salt percentage removed from media for each salinity after initial trial culture; (b) – Result of cell counting for each bioreactor after initial trial, in cells per milliliter of culture; (c) - Result of dry biomass assessment for each bioreactor after initial trial, in grams of dry weight per liter of culture; (d) and (e) - Result of pigment assessment for each bioreactor after initial trial, in µg per liter of culture.
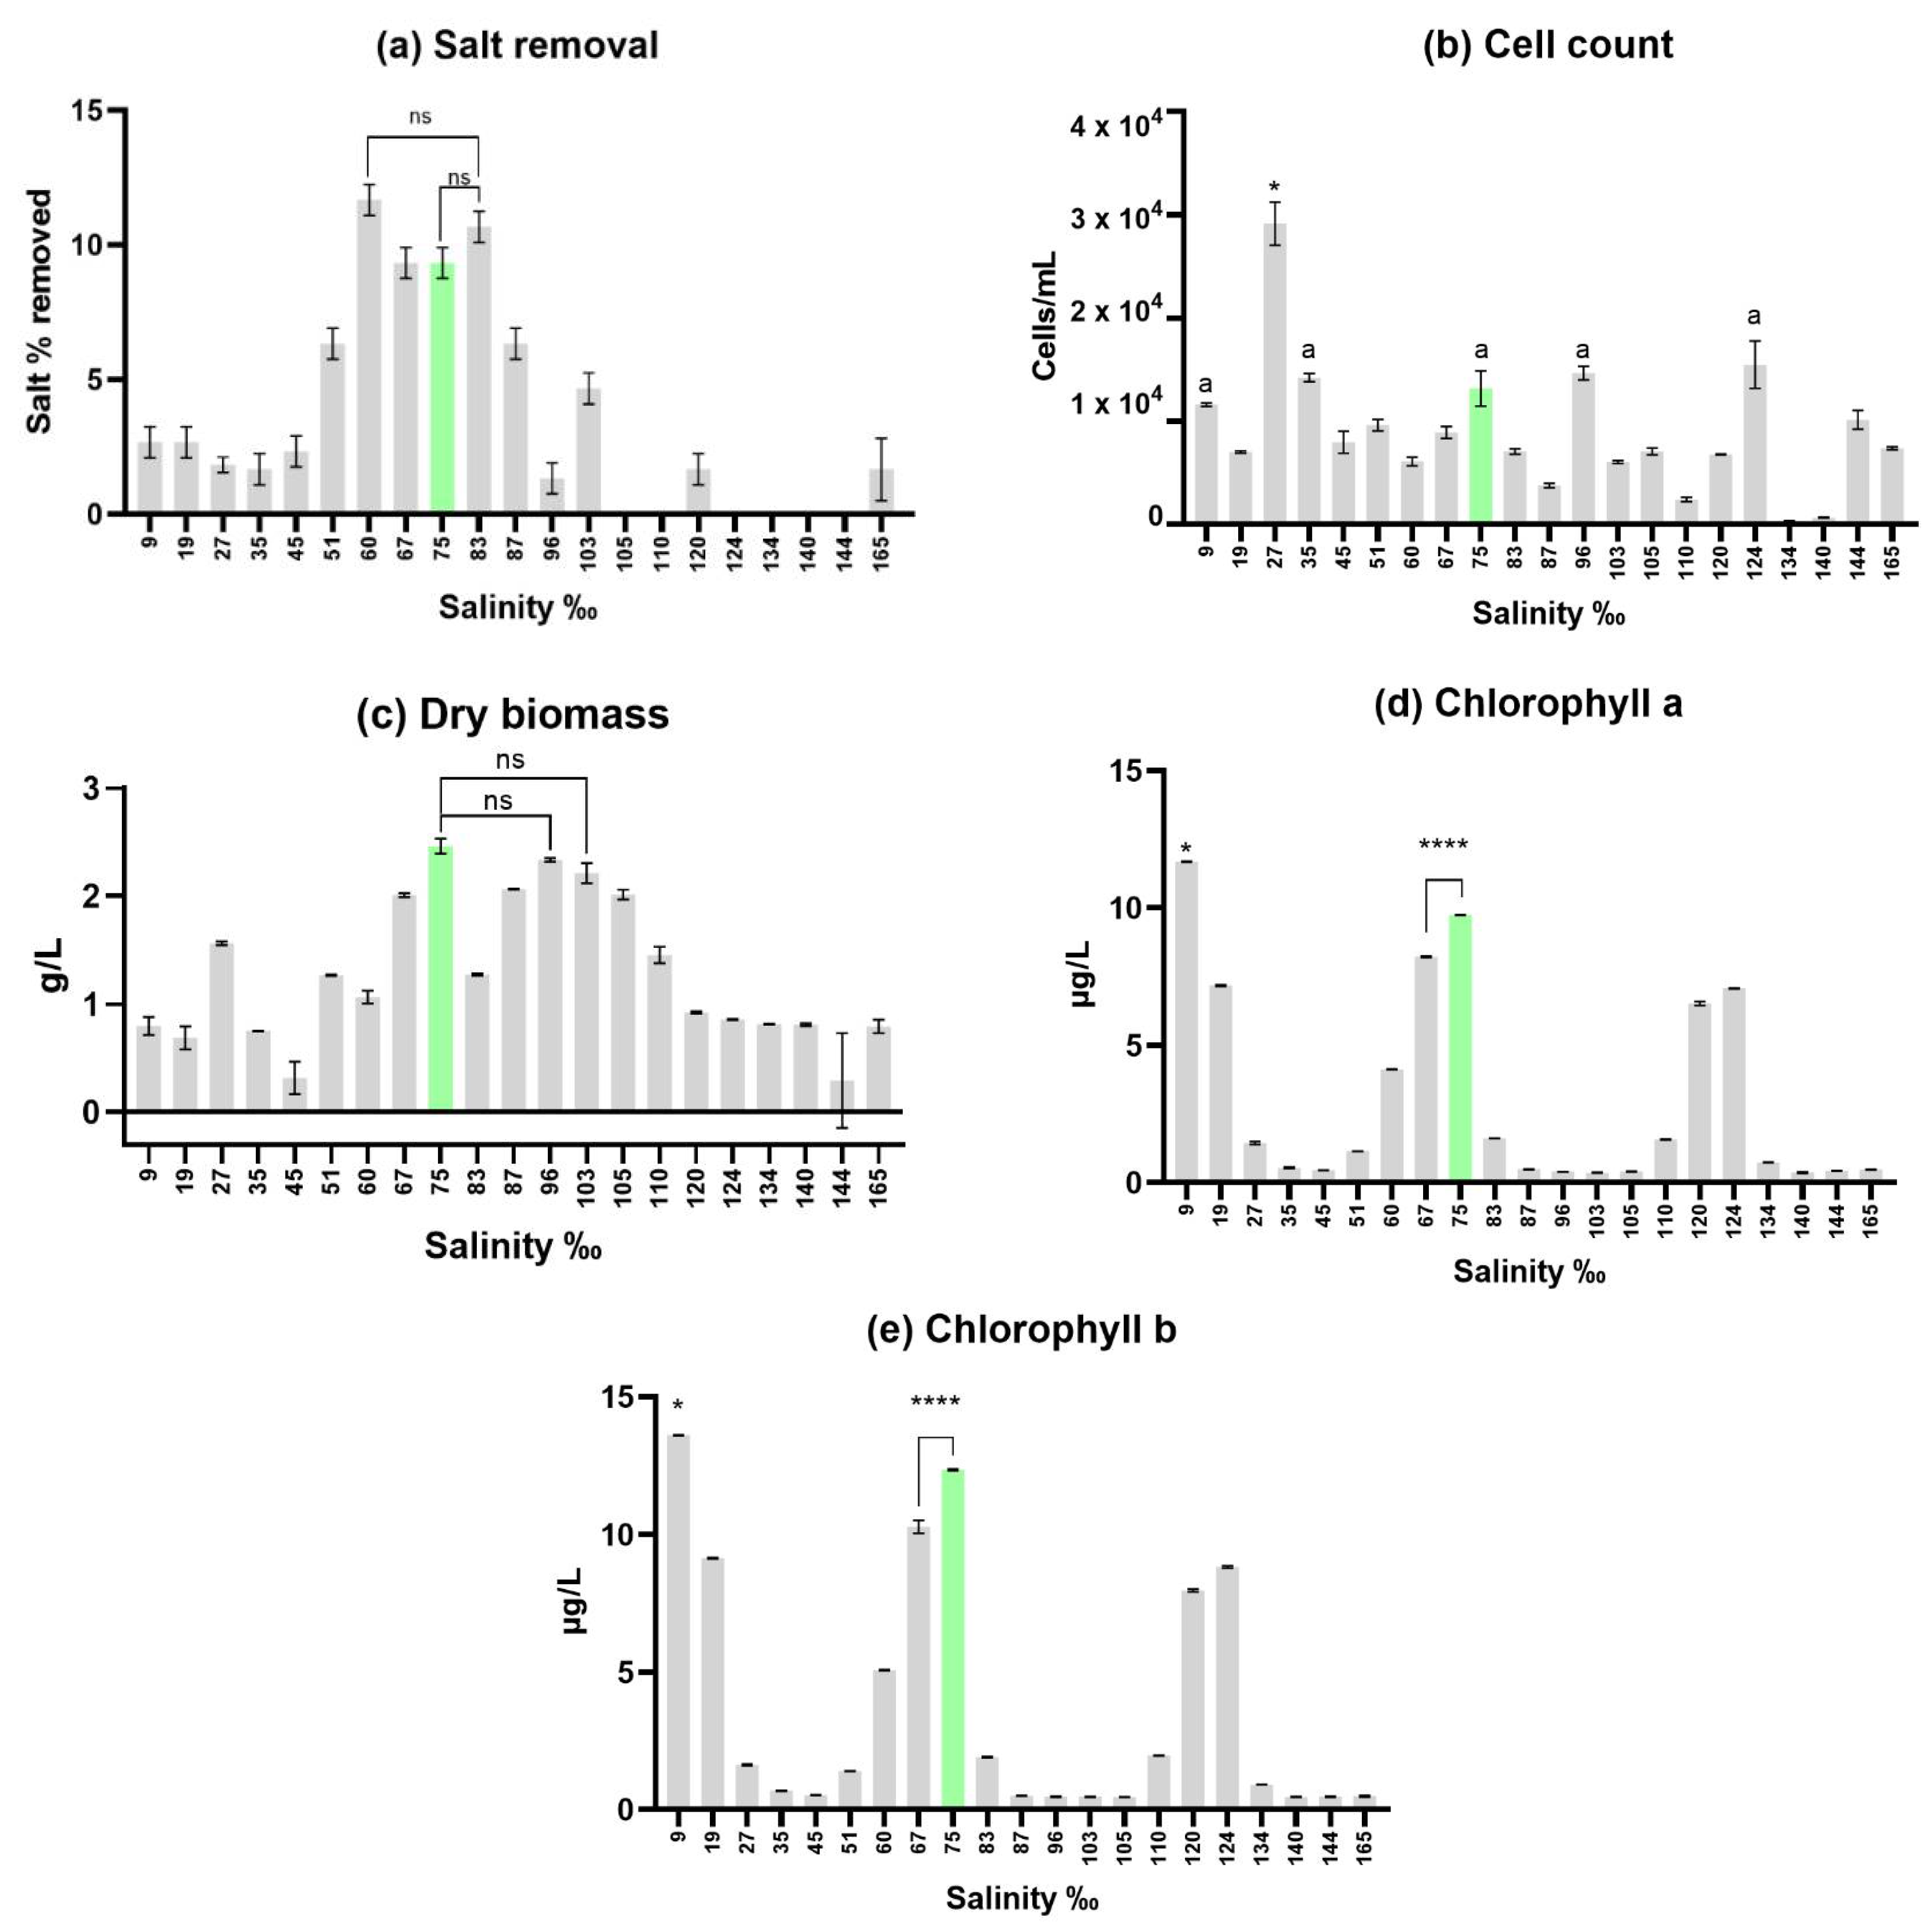
Figure 2.
Results obtained from Final Trial. Difference significances were attributed as follows: Not significant (ns: p≥0.05), Significant (*: p=0.01 to 0.05), Very significant (**: p= 0.001 to 0.01) and Extremely significant (***: p= 0.0001 to 0.001, and ****=p<0.0001). Left side graphs represent results for first 5h window, right side graphs represent results for daily samples until day 21. (a) and (b) – Result of cell counting for each salinity, in cells per milliliter of culture; (c) and (d) - Result of dry biomass assessment after 21 days of culture, in grams of dry weight per liter of culture; (e), (f), (g) and (h) - Result of pigment assessment, in µg per liter of culture.
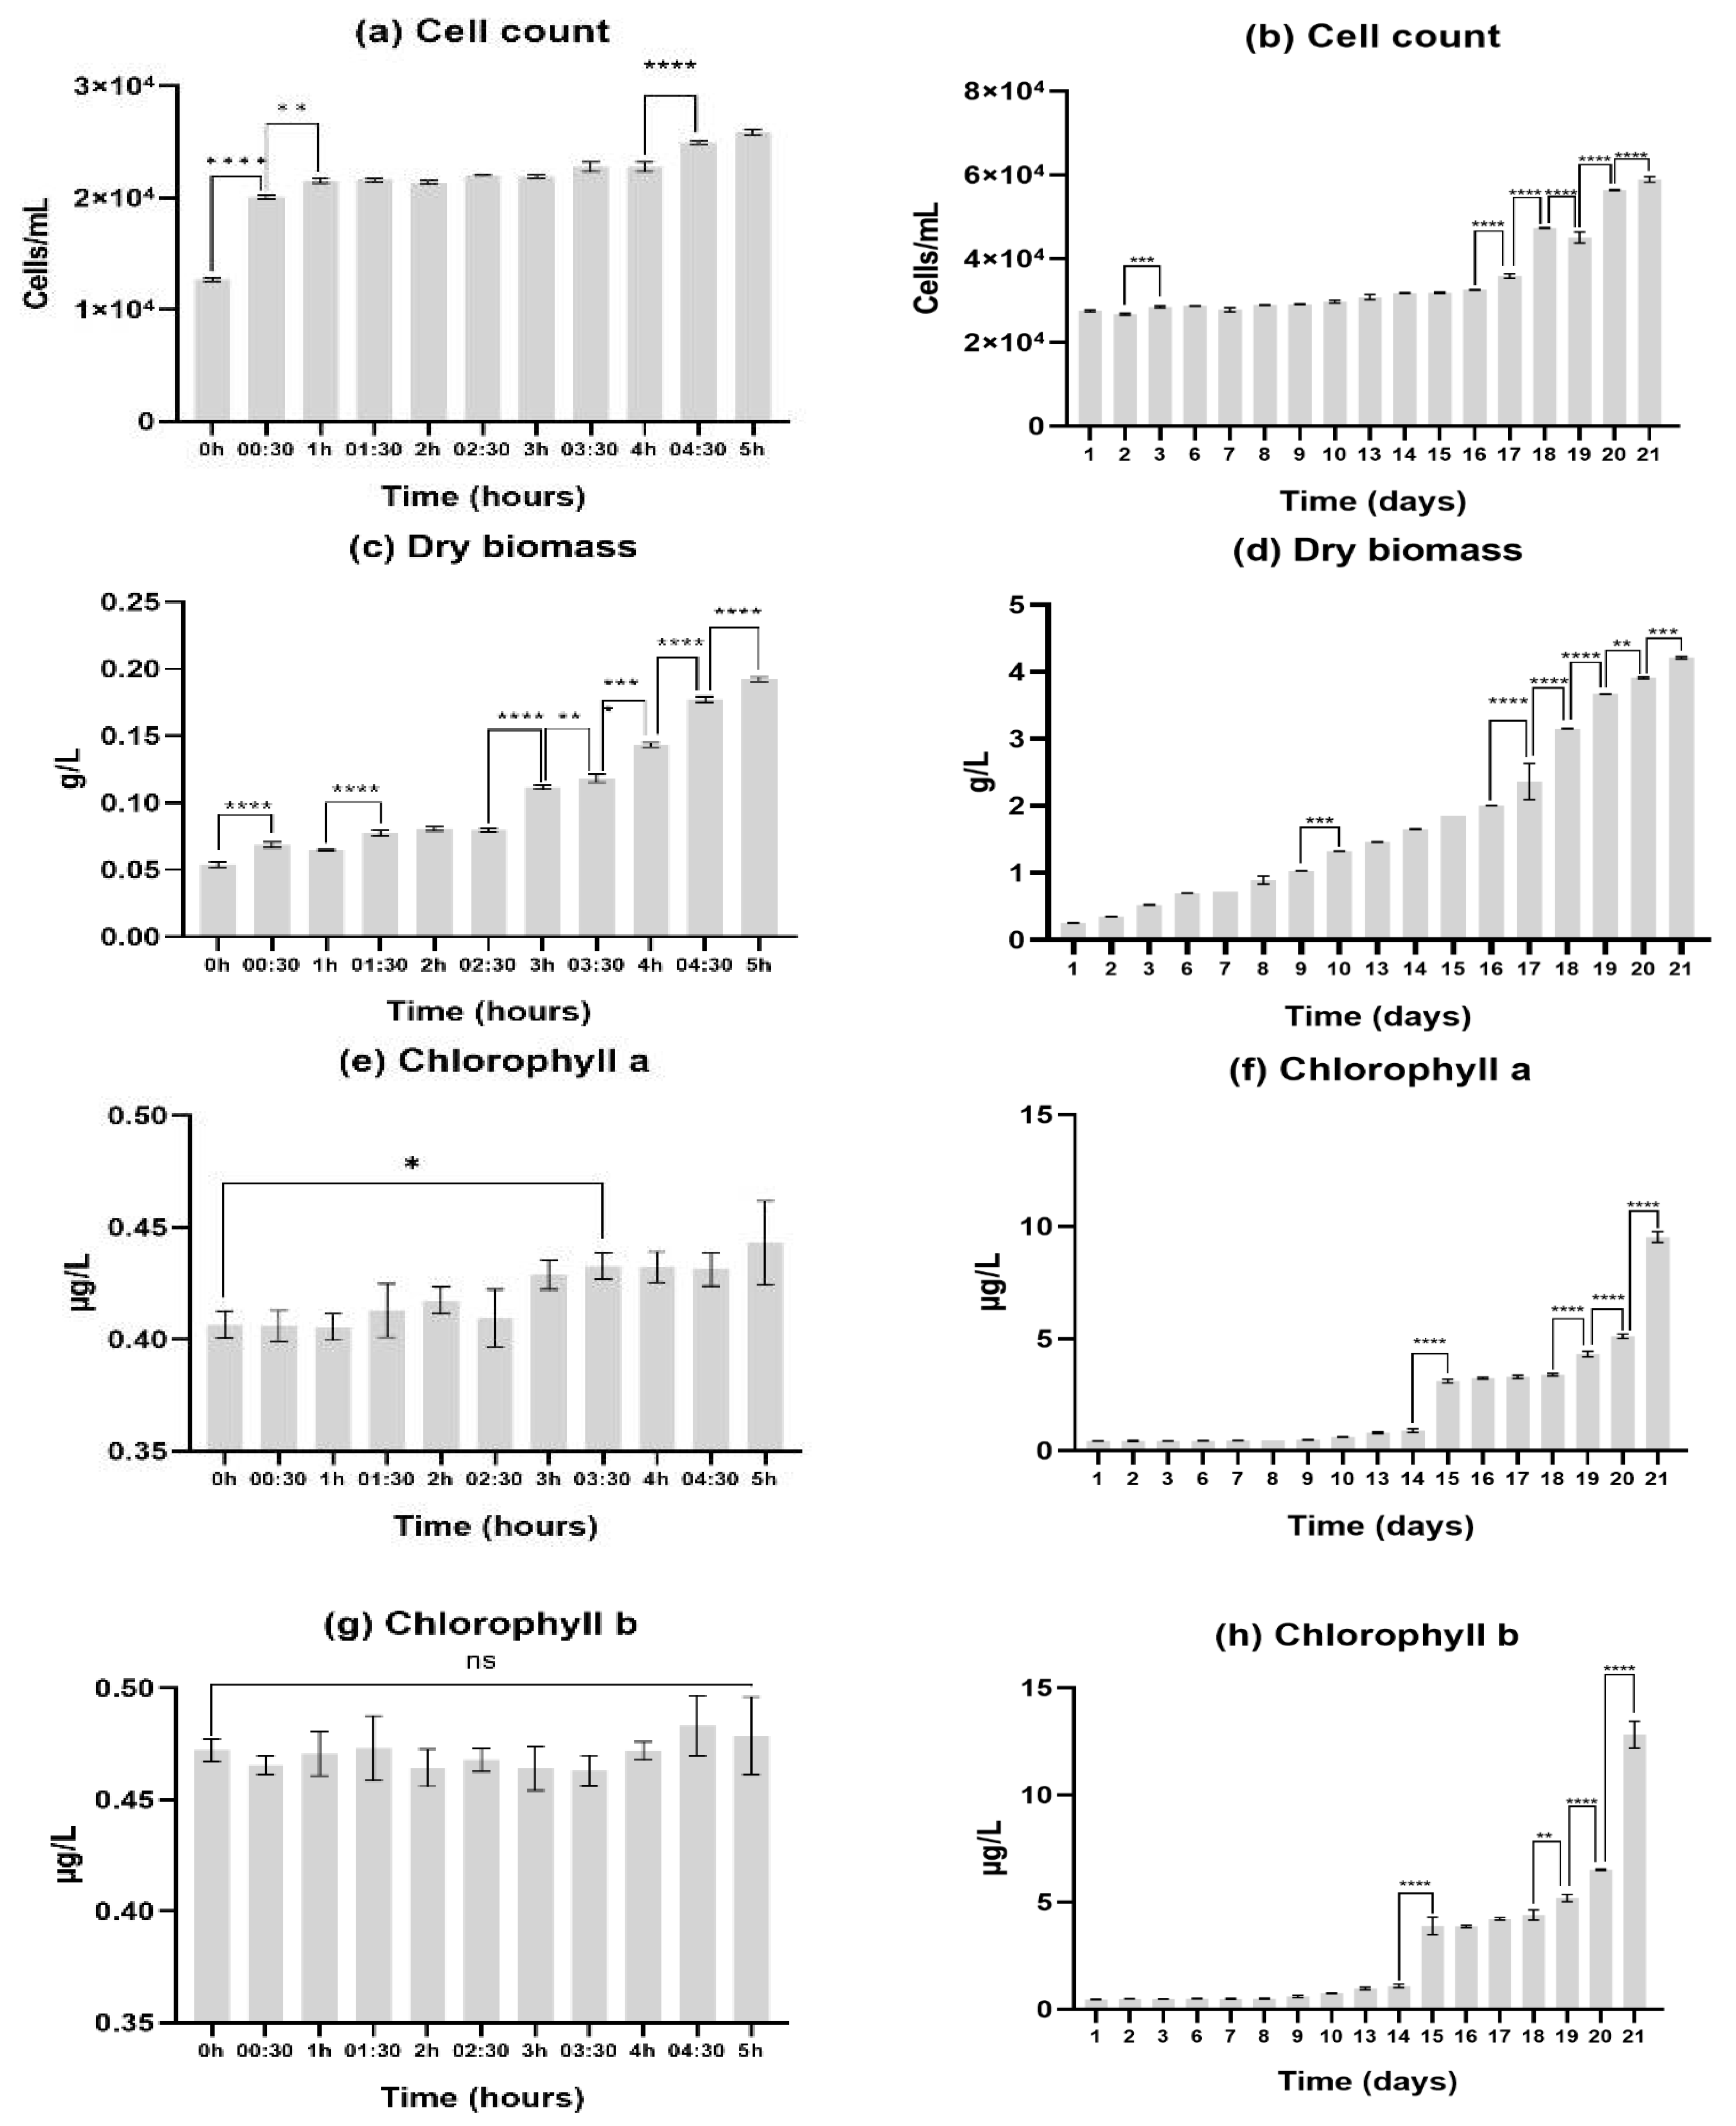

Table 1.
Bioreactors initial salinity.
| Salinity ‰ | 9 | 19 | 27 | 35 | 45 | 51 | 60 | 67 | 75 | 83 | 87 | 96 | 103 | 105 | 110 | 120 | 124 | 134 | 140 | 144 | 165 |
| Media | ASN III | ||||||||||||||||||||
Disclaimer/Publisher’s Note: The statements, opinions and data contained in all publications are solely those of the individual author(s) and contributor(s) and not of MDPI and/or the editor(s). MDPI and/or the editor(s) disclaim responsibility for any injury to people or property resulting from any ideas, methods, instructions or products referred to in the content. |
© 2024 by the authors. Licensee MDPI, Basel, Switzerland. This article is an open access article distributed under the terms and conditions of the Creative Commons Attribution (CC BY) license (http://creativecommons.org/licenses/by/4.0/).
Copyright: This open access article is published under a Creative Commons CC BY 4.0 license, which permit the free download, distribution, and reuse, provided that the author and preprint are cited in any reuse.


