
Submitted:
14 November 2024
Posted:
17 November 2024
You are already at the latest version
Abstract
The present study was designed with the objective of assessing the potential of size of dried blood spot (DBS) on a filter paper in predicting hematological attributes viz. RBC count, Hb, PCV and total protein (TP) in Cholistani cattle blood (n=71). A measured drop of blood was placed carefully on Whatman 42 filter paper and size was measured using ImageJ software. Results revealed that Hb had significant (P≤0.05) relation with size of the DBS. The regression equation between Hb and size of DBS was used to deduce corrected Hb (CHb). The determined Hb and CHb were non-significantly (P≥0.05) different and had a strong agreement. It is concluded that the size of DBS is a substantially reliable predictor of Hb in cattle blood.
Keywords:
dried blood spot
; anemia
; Cholistani cattle
; POCTs
1. Introduction
The indigenous cattle (Bos indicus) breeds of an area have gained substantial attention in last decade or so as being pivotal for socioeconomic uplift of the natives. Being hardy, tick- and disease-resistant, they put less economic burden on the livestock keepers as compared to exotic cattle breeds (Bos taurus) [1,2,3,4]. In this perspective, extensive work has recently been reported for various indigenous livestock species (mostly Sipli sheep and Cholistani cattle) being reared under nomadism in Cholistan desert of Pakistan [5,6,7,8]. Owing to the unique livestock pastoral system of the desert (transhumanie and nomadic), these animals are normally reared within the premises of the desert, and are remotely distant from main laboratories. This causes a delay in diagnosis/prognosis of various diseases as the animals or their biological samples cannot be timely transited to the main laboratories for testing. Even if they are, the transit time and method of handling the samples produce erroneous results, ultimately leading to a misdirected diagnosis/prognosis [9,10,11]. Globally, the livestock disease diagnosis and control has hence taken a sharp twist in research with focus on devising and validating various on-field, out-of-laboratory, quick, precise and cost-effective point-of-care tests (POCTs). With their rapid turnaround time, rapid decision-making and swift patient care, the POCTs provide an earlier and rightful diagnosis/prognosis which ultimately leads the practitioners/livestock farmers to a time-appropriate treatment [12,13,14,15].
The zebu (humped) cattle breeds, such as Cholistani cattle, are mostly reared in warm climate zones (WCZs) of the world. These geographic entities have an environment conducive to ticks resulting in various tick-borne diseases and infections mainly theileriosis, anaplasmosis and babesiosis. The mainstay of these diseases is multifaceted represented in terms of anemia and an ultimate loss in productivity [4]. The RBC count, hemoglobin (Hb) and packed cell volume (PCV) are vital blood attributes globally acknowledged as indicators of anemia. The multi-species automated veterinary hematology analyzers are now in vogue which provide a reliable insight into the blood picture of an animal. However, these analyzers are expensive, need periodic maintenance and trained personnel, and are mostly located in laboratories distant from the animal herds. Our laboratory has already reported various novel POCTs in the form of hematological formulae [10,11,16,17] and various serum color charts [7] for Cholistani livestock. Similarly, we also have reported the determination of Hb using dried blood spot (DBS) technique on filter paper through indirect cyanmethemoglobin method for Cholistani cattle [9]. However, research work regarding the predictive potentiality of a DBS on filter paper to ascertain various hematological attributes in cattle blood has not been reported as a valid POCT. The present study has therefore been designed with the main objective of assessing the potential of DBS on a filter paper in predicting hematological attributes viz. RBC count, Hb, PCV and total protein (TP) in Cholistani cattle blood.
2. Materials and Methods
2.1. Study Location
The blood sampling was carried out in two private livestock farms located within the city of Bahawalpur, Pakistan whereas the laboratory protocols were conducted at the PG Lab of the Department of Physiology, The Islamia University of Bahawalpur, Pakistan. Both the farms were located at a distance of about 3km from the laboratory (20 mins. drive). The city of Bahawalpur is one of the three main cities (along with Bahawalnagar and Rahim-Yar-Khan) located within the outskirts of the Cholistan desert, Pakistan. The desert sprawls over an area of 23000km2 and has a dry arid climate, reviewed earlier. Transhumanie and nomadic pastoralism are the two main livestock systems being carried out by the desert livestock keepers [3,4].
2.2. Study Animals
The study incorporated Cholistani cattle (n=71) being harbored at the two private farms. The farm personnel briefed that the animals were purchased from local markets based on phenotypic criteria. The anamnesis regarding the health status of the animals was taken from the farm personnel and farm records. All the study animals were adult females, belonged to the same age (between 3 to 4 years) and status (mid-lactation) groups. In early mornings, they were sent out for grazing whereas in the evenings they were being stall-fed with seasonal fodder. Water was provided ad-libitum. Scheduled visits of veterinarians were made sure at the farms for periodic health assessment, vaccination and anthelmintics. All the animals were healthy as confirmed through complete blood count reports.
2.3. Blood Collection and Analysis
Blood was collected aseptically from the upper jugular vein of the cattle under proper restraint within the farm. Blood collection was carried out once for each animal using disposable syringes (10mL). Similar restraining protocol, personnel and timing of blood collection was made to ensure minimal stress to the animal. Collected blood was transferred to a) the purple-topped EDTA-filled vacutainers and b) yellow-topped clot-activator vacutainers. They were transported to the laboratory in an ice-box.
In the laboratory, each blood sample was visually assessed for degree of hemolysis as per visual grading, and hemolyzed samples were discarded. With the help of a single-channel micropipette (Dragon Lab, China), a measured drop of blood (5µL) was carefully placed on filter paper (Whatman 42, Sigma Aldrich, Germany). This filter paper has a maximum ash of 0.007%, pore size of 2.5µm, and Herzberg filtration speed of 1870S, and has been validated for DBS technique earlier in our laboratory [9]. The filter paper was allowed to dry under room temperature of the laboratory, constantly monitored through a hygrometer (HTC-1, China).
The whole blood was analyzed for RBC count, Hb and PCV using a multi-species veterinary hematology analyzer (Rayto-7600, China)
Serum was harvested from the other aliquot of blood by spinning at 3000rpm for 15mins using centrifuge machine (Centrifuge 800, China). Serum was used for TP determination using hand-held digital refractometer (Serum Protein Tester, DR503, China; performance range: 0.2-14.0g/dL; accuracy: ±0.2g/dL; resolution: 0.1) as per manufacturer’s instructions. Summarily, sample plate was rinsed with distilled water, dried, and a 0.2-0.3mL drop of serum was carefully placed on the plate. Reading was provided for TP in g/dL. Each sample was tested for TP twice and means were calculated for final analysis.
2.4. Image Analysis
The filter papers having DBS were placed under Camera-Equipped Microscope (Labo America, Lx 400, Inc. U.S.A) at magnification of 100X, and images were taken. Each image of DBS was analyzed through Image J software (Image J 1.44P, NIH, USA). Post-calibration, using micrometer, the size of DBS on filter paper was measured in terms of diameter.
2.5. Statistical Analysis
The data analyses were carried out using Statistical Package for Social Sciences (SPSS Windows, v12, SPSS Inc. Chicago, USA). The normality of the data was assessed visually as well as through Shapiro-wilk test. Values for the studied attributes (RBC count, Hb, PCV, TP and diameter of DBS) have been given in means(±SE). Multivariate General Linear Model (GLM) analysis and regression analyses were carried out to ascertain the predictability of DBS on the studied hematological attributes and their interrelationships. Regression prediction equations were accordingly deduced. Noticing significant (P≤0.05) effect and predictability of DBS size on Hb, this attribute (Hb) was further taken ahead, and the regression prediction equation of “Hb(g/dL)= 0.007+×DBS size – 18.21” was used to deduce corrected Hb (CHb). The CHb and Hb were compared through independent t-test and simple linear regression. Three tests for confirming the level of agreement i.e. Bland and Altman, Cronbach alpha and intraclass coefficient were implied between Hb and CHb. Accuracy and precision of two attributes was ascertained online (https://www.statstodo.com) through Lin’s concordance correlation coefficient test.
3. Results and Discussion
The DBS technique using filter papers is an easy, quick, transport-ease technique of micro-sampling which is of paramount importance especially in veterinary diagnostics/prognostics. This technique has been tested and validated extensively for human diagnostics/prognostics in various aspects such as Hb and PCV determination [18,19,20], cell analyses and immunology [21,22,23], estimating viral loads [24], and hormonal analyses [25]. However, for veterinary medical sciences, scanty work has been reported on determining viral loads [26,27,28], and rat pharmacokinetics [29]. In 2023, two studies focused on Hb determination for assessing anemia in cats [30] and cattle using DBS [31]. The present study aimed to assess the predictability of DBS size as to predict RBC count, Hb, PCV and TP in Cholistani cattle. This technique could be of paramount vitality in resource-poor settings of the world, especially those where zebu (humped) cattle breeds are being reared under nomadic pastoralism. The results of the present study clearly demonstrate that the DBS size has a substantial predictive potential in assessing Hb in cattle. This predictability could have practical benefits for on-field diagnosis, particularly in remote areas where access to laboratory facilities may be limited. Given the simplicity of the DBS method, it could be developed into a portable and cost-effective POCT tool for monitoring anemia in cattle, reducing the need for expensive multi-species analyzers.
The results regarding multivariate GLM and regression analysis between size of the DBS and various hematological attributes (RBC count, Hb, PCV and TP) is given in Table 1. It was noticed that a strong positive correlation was found between DBS size and hemoglobin (r= 0.828). The model explained 76.2% of the variance in hemoglobin levels, and this relationship was statistically significant (p≤0.05). The regression equation suggests that hemoglobin increases by 0.007 g/dL for each micrometer increase in DBS diameter, which provides clear applicability in field diagnostics. However, all other studied blood attributes i.e. RBC count, PCV and TP had a weak and non-significant (P≥0.05) relationship with DBS size. Our results of correlation are not in concordance to an earlier study reported from Nigeria in which DBS size was assessed for its correlation with various hematological attributes and it has been reported that the DBS size had a weak negative correlation (r= -0.281) with Hb [31]. The difference could be attributed to difference in breed and study area. Furthermore, the Nigerian study has not been supported by additional robust statistical tests which normally are needed for such studies. Our results are, however, in line with a study conducted on Hb determination through DBS on filter paper in human which has reported a higher correlation coefficient of 0.872 [18]. Similarly, a few studies conducted on human blood have also reported successful Hb determination using DBS [32,33,34]. It is noteworthy that though the DBS has many advantages in terms of sampling, transportation, storage and biosafety, yet certain hemorheological aspects of blood (such as PCV) and environmental conditions (such as temperature and humidity) are main factors which may hamper DBS-based quantifications [35,36].
After attaining significant effect and predictability of DBS size on Hb in the present study, the regression prediction equation of “Hb(g/dL)= 0.007+×DBS size – 18.21” was used to deduce CHb. The statistical difference between determined Hb and CHb is given in Figure 1 which indicated a non-significant (P≥0.05) difference between the two, reinforcing the reliability of the DBS method for Hb prediction. The values for determined Hb and CHb were 9.07 and 9.26g/dL, respectively. Similarly, the logilinear scatterplot between determined Hb and CHb is given in Figure 2 indicating an adjusted r-square value of 0.843 (84.3% probability). Results similar to ours with slightly higher adjusted r-square value of 0.9598 have been reported while deducing a comparison of Hb values attained conventionally and through DBS in humans [18].
On similar pattern, high values of 0.957 and 0.918 for Cronbach alpha and intraclass correlation coefficient were shown between determined Hb and CHb, respectively. Precision and accuracy were 0.918 and 0.992, respectively (Table 2). The level of agreement between two attributes was further evident through the Bland and Altman test (Figure 3) which revealed a close agreement with a mean of 0.195, whereas the upper and lower CIs were 0.345 and 0.045, respectively. Results similar to ours have been reported earlier for human blood while determining Hb using DBS [18]. Similarly, a strong correlation (r-value= 0.93) has been reported in a study from Italy between Hb deduced traditionally and through DBS in human blood [19]. Prior studies conducted on Hb and PCv determination through DBS have also reported similar values of accuracy, precision and Bland and Altman test as ours [18,19].
4. Conclusions
In a nutshell, the results of the present study indicate that DBS size is a substantially reliable predictor of Hb in cattle blood as compared to RBC count, PCV and TP. This indicates practical implication and feasibility of DBS size in predicting/determining Hb which may be used as a quick, reliable, accurate, on-field POCT for cattle diagnostics/prognostics, particularly in resource-poor settings, especially those where zebu (humped) cattle breeds are being reared under nomadic pastoralism. The present study took only one parameter of DBS in focus i.e. its size. The future studies may incorporate detailed image analysis techniques combined with advanced algorithms of attained DBS on filter papers using machine/deep learning models. This could improve the precision of DBS diameter measurements and correlate them more accurately with blood parameters. Alternatively, varying the DBS collection methods, such as adjusting blood volumes or using multi-layer filter papers, could also optimize sample absorption and uniformity, leading to more consistent correlations with hematological attributes. Finally, standardizing the environmental conditions (e.g. temperature and humidity) during blood spot drying and storage could minimize variability in the size and composition of the spots, making predictions for RBC, PCV, and TP more reliable. A comparative analysis of this technique in blood of healthy and diseased cattle could also be formulated in future.
Author’s Contributions: Conceptualization: U.F., M.I., M.H.L and M.A.A.; resources: M.H.L, and M.I..; original draft: U.F., J.T., A.N. and S.A; investigation and formal analysis: M.I., M.A.A., A.A. and M.C.; review and editing: U.F., M.C. and A.A. All authors have read and agreed to the published version of the manuscript.
Institutional Review Board Statement
The study is a part of a collaborative research project carried out by the Department of Zoology and Department of Physiology, IUB and was approved by the Departmental Ethics Committee vide approval No. PHYSIO-92/2024-79 dated 05-01-2024.
Informed Consent Statement
Informed consent was obtained from all subjects involved in the study.
Data Availability Statement
All the relevant data is within this manuscript.
Conflicts of Interest
The authors declare no conflict of interest.
References
- Kugonza, D.R.; Nabasirye, M.; Hanotte, O.; Mpairwe, D.; Okeyo, A.M. Pastoralists' indigenous selection criteria and other breeding practices of the long-horned Ankole cattle in Uganda. Tropical animal health and production. 2012, 44, 557–65. [Google Scholar] [CrossRef] [PubMed]
- Singh, R.R.; Singhal, L.; Chauhan, R. Biodiversity of indigenous cattle and its utility. Cow J. 2006, 6, 29–37. [Google Scholar]
- Farooq, U.; Idris, M.; Rashid, H. Conservation and upgradation of indigenous Cholistani cattle breed of Pakistan: a pathway to sustainable livestock. Tropical animal health and production. 2024, 56, 157. [Google Scholar] [CrossRef]
- Farooq, U.; Samad, H.; Sher, F.; Asim, M.; Khan, M.A. Cholistan and Cholistani Breed of Cattle. Pakistan Veterinary Journal. 2010, 30, 2074–7764. [Google Scholar]
- Sharif, M.; Lashari, M.H.; Farooq, U.; Idris, M.; Afzal, M.A. Diagnostic efficacy of hand-held digital refractometer for determining total serum protein in indigenous sheep of Pakistan. PloS one. 2024, 19, e0295107. [Google Scholar] [CrossRef] [PubMed]
- Idris, M.; Farooq, U.; Lashari, M.H.; Qayyum, S.; Arshad, A.; Riaz, U.; Khan, M.A.; Fatima, I.; Sajjad, H. Dynamics of Serum Biochemical Attributes in Indigenous Sipli Sheep Breed Kept under Intensive Farming System. Journal of Animal & Plant Sciences. 2024, 34, 276–82. [Google Scholar]
- Idris, M.; Farooq, U.; Rashid, H.; Lashari, M.H.; Riaz, U.; Khan, M.A.; et al. A preliminary study on the dynamics of serum color in perspective to hemoglobin and bilirubin in indigenous sheep of Pakistan. Journal of Experimental Zoology Part A: Ecological and Integrative Physiology. 2024, 341, 123–9. [Google Scholar] [CrossRef]
- Fi, Z.S.; Farooq, U.; Mahmood, S.A.; Lashari, M.H.; Sajjad, S. Hematochemical profile of Cholistani cattle being reared in Cholistan desert of Pakistan under pastoralism. Arquivo Brasileiro de Medicina Veterinária e Zootecnia. 2022, 74, 1111–8. [Google Scholar]
- Chaudhary, M.; Farooq, U.; Idris, M.; Lashari, M.H.; Qasim, S.; Afzal, M.A.; et al. First Report on Clinical Feasibility of Dried Blood Spot Technique for Hemoglobin Estimation in Cholistani Cattle. Advancements in Life Sciences. 2024, 11, 663–8. [Google Scholar] [CrossRef]
- Farooq, U.; Idris, M.; Sajjad, N.; Lashari, M.H.; Ahmad, S.; Rehman, Z.U.; et al. Investigating the potential of packed cell volume for deducing hemoglobin: Cholistani camels in perspective. PloS one. 2023, 18, e0280659. [Google Scholar] [CrossRef]
- Farooq, U.; Idris, M., Iqbal; Khurshid, A.; Rehman, Z.U.; Sajjad, N.; Afzal, M.A. Assessing total erythrocyte count as a potential attribute for estimating hemoglobin in Cholistani cattle. Tropical animal health and production. 2023, 55, 306. [Google Scholar] [CrossRef] [PubMed]
- Barroso, T.G.; Costa, J.M.; Gregório, A.H.; Martins, R.C. Painless Artificial Intelligence Point-of-Care hemogram diagnosis in Companion Animals. 2024.
- Velayudhan, B.T.; Naikare, H.K. Point-of-care testing in companion and food animal disease diagnostics. Frontiers in Veterinary Science. 2022, 9, 1056440. [Google Scholar] [CrossRef]
- Clark, K.S.; Hippel, T.G.; Whitfield, D.B. Manual, semiautomated, and point-of-care testing in hematology. Rodak's Hematology-E-Book: Clinical Principles and Applications. 2019, 154.
- Lindholm, C.; Altimiras, J. Point-of-care devices for physiological measurements in field conditions. A smorgasbord of instruments and validation procedures. Comparative Biochemistry and Physiology Part A: Molecular & Integrative Physiology. 2016, 202, 99–111. [Google Scholar]
- Ahmad, S.; Lashari, M.; Farooq, U. A preliminary study on devising a hematological formula for estimation of hemoglobin from packed cell volume in beetal goats. Arquivo Brasileiro de Medicina Veterinária e Zootecnia. 2022, 74, 77–82. [Google Scholar] [CrossRef]
- Ahmad, S.; Farooq, U.; Lashari, M.H.; Idris, M.; Rehman, Z.U.; Khan, N.; Sajjad, N. Devising and validating a pen-side hematological formula for hemoglobin estimation in Cholistani cattle. Tropical animal health and production. 2022, 54, 377. [Google Scholar] [CrossRef] [PubMed]
- Yang, X.; Piety, N.Z.; Vignes, S.M.; Benton, M.S.; Kanter, J.; Shevkoplyas, S.S. Simple paper-based test for measuring blood hemoglobin concentration in resource-limited settings. Clinical Chemistry. 2013, 59, 1506–13. [Google Scholar] [CrossRef] [PubMed]
- Del Ben, F.; Biasizzo, J.; Curcio, F. A fast, nondestructive, low-cost method for the determination of hematocrit of dried blood spots using image analysis. Clinical Chemistry and Laboratory Medicine (CCLM). 2019, 57, e81–e2. [Google Scholar] [CrossRef] [PubMed]
- Zakaria, R.; Allen, K.J.; Koplin, J.J.; Crinis, N.; De Rosa, L.; Roche, P.; et al. Determination of haemoglobin derivatives in aged dried blood spot to estimate haematocrit. Clinical Chemistry and Laboratory Medicine (CCLM). 2019, 57, 1026–34. [Google Scholar] [CrossRef] [PubMed]
- Ait Belkacem, I.; Mossadegh-keller, N.; Bourgoin, P.; Arnoux, I.; Loosveld, M.; Morange, P.e.; et al. Cell analysis from dried blood spots: new opportunities in immunology, hematology, and infectious diseases. Advanced Science. 2021, 8, 2100323. [Google Scholar] [CrossRef] [PubMed]
- Majda, A.; Wietecha-Posłuszny, R.; Mendys, A.; Wójtowicz, A.; Łydżba-Kopczyńska, B. Hyperspectral imaging and multivariate analysis in the dried blood spots investigations. Applied Physics A. 2018, 124, 1–8. [Google Scholar] [CrossRef]
- McClendon-Weary, B.; Putnick, D.L.; Robinson, S.; Yeung, E. Little to give, much to gain—what can you do with a dried blood spot? Current environmental health reports. 2020, 7, 211–21. [Google Scholar] [CrossRef] [PubMed]
- Nichols, B.E.; Girdwood, S.J.; Shibemba, A.; Sikota, S.; Gill, C.J.; Mwananyanda, L.; et al. Cost and impact of dried blood spot versus plasma separation card for scale-up of viral load testing in resource-limited settings. Clinical infectious diseases. 2020, 70, 1014–20. [Google Scholar] [CrossRef]
- Wong, V.; Yan, T.; Donald, A.; McLean, M. Saliva and bloodspot cortisol: novel sampling methods to assess hydrocortisone replacement therapy in hypoadrenal patients. Clinical endocrinology. 2004, 61, 131–7. [Google Scholar] [CrossRef] [PubMed]
- Samsonova, J.; Chadina, A.; Osipov, A.; Kondakov, S.; Makarova, T.; Komarov, A. Detection of bovine leukemia virus by the polymerase chain reaction in dried blood spots using a membrane system of a new format. Moscow University Chemistry Bulletin. 2014, 69, 282–5. [Google Scholar] [CrossRef]
- Michaud, V.; Gil, P.; Kwiatek, O.; Prome, S.; Dixon, L.; Romero, L.; et al. Long-term storage at tropical temperature of dried-blood filter papers for detection and genotyping of RNA and DNA viruses by direct PCR. Journal of virological methods. 2007, 146, 257–65. [Google Scholar] [CrossRef] [PubMed]
- Lechmann, J.; Gehrig, O.; Luginbühl, M.; Fraefel, C.; Gaugler, S. Fully automated dried blood spot sample handling and extraction for BoHV-1 antibody testing by ELISA. Journal of virological methods. 2022, 310, 114626. [Google Scholar] [CrossRef] [PubMed]
- Wickremsinhe, E.R.; Perkins, E.J. Using dried blood spot sampling to improve data quality and reduce animal use in mouse pharmacokinetic studies. Journal of the American Association for Laboratory Animal Science. 2015, 54, 139–44. [Google Scholar] [PubMed]
- Mott, J.; Dolan, J.K.; Gilor, C.; Gilor, S. Establishment of a feline glycated hemoglobin reference interval for a novel dried-blood-spot assay and the effects of anemia on assay results. Veterinary Clinical Pathology. 2023, 52, 531–9. [Google Scholar] [CrossRef] [PubMed]
- Monguno, M.B.; Gambo, A.B.; Waziri, A.; Baba, H. A Preliminary Investigation on The Applicability of The Size of Blood Spotted on Filter Paper in The Diagnosis of Anemia in Cattle. 2023.
- Toteja, G.; Singh, P.; Dhillon, B.; Saxena, B.; Ahmed, F.; Singh, R.; et al. Prevalence of anemia among pregnant women and adolescent girls in 16 districts of India. Food and Nutrition Bulletin. 2006, 27, 311–5. [Google Scholar] [CrossRef]
- Bansal, P.G.; Toteja, G.S.; Bhatia, N.; Gupta, S.; Kaur, M.; Adhikari, T.; et al. Comparison of haemoglobin estimates using direct & indirect cyanmethaemoglobin methods. The Indian journal of medical research. 2016, 144, 566. [Google Scholar] [PubMed]
- Gupta, A.; Kapil, U.; Ramakrishnan, L.; Khenduja, P.; Yadav, C.P.; Sofi, N.Y.; et al. Validity of estimation of haemoglobin content in dried blood spot samples. Indian Journal of Hematology and Blood Transfusion. 2017, 33, 565–7. [Google Scholar] [CrossRef]
- De Kesel, P.M.; Sadones, N.; Capiau, S.; Lambert, W.E.; Stove, C.P. Hemato-critical issues in quantitative analysis of dried blood spots: challenges and solutions. Bioanalysis. 2013, 5, 2023–41. [Google Scholar] [CrossRef] [PubMed]
- Malsagova, K.; Kopylov, A.; Stepanov, A.; Butkova, T.; Izotov, A.; Kaysheva, A. Dried blood spot in laboratory: directions and prospects. Diagnostics. 2020, 10, 248. [Google Scholar] [CrossRef] [PubMed]
Figure 1.
Difference between determined Hb and corrected (CHb) in Cholistani cattle (n=71). The error bars indicate mean (±SE) values.
Figure 1.
Difference between determined Hb and corrected (CHb) in Cholistani cattle (n=71). The error bars indicate mean (±SE) values.
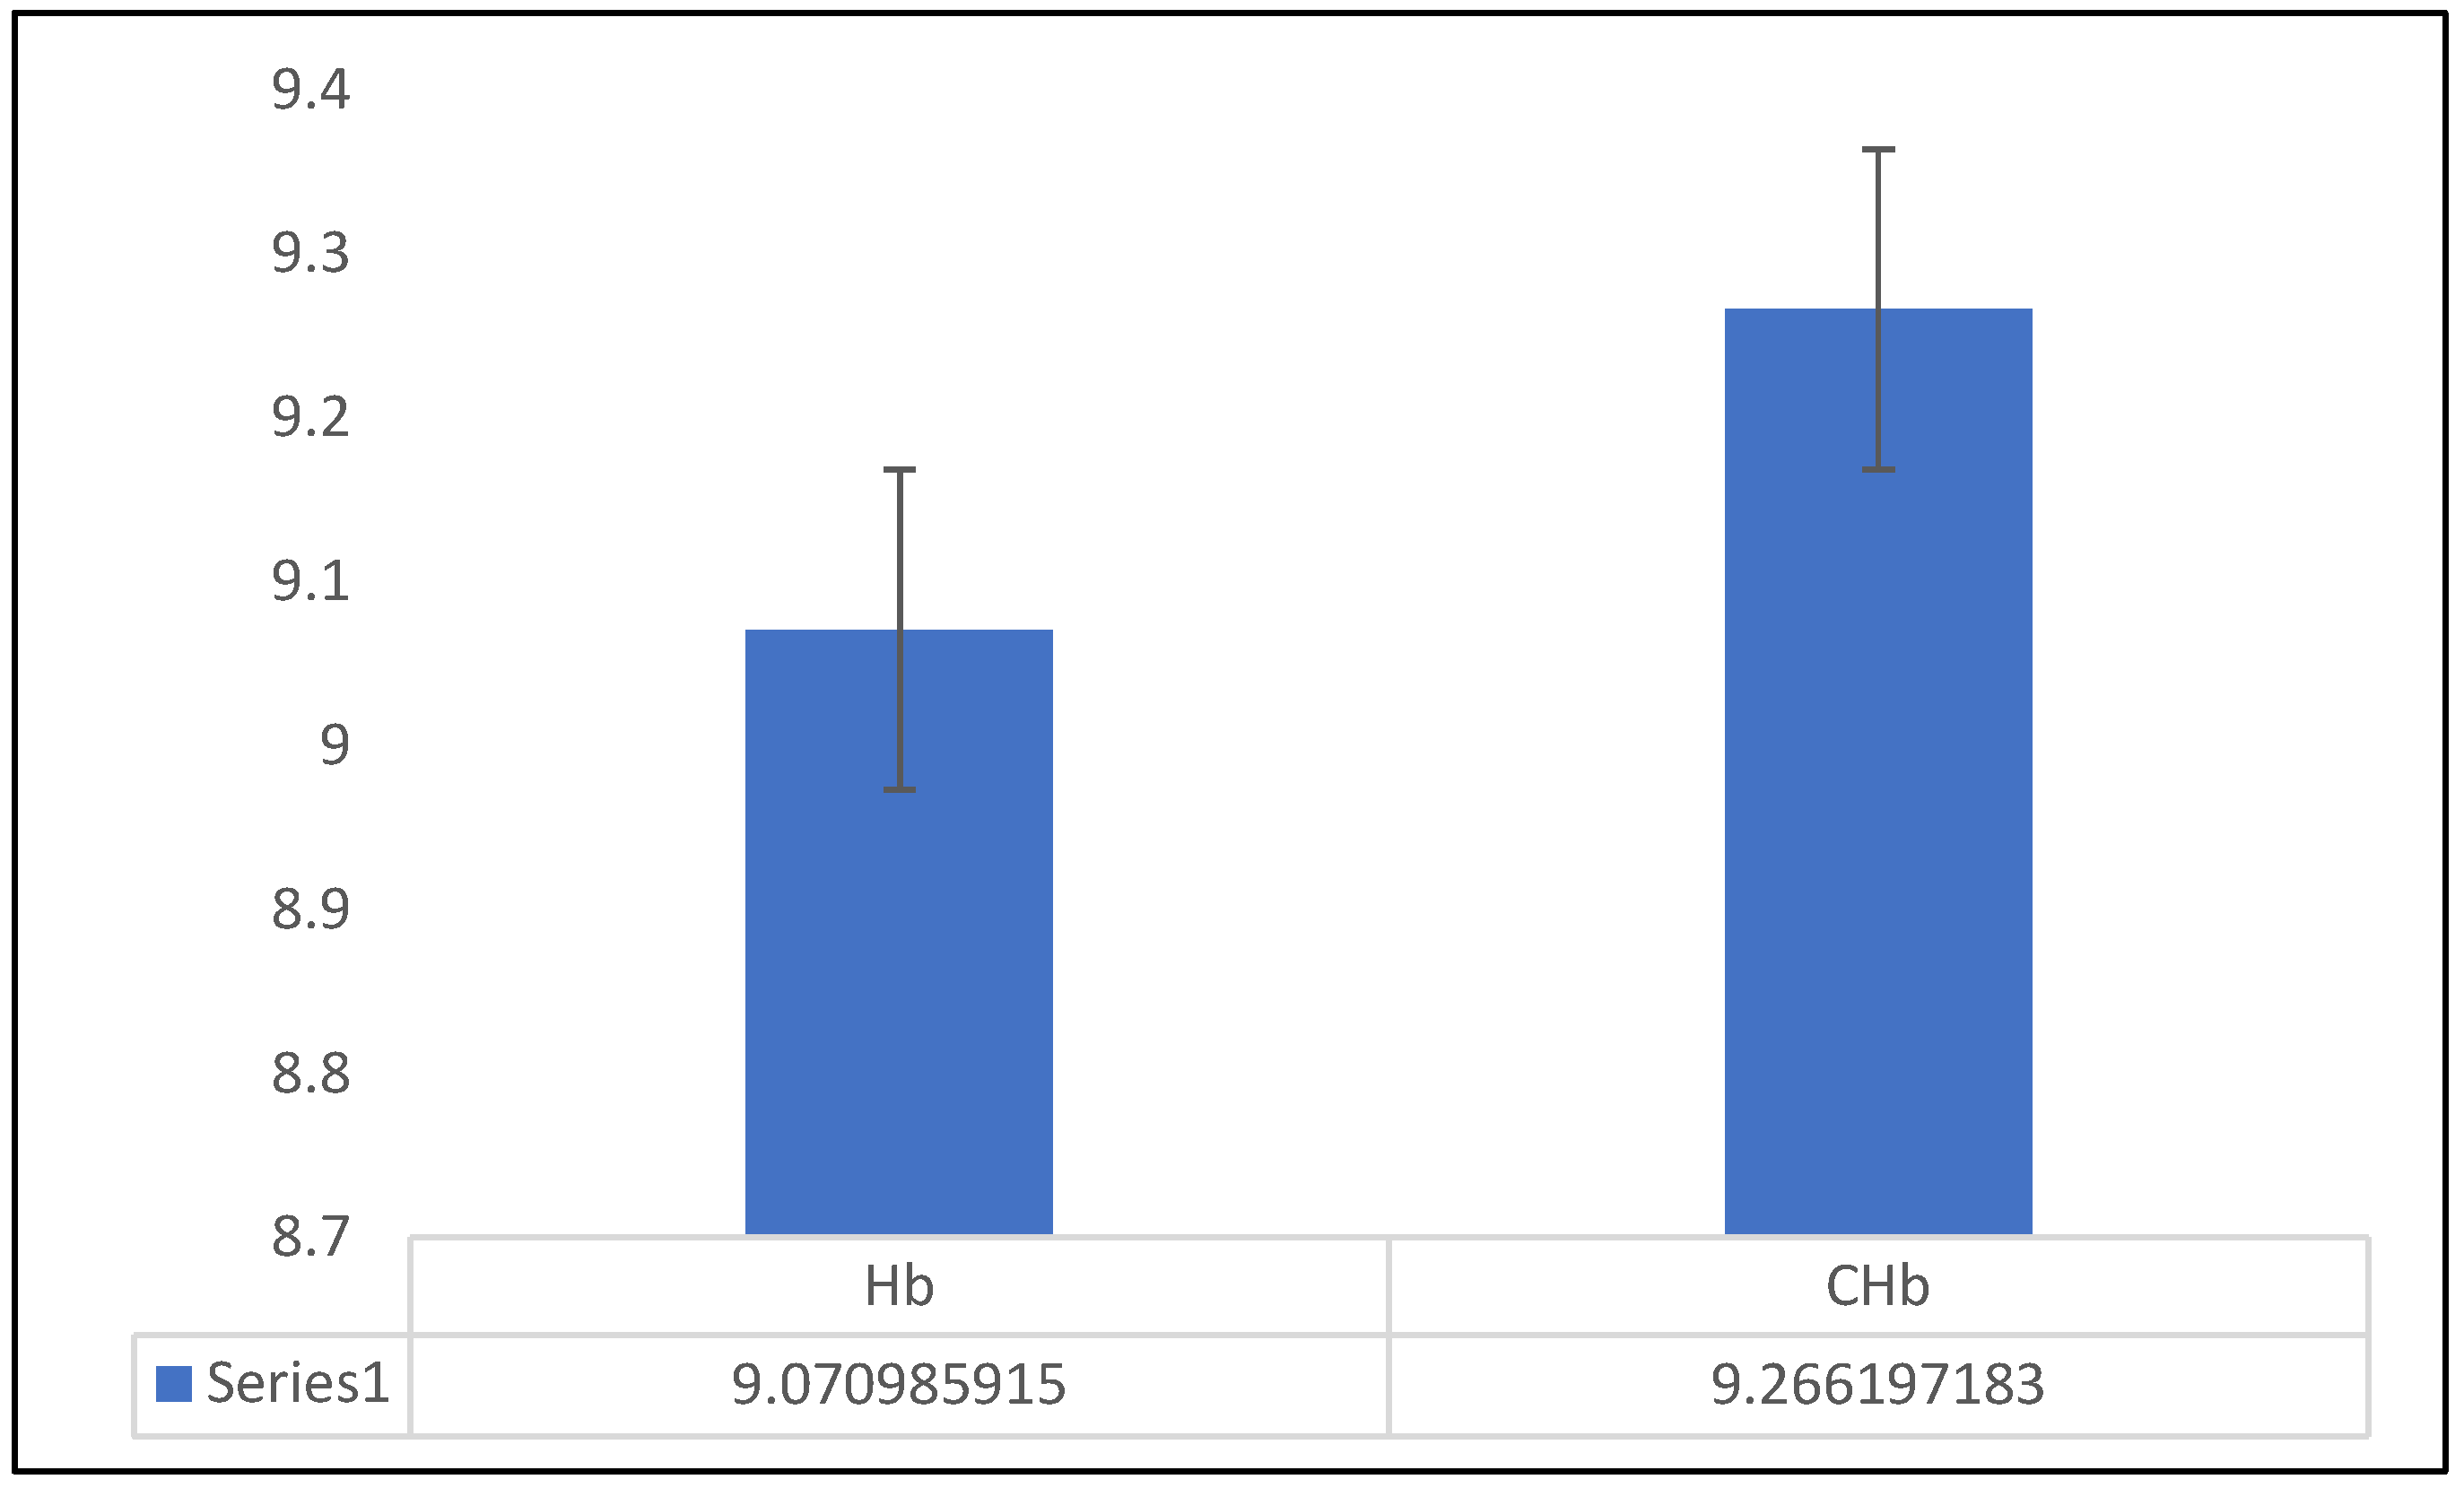
Figure 2.
Scatterplot indicating logilinear regression between determined Hb and corrected Hb in Cholistani cattle (n=71).
Figure 2.
Scatterplot indicating logilinear regression between determined Hb and corrected Hb in Cholistani cattle (n=71).
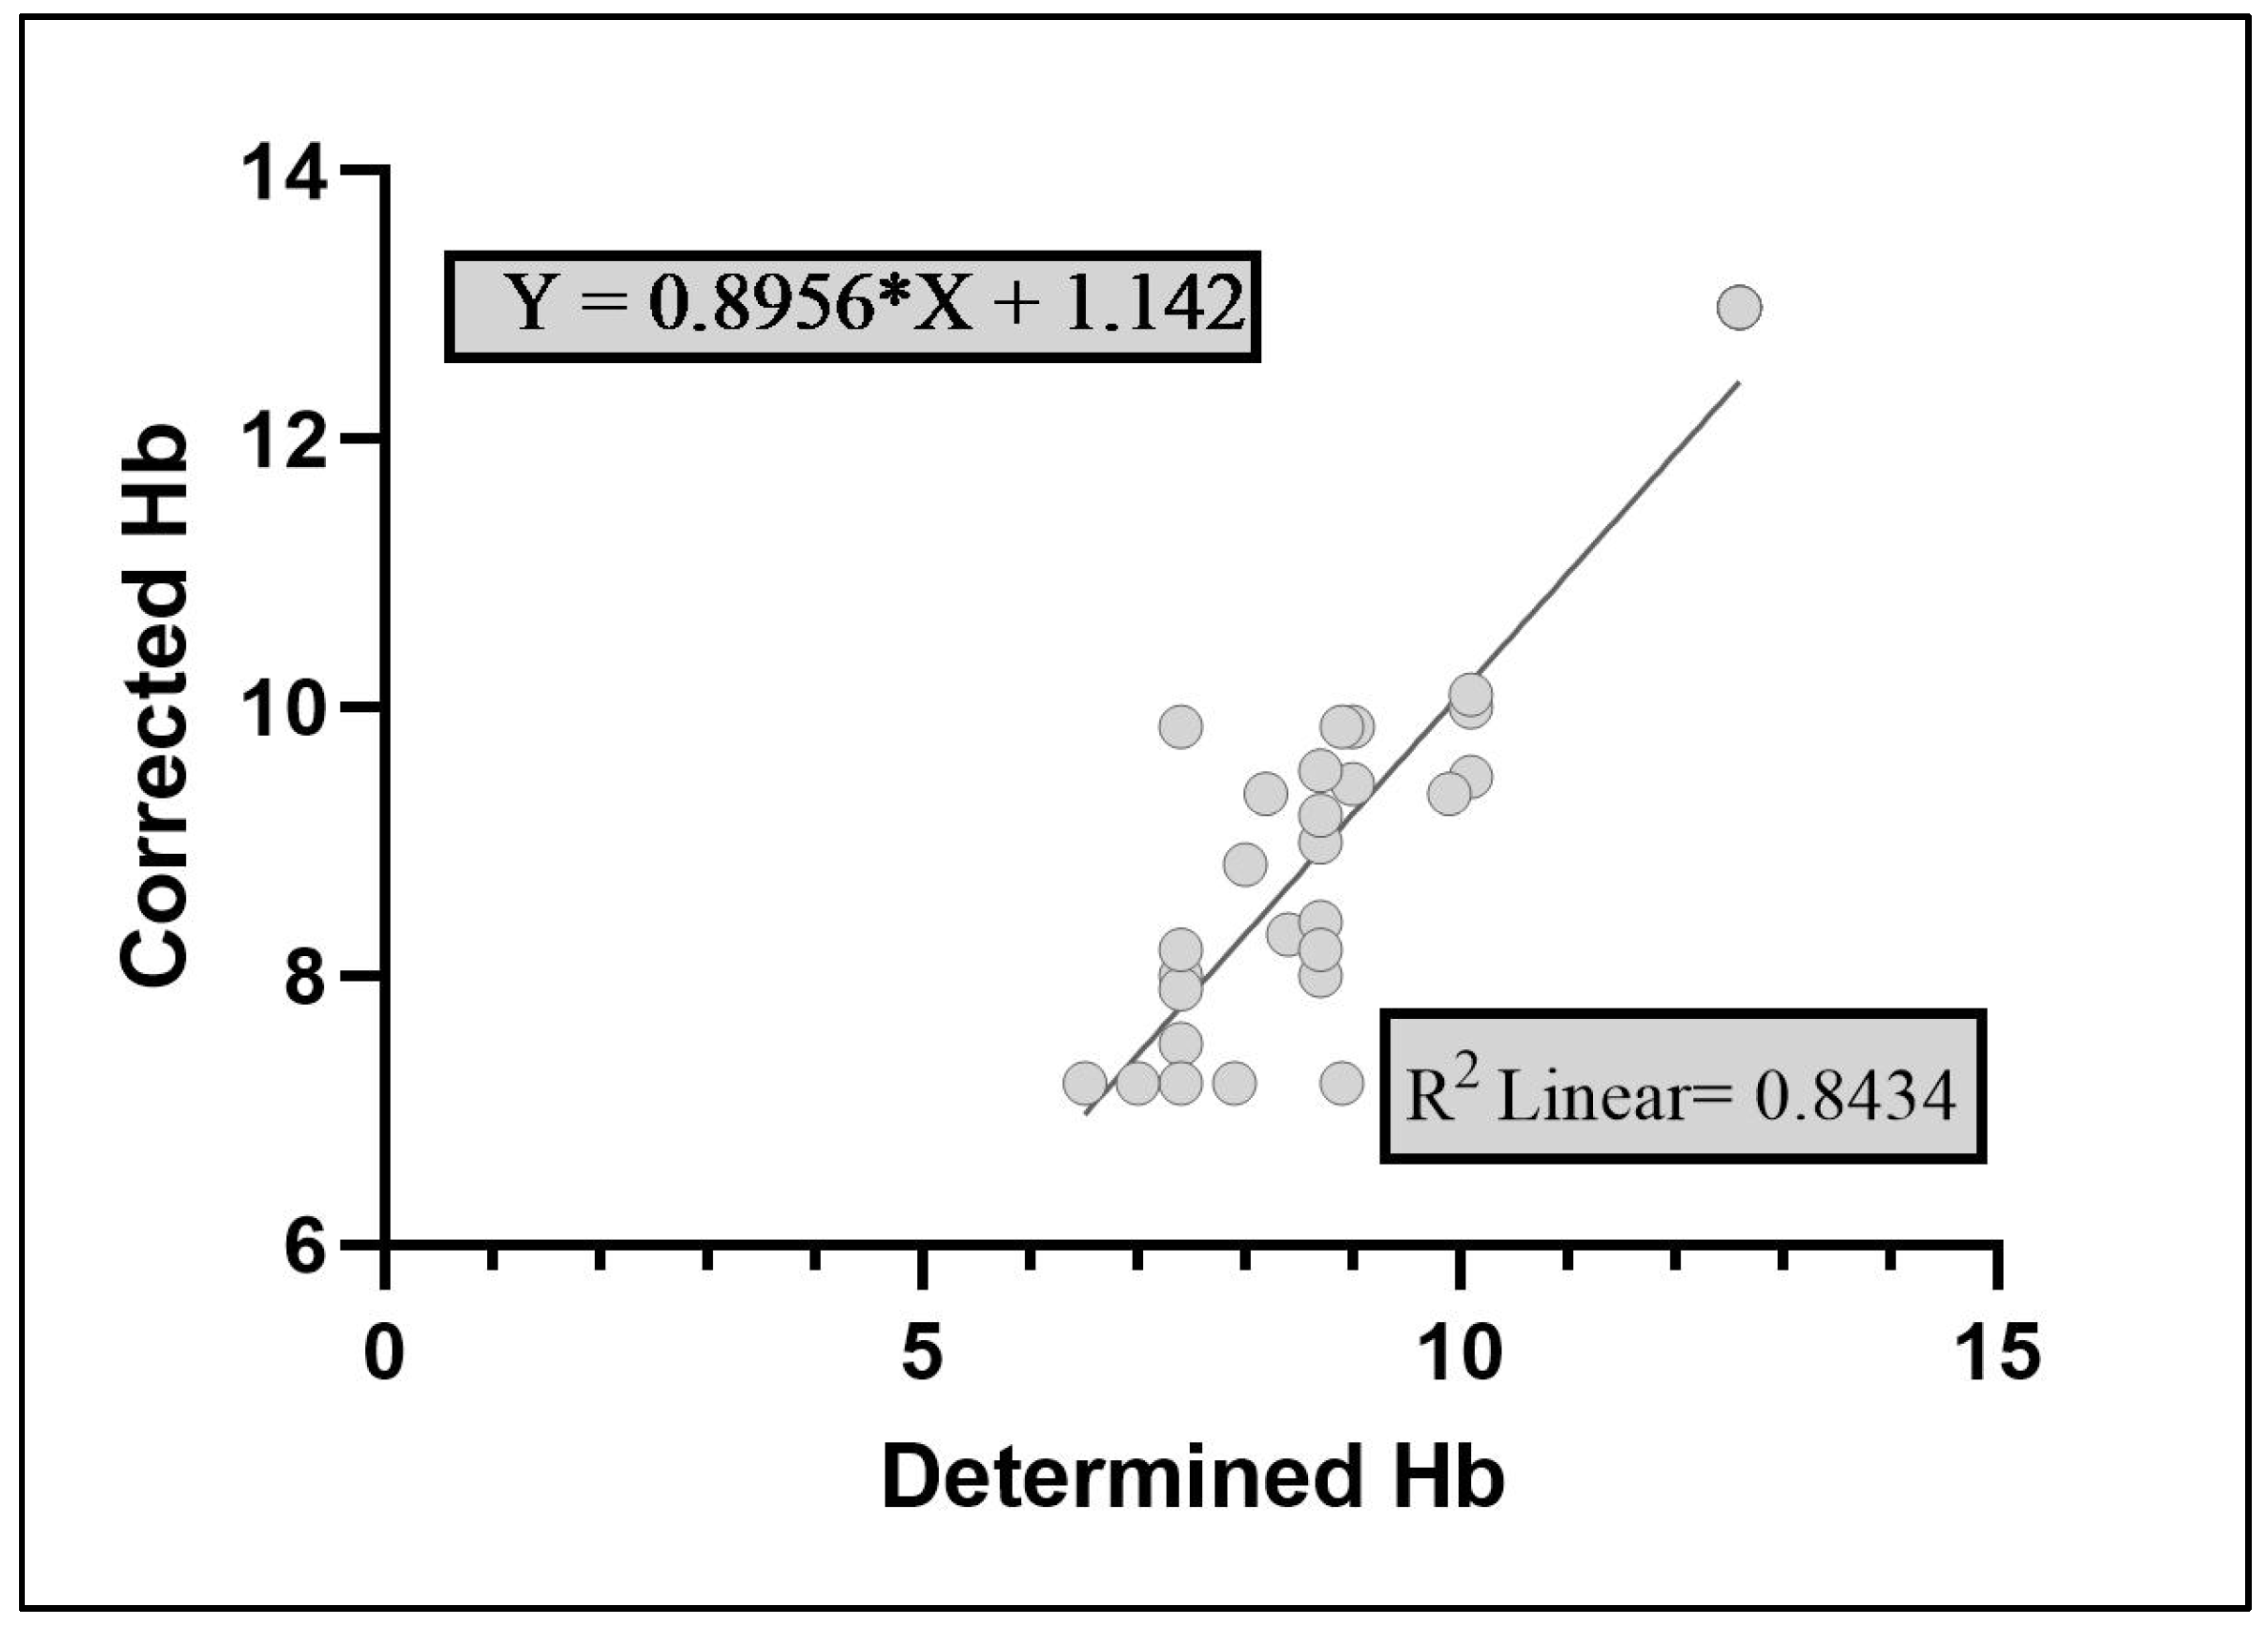
Figure 3.
Scatterplot of Bland and Altman test between difference of determined Hb and corrected Hb, and mean of both. Black line indicates mean (0.195) whereas the upper and lower red-dotted lines indicate upper (0.345) and lower (0.045) values for 95% CI, respectively.
Figure 3.
Scatterplot of Bland and Altman test between difference of determined Hb and corrected Hb, and mean of both. Black line indicates mean (0.195) whereas the upper and lower red-dotted lines indicate upper (0.345) and lower (0.045) values for 95% CI, respectively.
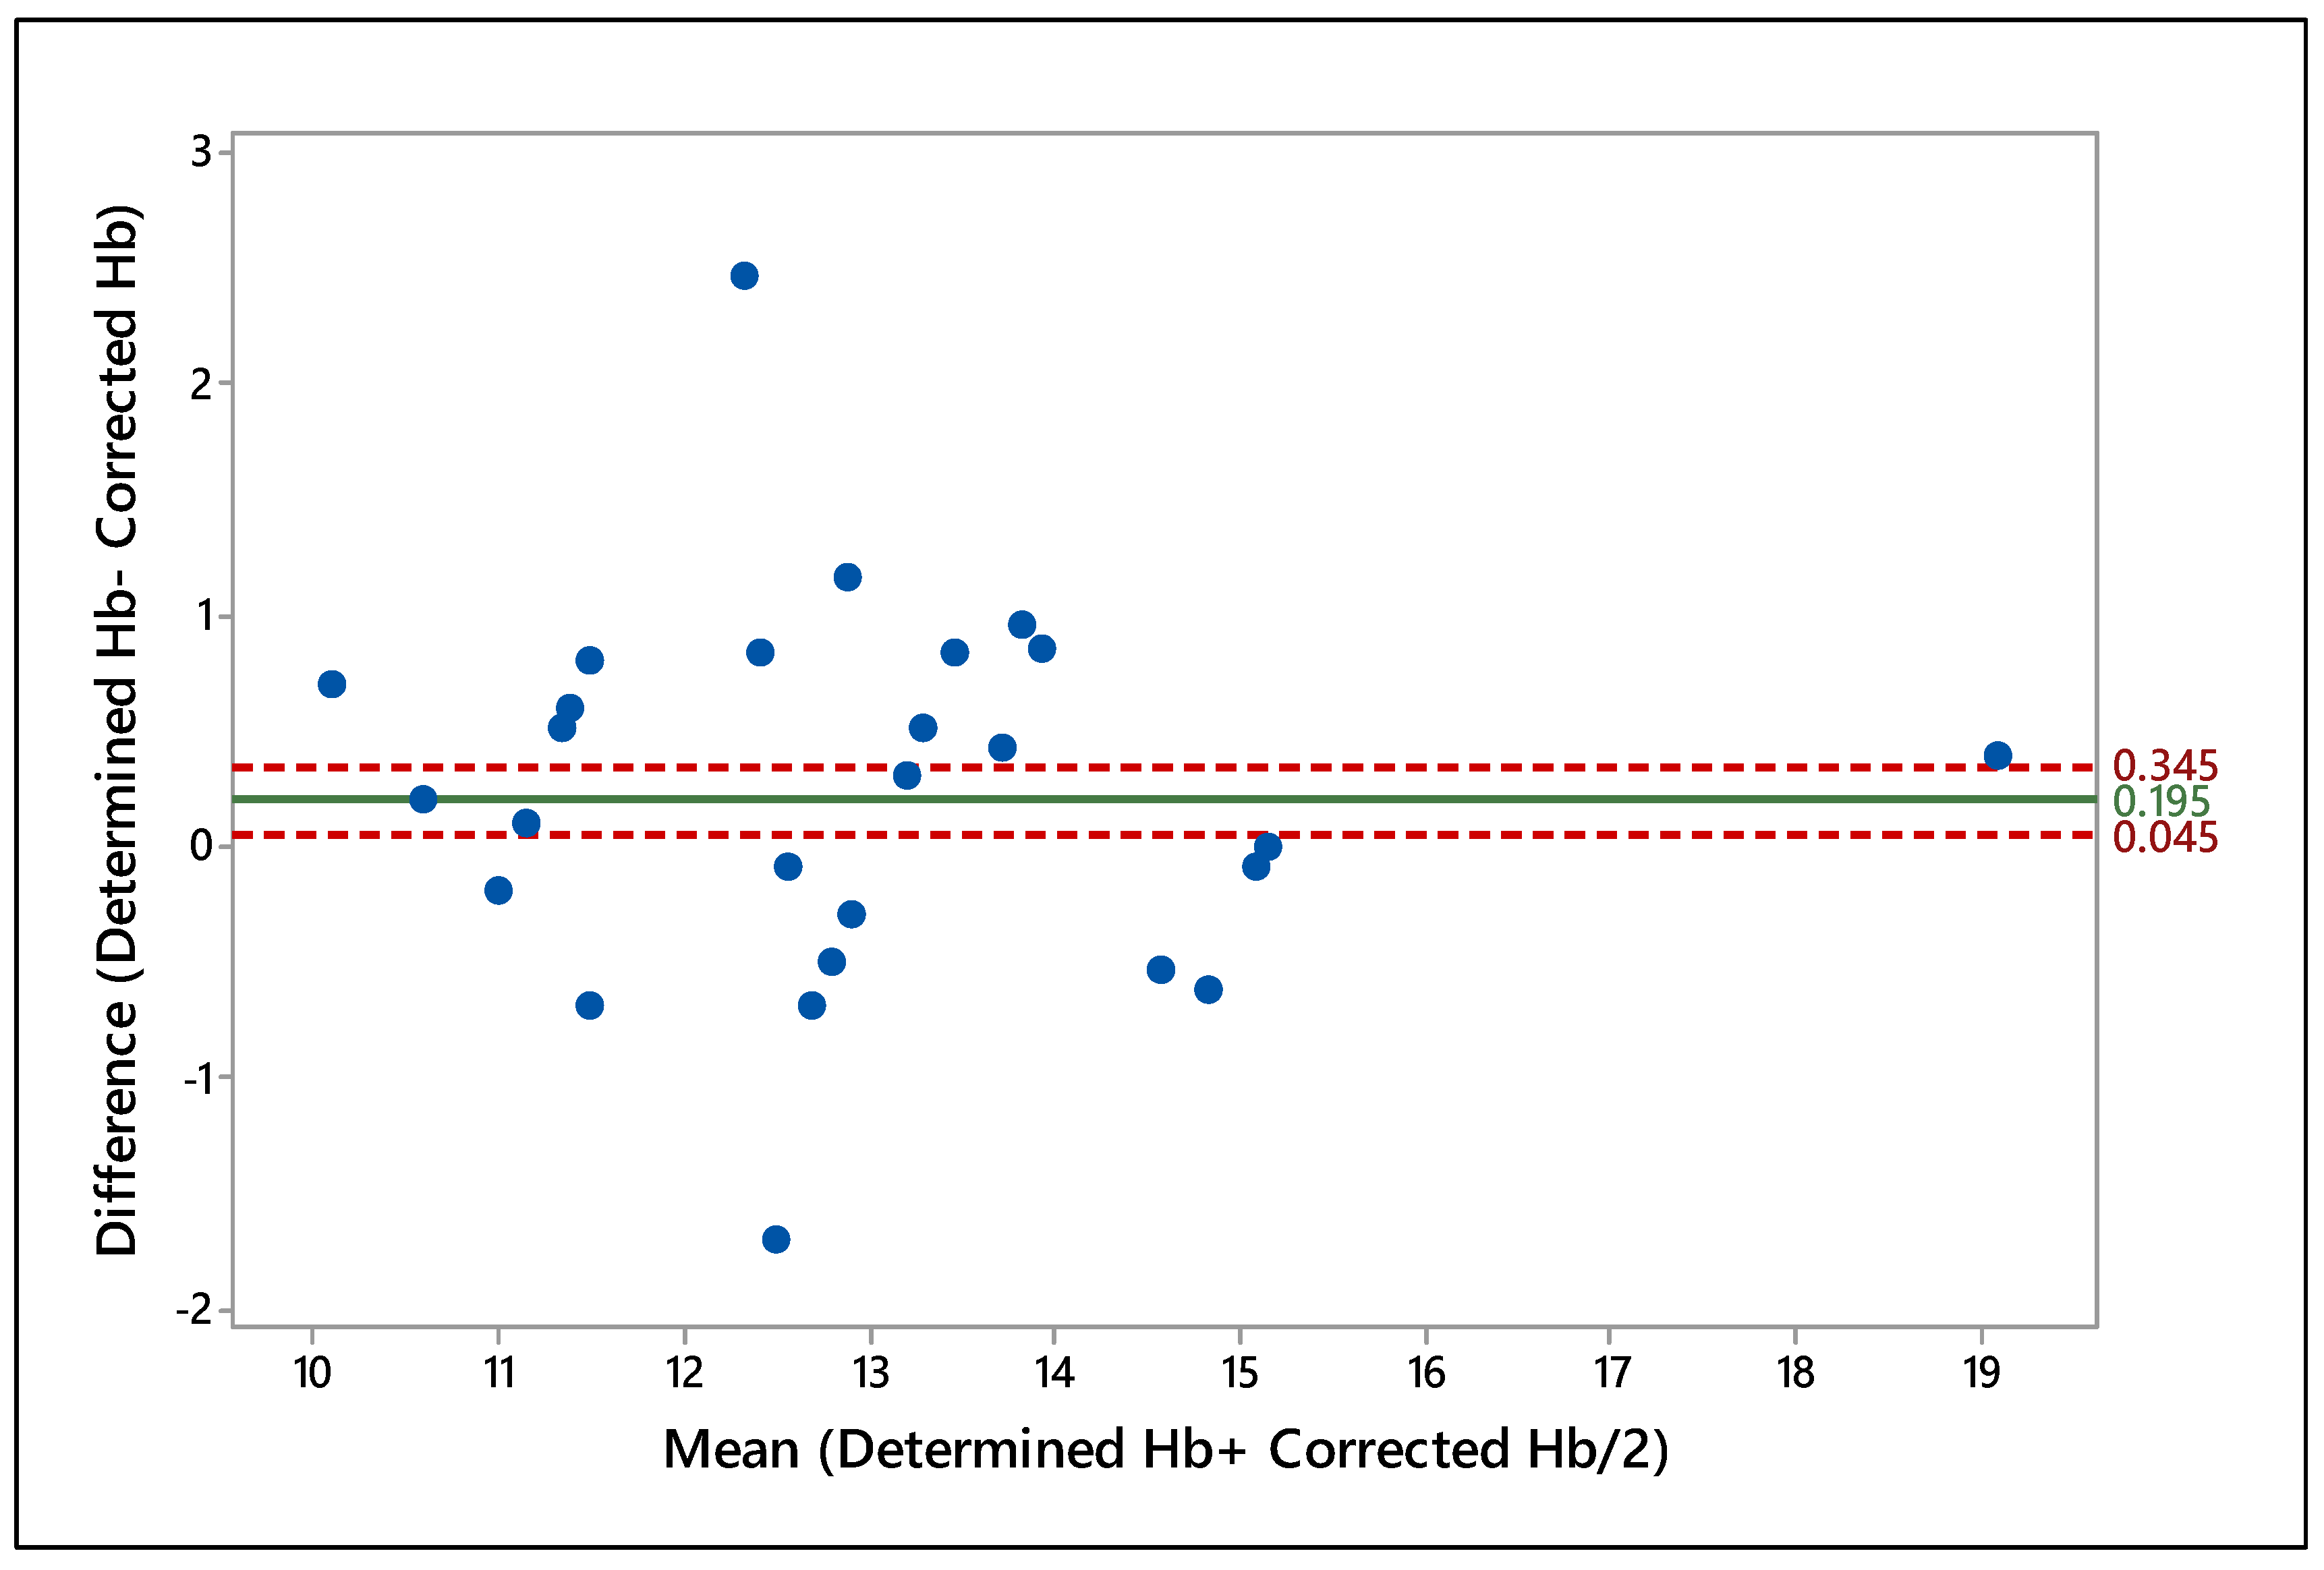

Table 1.
The overall mean (±SE) values, multivariate general linear model test and regression analysis between size of dried blood spot (DBS) and various hematological attributes in Cholistani cattle (n=71).
Table 1.
The overall mean (±SE) values, multivariate general linear model test and regression analysis between size of dried blood spot (DBS) and various hematological attributes in Cholistani cattle (n=71).
| Attributes | Mean(±SE) | r-value | Adj-r-square | Prediction Equation | F-value | Type III SS | Sig. |
|---|---|---|---|---|---|---|---|
| RBC Count (1012/µL) | 7.00±0.6 | 0.428 | 0.066 | -8.73+(0.004x) | 1.560 | 4.47 | 0.251 |
| Hemoglobin (g/dL) | 8.95±0.6 | 0.828 | 0.762 | 18.21+(0.007x) | 7.880 | 13.33 | 0.026 |
| Packed Cell Volume (%) | 29.95±2.2 | 0.554 | 0.208 | -47.0+(0.020x) | 3.10 | 108.26 | 0.121 |
| Total Protein (g/L) | 58.33±3.2 | 0.253 | -0.070 | 7.89+(0.013x) | 0.479 | 45.95 | 0.511 |
| DBS (µm) | 3954.22±62.6 | - | - | - | - | - | - |
Table 2.
Intraclass coefficient correlation, Cronbach alpha and Lin’s concordance test between determined Hb and corrected Hb (CHb) in Cholistani cattle (n=71).
Table 2.
Intraclass coefficient correlation, Cronbach alpha and Lin’s concordance test between determined Hb and corrected Hb (CHb) in Cholistani cattle (n=71).
| Determined Hb versus CHb | Precision | Accuracy (χa) |
|||
|---|---|---|---|---|---|
| Intraclass Correlation | 95% CI | Cronbach Alpha | |||
| Single Measure | 0.918 | 0.871-0.948 | 0.957 | 0.918 | 0.992 |
| Average Measures | 0.957 | 0.931-0.973 | |||
Disclaimer/Publisher’s Note: The statements, opinions and data contained in all publications are solely those of the individual author(s) and contributor(s) and not of MDPI and/or the editor(s). MDPI and/or the editor(s) disclaim responsibility for any injury to people or property resulting from any ideas, methods, instructions or products referred to in the content. |
© 2024 by the authors. Licensee MDPI, Basel, Switzerland. This article is an open access article distributed under the terms and conditions of the Creative Commons Attribution (CC BY) license (http://creativecommons.org/licenses/by/4.0/).
Copyright: This open access article is published under a Creative Commons CC BY 4.0 license, which permit the free download, distribution, and reuse, provided that the author and preprint are cited in any reuse.


