
Submitted:
18 November 2024
Posted:
19 November 2024
Read the latest preprint version here
Abstract
As urban areas face increasing challenges, integrating smart infrastructure, particularly IoT and AI technologies, has become vital for enhancing resilience. This study focuses on Baltimore as a case study to explore how scalable and adaptable smart infrastructure solutions can address diverse urban needs within a mid-sized U.S. city. Through a comprehensive review of Baltimore’s socioeconomic indicators and the development of a composite resilience score, this paper identifies key factors that facilitate or hinder the scalability and adaptability of smart infrastructure in economically and demographically varied urban contexts. The resilience score provides a quantitative measure of urban resilience, enabling the analysis of trends and dependencies among socioeconomic indicators over time. Findings reveal critical roles for both community engagement and policy support in adapting technologies to local needs, while economic and technical factors influence the scalability of IoT and AI projects. Based on these insights, the study proposes a framework that offers practical guidance for expanding Baltimore’s smart infrastructure in ways that are economically feasible, technically viable, and socially inclusive. This framework aims to assist Baltimore’s policymakers, urban planners, and technologists in advancing resilient, scalable solutions that align with the city's unique infrastructure needs and resource constraints.
Keywords:
Introduction
Methodology
- 1.
-
Data Collection
- Socio-Economic and Infrastructure Data: Key indicators like poverty rate, population, median household income, commuting time for workers, market hotness data and unemployment rates were collected from the Federal Reserve Bank of St. Louis.
- Market Hotness Data: Real estate metrics, particularly market hotness (days on market), were included to understand real estate dynamics in Baltimore from the Federal Reserve Bank of St. Louis.
- Education and Household Data: Data on total enrollment, completed bachelor’s degrees, and household ownership were gathered was sourced from the USA Data website to assess educational attainment and residential stability, important factors in urban resilience.
- Commute and Insurance Data: Information on various commuting modes and insurance coverage (public and private) was sourced from the USA Data website, helping analyze workforce mobility and access to health resources within the city.
- 2.
-
Data Preparation
- Data Cleaning:
- 1.
- Initial Data Inspection: The datasets were loaded and conducted an initial inspection to identify data types, assess the presence of missing values, and obtain summary statistics for the numerical columns.
- 2.
- Date Conversion: Date columns were converted to a datetime format. Any errors in date conversion were coerced to NaT to maintain data integrity.
- 3.
-
Handling Missing Values: Missing values in certain fields were filled with context-specific values to ensure completeness.
- Data Transformation and Aggregation:
- 1.
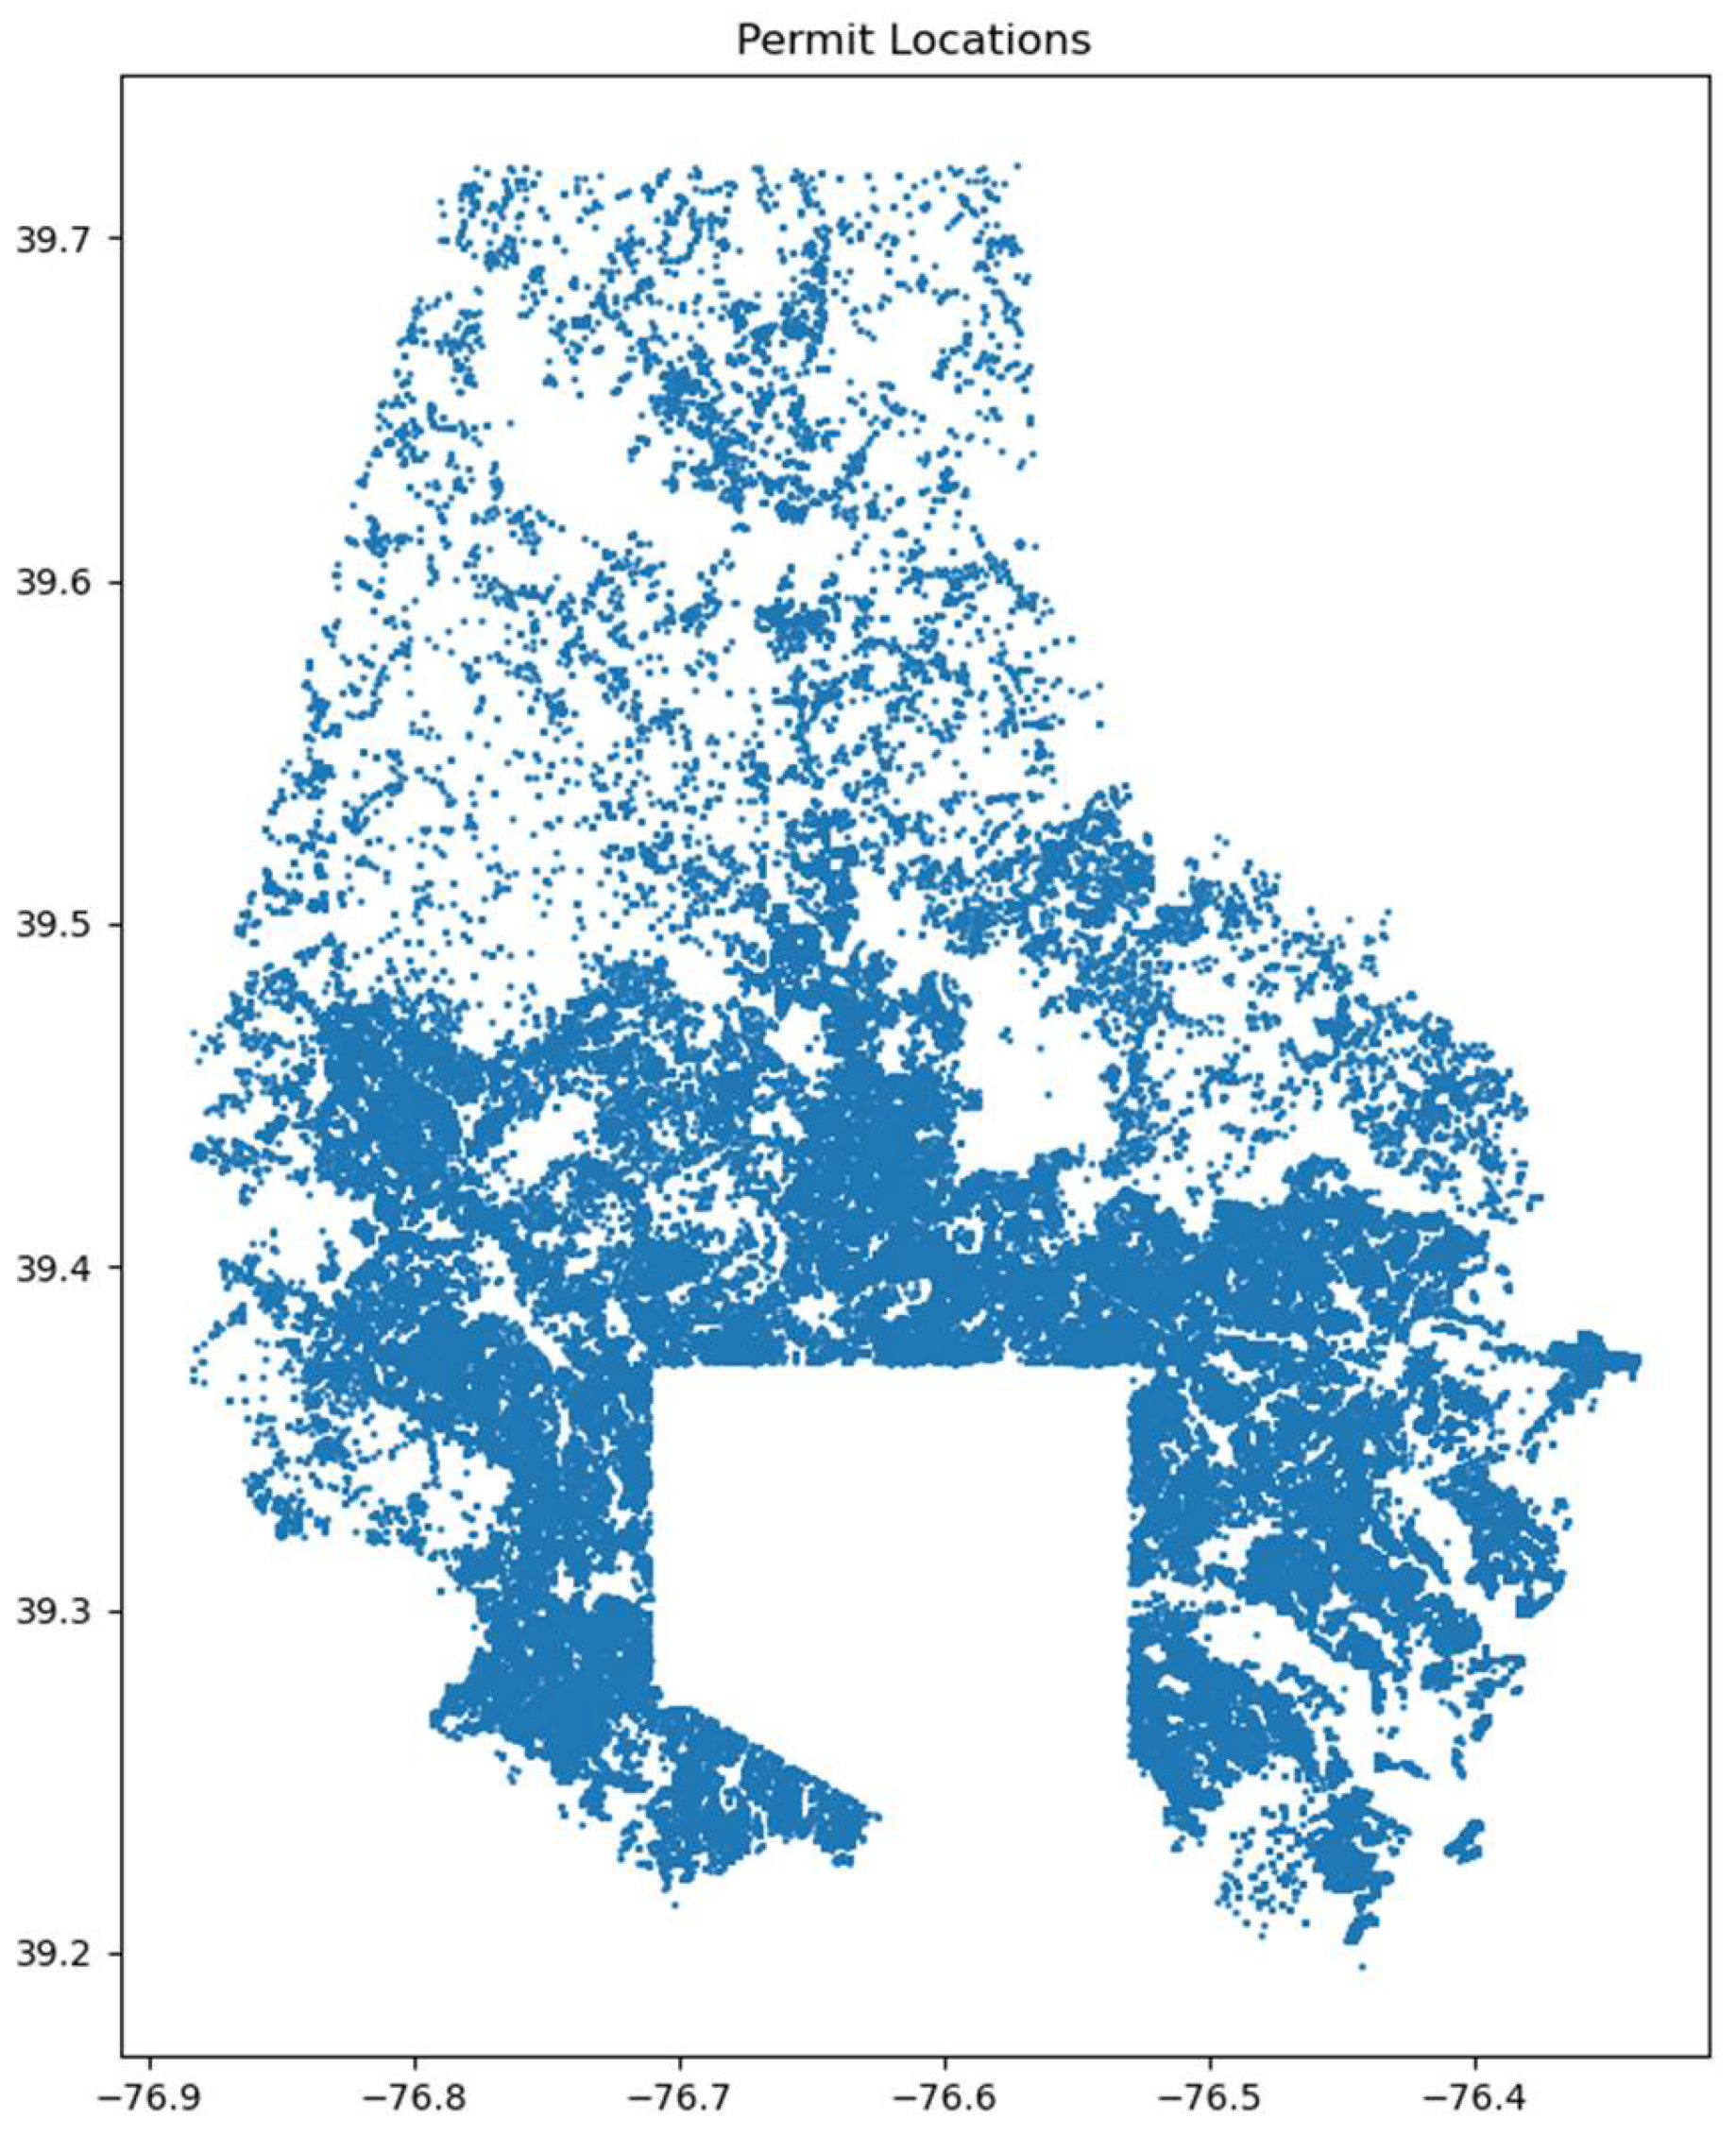
- Geospatial Transformation: Latitude and longitude coordinates were transformed into Point geometries using the GeoPandas library19, allowing us to analyze and visualize the spatial distribution of permits within Baltimore County. These coordinates were then converted into a GeoDataFrame, enabling spatial plotting and analysis with Geographic Information System (GIS) tools.
- 2.
- Yearly Aggregation for Resilience Analysis: To assess trends over time, we aggregated indicators by year. This included calculating average values for socio-economic indicators, such as poverty rate, median household income, and insurance coverage, across the study period (2017-2022). This aggregation supported the time-series analysis of resilience indicators, allowing us to observe shifts in socio-economic factors that influence resilience.
- 3.
-
Data Analysis
- Correlation Analysis: To explore relationships between key socio-economic indicators, a correlation matrix was generated. The analysis helped identify interconnected factors, such as the relationship between income levels and household ownership, or commuting patterns and employment status.
- 4.
-
Spatial Analysis
- Permit Density Mapping: A spatial analysis of permit activities was conducted to identify high-density areas with significant construction or renovation projects. This spatial concentration was visualized on a map, revealing “hotspots” where IoT and AI technologies could be prioritized due to high infrastructure demands and potential for data collection. The GeoPandas library20 was utilized to handle and analyze geospatial data efficiently.
- 5.
-
Comparative Analysis of Socio-Economic Indicators Trends
- Trend Analysis Across Key Indicators: By grouping and comparing indicators by year, trends in variables like poverty rate, median income, unemployment, and household ownership were examined. This allowed for the assessment of socio-economic shifts in Baltimore over time, providing insights into factors that influence resilience and adaptability in smart infrastructure.
- 6.
- Calculating the Resilience Score
- Normalization of Indicators: Each indicator was normalized to a scale from 0 to 1 using MinMaxScaler21, a preprocessing tool that standardizes the range of each variable. This approach ensures that all indicators contribute comparably to the resilience score, regardless of their original scales.
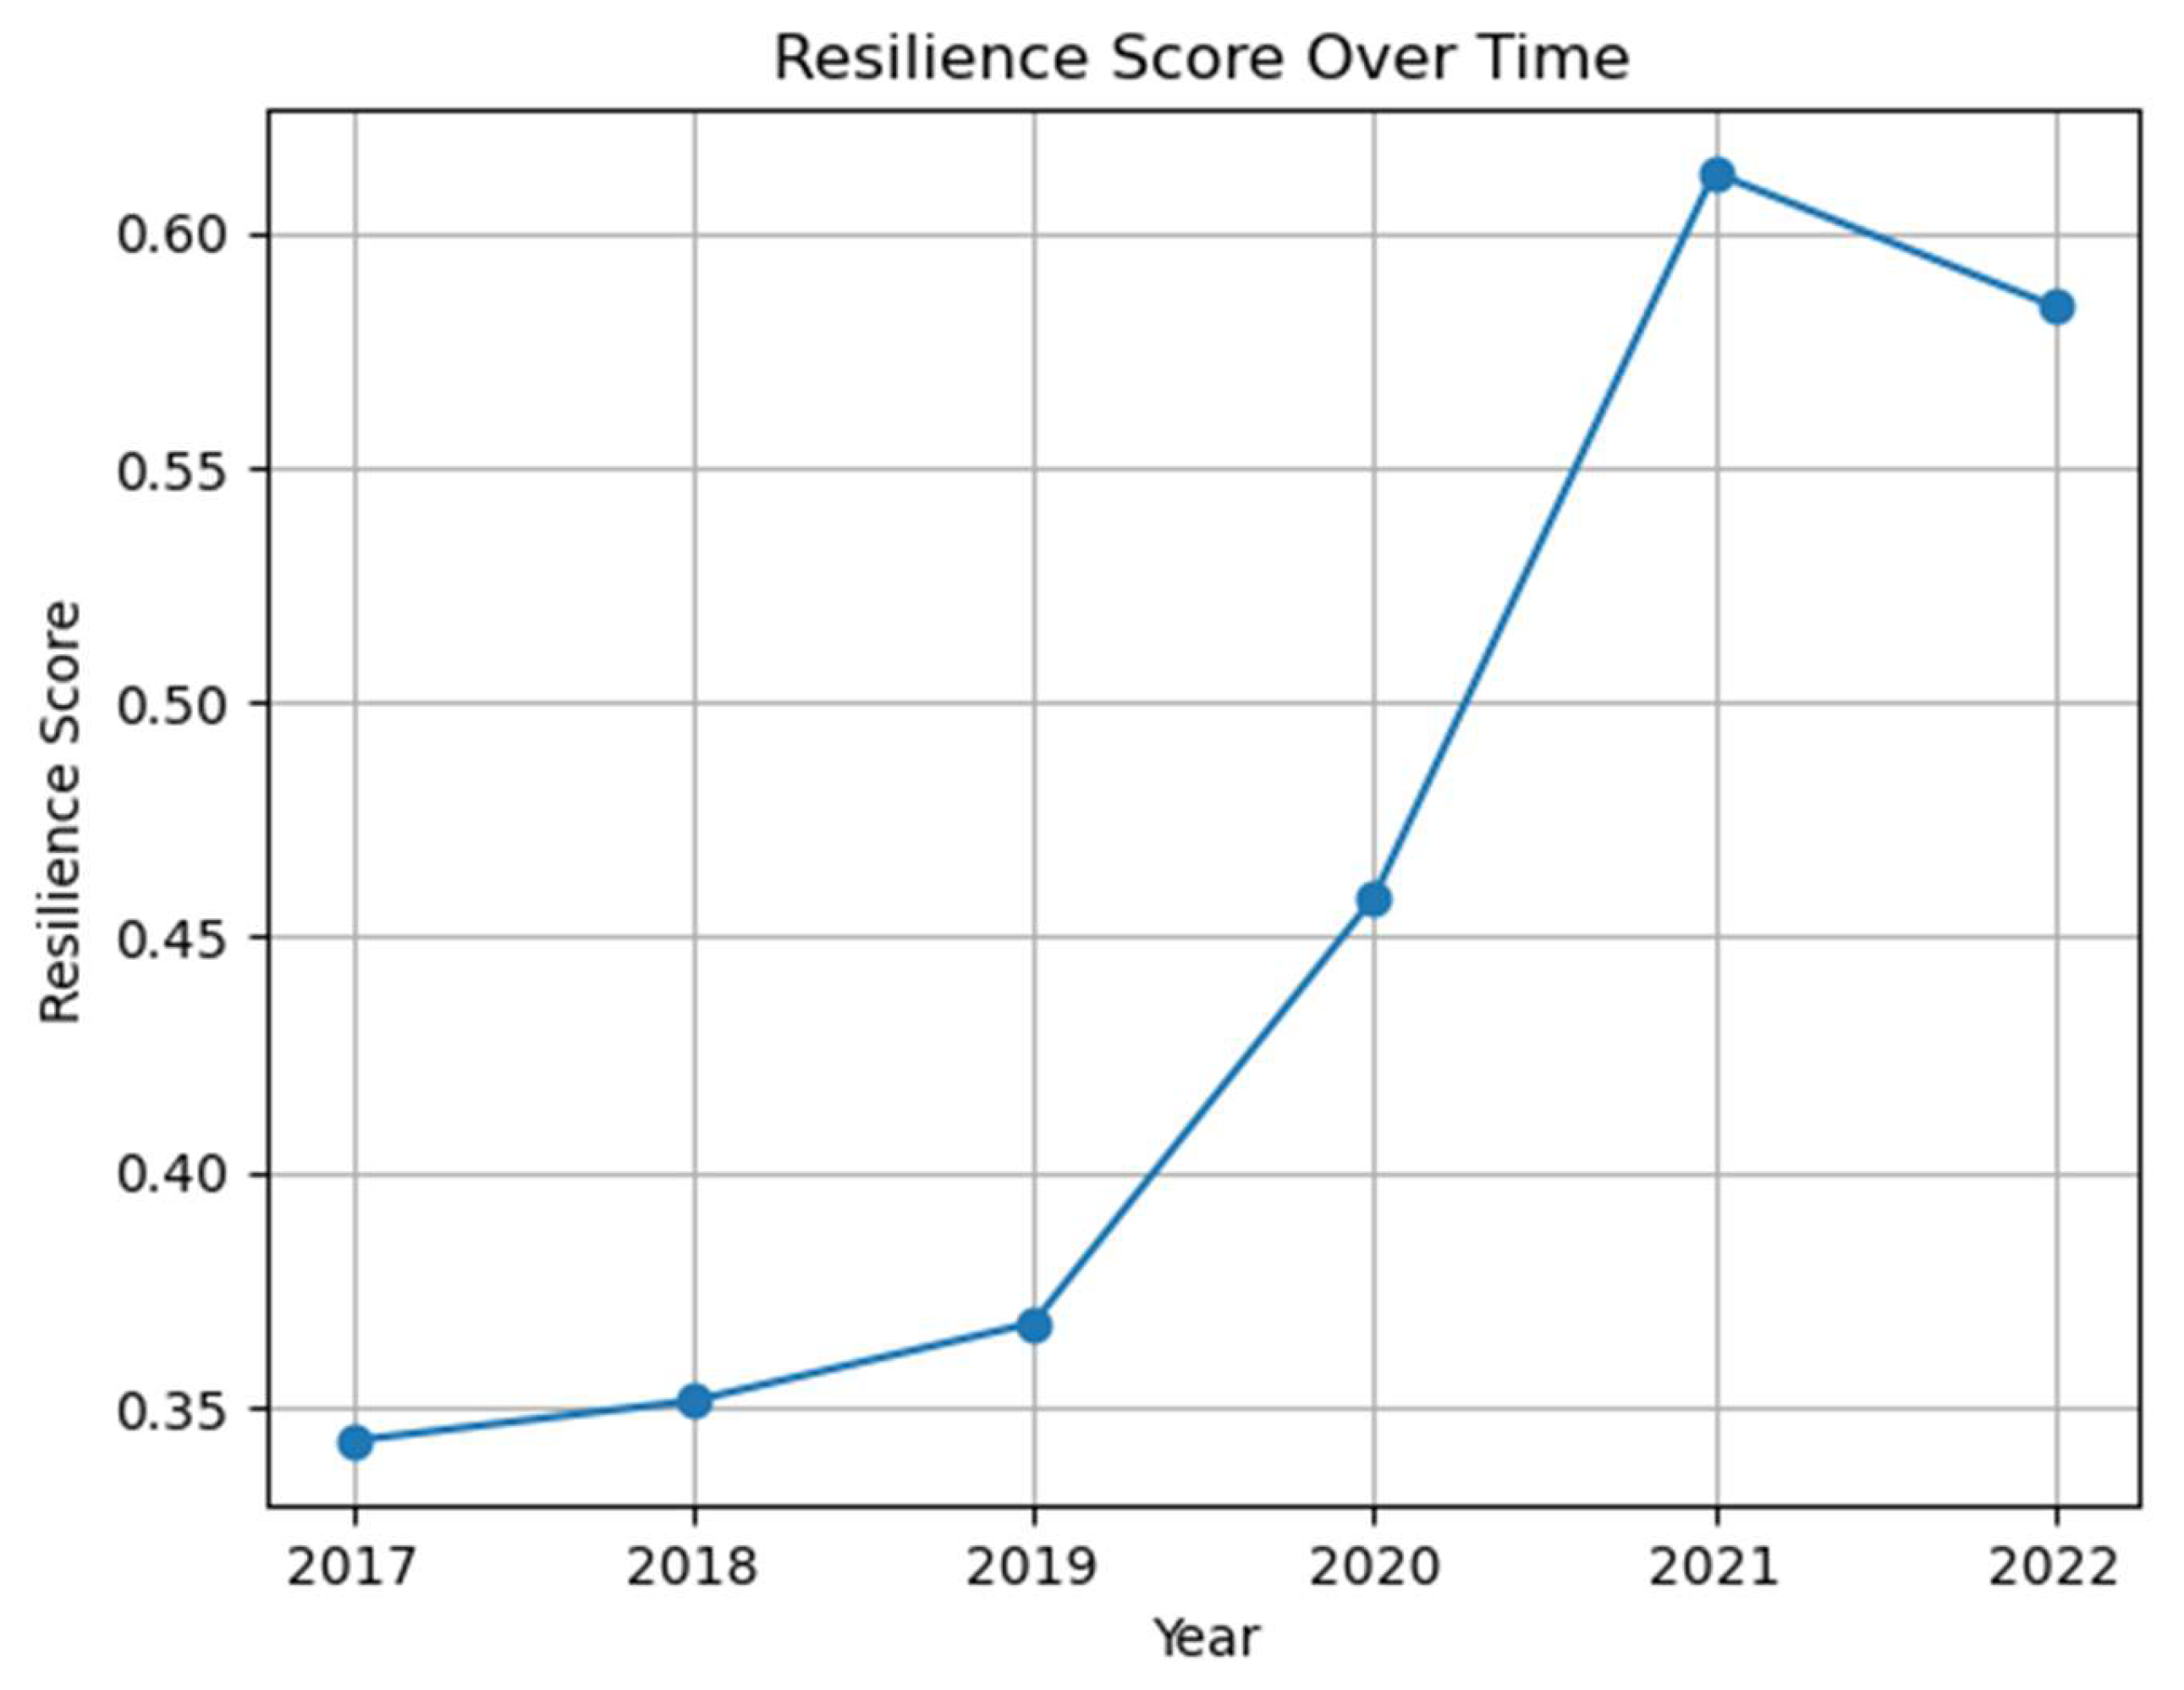
- Calculation of the Resilience Score: After normalization, the resilience score was calculated as the mean of the normalized indicators, reflecting a balanced measure of resilience. If necessary, specific indicators could be weighted to emphasize their relative importance, though an equal weighting approach was applied here for simplicity.
- Integration with Annual Data: The resilience score was computed annually and added to the dataset, allowing for time-series analysis of resilience trends from 2017 to 2022.
- 7.
- Visualization
- Spatial Analysis of Permits: A Permit Density Map was generated to visualize the distribution of permit activities across Baltimore County. This analysis aimed to identify high-density areas with significant construction and renovation projects, which could serve as “hotspots” for potential IoT and AI technology prioritization. By visually clustering permit data, the density map provides a straightforward way to target areas with high infrastructure demand, guiding efficient resource allocation for smart infrastructure projects.
- Time-Series Analysis of Resilience Scores: A time-series plot of resilience scores from 2017 to 2022 was created, reflecting changes over time and identifying years with significant improvements or setbacks. This visualization highlighted the impacts of socio-economic trends on Baltimore’s resilience, guiding decision-making for scalable smart infrastructure deployment.
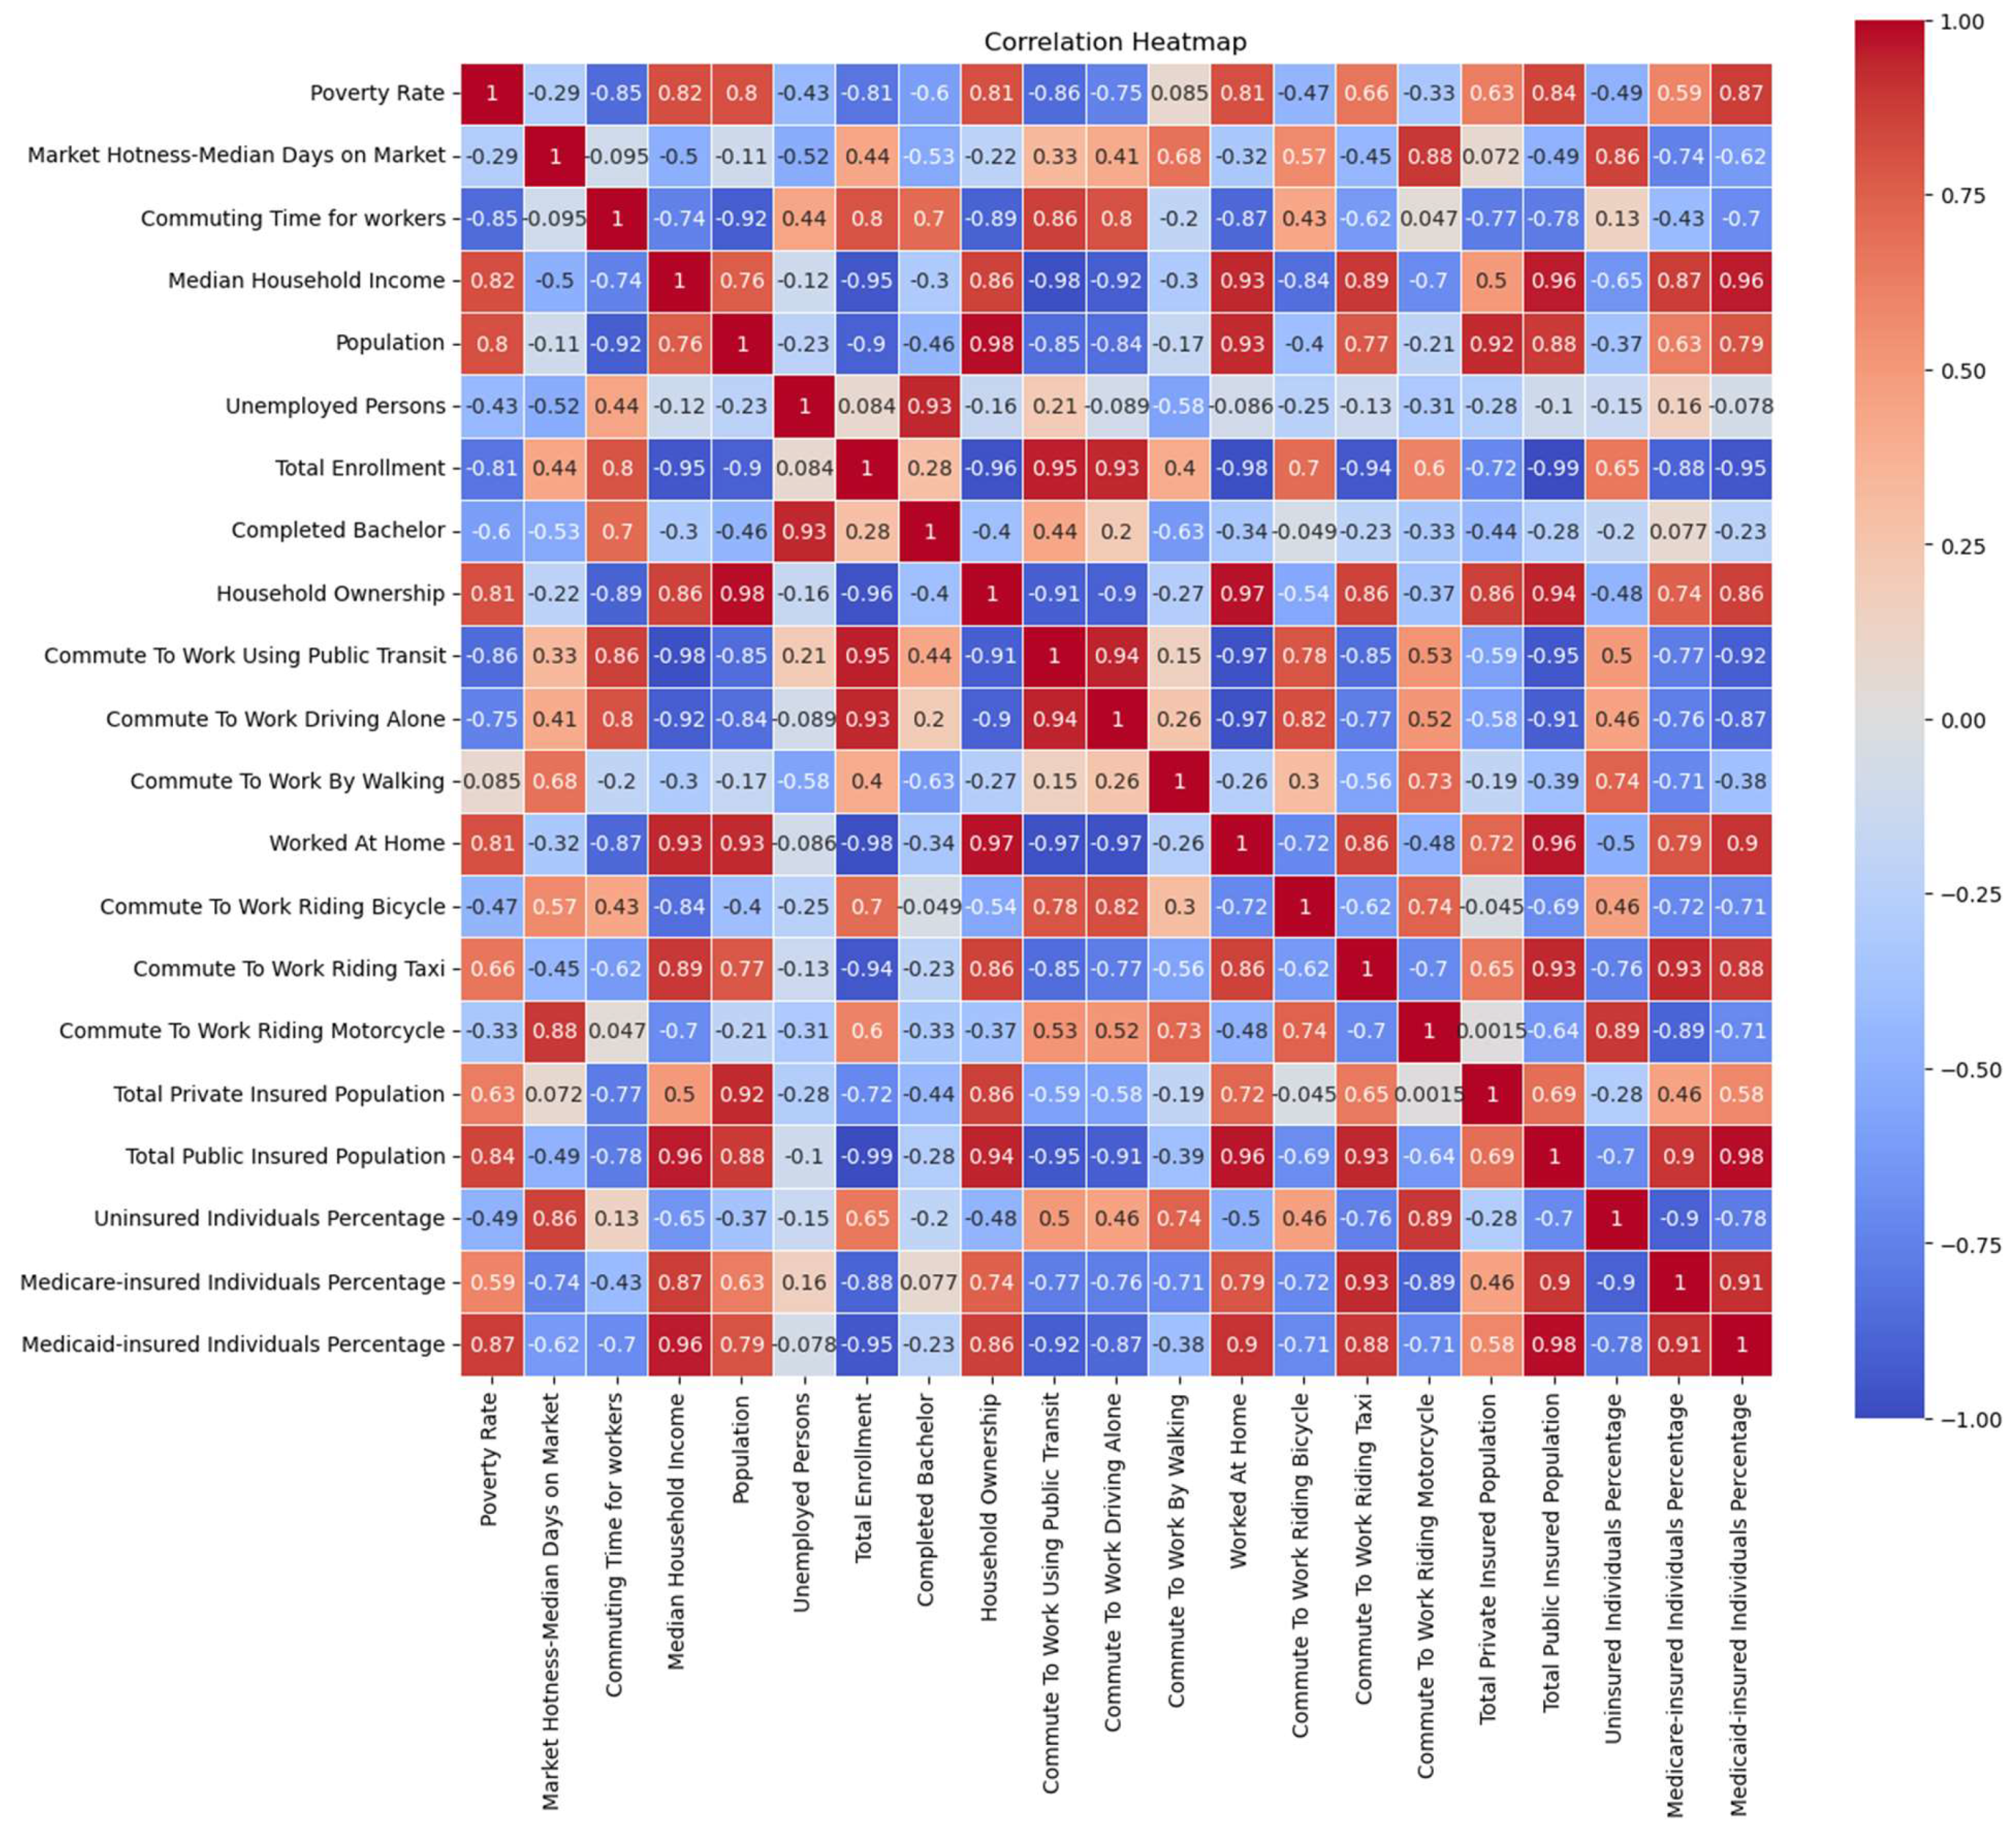
- Heatmaps of Socio-Economic Indicators: To explore relationships among resilience factors, we generated a correlation heatmap of key socio-economic indicators, including poverty rate, median household income, unemployment, education, and insurance coverage. Using the Seaborn library22, the heatmap was created to display these correlations, with values annotated and color-coded to highlight the strength and direction of relationships between variables. This visualization helped us identify complex interdependencies among indicators, offering insights into how these factors collectively influence resilience within Baltimore County. The heatmap was configured to use a diverging color scale from -1 to 1, allowing for a clear distinction between positive and negative correlations. This approach enabled us to interpret socio-economic trends effectively and provided a visual foundation for understanding the dynamics among resilience indicators.
- Time-Series Analysis of Socio-Economic Indicators: A comprehensive time-series analysis was conducted for the period spanning from 2017 to 2022 to evaluate the dynamic changes in socio-economic indicators. This analysis aimed to identify and visualize patterns, trends, and fluctuations over time, shedding light on the years that exhibited notable improvements or declines in key indicators. Such insights are invaluable for understanding the broader socio-economic trajectory of Baltimore County and for pinpointing critical periods that may require further investigation or intervention.
Results and Discussion
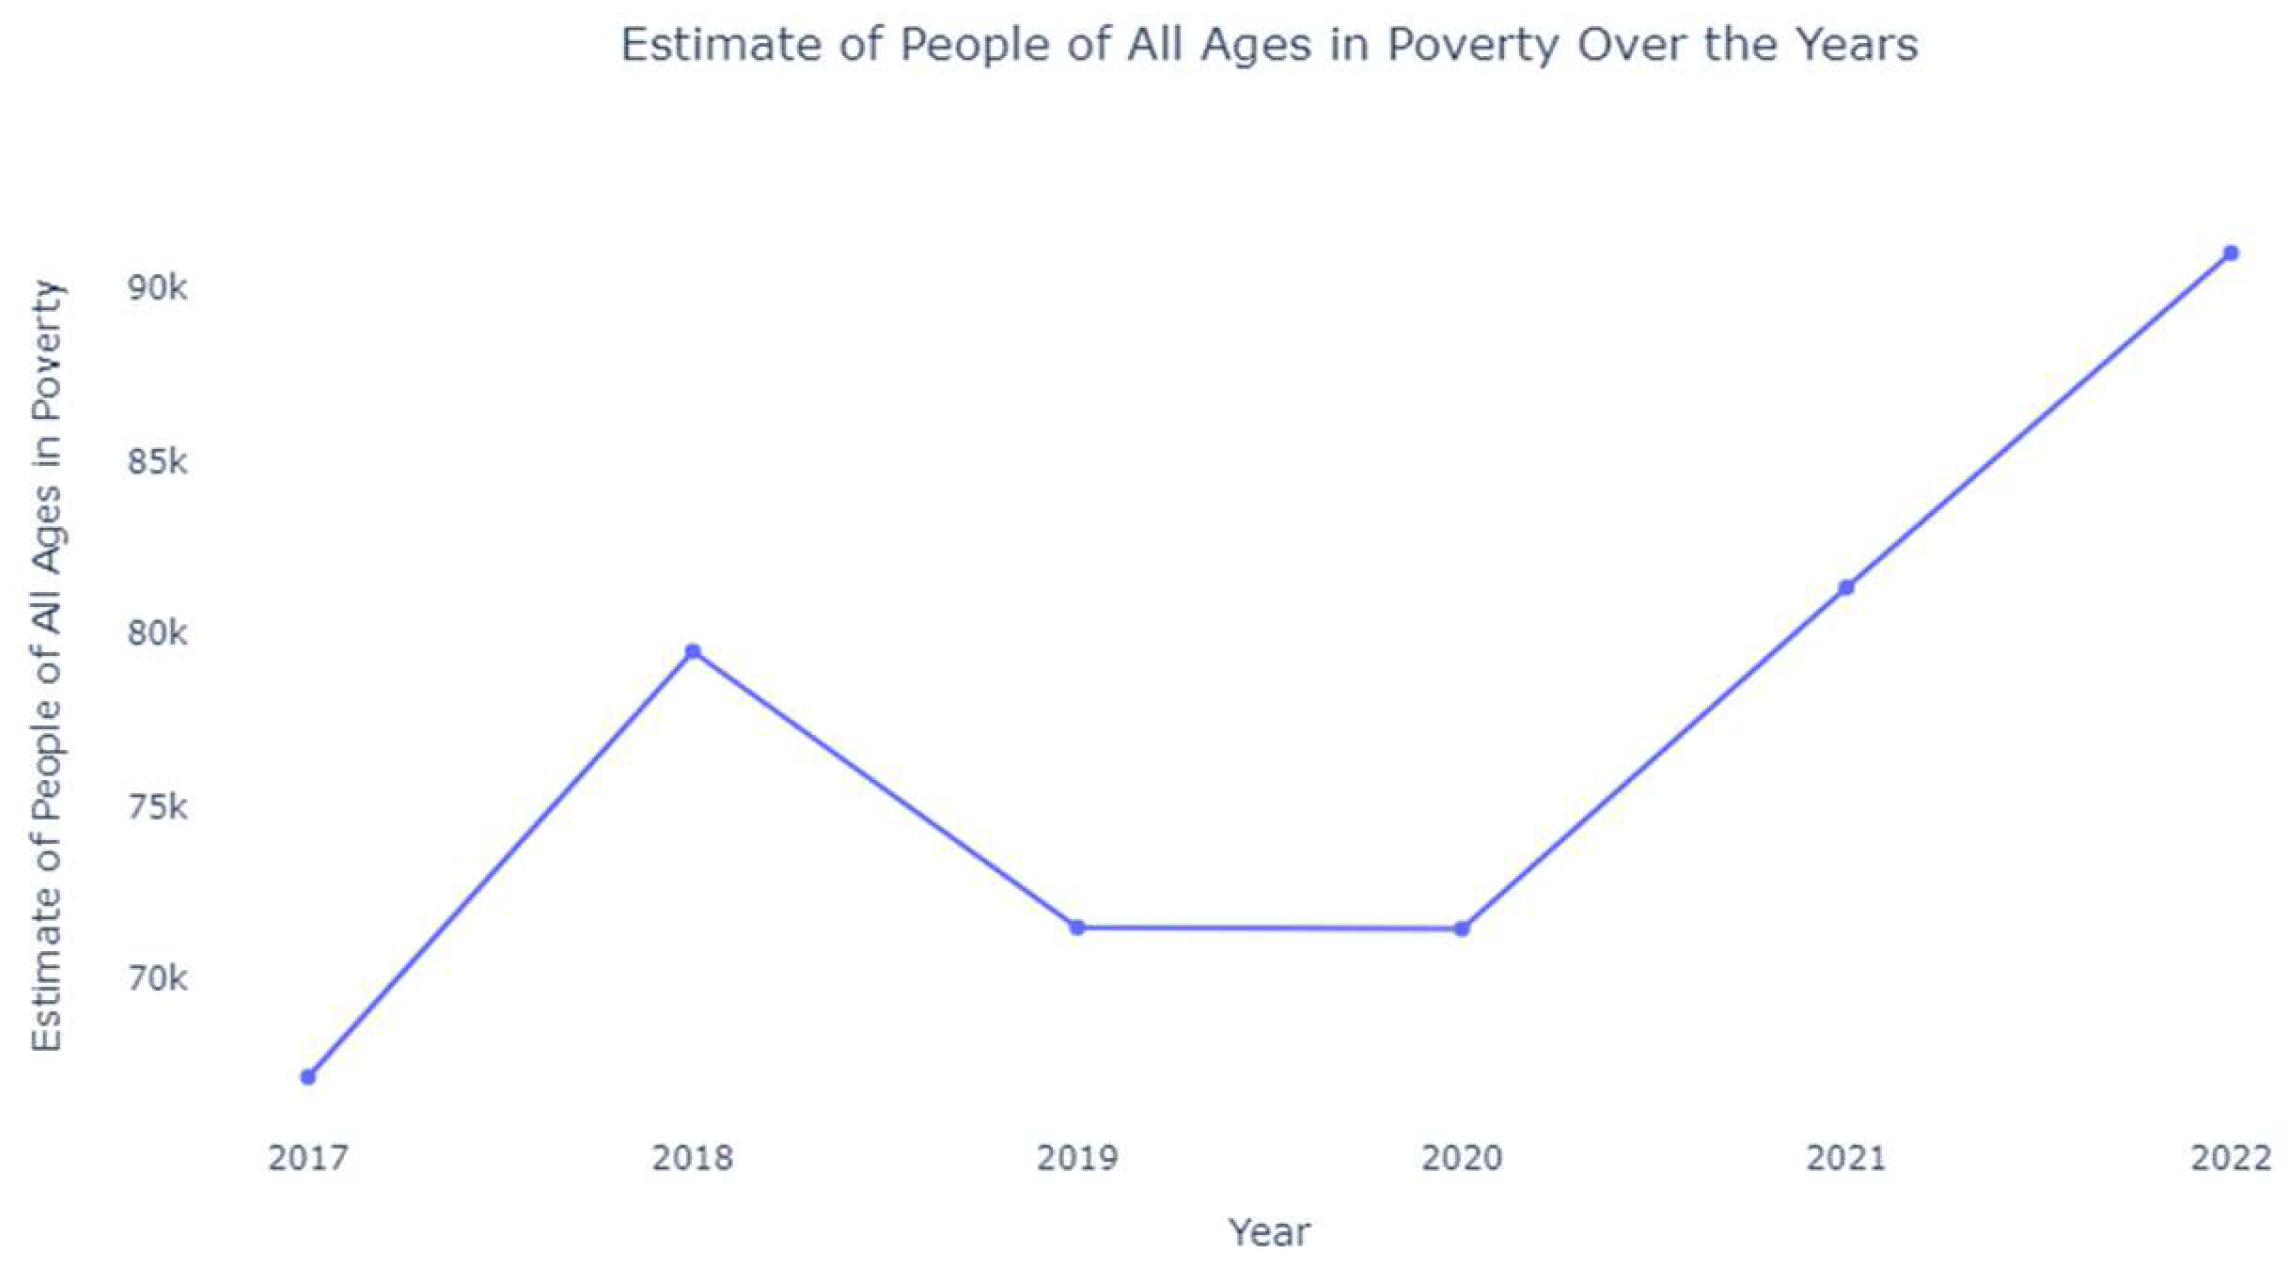
Poverty Rate
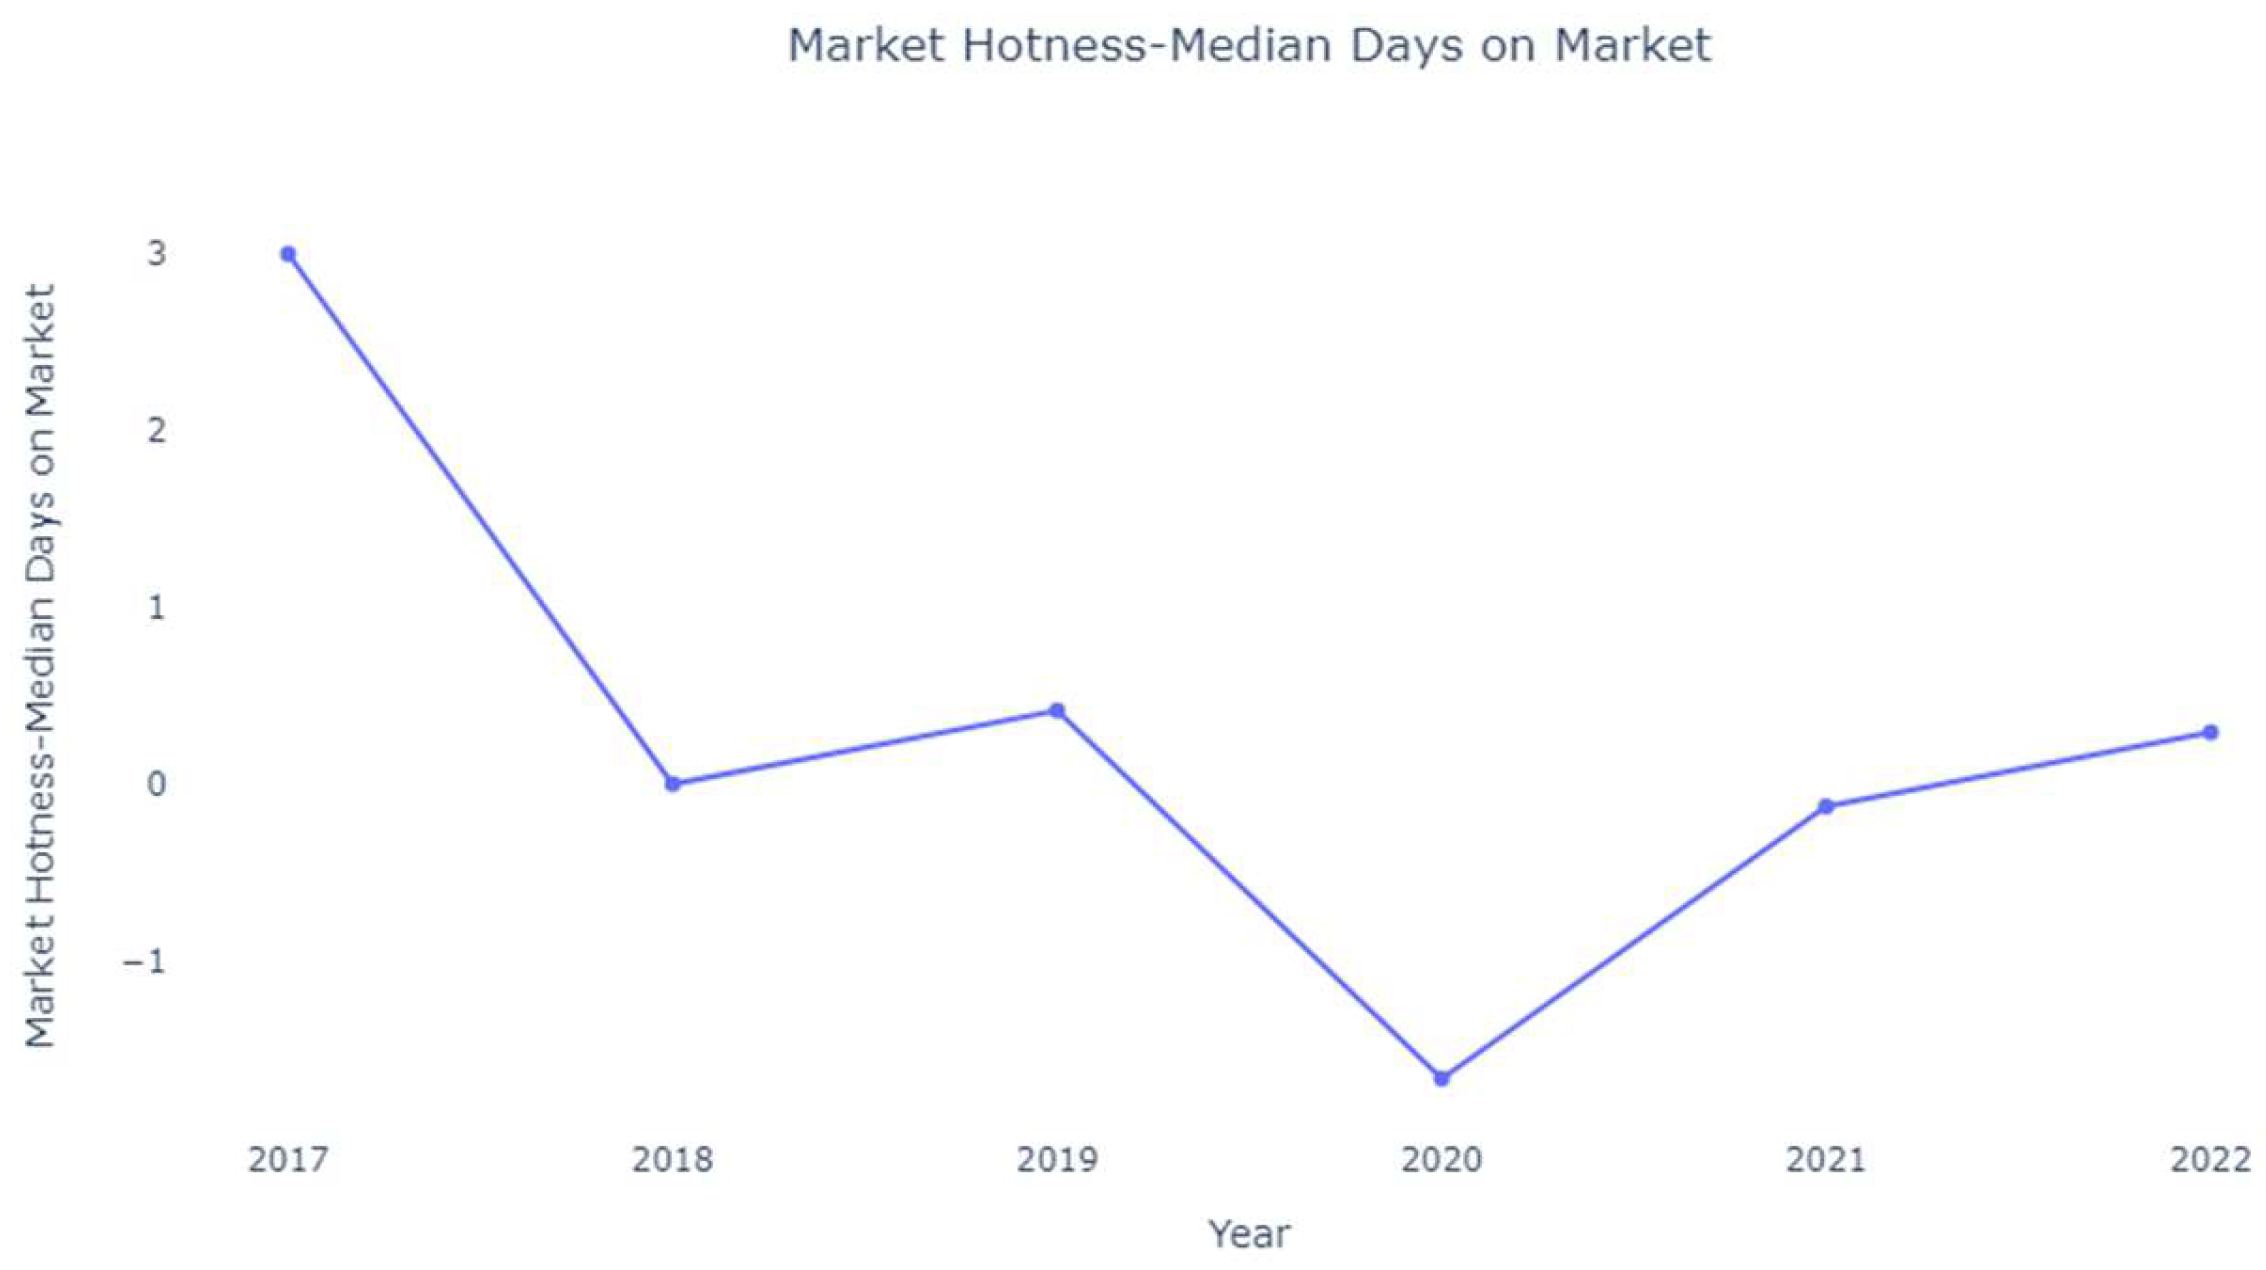
Market Hotness - Median Days on Market
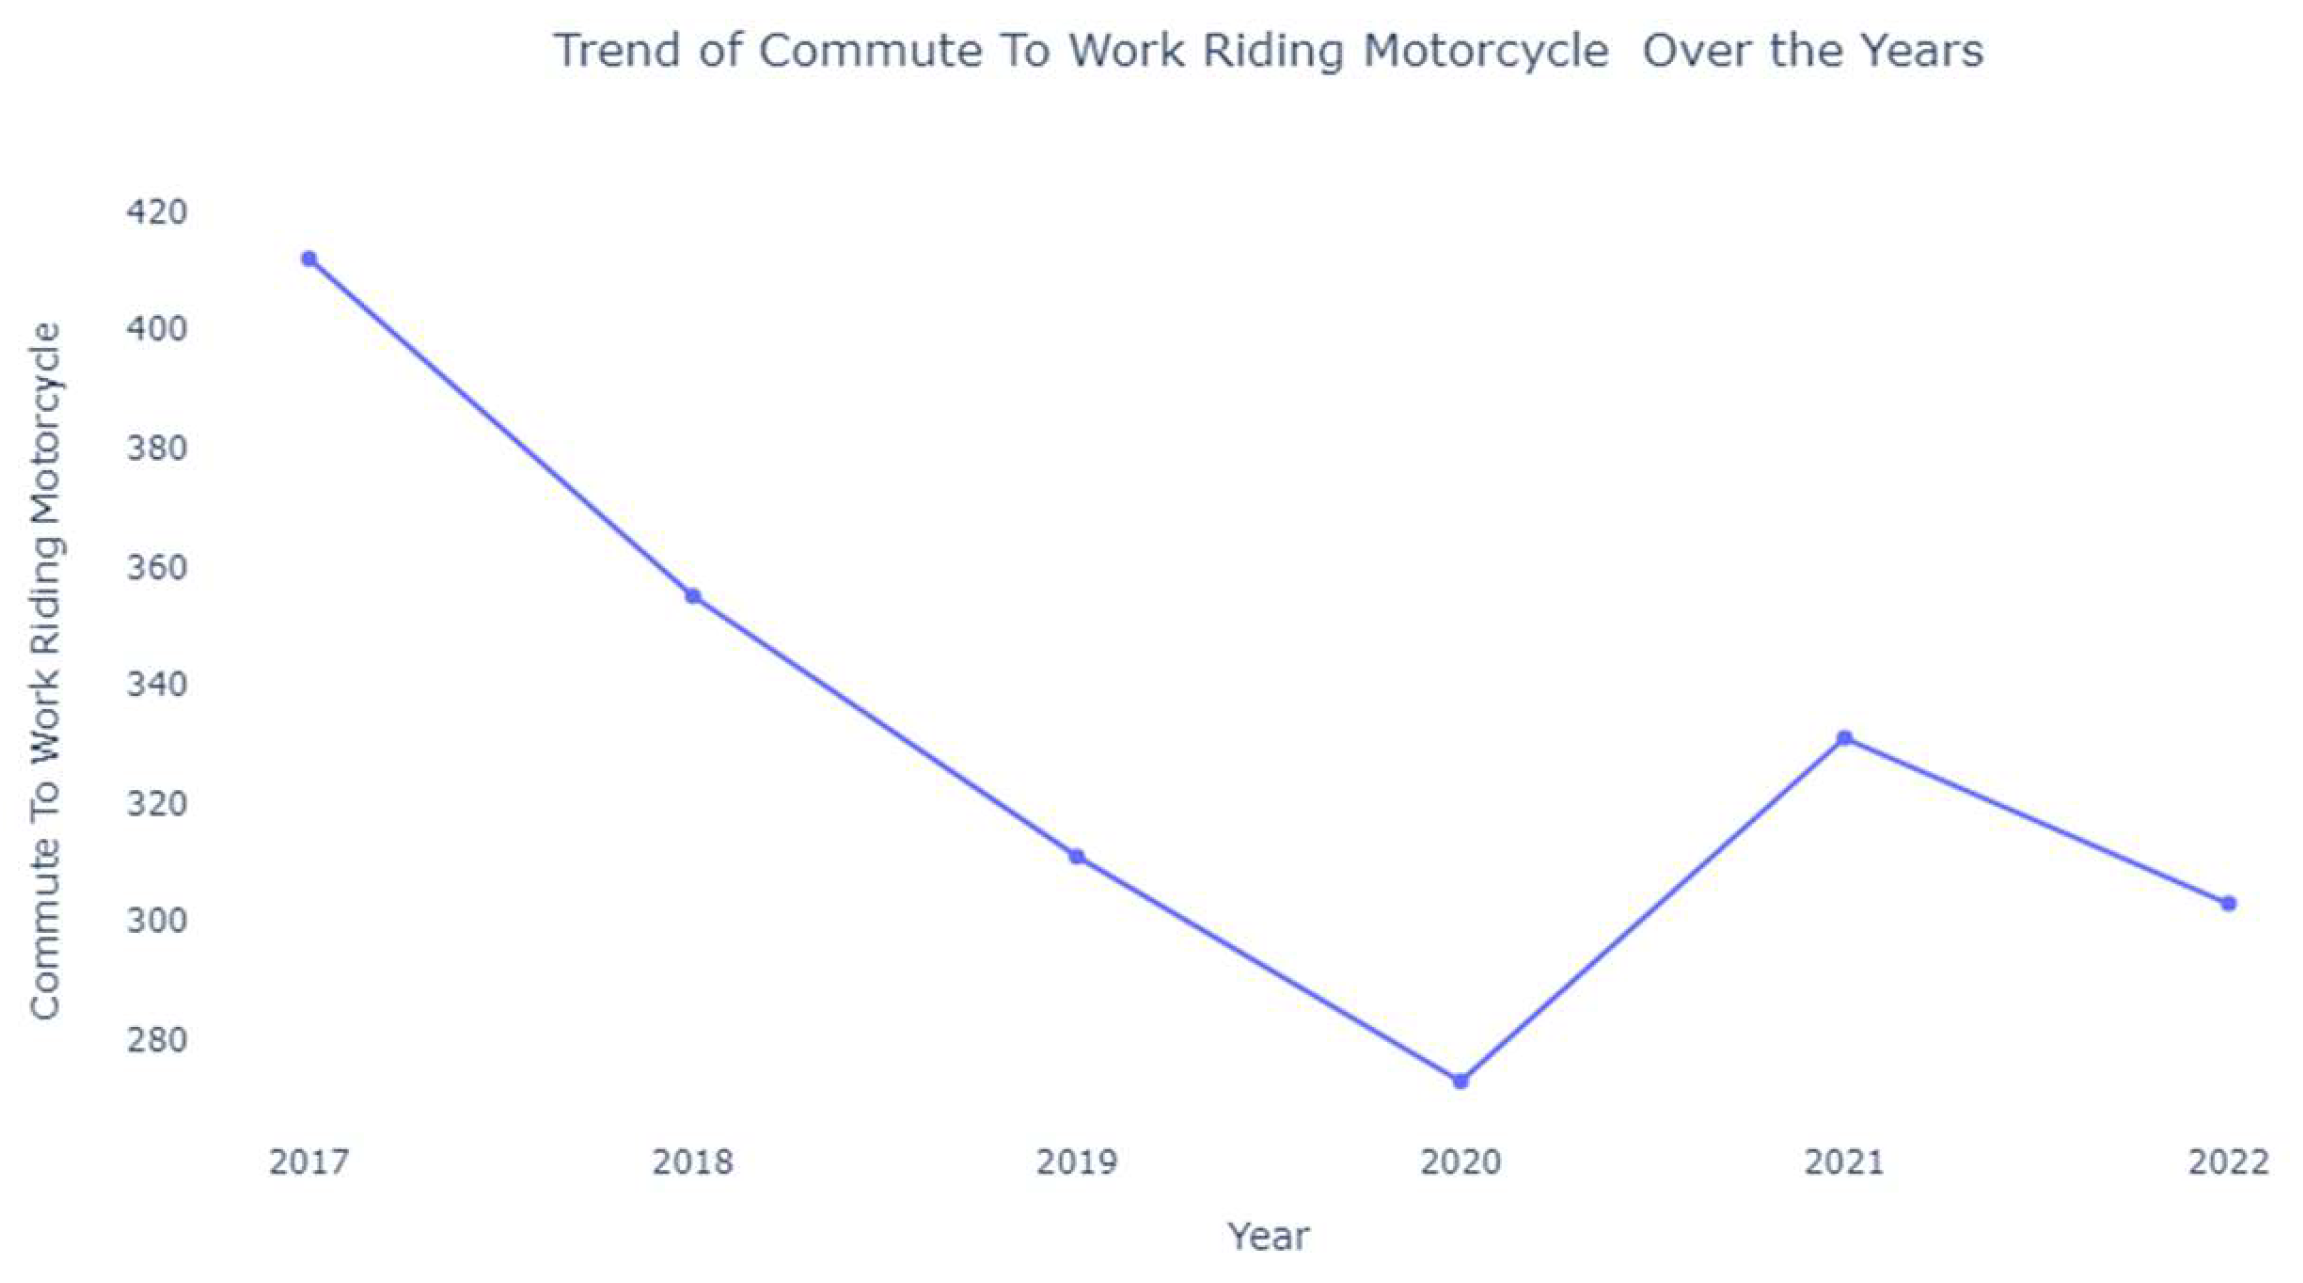
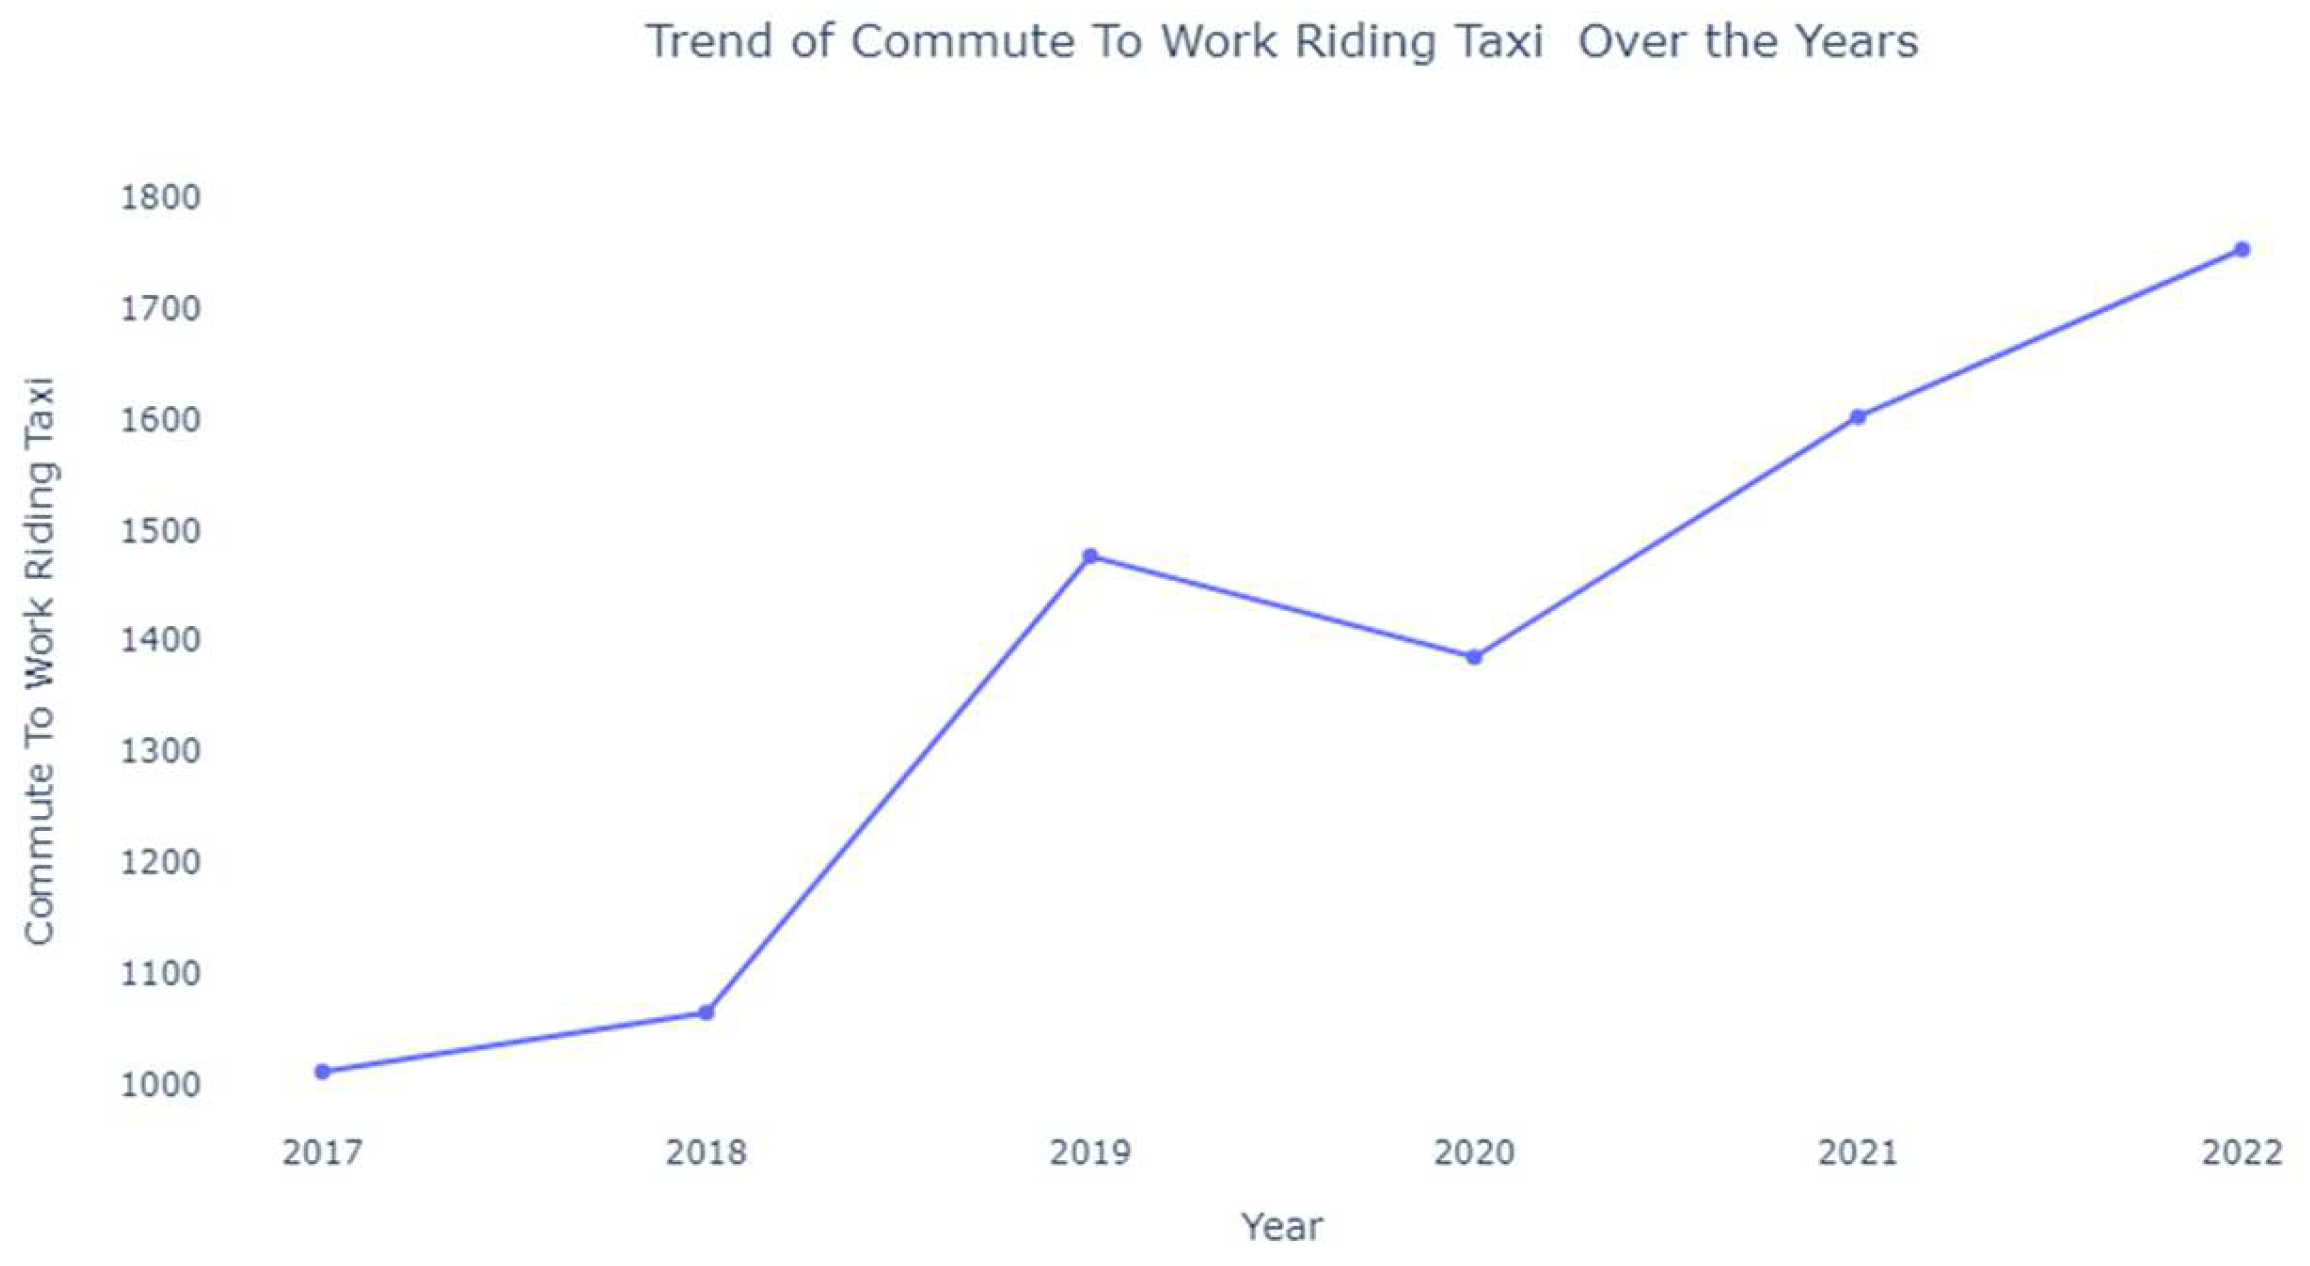
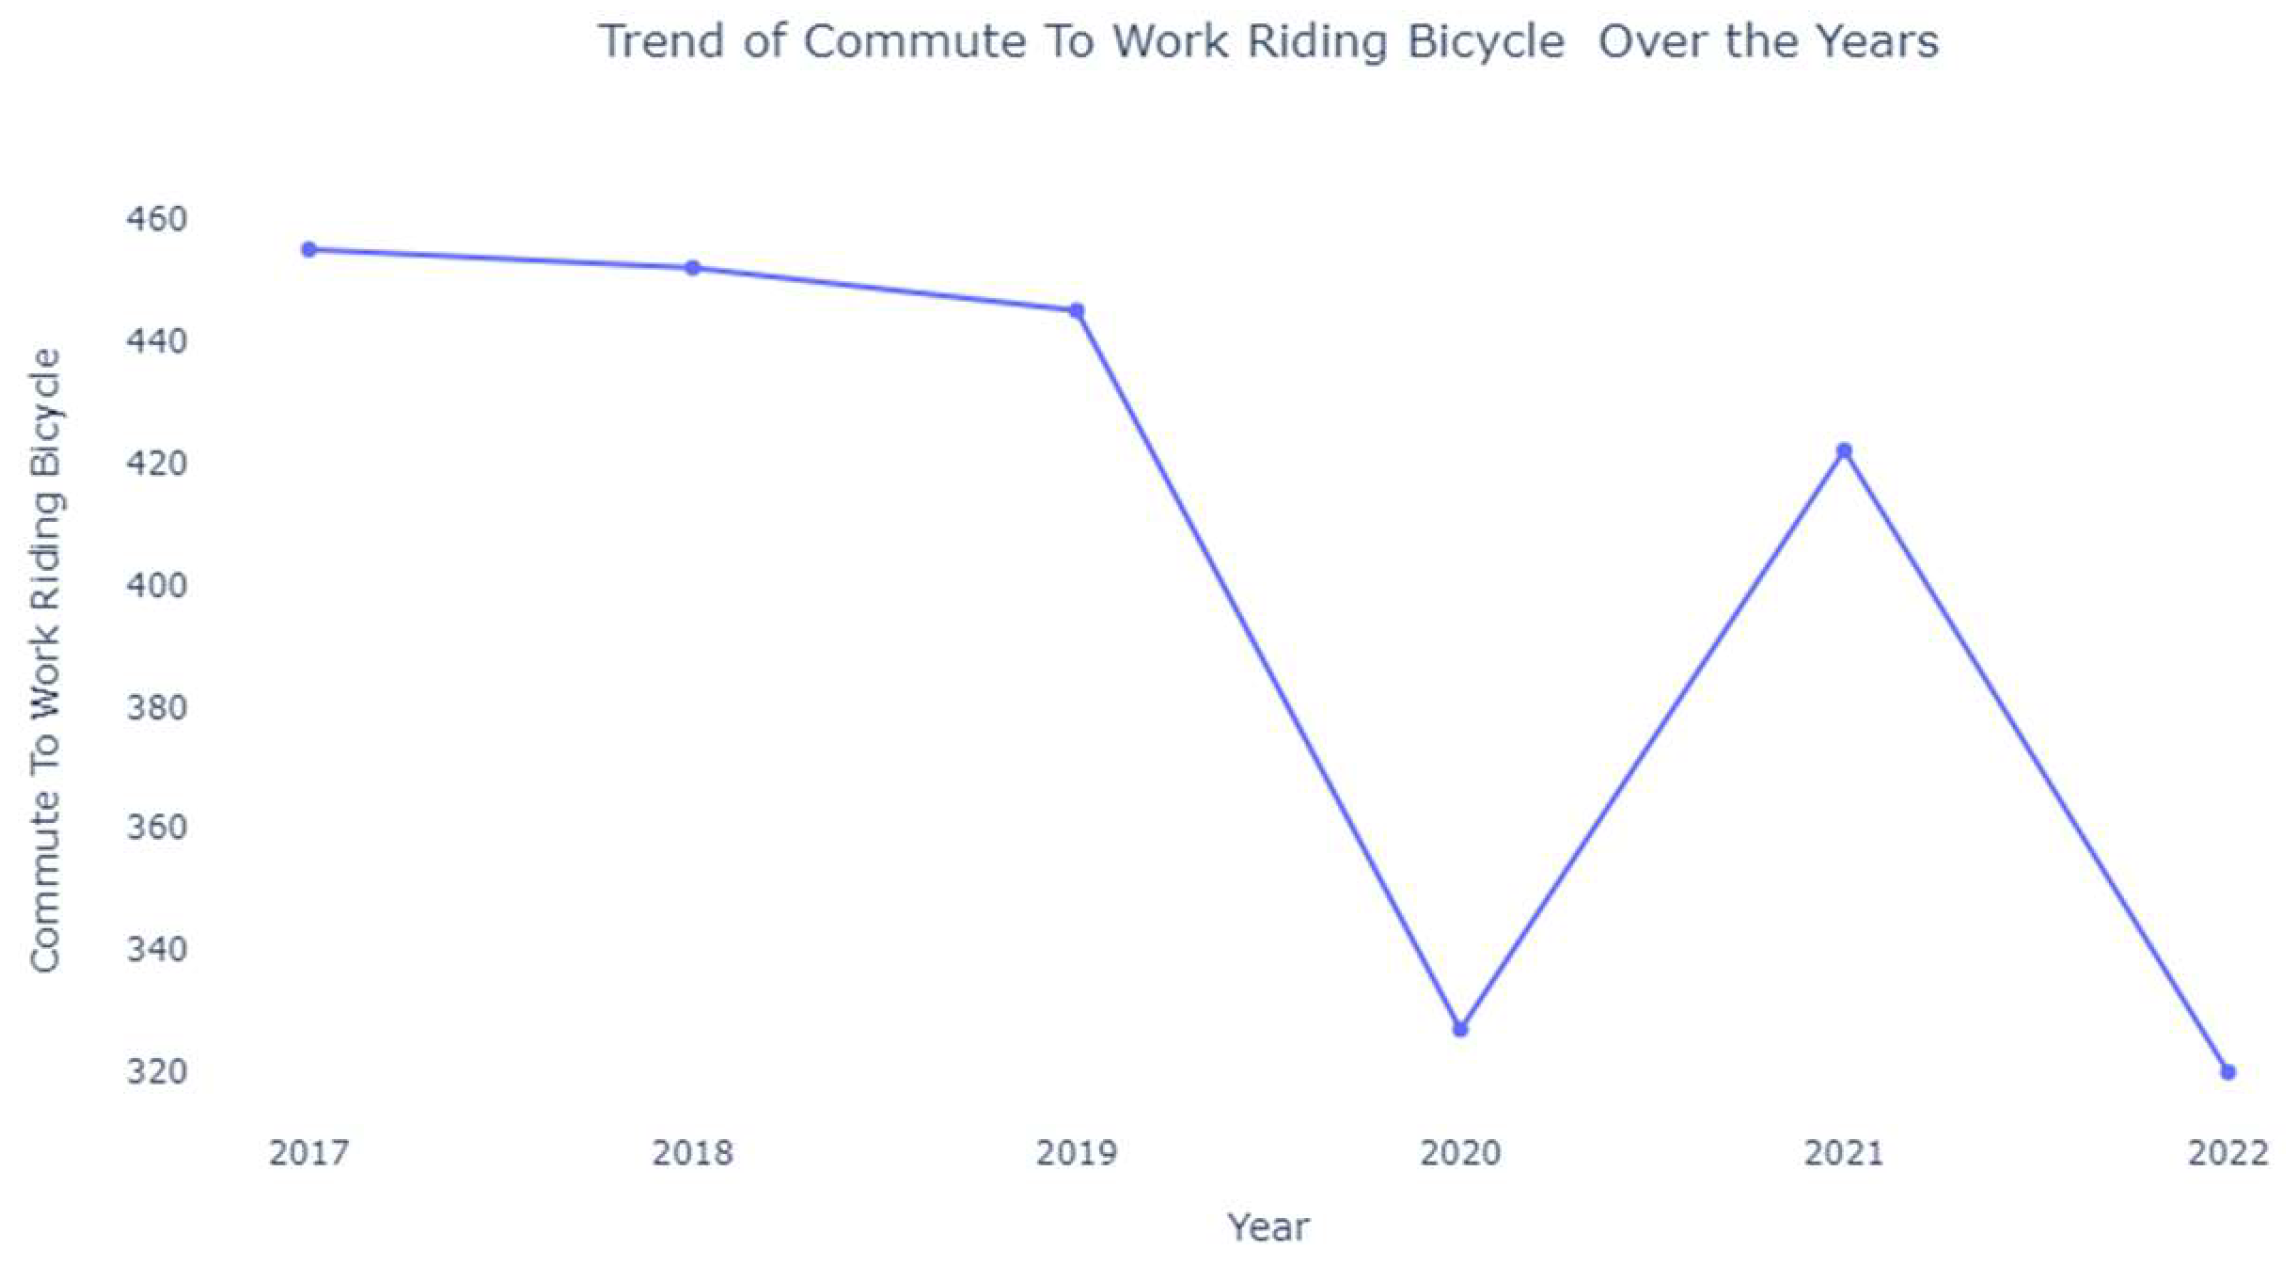
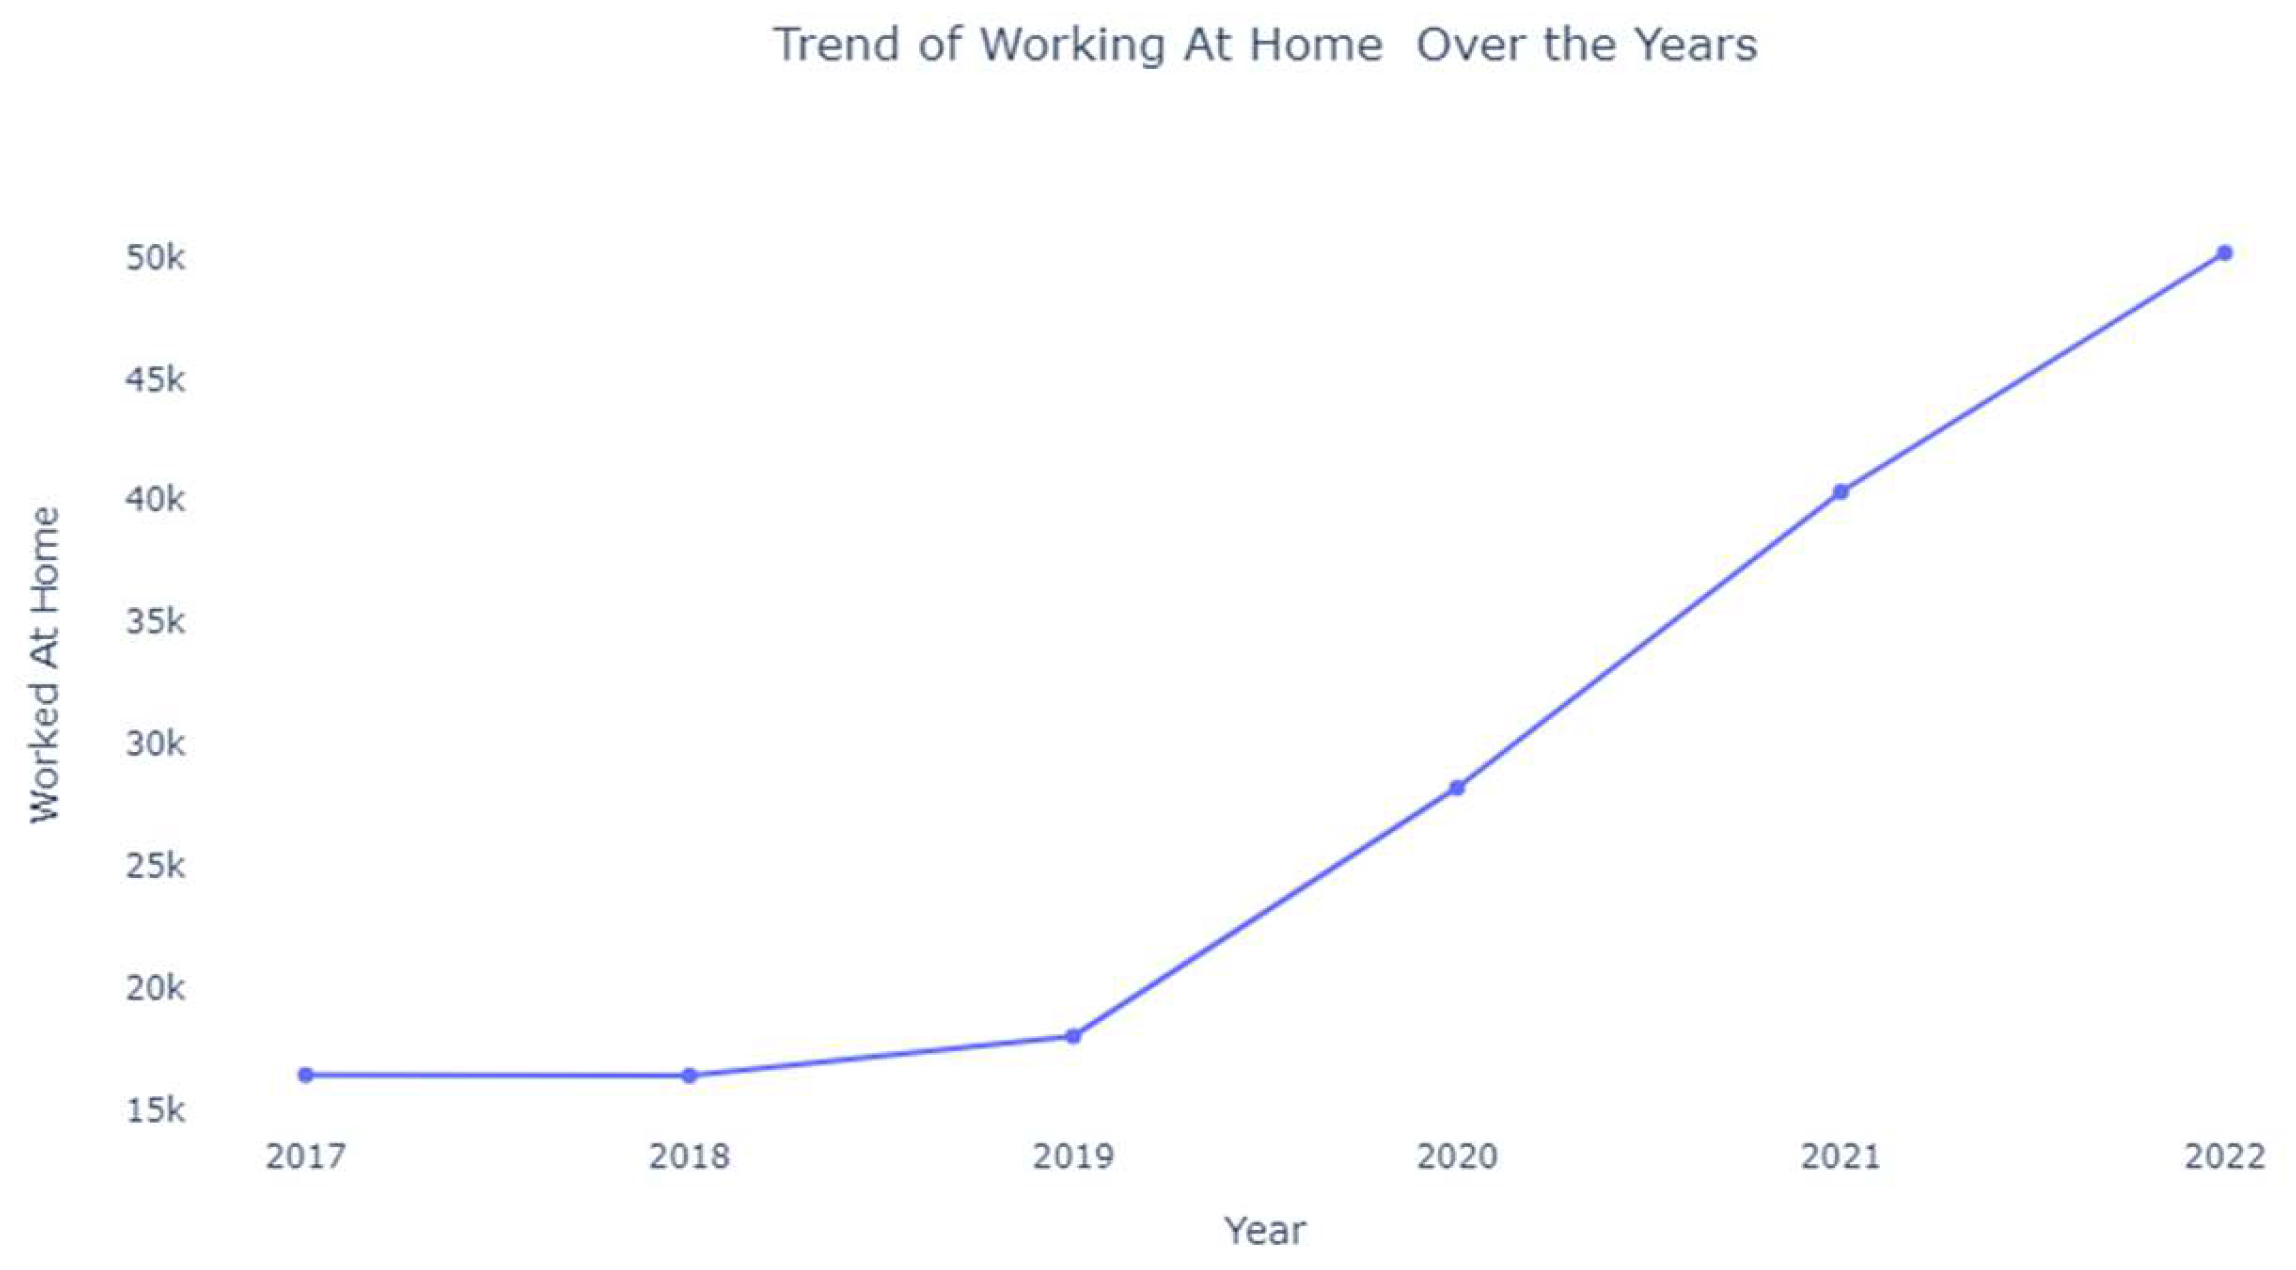
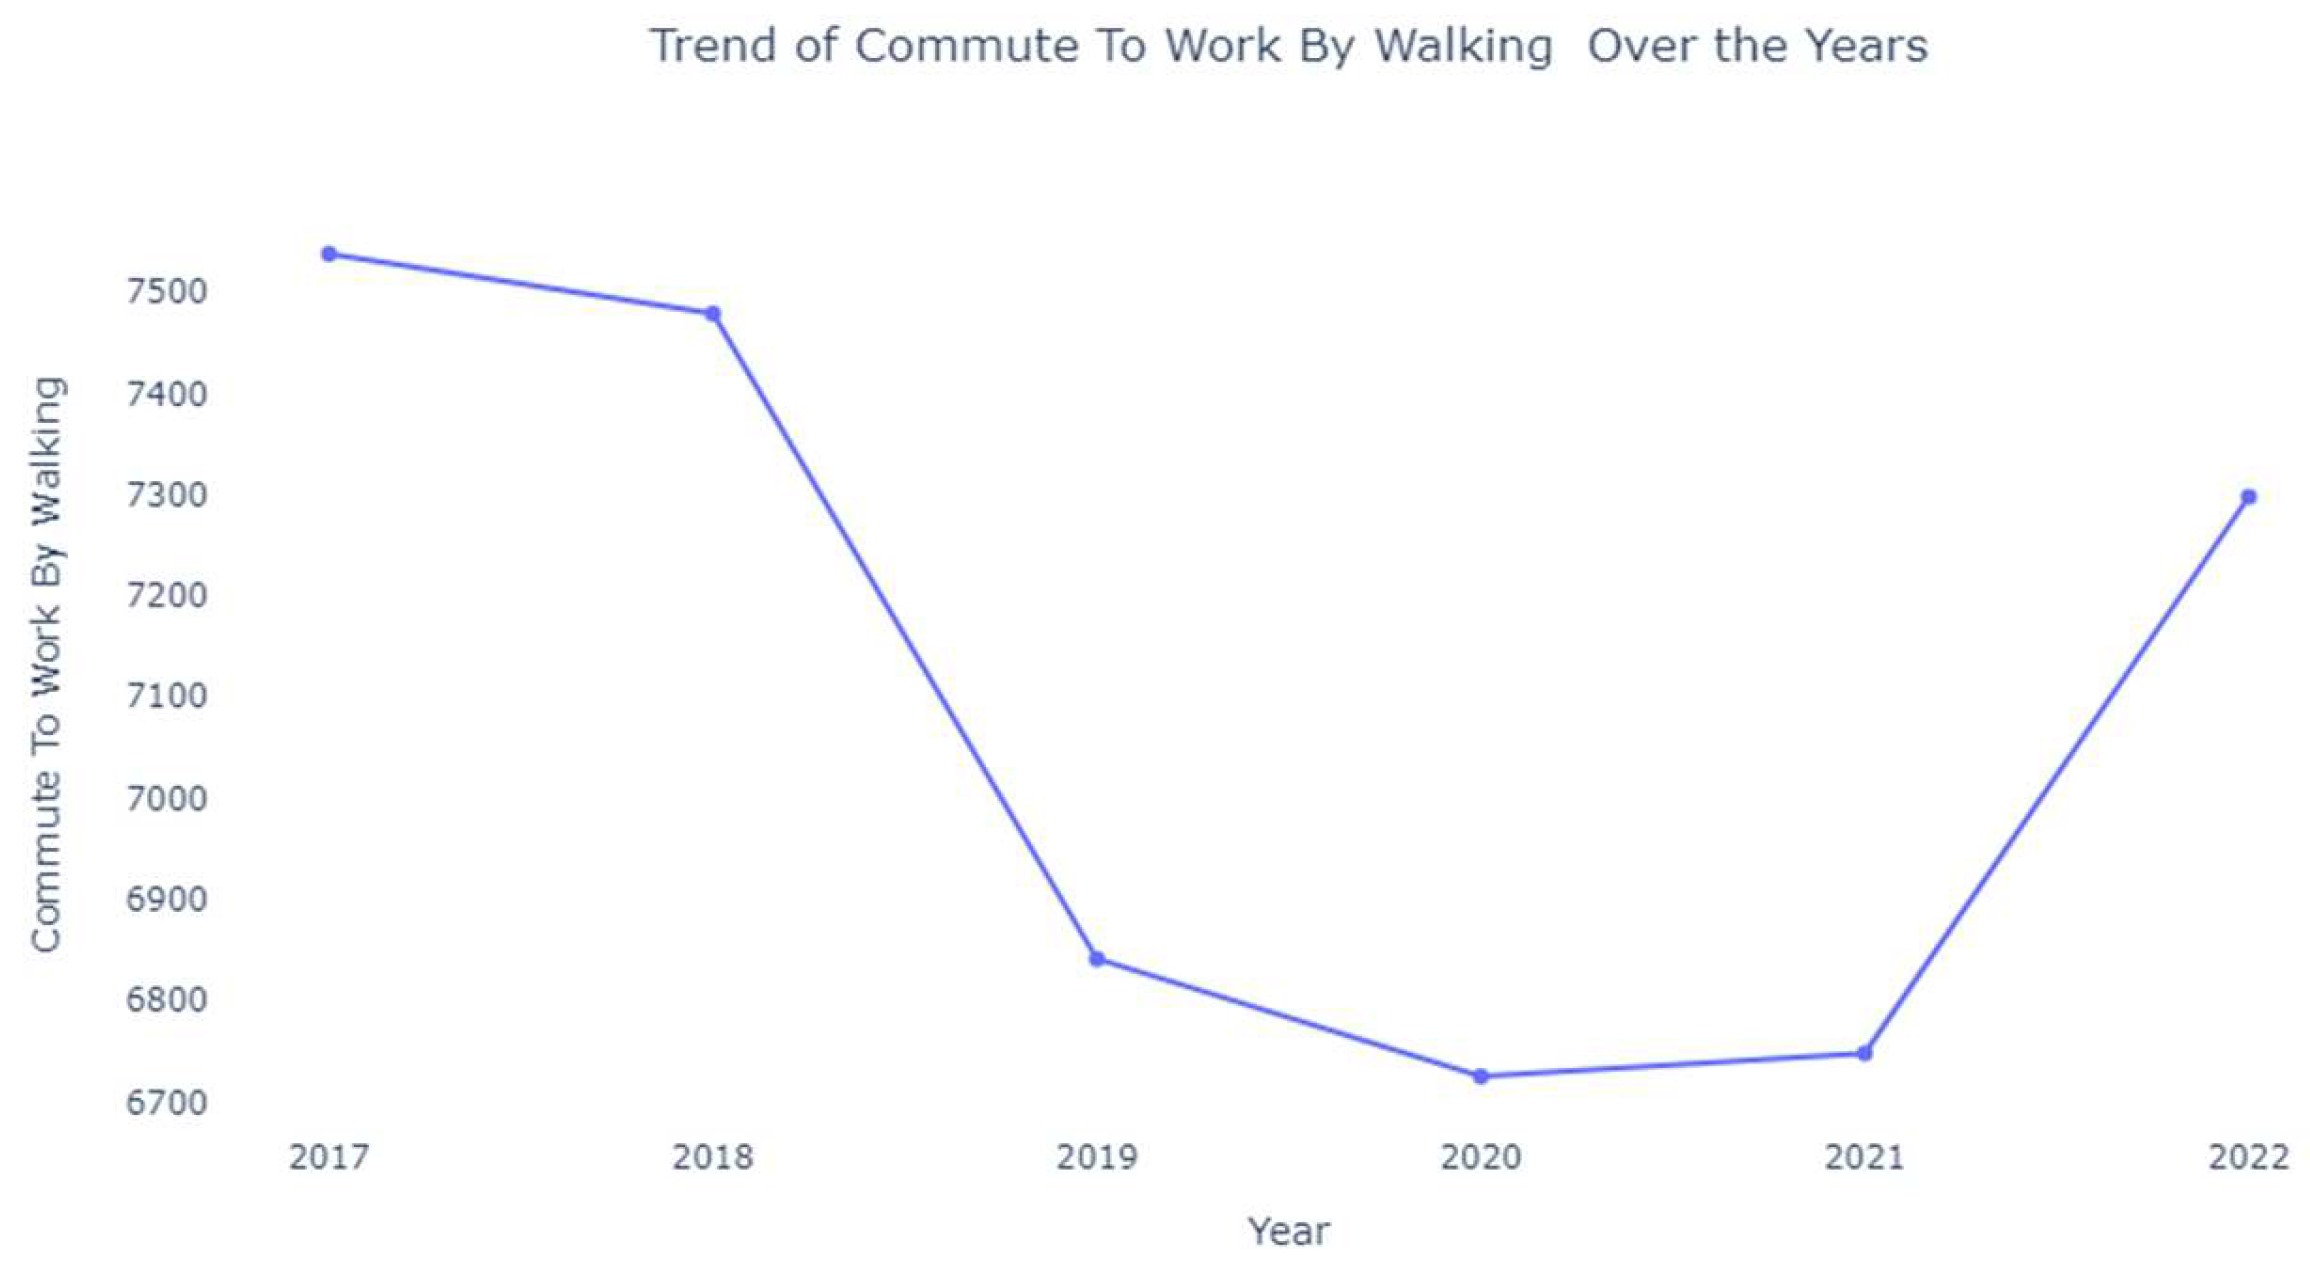
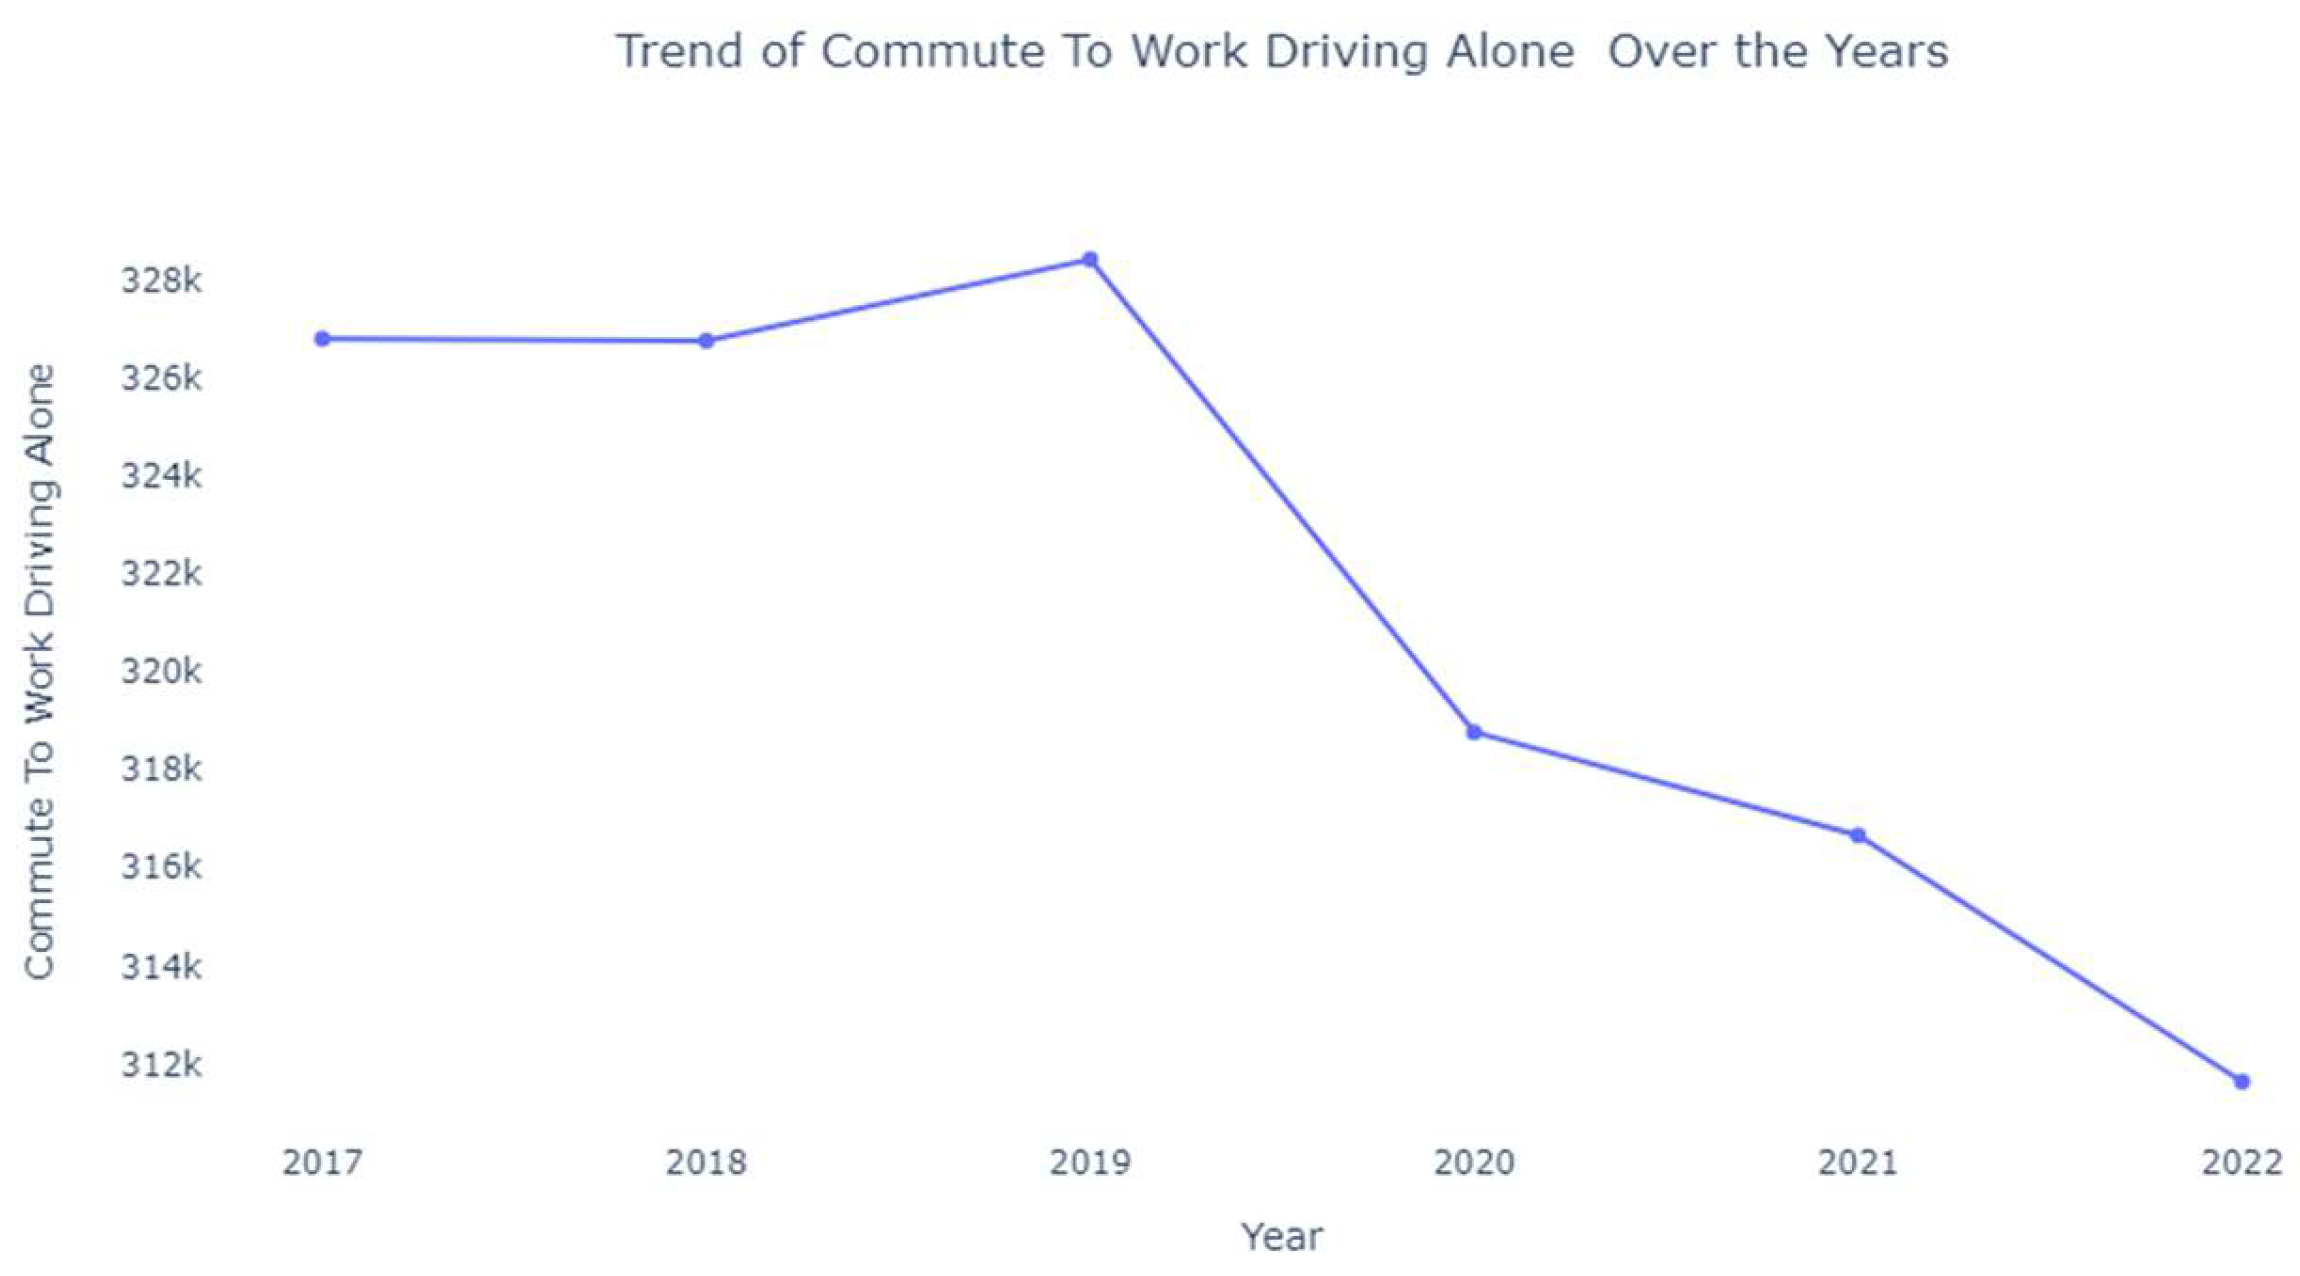
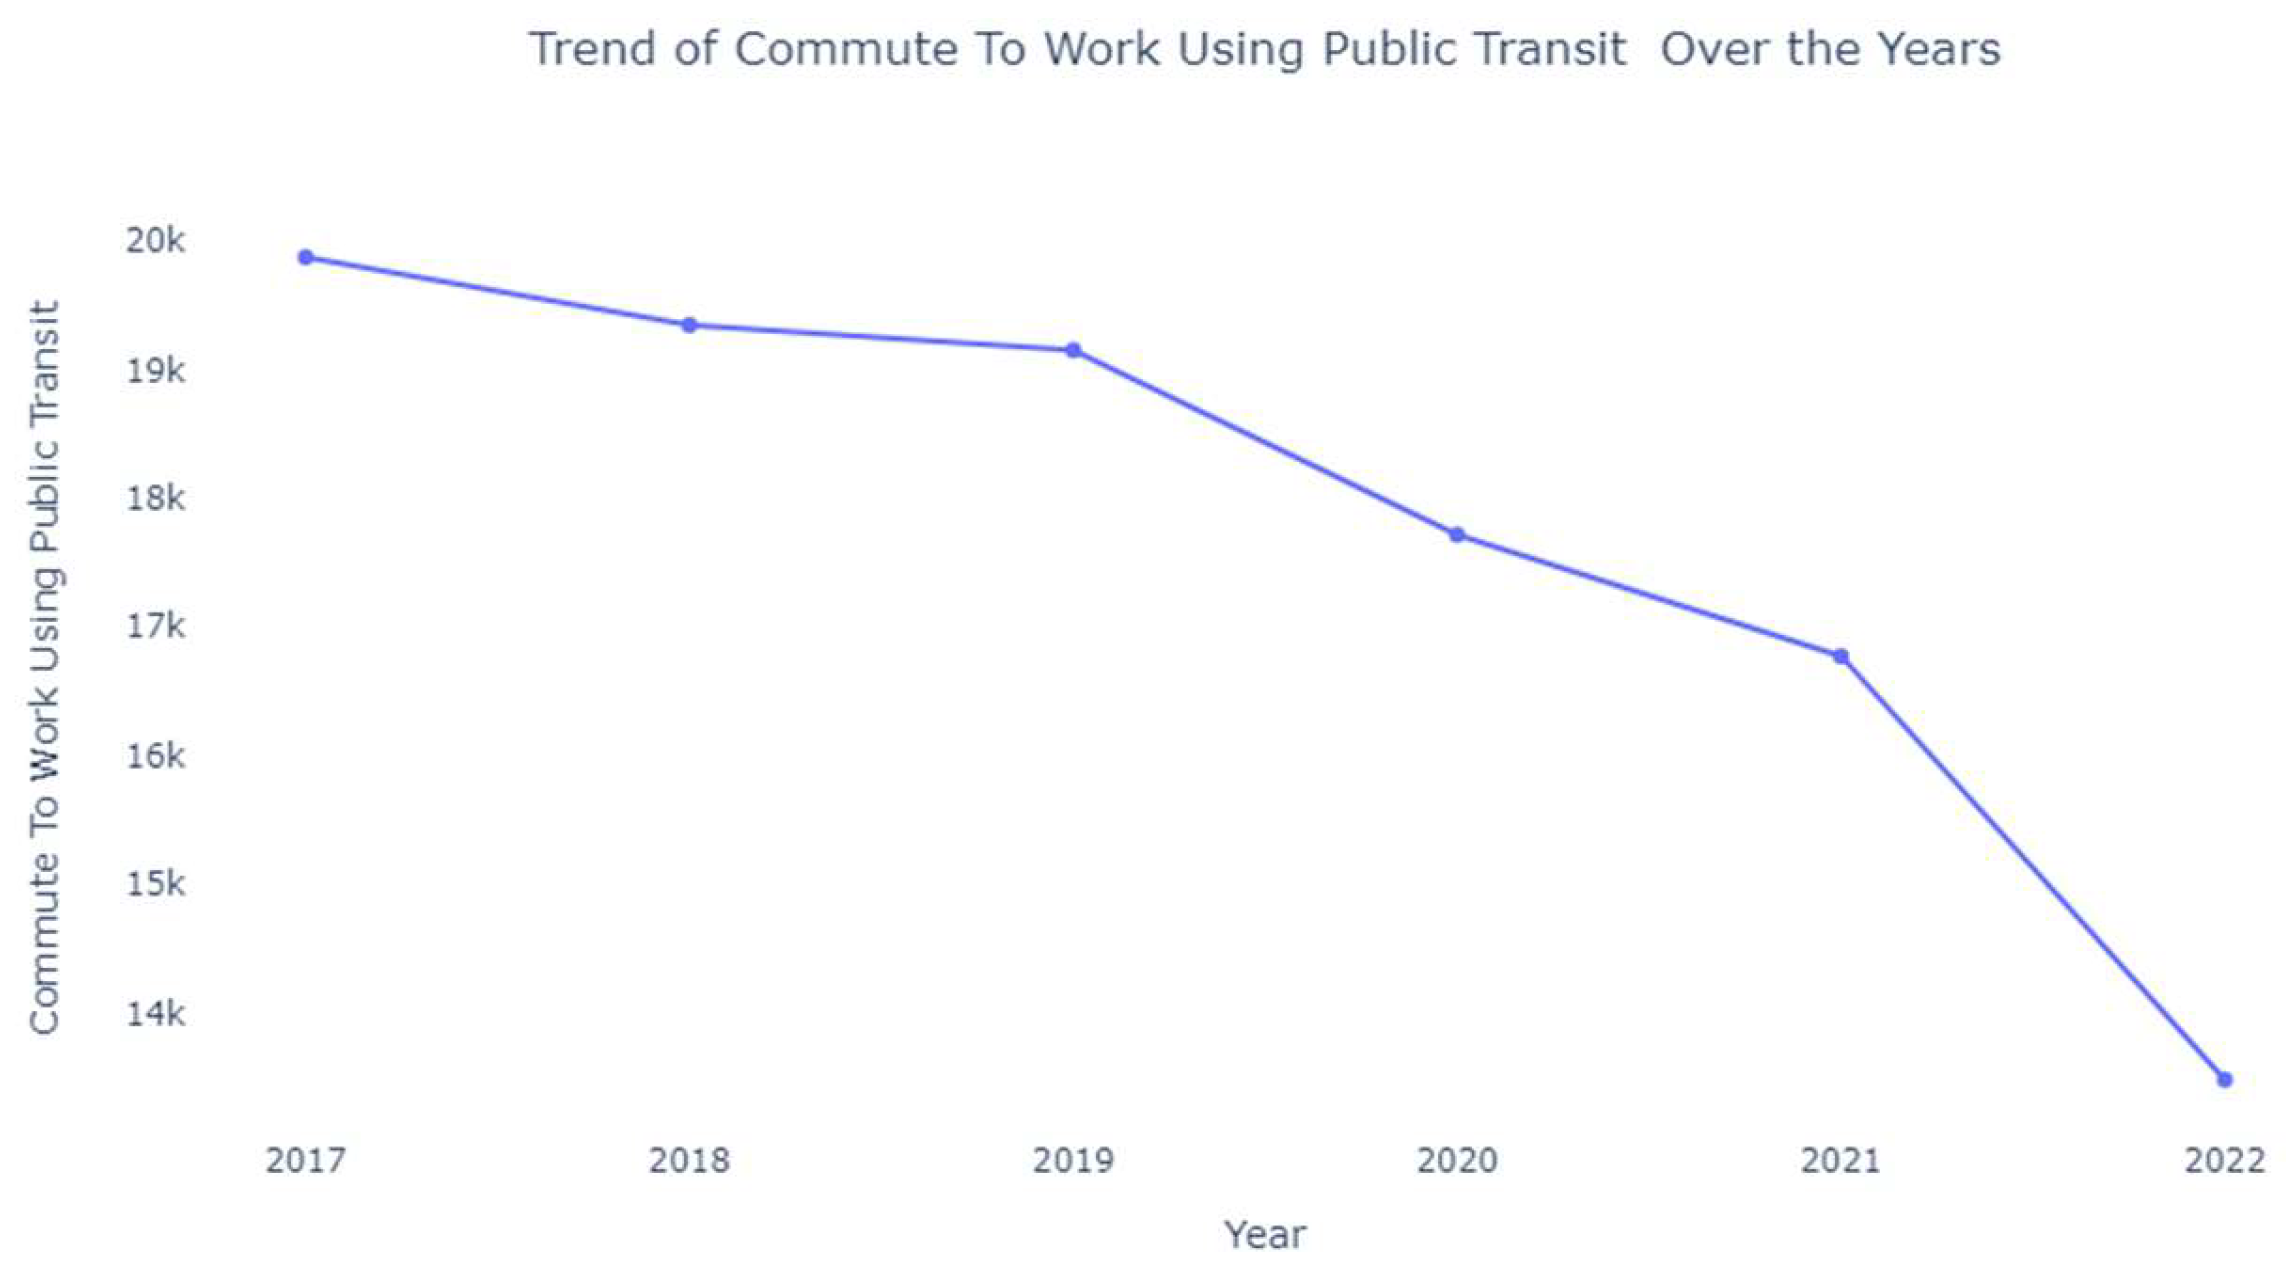
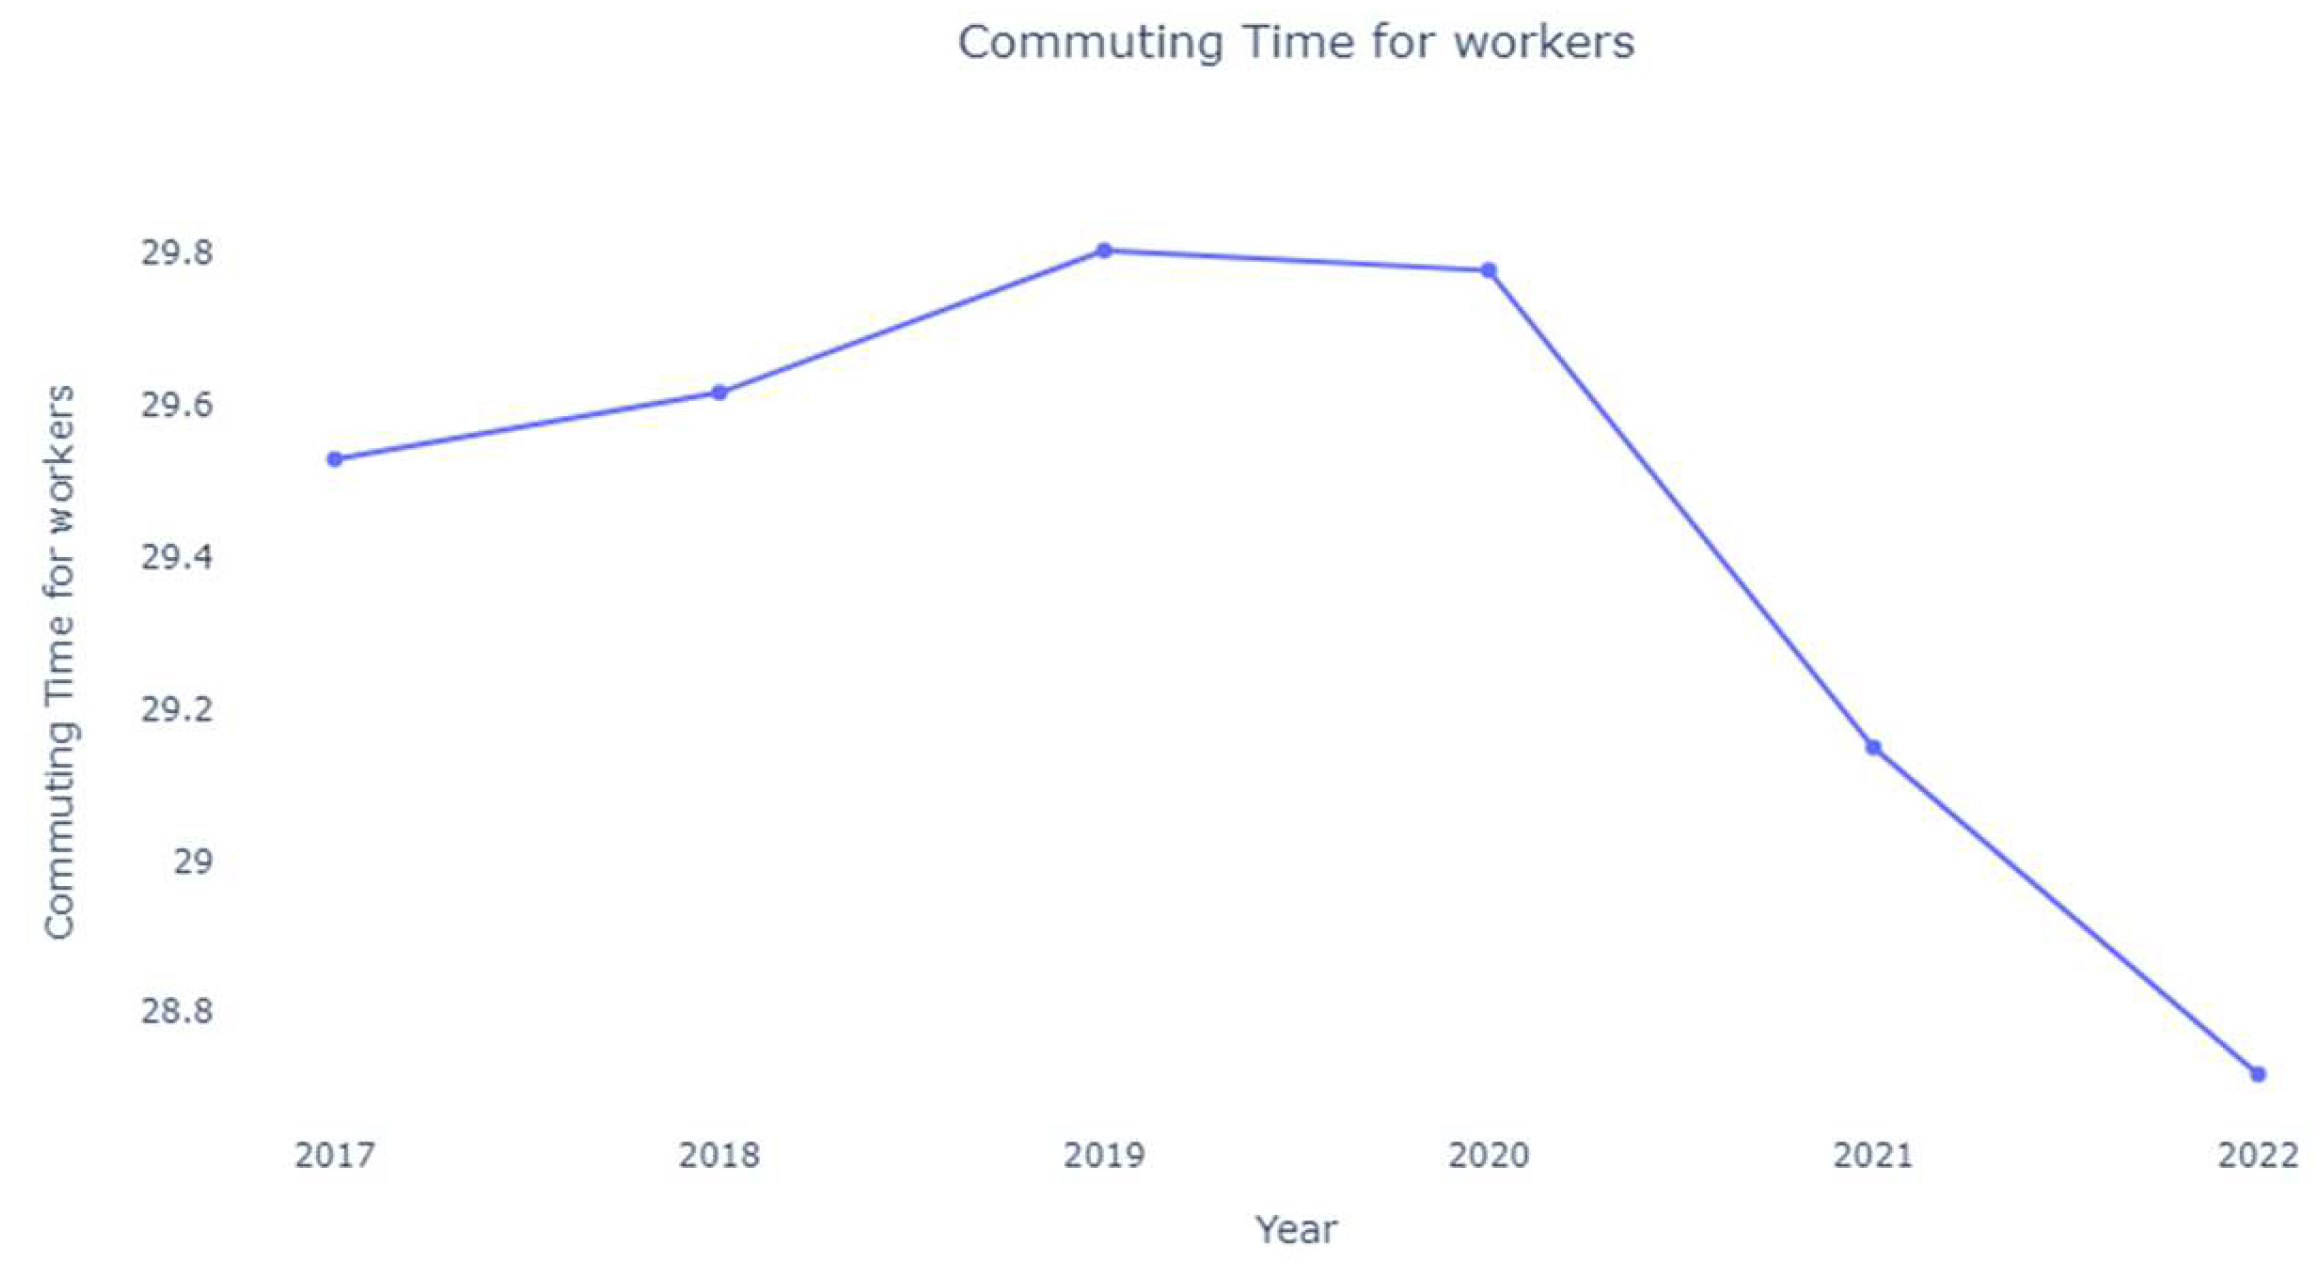
Commuting Time for Workers
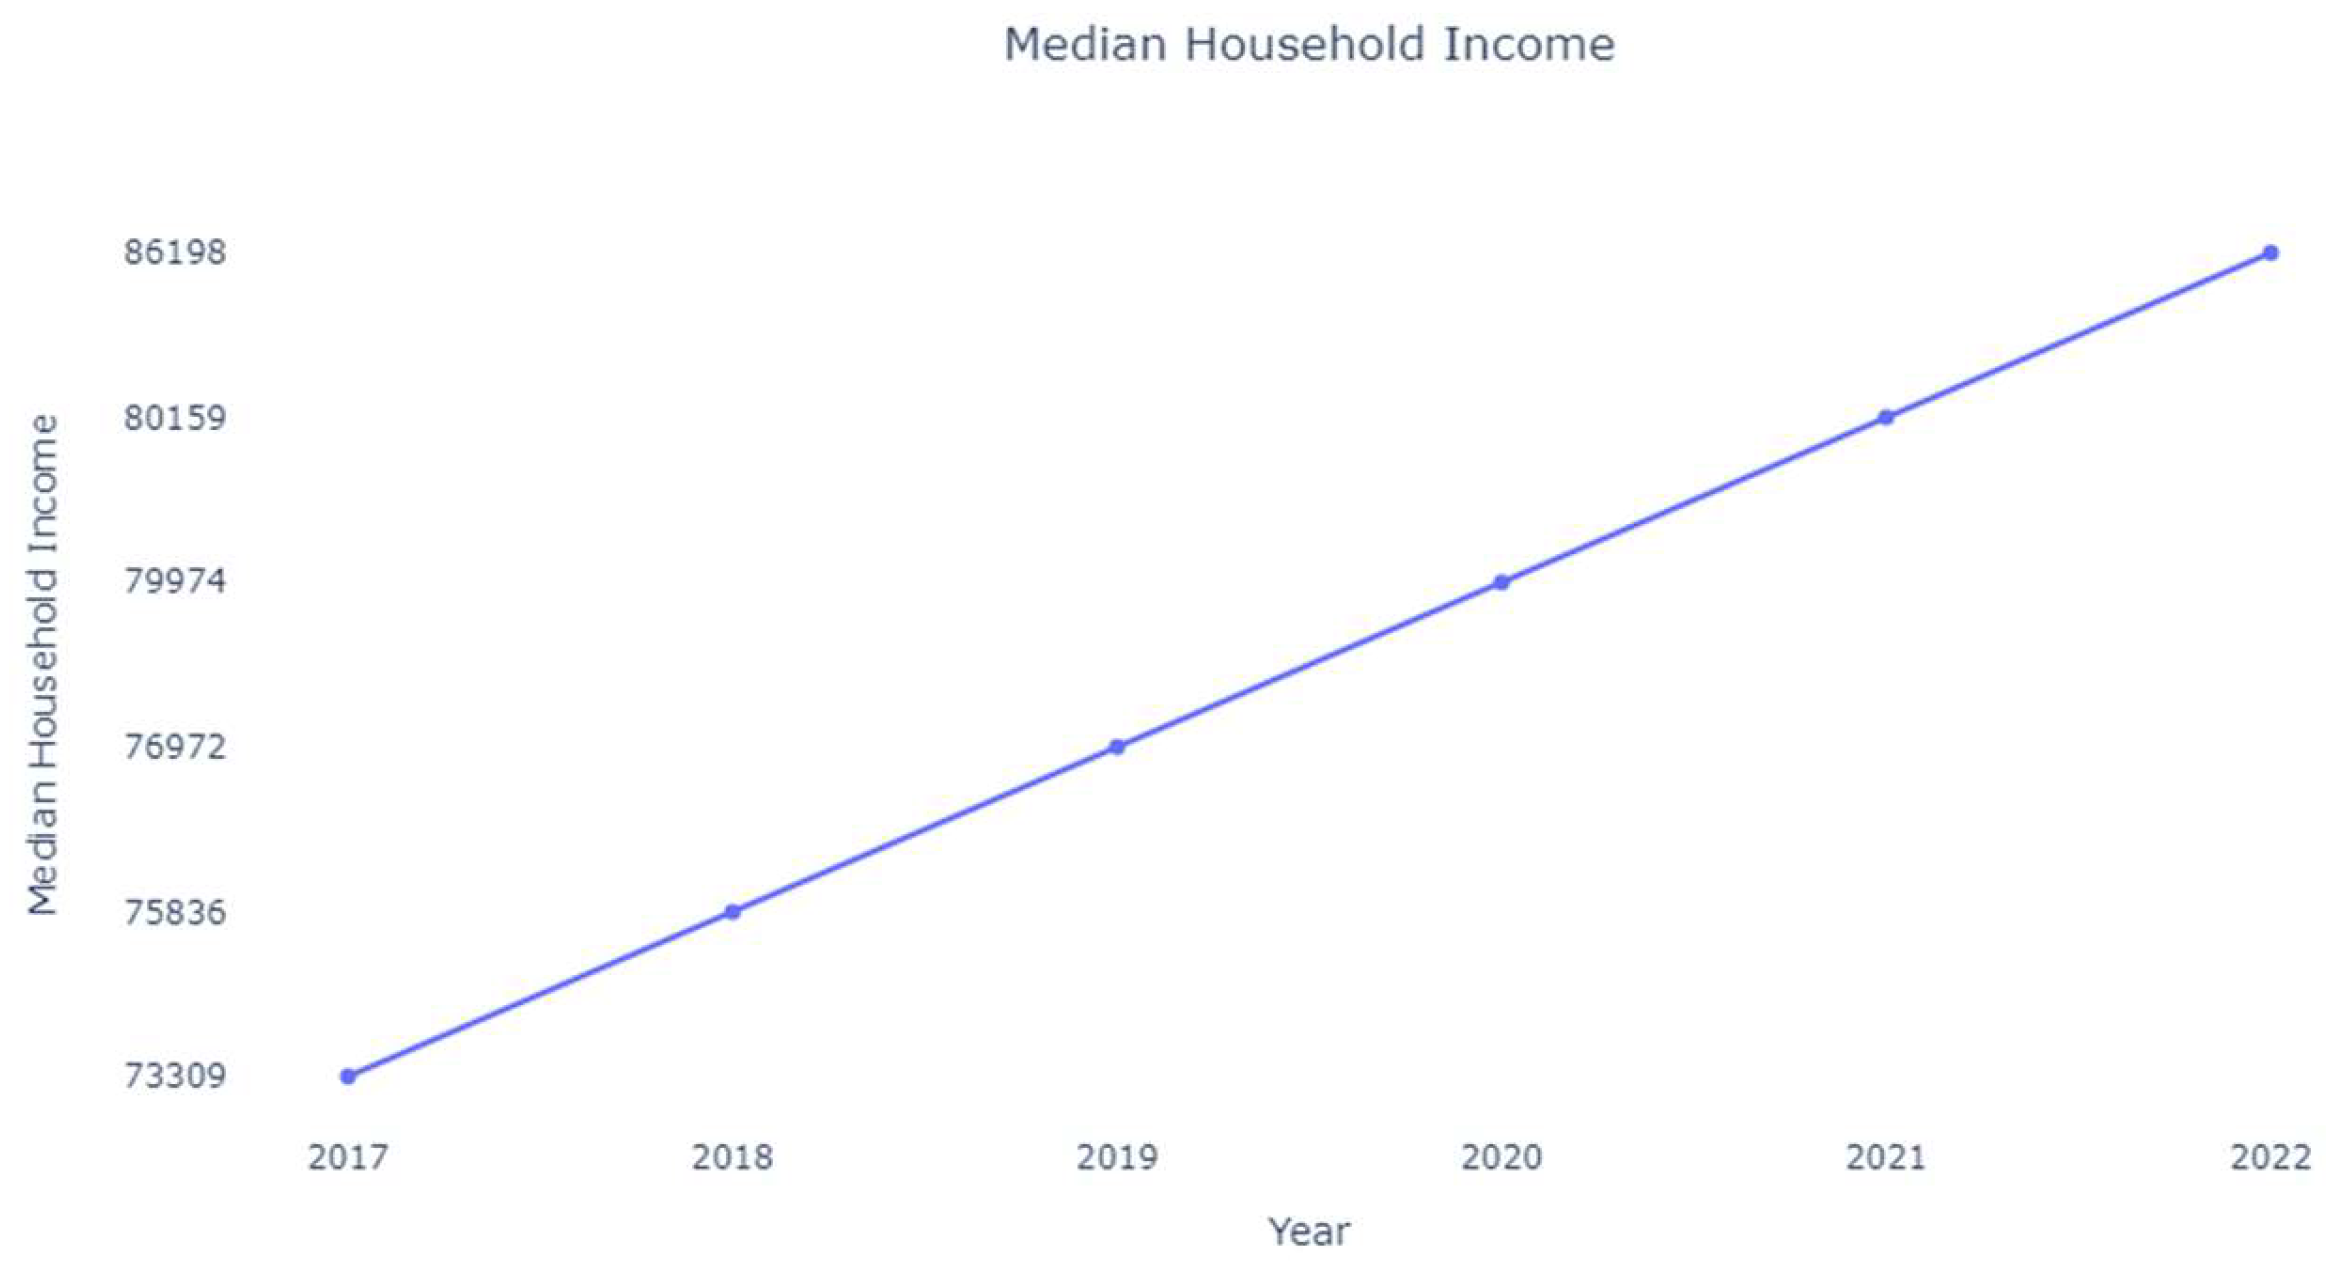
Median Household Income
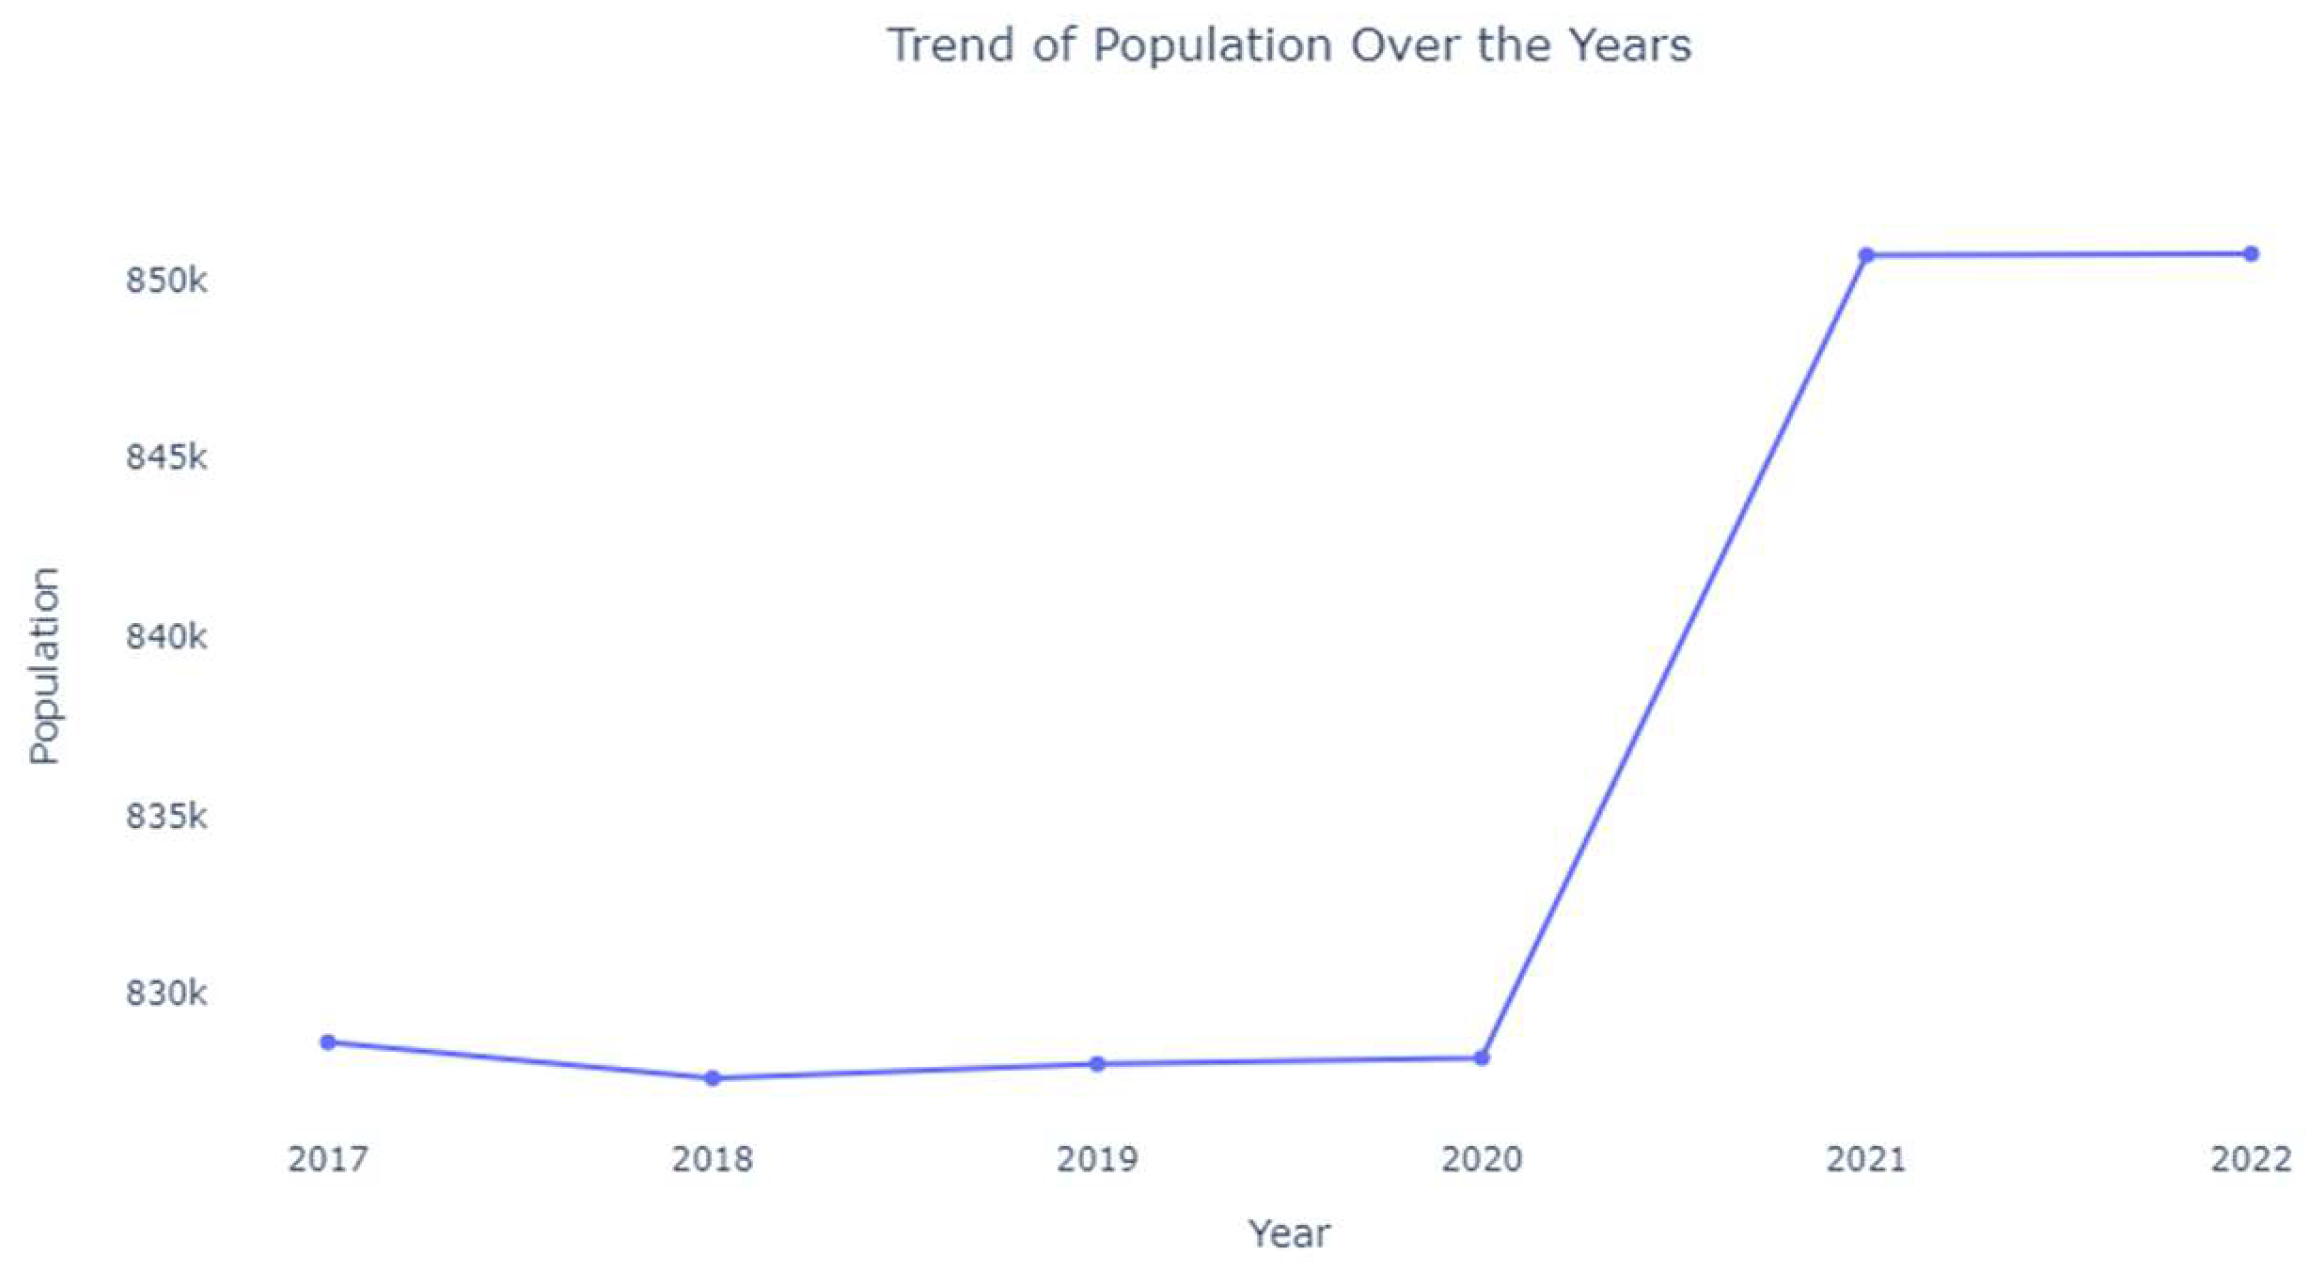
Population
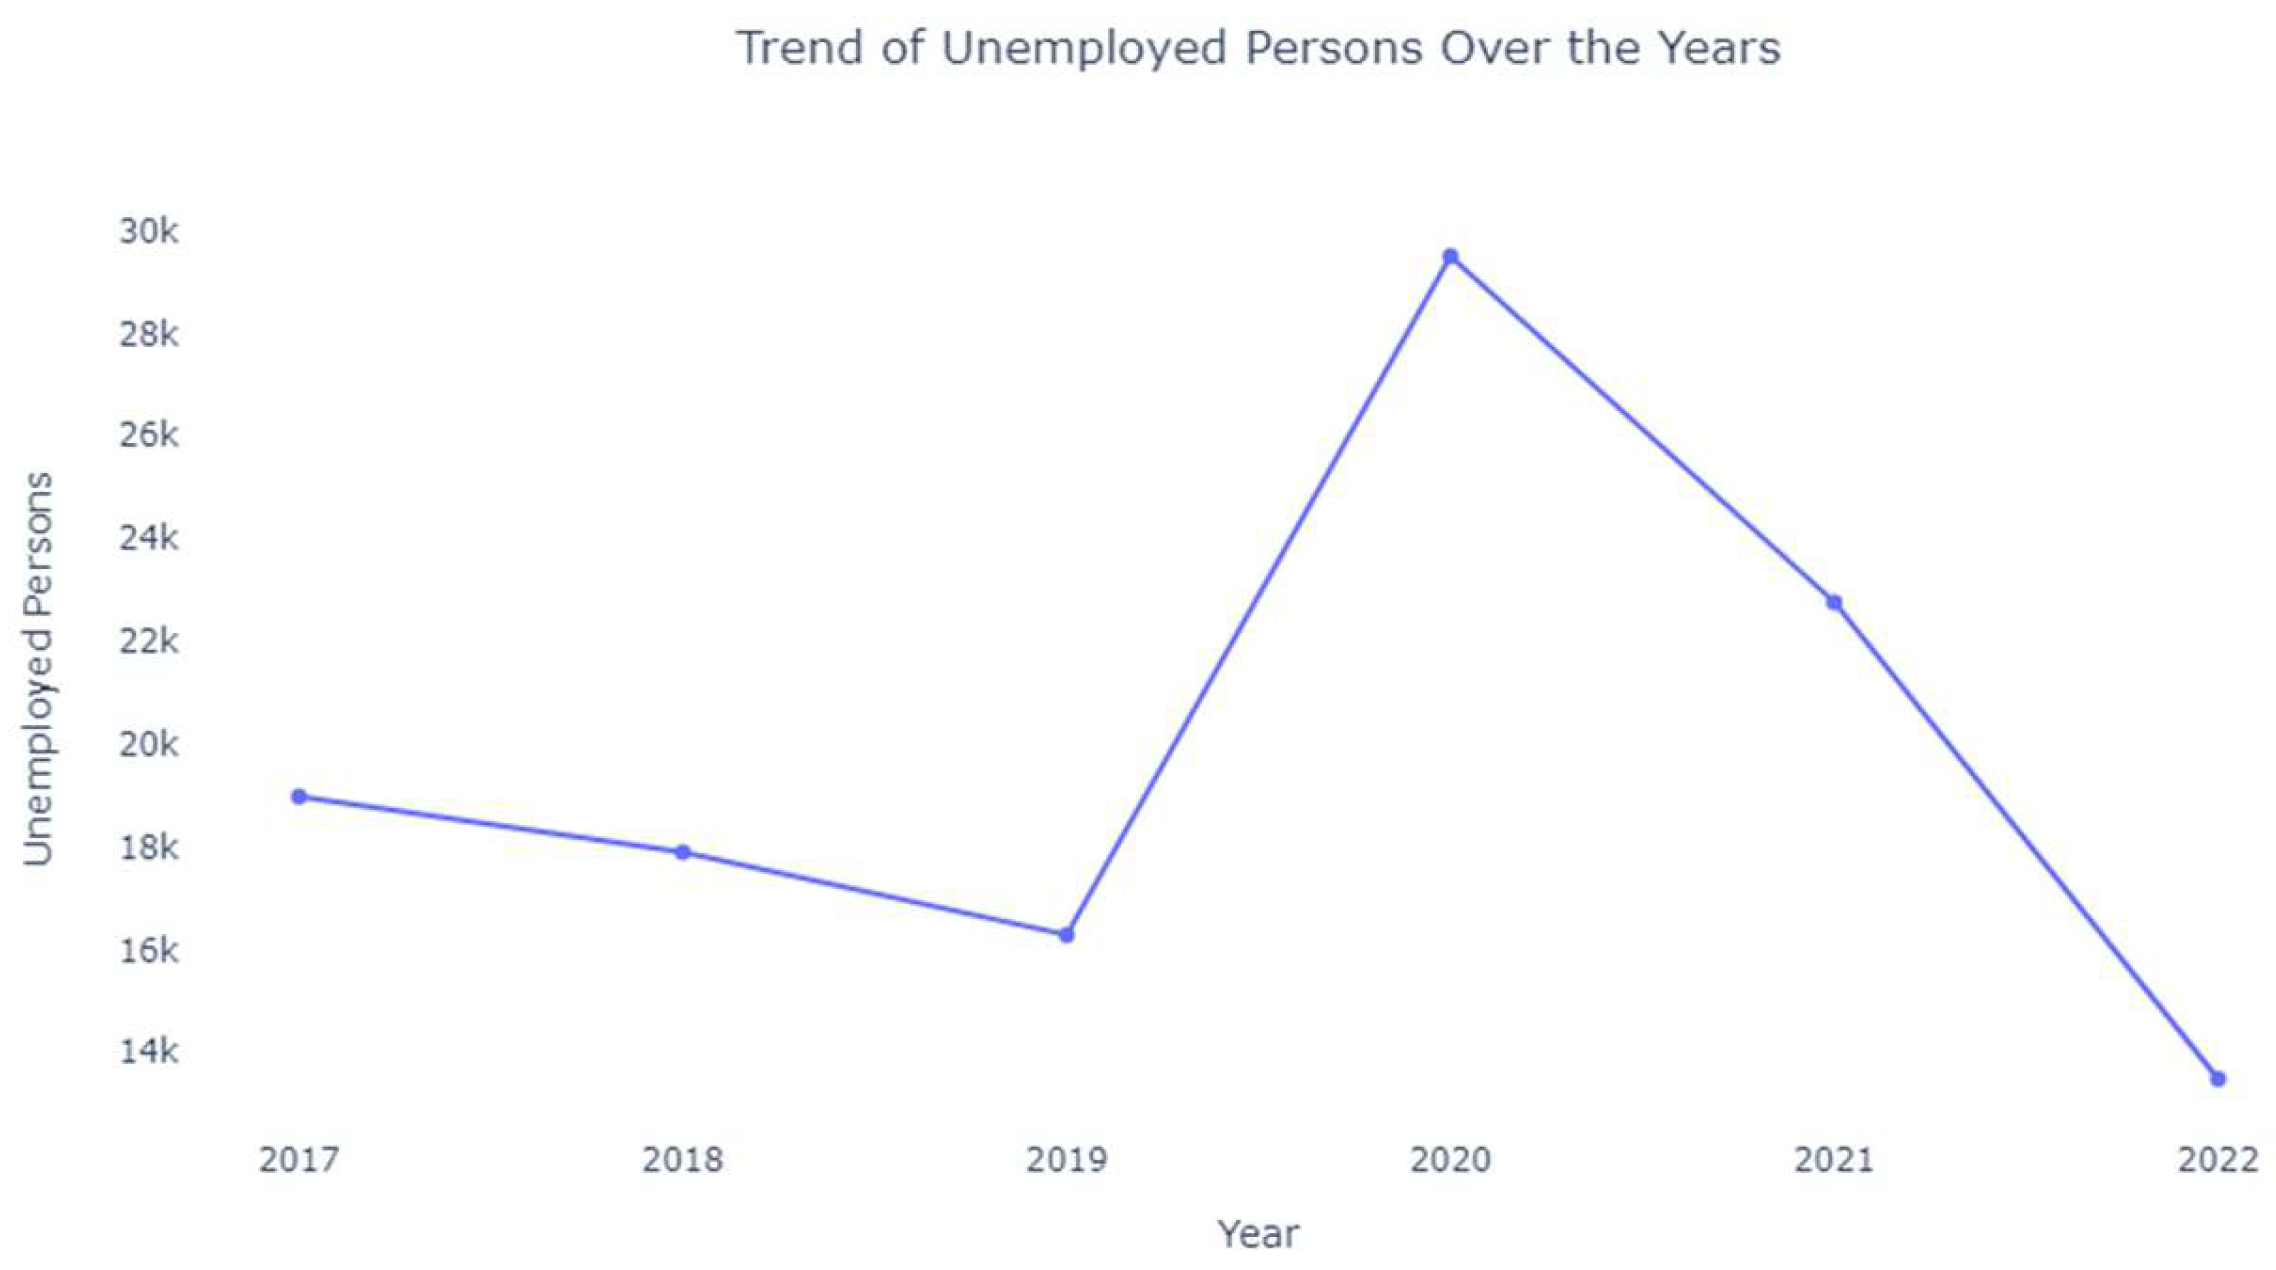
Unemployed Persons
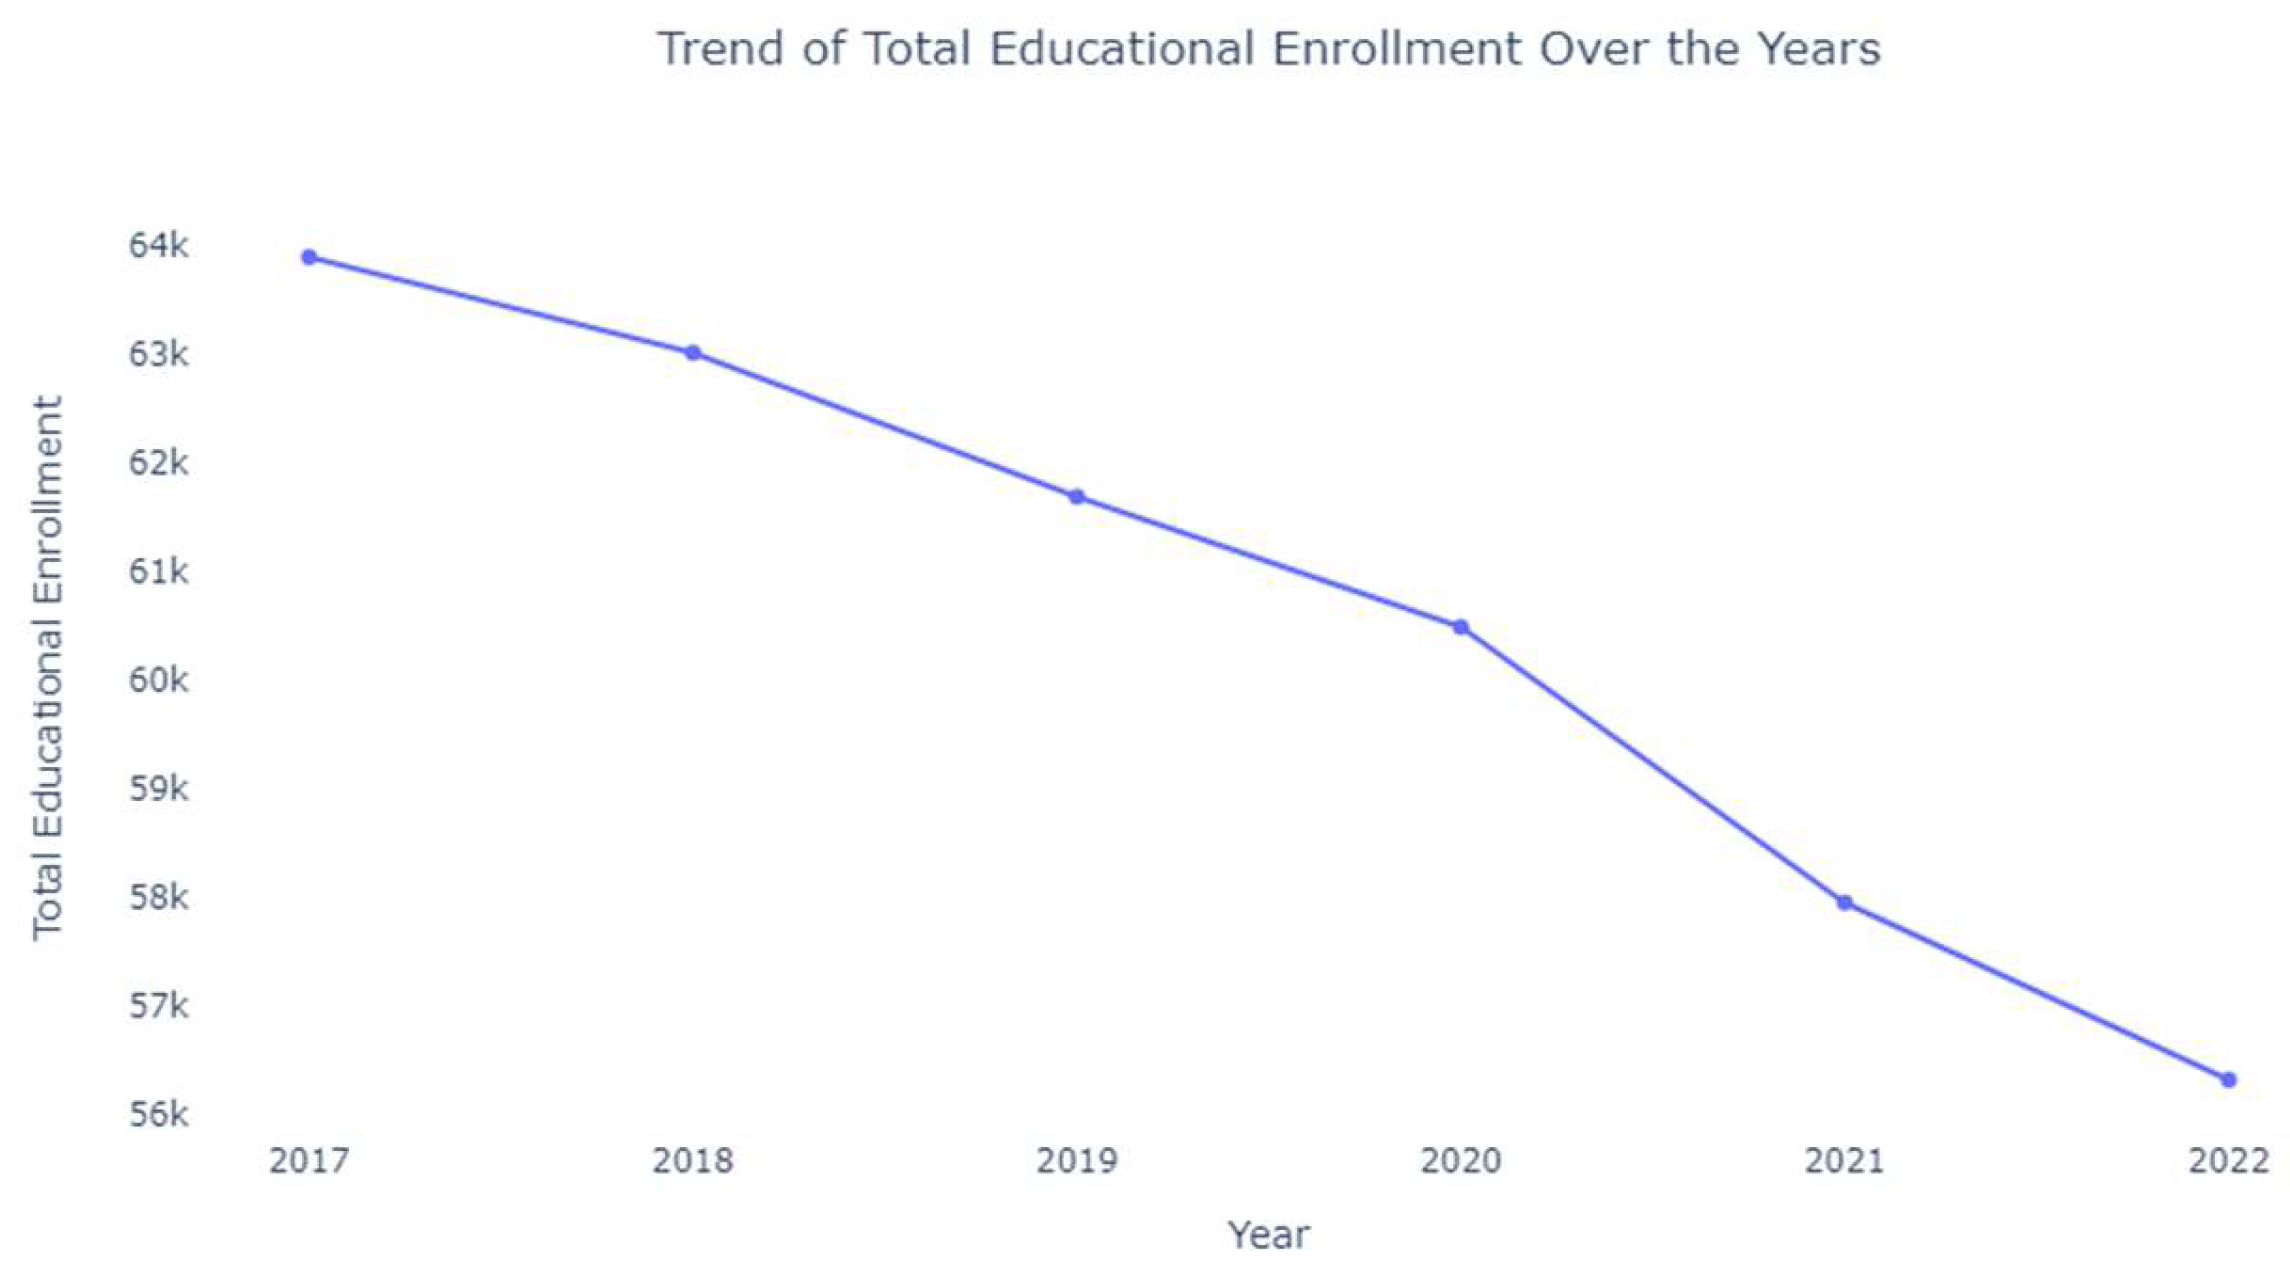
Total Enrollment
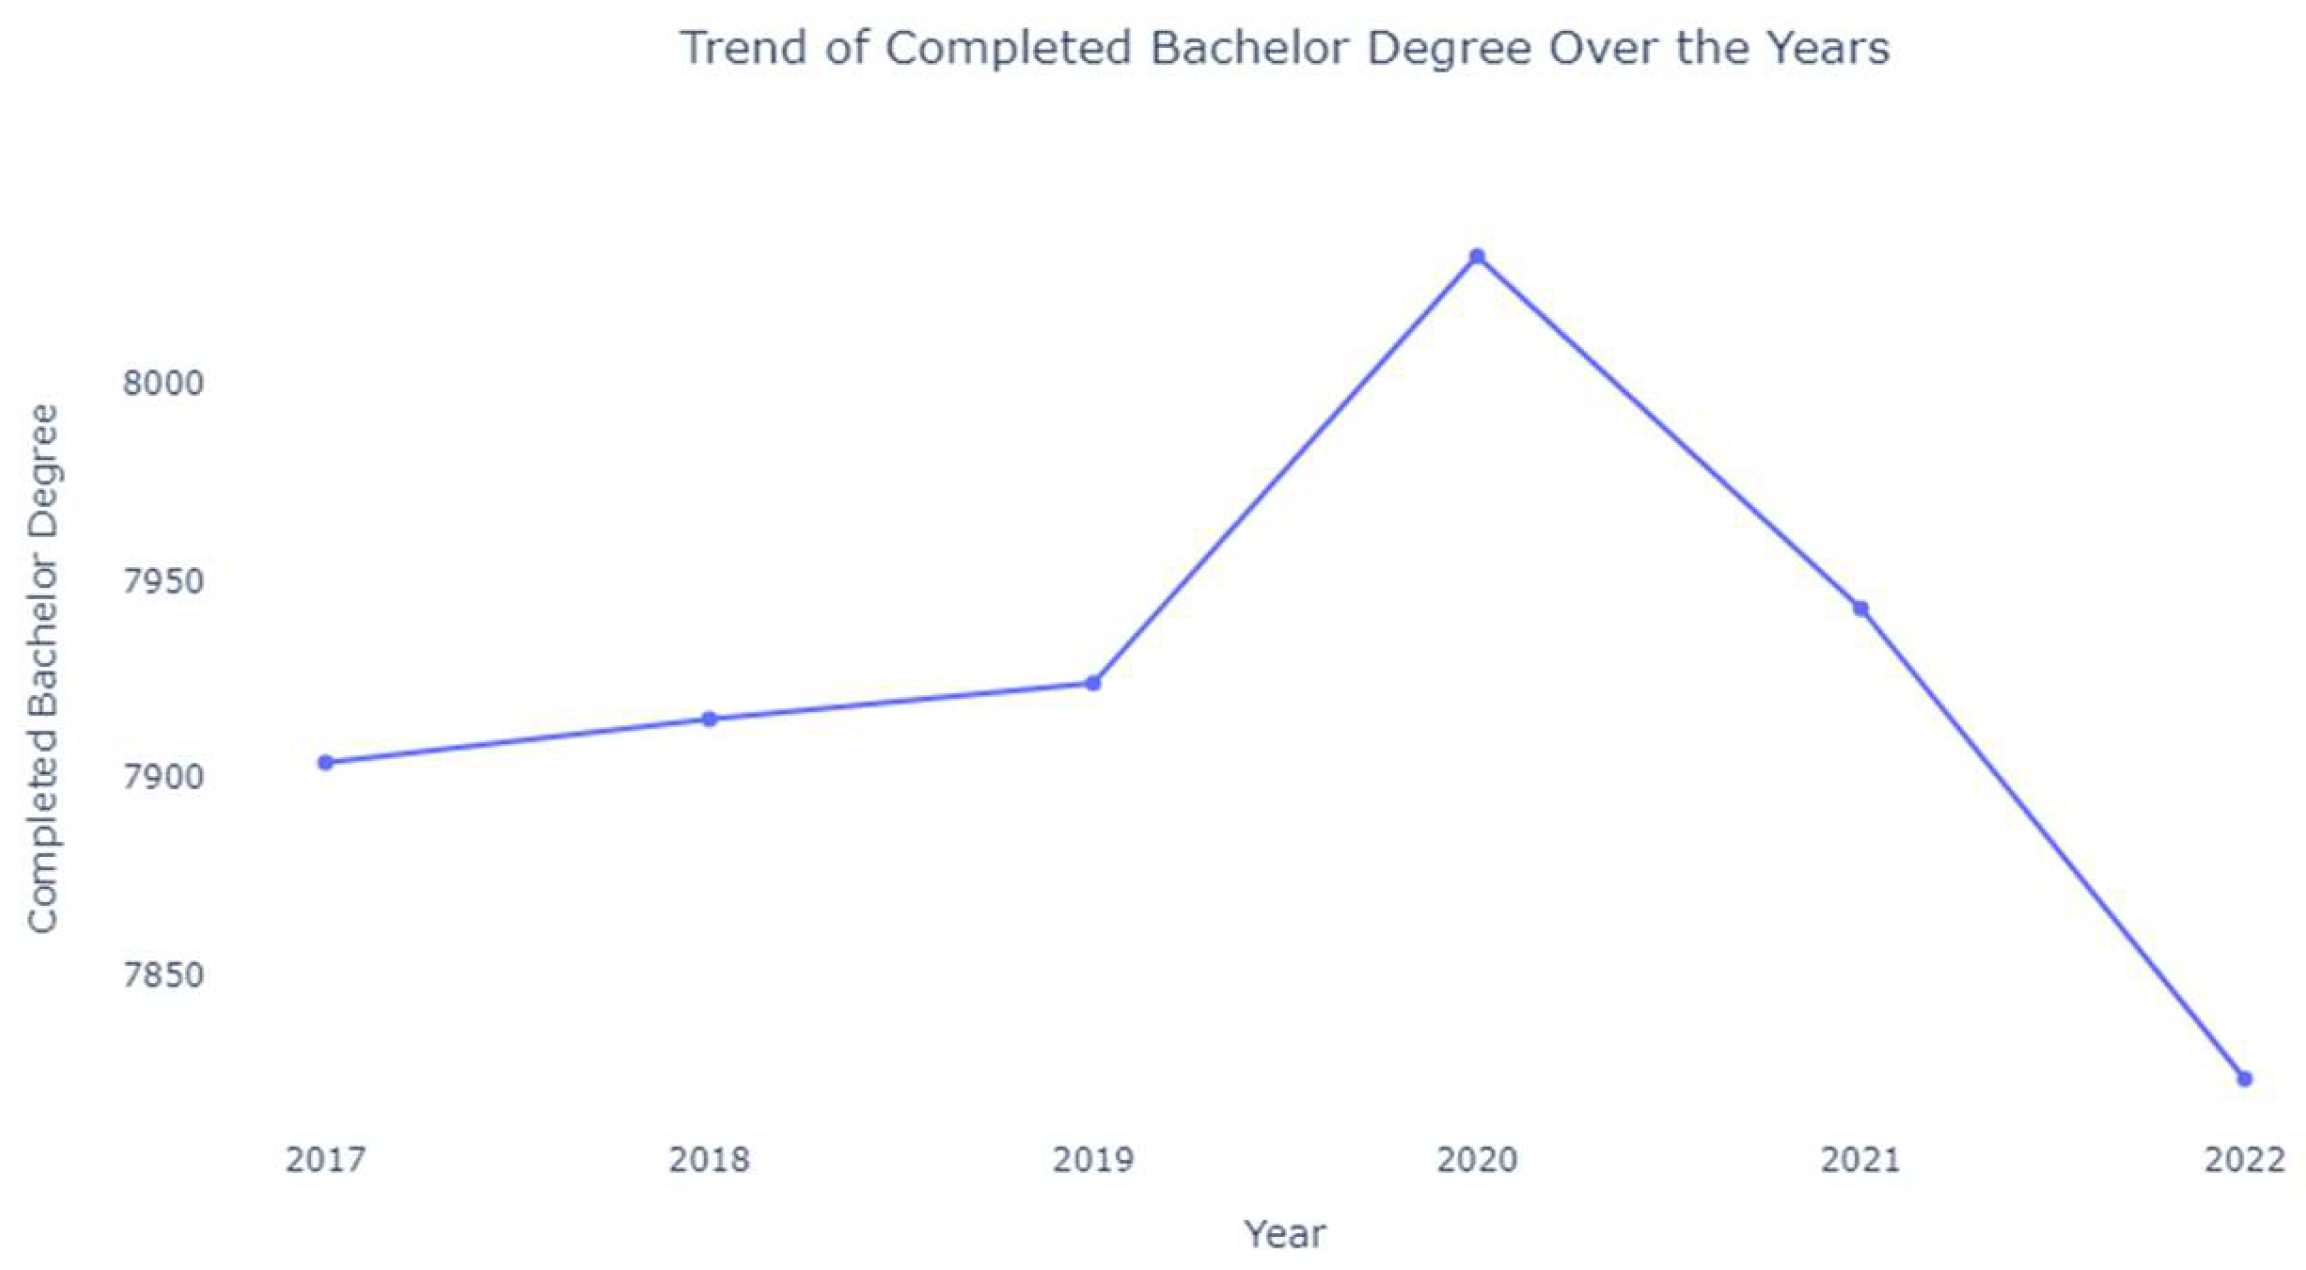
Completed Bachelor
Household Ownership
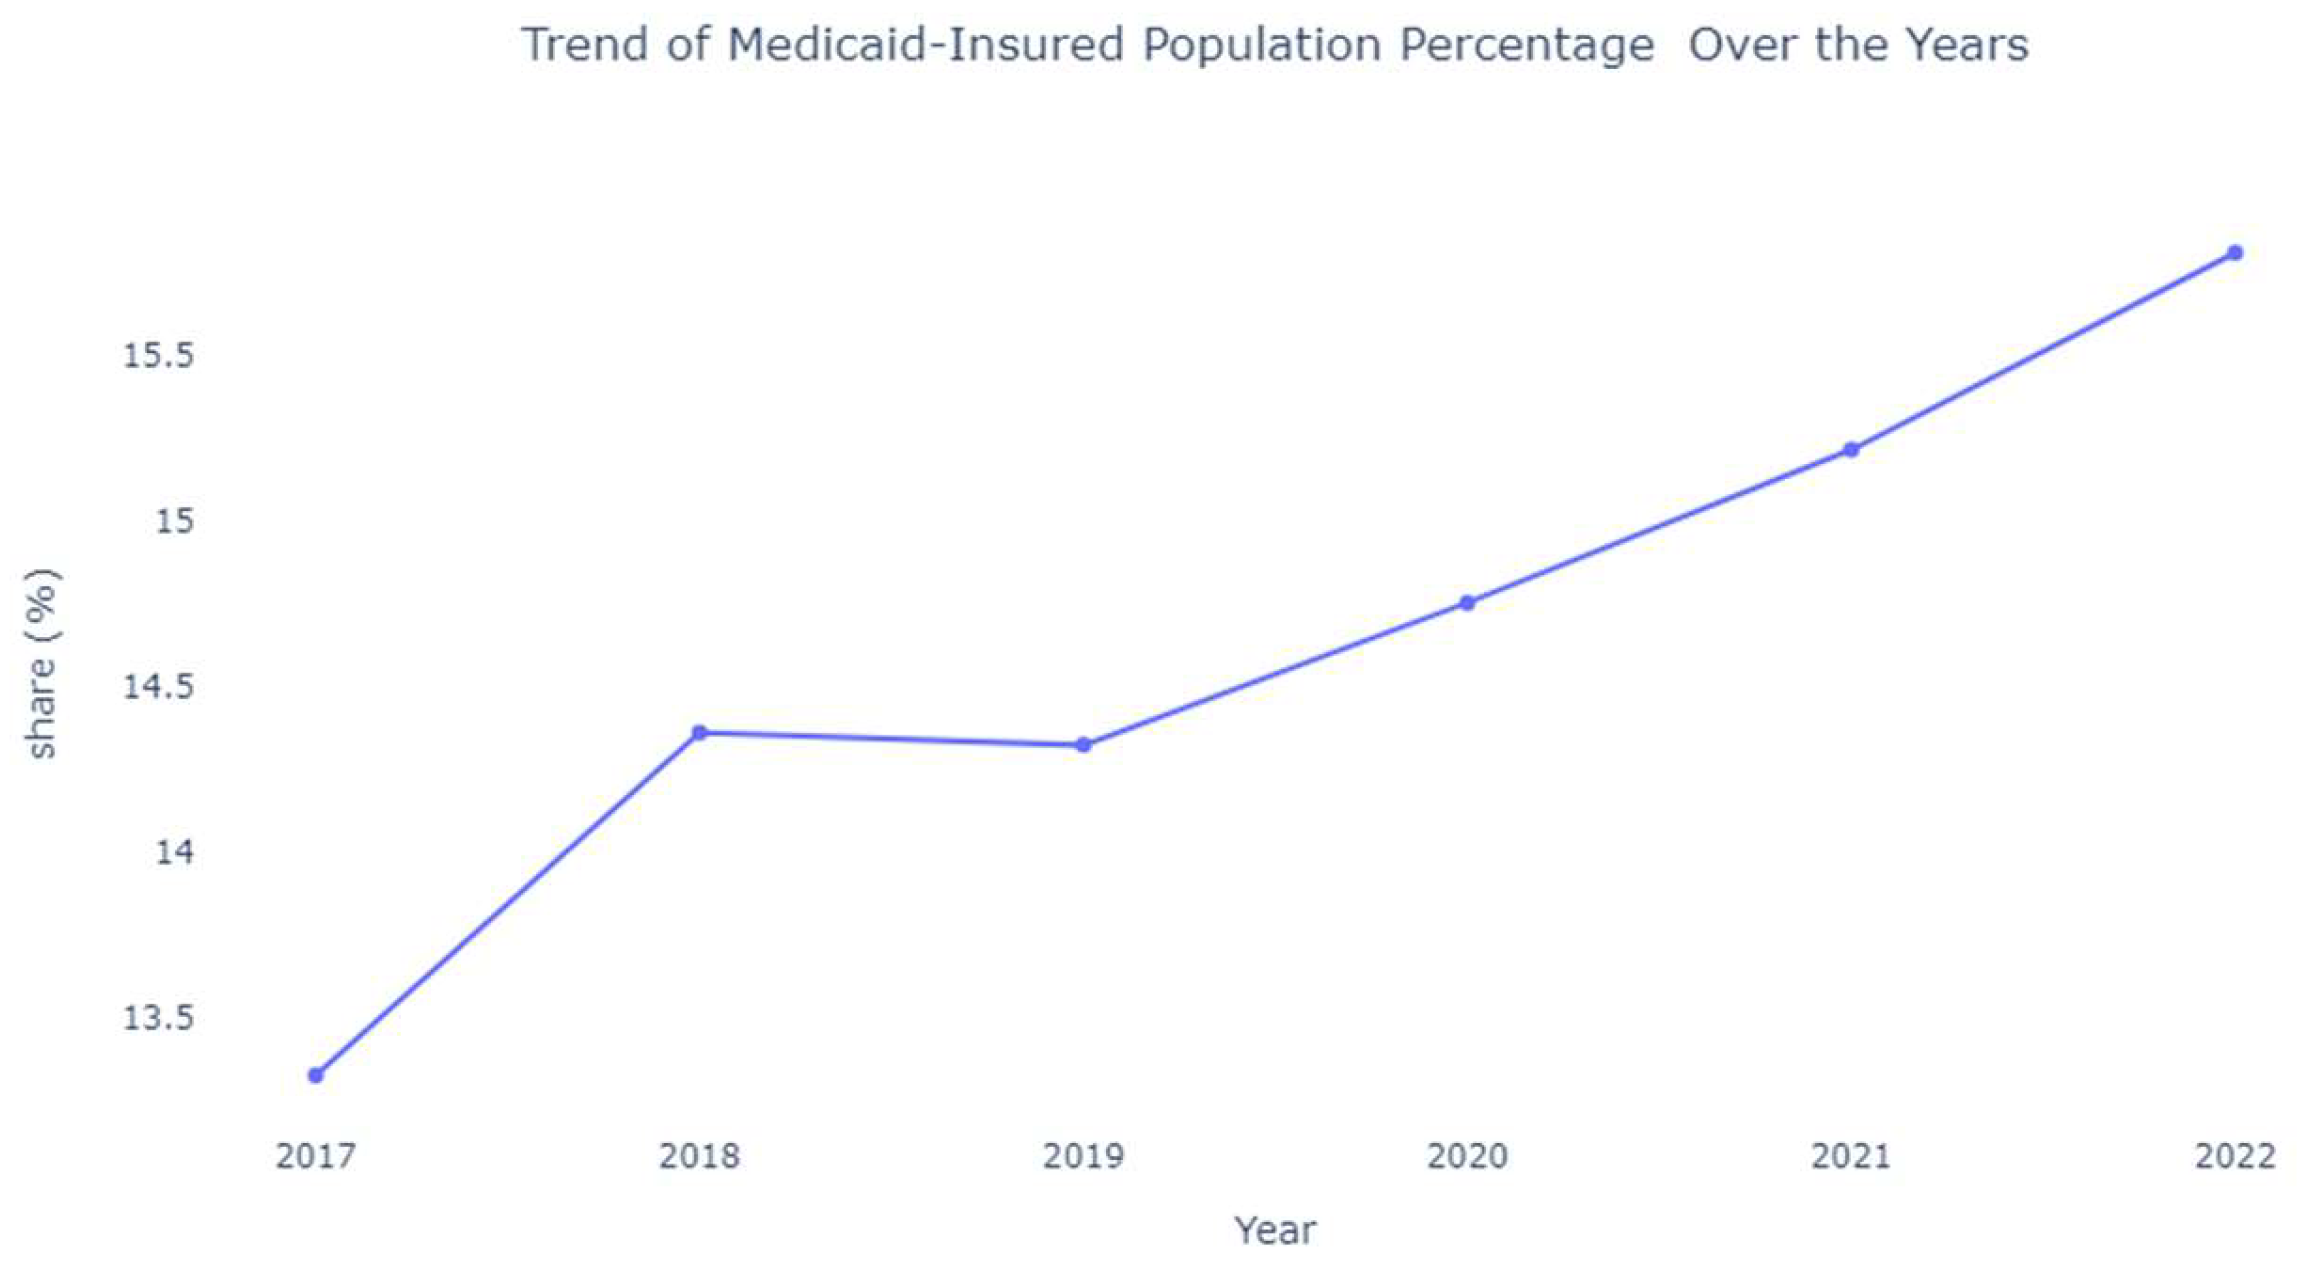
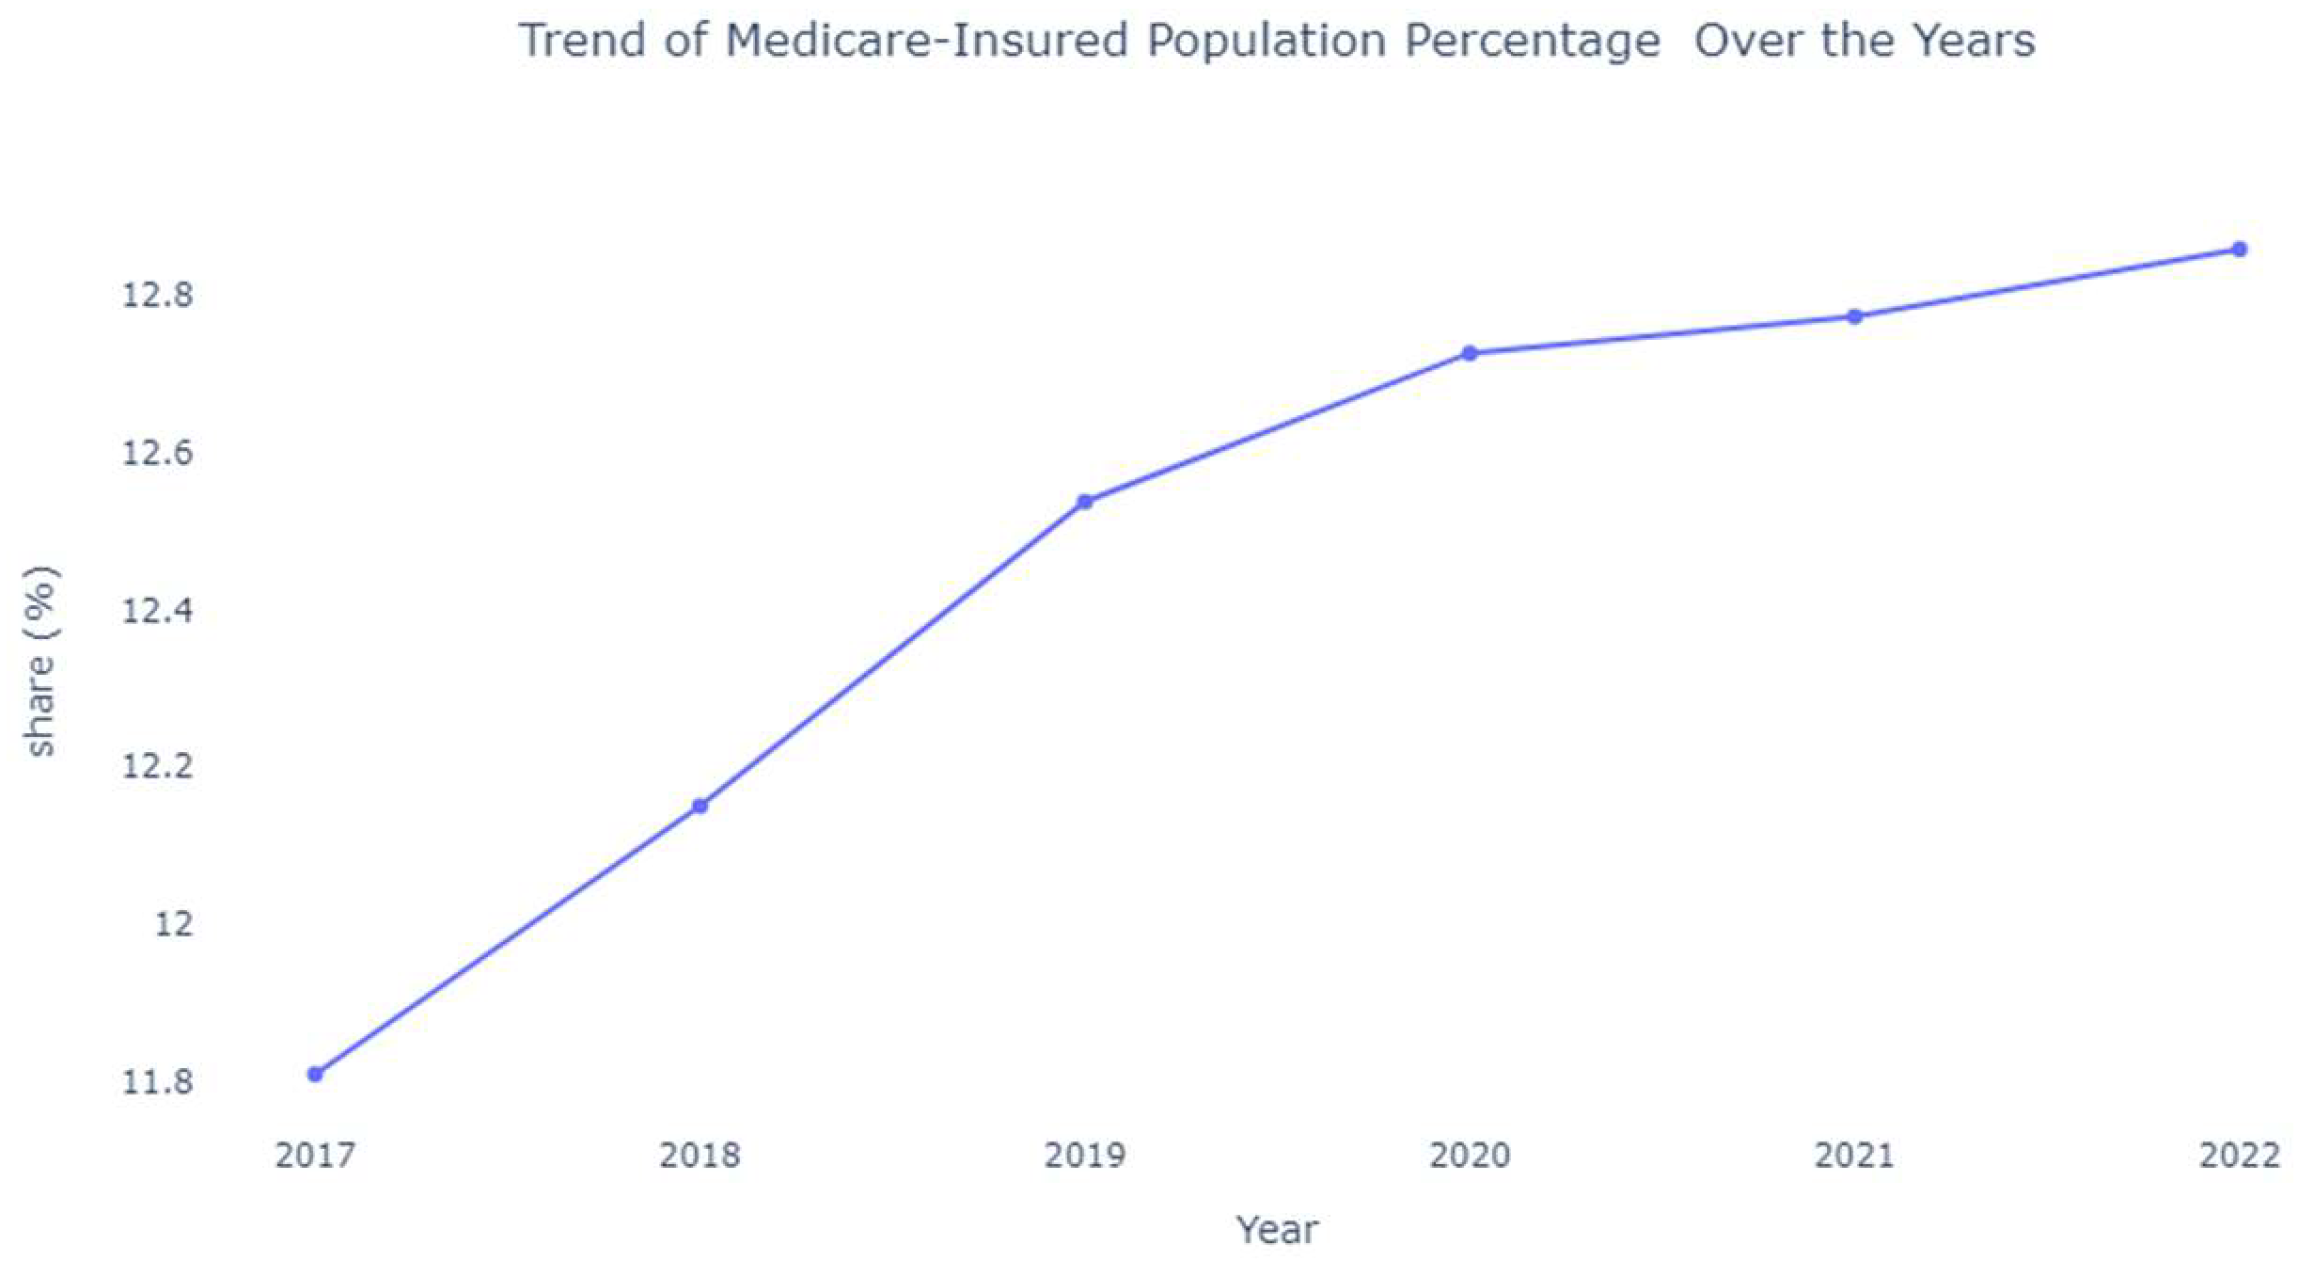
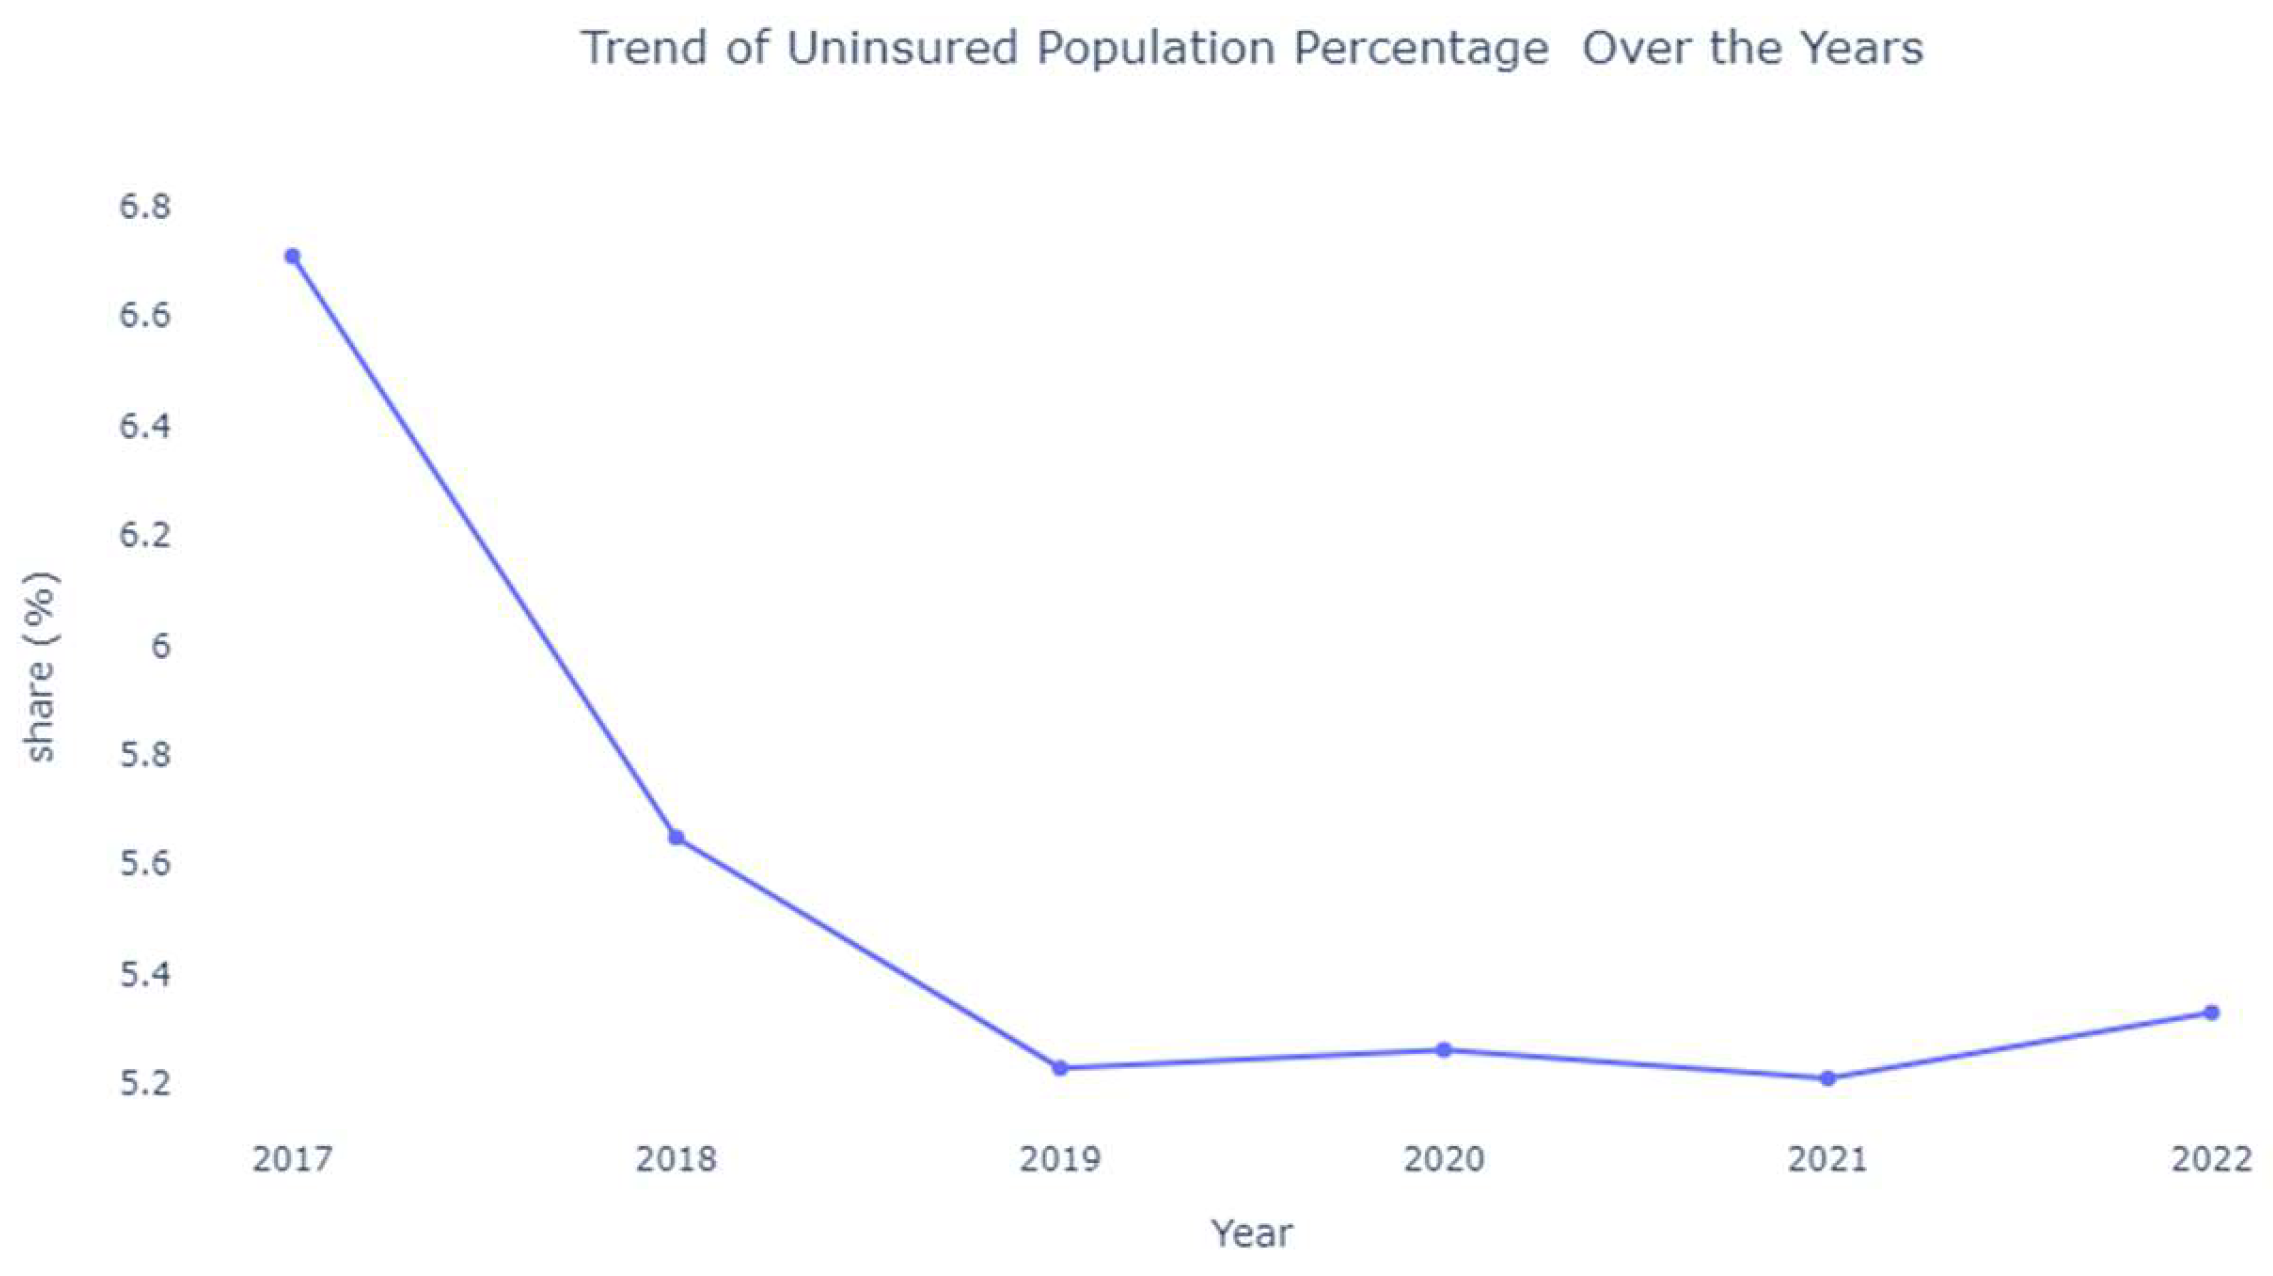
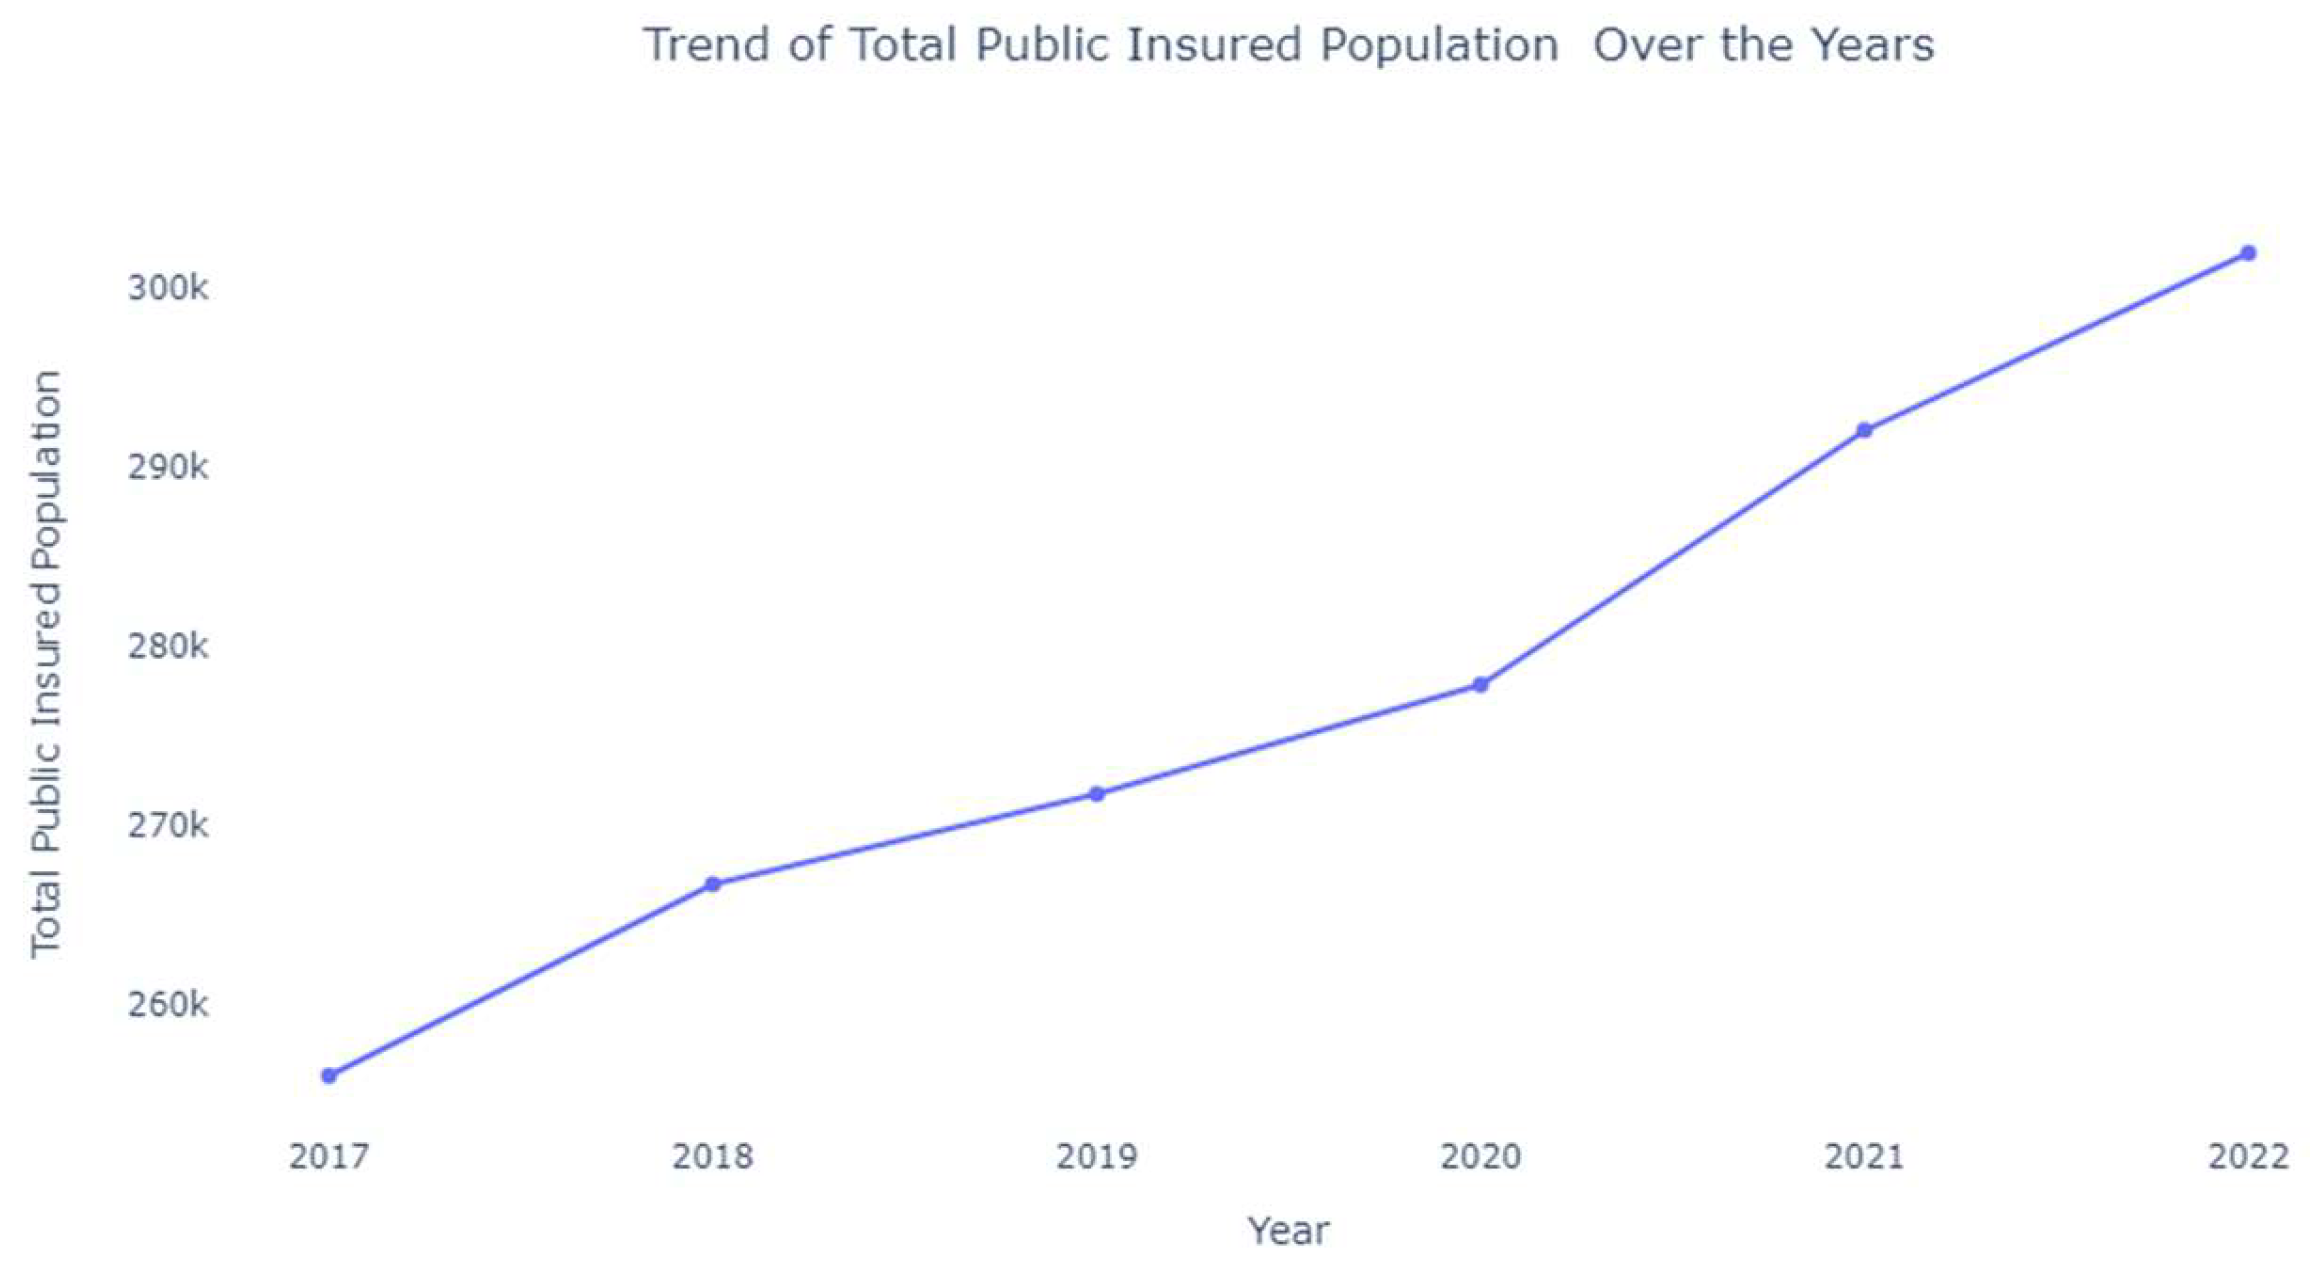
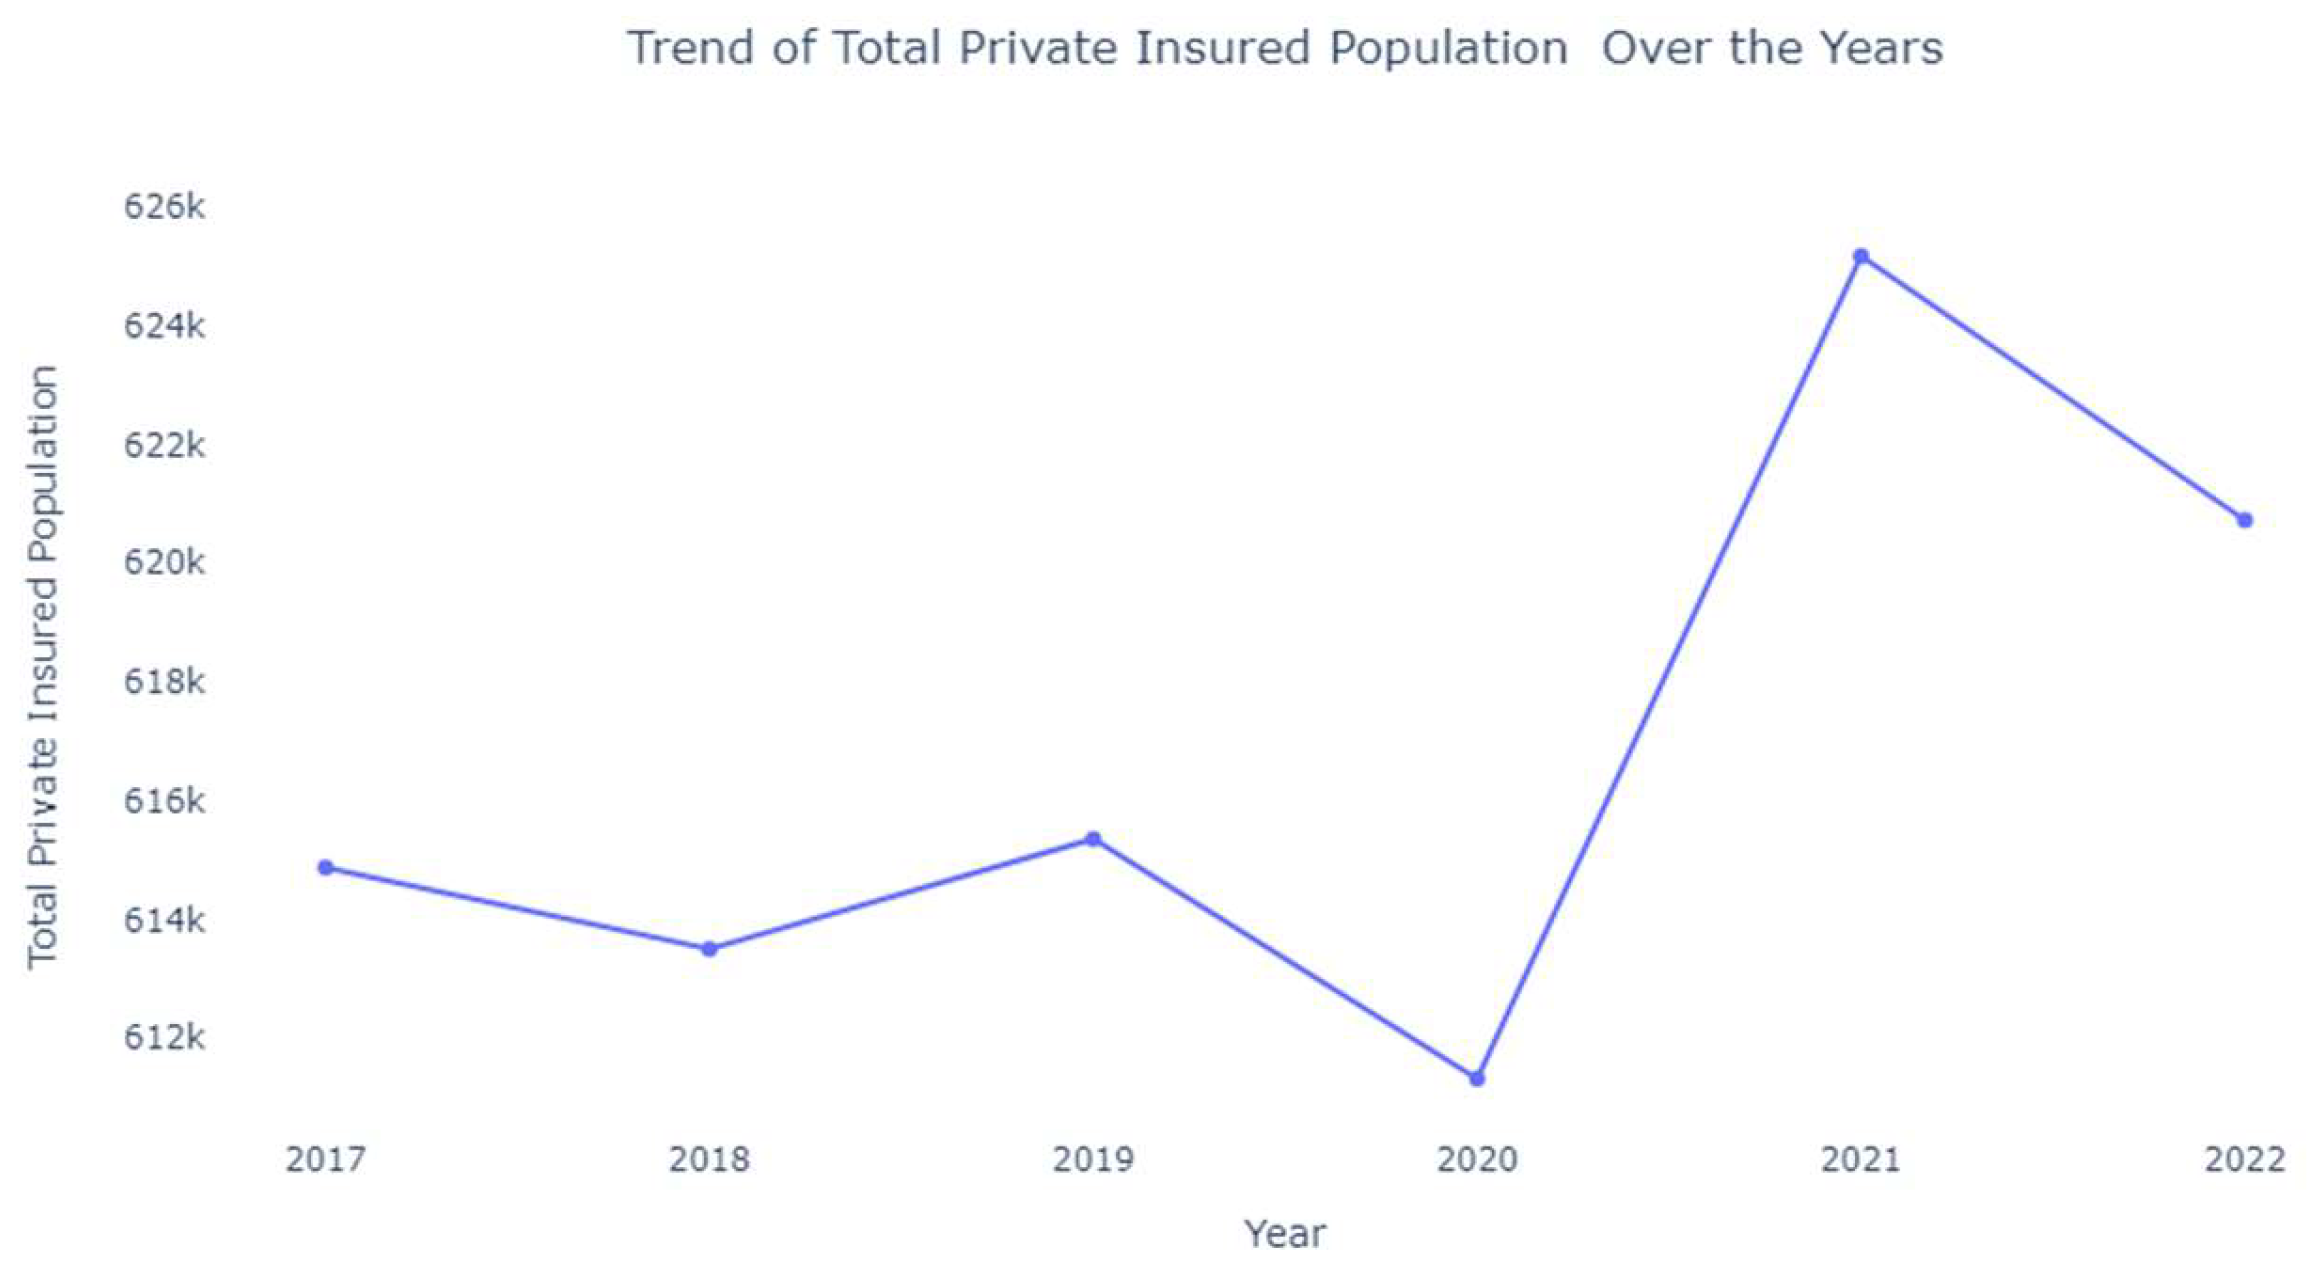
Insurance Coverage
- 1.
- Income and Insurance: The strong links between income levels, insurance types, and educational enrollment suggest that policies focusing on improving economic conditions could positively impact insurance accessibility and educational opportunities.
- 2.
- Healthcare Coverage and Economic Conditions: The correlation between poverty, Medicaid reliance, and unemployment emphasizes the importance of economically sensitive healthcare solutions. This insight can guide strategies to scale public insurance support in economically challenged areas.
- 3.
- Transportation and Workforce Dynamics: The relationships between commuting patterns, household income, and educational attainment highlight how transportation infrastructure may impact economic and educational access. Prioritizing transit accessibility in high-density or low-income areas can improve overall workforce resilience and economic adaptability.
Limitation
Conclusion and Recommendations
| 1 | Sara Meerow, Pani Pajouhesh, and Thaddeus R. Miller, “Social Equity in Urban Resilience Planning,” Local Environment 24, no. 9 (September 2, 2019): 793–808, https://doi.org/10.1080/13549839.2019.1645103. |
Caitlin DeClercq et al., “A Novel Approach to Locating Community Clinics to Promote Health Care Accessibility and Reduce Health Disparities in Baltimore, Maryland,” Inquiry: A Journal of Medical Care Organization, Provision and Financing 60 (May 13, 2023): 00469580221135953, https://doi.org/10.1177/00469580221135953. |
|
Brett Theodos et al., “Neighborhood Investment Flows in Baltimore: With a Case Study on the East Baltimore Development Initiative,” Urban Institute, September 29, 2020, https://www.urban.org/research/publication/neighborhood-investment-flows-baltimore-case-study-east-baltimore-development-initiative; “Drilling Down in Baltimore’s Neighborhoods,” The Abell Foundation (blog), accessed November 13, 2024, https://abell.org/publication/drilling-down/; “New Report from Johns Hopkins Finds Stark Transit Inequity in Baltimore | Hub,” accessed November 13, 2024, https://hub.jhu.edu/2021/10/07/transit-inequity-baltimore/. |
|
“Mayor Scott, BCIT Release Five-Year Plan to Address the City’s Digital Divide,” Mayor Brandon M. Scott, December 13, 2023, https://mayor.baltimorecity.gov/news/press-releases/2023-12-13-mayor-scott-bcit-release-five-year-plan-address-citys-digital-divide. |
|
“What Is the Internet of Things (IoT)? | IBM,” accessed November 13, 2024, https://www.ibm.com/topics/internet-of-things. |
|
“What Is Artificial Intelligence (AI)? | IBM,” August 9, 2024, https://www.ibm.com/topics/artificial-intelligence. |
|
Soroush Piri, “Smart Infrastructure Integration for Enhanced Urban Resilience: A Transdisciplinary Approach,” SSRN Scholarly Paper (Rochester, NY: Social Science Research Network, April 29, 2024), https://doi.org/10.2139/ssrn.4811269. |
|
“IoT for Monitoring Traffic Tackles Urban Traffic Issues,” Telnyx, accessed November 9, 2024, https://telnyx.com/resources/iot-monitoring-traffic. |
|
“New AI Traffic Lights Being Tested Give Priority to Cyclists over Cars in Hope to ‘encourage More People to Cycle’ | The Irish Sun,” accessed November 9, 2024, https://www.thesun.ie/motors/13799094/ai-traffic-lights-stop-cars-cyclists/?utm_source=chatgpt.com. |
|
Md Eshrat E. Alahi et al., “Integration of IoT-Enabled Technologies and Artificial Intelligence (AI) for Smart City Scenario: Recent Advancements and Future Trends,” Sensors (Basel, Switzerland) 23, no. 11 (May 30, 2023): 5206, https://doi.org/10.3390/s23115206. |
|
C. Ashokkumar et al., “Urban Traffic Management for Reduced Emissions: AI-Based Adaptive Traffic Signal Control,” in 2024 2nd International Conference on Sustainable Computing and Smart Systems (ICSCSS), 2024, 1609–15, https://doi.org/10.1109/ICSCSS60660.2024.10625356. |
|
“Smart City Integration: How IoT Is Reducing Emergency Response Times and Saving Lives - IEEE Public Safety Technology Initiative,” accessed November 9, 2024, https://publicsafety.ieee.org/topics/smart-city-integration-how-iot-is-reducing-emergency-response-times-and-saving-lives. |
|
“How AI Is Being Used to Respond to Natural Disasters in Cities | TIME,” accessed November 9, 2024, https://time.com/7171445/ai-natural-disaster-cities/?utm_source=chatgpt.com. |
|
“Data-Driven Smart Sustainable Cities of the Future: Urban Computing and Intelligence for Strategic, Short-Term, and Joined-up Planning | Computational Urban Science,” accessed November 9, 2024, https://link.springer.com/article/10.1007/s43762-021-00008-9. |
|
“Artificial Intelligence in Smart Cities—Applications, Barriers, and Future Directions: A Review,” accessed November 9, 2024, https://www.mdpi.com/2624-6511/7/3/57. |
|
“Technological Innovations for Enhancing Disaster Resilience in Smart Cities: A Comprehensive Urban Scholar’s Analysis,” accessed November 9, 2024, https://www.mdpi.com/2071-1050/15/15/12036. |
|
Simon Elias Bibri et al., “Environmentally Sustainable Smart Cities and Their Converging AI, IoT, and Big Data Technologies and Solutions: An Integrated Approach to an Extensive Literature Review,” Energy Informatics 6, no. 1 (April 5, 2023): 9, https://doi.org/10.1186/s42162-023-00259-2. |
|
“Pandas - Python Data Analysis Library,” accessed November 13, 2024, https://pandas.pydata.org/about/citing.html. |
|
Kelsey Jordahl et al., “Geopandas/Geopandas: V0.8.1” (Zenodo, July 15, 2020), https://doi.org/10.5281/ZENODO.3946761. |
|
Jordahl et al. |
|
“Sklearn.Preprocessing.MinMaxScaler — Scikit-Learn 0.15-Git Documentation,” accessed November 13, 2024, https://scikit-learn.org/0.15/modules/generated/sklearn.preprocessing.MinMaxScaler.html. |
|
Michael Waskom, “Seaborn: Statistical Data Visualization,” Journal of Open Source Software 6, no. 60 (April 6, 2021): 3021, https://doi.org/10.21105/joss.03021. |
|
Andrew Hudson-Smith et al., “Urban IoT: Advances, Challenges, and Opportunities for Mass Data Collection, Analysis, and Visualization,” in Urban Informatics, ed. Wenzhong Shi et al. (Singapore: Springer, 2021), 701–19, https://doi.org/10.1007/978-981-15-8983-6_38. |
|
Lars Baumgärtner et al., “Smart Street Lights and Mobile Citizen Apps for Resilient Communication in a Digital City” (arXiv, August 27, 2019), https://doi.org/10.48550/arXiv.1908.10233; Naser Hossein Motlagh et al., “Towards Large-Scale IoT Deployments in Smart Cities: Requirements and Challenges,” in Learning Techniques for the Internet of Things, ed. Praveen Kumar Donta, Abhishek Hazra, and Lauri Lovén (Cham: Springer Nature Switzerland, 2024), 105–29, https://doi.org/10.1007/978-3-031-50514-0_6; “(PDF) IoT-Driven Smart Cities: Enhancing Urban Sustainability and Quality of Life,” ResearchGate, accessed November 18, 2024, https://www.researchgate.net/publication/374090800_IoT-Driven_Smart_Cities_Enhancing_Urban_Sustainability_and_Quality_of_Life; “(PDF) The Role of IoT in Transforming Smart Cities: Enhancing Urban Infrastructure and Sustainability Through Technology,” accessed November 18, 2024, https://www.researchgate.net/publication/384285980_The_Role_of_IoT_in_Transforming_Smart_Cities_Enhancing_Urban_Infrastructure_and_Sustainability_Through_Technology. |
|
Steffen Lehmann, “Sustainable Urbanism: Towards a Framework for Quality and Optimal Density?,” Future Cities and Environment 2, no. 1 (August 5, 2016): 8, https://doi.org/10.1186/s40984-016-0021-3; Serio Angelo Maria Agriesti, Ralf-Martin Soe, and Muhammad Atiullah Saif, “Framework for Connecting the Mobility Challenges in Low Density Areas to Smart Mobility Solutions: The Case Study of Estonian Municipalities,” European Transport Research Review 14, no. 1 (July 21, 2022): 32, https://doi.org/10.1186/s12544-022-00557-y. |
|
“(PDF) Up-Zoning New York City’s Mixed-Use Neighborhoods: Property-Led Economic Development and the Anatomy of a Planning Dilemma,” ResearchGate, accessed November 18, 2024, https://www.researchgate.net/publication/249694367_Up-Zoning_New_York_City%27s_Mixed-Use_Neighborhoods_Property-Led_Economic_Development_and_the_Anatomy_of_a_Planning_Dilemma. |
|
“(PDF) Evaluating the Impact of Community Engagement in Urban Planning on Sustainable Development,” ResearchGate, accessed November 18, 2024, https://www.researchgate.net/publication/376995168_Evaluating_the_impact_of_community_engagement_in_urban_planning_on_sustainable_development; “(PDF) Building Engaged Communities—A Collaborative Leadership Approach,” ResearchGate, accessed November 18, 2024, https://www.researchgate.net/publication/328948672_Building_Engaged_Communities-A_Collaborative_Leadership_Approach. |
References
- Agriesti, Serio Angelo Maria, Ralf-Martin Soe, and Muhammad Atiullah Saif. “Framework for Connecting the Mobility Challenges in Low Density Areas to Smart Mobility Solutions: The Case Study of Estonian Municipalities.” European Transport Research Review 14, no. 1 (July 21, 2022): 32. [CrossRef]
- Alahi, Md Eshrat E., Arsanchai Sukkuea, Fahmida Wazed Tina, Anindya Nag, Wattanapong Kurdthongmee, Korakot Suwannarat, and Subhas Chandra Mukhopadhyay. “Integration of IoT-Enabled Technologies and Artificial Intelligence (AI) for Smart City Scenario: Recent Advancements and Future Trends.” Sensors (Basel, Switzerland) 23, no. 11 (May 30, 2023): 5206. [CrossRef]
- “Artificial Intelligence in Smart Cities—Applications, Barriers, and Future Directions: A Review.”. Available online: https://www.mdpi.com/2624-6511/7/3/57 (accessed on 9 November 2024).
- Ashokkumar, C., D. Abitha Kumari, S. Gopikumar, N. Anuradha, R. Santhana Krishnan, and Sakthidevi. I. “Urban Traffic Management for Reduced Emissions: AI-Based Adaptive Traffic Signal Control.” In 2024 2nd International Conference on Sustainable Computing and Smart Systems (ICSCSS), 1609–15, 2024. [CrossRef]
- Baumgärtner, Lars, Jonas Höchst, Patrick Lampe, Ragnar Mogk, Artur Sterz, Pascal Weisenburger, Mira Mezini, and Bernd Freisleben. “Smart Street Lights and Mobile Citizen Apps for Resilient Communication in a Digital City.” arXiv, August 27, 2019. [CrossRef]
- Bibri, Simon Elias, Alahi Alexandre, Ayyoob Sharifi, and John Krogstie. “Environmentally Sustainable Smart Cities and Their Converging AI, IoT, and Big Data Technologies and Solutions: An Integrated Approach to an Extensive Literature Review.” Energy Informatics 6, no. 1 (April 5, 2023): 9. [CrossRef]
- “Data-Driven Smart Sustainable Cities of the Future: Urban Computing and Intelligence for Strategic, Short-Term, and Joined-up Planning | Computational Urban Science.”. Available online: https://link.springer.com/article/10.1007/s43762-021-00008-9 (accessed on 9 November 2024).
- DeClercq, Caitlin, Mohammad Gharipour, Salman Mohagheghi, Andrew Tot Bui, Naomi Wong Hemme, and Eric Johnson. “A Novel Approach to Locating Community Clinics to Promote Health Care Accessibility and Reduce Health Disparities in Baltimore, Maryland.” Inquiry: A Journal of Medical Care Organization, Provision and Financing 60 (May 13, 2023): 00469580221135953. [CrossRef]
- “How AI Is Being Used to Respond to Natural Disasters in Cities | TIME.”. Available online: https://time.com/7171445/ai-natural-disaster-cities/?utm_source=chatgpt.com (accessed on 9 November 2024).
- Hudson-Smith, Andrew, Duncan Wilson, Steven Gray, and Oliver Dawkins. “Urban IoT: Advances, Challenges, and Opportunities for Mass Data Collection, Analysis, and Visualization.” In Urban Informatics, edited by Wenzhong Shi, Michael F. Goodchild, Michael Batty, Mei-Po Kwan, and Anshu Zhang, 701–19. Singapore: Springer, 2021. [CrossRef]
- Jordahl, Kelsey, Joris Van Den Bossche, Martin Fleischmann, Jacob Wasserman, James McBride, Jeffrey Gerard, Jeff Tratner, et al. “Geopandas/Geopandas: V0.8.1.” Zenodo, July 15, 2020. [CrossRef]
- Lehmann, Steffen. “Sustainable Urbanism: Towards a Framework for Quality and Optimal Density?” Future Cities and Environment 2, no. 1 (August 5, 2016): 8. [CrossRef]
- Mayor Brandon M. Scott. “Mayor Scott, BCIT Release Five-Year Plan to Address the City’s Digital Divide,”. Available online: https://mayor.baltimorecity.gov/news/press-releases/2023-12-13-mayor-scott-bcit-release-five-year-plan-address-citys-digital-divide (accessed on 13 December 2023).
- Meerow, Sara, Pani Pajouhesh, and Thaddeus R. Miller. “Social Equity in Urban Resilience Planning.” Local Environment 24, no. 9 (September 2, 2019): 793–808. [CrossRef]
- Motlagh, Naser Hossein, Martha Arbayani Zaidan, Roberto Morabito, Petteri Nurmi, and Sasu Tarkoma. “Towards Large-Scale IoT Deployments in Smart Cities: Requirements and Challenges.” In Learning Techniques for the Internet of Things, edited by Praveen Kumar Donta, Abhishek Hazra, and Lauri Lovén, 105–29. Cham: Springer Nature Switzerland, 2024. [CrossRef]
- “New AI Traffic Lights Being Tested Give Priority to Cyclists over Cars in Hope to ‘encourage More People to Cycle’ | The Irish Sun.”. Available online: https://www.thesun.ie/motors/13799094/ai-traffic-lights-stop-cars-cyclists/?utm_source=chatgpt.com (accessed on 9 November 2024).
- “New Report from Johns Hopkins Finds Stark Transit Inequity in Baltimore | Hub.”. Available online: https://hub.jhu.edu/2021/10/07/transit-inequity-baltimore/ (accessed on 13 November 2024).
- “Pandas - Python Data Analysis Library.”. Available online: https://pandas.pydata.org/about/citing.html (accessed on 13 November 2024).
- “(PDF) The Role of IoT in Transforming Smart Cities: Enhancing Urban Infrastructure and Sustainability Through Technology.”. Available online: https://www.researchgate.net/publication/384285980_The_Role_of_IoT_in_Transforming_Smart_Cities_Enhancing_Urban_Infrastructure_and_Sustainability_Through_Technology (accessed on 18 November 2024).
- Piri, Soroush. “Smart Infrastructure Integration for Enhanced Urban Resilience: A Transdisciplinary Approach.” SSRN Scholarly Paper. Rochester, NY: Social Science Research Network, April 29, 2024. [CrossRef]
- ResearchGate. “(PDF) Building Engaged Communities—A Collaborative Leadership Approach.”. Available online: https://www.researchgate.net/publication/328948672_Building_Engaged_Communities-A_Collaborative_Leadership_Approach (accessed on 18 November 2024).
- ResearchGate. “(PDF) Evaluating the Impact of Community Engagement in Urban Planning on Sustainable Development.”. Available online: https://www.researchgate.net/publication/376995168_Evaluating_the_impact_of_community_engagement_in_urban_planning_on_sustainable_development (accessed on 18 November 2024).
- ResearchGate. “(PDF) IoT-Driven Smart Cities: Enhancing Urban Sustainability and Quality of Life.”. Available online: https://www.researchgate.net/publication/374090800_IoT-Driven_Smart_Cities_Enhancing_Urban_Sustainability_and_Quality_of_Life (accessed on 18 November 2024).
- ResearchGate. “(PDF) Up-Zoning New York City’s Mixed-Use Neighborhoods: Property-Led Economic Development and the Anatomy of a Planning Dilemma.”. Available online: https://www.researchgate.net/publication/249694367_Up-Zoning_New_York_City%27s_Mixed-Use_Neighborhoods_Property-Led_Economic_Development_and_the_Anatomy_of_a_Planning_Dilemma (accessed on 18 November 2024).
- “Sklearn.Preprocessing.MinMaxScaler — Scikit-Learn 0.15-Git Documentation.”. Available online: https://scikit-learn.org/0.15/modules/generated/sklearn.preprocessing.MinMaxScaler.html (accessed on 13 November 2024).
- “Smart City Integration: How IoT Is Reducing Emergency Response Times and Saving Lives - IEEE Public Safety Technology Initiative.”. Available online: https://publicsafety.ieee.org/topics/smart-city-integration-how-iot-is-reducing-emergency-response-times-and-saving-lives (accessed on 9 November 2024).
- “Technological Innovations for Enhancing Disaster Resilience in Smart Cities: A Comprehensive Urban Scholar’s Analysis.”. Available online: https://www.mdpi.com/2071-1050/15/15/12036 (accessed on 9 November 2024).
- Telnyx. “IoT for Monitoring Traffic Tackles Urban Traffic Issues.”. Available online: https://telnyx.com/resources/iot-monitoring-traffic (accessed on 9 November 2024).
- The Abell Foundation. “Drilling Down in Baltimore’s Neighborhoods.”. Available online: https://abell.org/publication/drilling-down/ (accessed on 13 November 2024).
- Theodos, Brett, Eric Hangen, Brady Meixell, and Lionel Foster. “Neighborhood Investment Flows in Baltimore: With a Case Study on the East Baltimore Development Initiative.” Urban Institute, September 29, 2020. Available online: https://www.urban.org/research/publication/neighborhood-investment-flows-baltimore-case-study-east-baltimore-development-initiative.
- Waskom, Michael. “Seaborn: Statistical Data Visualization.” Journal of Open Source Software 6, no. 60 (April 6, 2021): 3021. [CrossRef]
- “What Is Artificial Intelligence (AI)? | IBM,”. Available online: https://www.ibm.com/topics/artificial-intelligence (accessed on 9 August 2024).
- “What Is the Internet of Things (IoT)? | IBM.”. Available online: https://www.ibm.com/topics/internet-of-things (accessed on 13 November 2024).
Disclaimer/Publisher’s Note: The statements, opinions and data contained in all publications are solely those of the individual author(s) and contributor(s) and not of MDPI and/or the editor(s). MDPI and/or the editor(s) disclaim responsibility for any injury to people or property resulting from any ideas, methods, instructions or products referred to in the content. |
© 2024 by the authors. Licensee MDPI, Basel, Switzerland. This article is an open access article distributed under the terms and conditions of the Creative Commons Attribution (CC BY) license (http://creativecommons.org/licenses/by/4.0/).


