
Submitted:
22 November 2024
Posted:
25 November 2024
Read the latest preprint version here
Abstract
By analyzing Gurzadyan and Penrose’s anisotropic distribution of concentric low-variance circles with the Planck Collaboration’s large-scale temperature maxima and minima in the CMB, we propose a mechanism initiating the Big Bang: the Universe emerged from the collapse of the densest object in a previous-aeon black hole. While the object collapsed into the Big Bang singularity with minimum entropy, the entropy of the host black hole kept increasing. Thus the Second Law of thermodynamics has never been violated. Where the collapse occurred, or the Center of this Universe, would be at about 0.67 times the radius of the surface of last scattering (currently ca. 30 billion light years) away from us and around Galactic coordinates (l,b)=(279°,-47°). Our results are supported by independent observations of cosmic inhomogeneities and spatial anisotropies.
Keywords:
cosmology
; cosmic background radiation — early Universe
To support Penrose’s conformal cyclic cosmology (CCC) [1,2], Gurzadyan and Penrose presented a map of temperature low-variance circles (LVCs) based on the cosmic microwave background (CMB) data [2,3,4]. From the WMAP data, they found a large, higher-temperature LVC region X concentrated around , and a small, lower-temperature region Y around (ref. [3]). When updating their search on the Planck data, they found two other large LVC regions. Since they did not name them, we assign names accordingly: the lower-temperature region Z concentrated at , and moderate-temperature region W at (refs. [2,4], Figure 1).
The LVCs have been interpreted to arise from previous-aeon supermassive black-hole encounters [2,3,4], but CCC does not predict the location of the LVCs. In this work, we postulate a new crossover between aeons, with which the anisotropic distribution of the LVC regions and many other astronomical observations can be explained.
Postulated Mechanism
In CCC, the crossover between aeons is future null infinity [1,2] . This work, instead, assumes that the crossover is the collapse of the densest object (DO). The DO would be incubated in the previous aeon: all the falling objects would be in a process of being immobilized as the densest matter, making the DO constantly grow. Once its mass exceeded a limit, the DO would collapse. Because it had already been the most dense, the only possible product of the collapse would be an infinitesimal pure energy point, i.e. the Big Bang singularity, from which this Universe was created. The DO or Big Bang singularity would be the Center of the Universe.
The densest objects that can be directly observed are neutron stars. For a spinning neutron star, there is an equatorial plane, perpendicular to its axis of spin. Objects fall towards the spinning star in spirals. The star emits twin emission beams (along its magnetic axis) symmetric about the star. If the emission beams misalign the axis of spin, then it is a pulsar. We further assume that the surroundings of the DO were analogous to those of a pulsar [5] (Figure 2).
Right after the collapse, the powerful isotropic Big Bang expansion wave VBB from the Big Bang singularity would collide with what had been surrounding the DO. Because the emission beams Vb of the DO had the same direction as VBB, compared to the curved spacetime (including dark matter) surrounding the DO, less collisions would occur, leading to twin lower-temperature trajectories symmetric about the Center. If the Center is within our observable universe, the trajectories intersecting with the surface of last scattering (SLS) would result in a pair of cold spots in the CMB sky. Simultaneously, since the falling spiral flows Vs of the DO had obtuse angles with VBB, their collisions would lead to higher-temperature spirals. The spirals intersecting with the SLS would lead to hot regions.
All the collisions, including those between Vb and VBB, would result in overdense clumps or debris in the primordial plasma. These clumps, comprised of dark matter, photons, and baryonic particles, as centers, would produce outward pressure. The outward pressure and inward gravity would create oscillations or spherical waves. By enhancing local mass and heat transfer, the oscillations, like smoothers, would lower temperature variance, leaving behind LVCs. Therefore, the LVCs would be arisen completely in this aeon (different from CCC [1,2,3,4]); the generation process would be very similar to baryon acoustic oscillations (BAO). As it was a dynamic process, the window to observe the LVC regions would be narrow: if formed too early, then LVCs would have dissipated; if too late, then LVCs would not have formed by the time of photon decoupling.
Center and Spin of the Universe
As discussed below, the Universe has some anisotropies and inhomogeneities. However, the magnitudes are very small; hence the SLS approximates to a sphere for the calculation of the coordinates of the Center in this work. As the Universe has geometric symmetries, the Center would always be at the intersection of the Vb beam line and the Vs plane (Figure 2). Since the ancient collision signals from the infant Universe have become vague: large in scale, small and noisy in intensity, we focus on large-scale signals.
As region Z is the only large region with lower temperatures, the beam line cannot be determined solely by the LVC signals. We therefore check the cold spots with maximum temperature depressions. Bennett et al. [6] were the first to find two cold spots in the CMB: Cold Spot I and Cold Spot II. By studying large-scale maxima and minima, the Planck Collaboration [7,8] confirmed both spots: -100 K at Peak 1 and -180 K at Peak 5 (another minimum, Peak 2, is not a typical cold spot, with merely -25 K depression at ). We label the cold spot at as the north cold spot (NC), corresponding to Cold Spot I and Peak 1, and the one at as the south cold spot (SC), corresponding to Cold Spot II and Peak 5.
Region X has higher temperatures, and region W has moderate temperatures (more obvious in Figure 31 in Penrose’s Nobel Lecture2), both corresponding to Vs. For region X, although part of it is within the excluded galactic plane region , it is obvious that the center is at its central void: (refs. [2,4]). The center of region W: is obtained by taking an average of the xyz-coordinates of its LVC points from figures in refs. [2,4].
Line XW almost intersects line NC-SC (the shortest distance between the lines is only 0.07), so the closest point on line NC-SC can be approximated to be the Center at and a distance away, where is the radius of the SLS. More accurately, the Vs plane can be determined by adding a region with maximum temperature elevation: the Planck Collaboration’s Peak 3 concentrated at (from figures in refs. [7,8]). The obtained Vs plane (Figure 3) would be:
Therefore, the intersection (Figure 3) of line NC-SC and the Vs plane, or the Center, would be at and at a distance (currently 9.3 Gpc or 30 billion light years away, because , ref. [9]).
It is vital to note that region X has a small cold part near , facing the cold end of region W (refs. [2,4]). These lower-temperature (rotating away from us) signals, versus the higher-temperature (rotating towards us) signals on the opposite half of the Vs plane (more details below), indicate that the Universe would spin. If we look from where we are, i.e. the Local Supercluster (LS), to the Center, the Universe would spin clockwise. The axis of spin would be:
Interpretation of Gurzadyan and Penrose’s LVC Map and the Planck Collaboration’s Large-Scale Extrema
For convenience, we define a Universal Coordinate System: the Center is chosen as the origin, the Vs plane as the Universal equatorial plane, the LS at zero degrees longitude, the direction of spin as the direction of longitude increase, and the radius of the SLS as the unit length. For example, the angle between the equatorial plane and the line through the LS and the Center is ca. , so our Universal longitude, latitude, and radius: (Figure 4a).
Whereas one third of the Universal equator is within the excluded region, region X concentrated at and region W at on the visible equator are on the opposite sides of the Center (Figure 3). Incredibly, the hot part (rotating towards us) of region X (Figure S1a) and the cold part (rotating away from us, Figure S1b) are clearly divided by the plane: . This alignment among the dividing plane, the axis of spin, and the LS directly proves our mechanism (Figure S1). Also, because of the rotation, on the equator from region X to W (along the direction of rotation), hot LVCs (such as region U, Figure 1) dominate, while on the equator from region W to X, most of the observed LVCs are cold.
It is remarkable to note that region Z concentrated at has the same Universal latitude as does NC at , and that the main body of region Z has lower-temperature LVCs (Figure S2). Our mechanism thus has another crucial piece of evidence: region Z would be generated by the northern Vb.
Besides the above major signals, more details will be explained in the following, particularly for Figure 2 in ref. [4]. Since the DO spun, Vb would sweep its north space; the frontline of sweeping (only referring to LVCs) in region Z would be at (Figure S2). Hot spots seem to exist on both sides of the frontline, which would be attributed to the falling drops of Vb (in the curved spacetime). For a rotating system as shown in Figure 2, more centripetal Vb drops towards high latitudes were falling than the centrifuge Vb drops towards low latitudes, therefore more hot LVCs are observed on the side facing the axis of spin (Figure S2). In the middle of the frontline, things are different: any potential falling drops would have been pushed outward again by the outgoing Vb as it was sweeping, hence fewer hot spots (Figure S2).
As Vb swept, a dynamic cold cone (strictly speaking, a truncated cone, because Vb was no longer emitted after the DO collapsed) would exist in the northern Universe, with the Center as the (extrapolated) apex and as the cone angle. A low number-density, higher-temperature region V (Figure 1) would be attributed to the falling drops of the outgone Vb. Like the centripetal hot spots in region Z, even more hot spots migrate to higher latitudes in region V (Figure S2). Region Y might also be at the enlarged edge of the cone (Figure 1). As NC represents the frontline of the absolute temperature, the sweeping would be in this order: (Figure S2). On and inside the cone (roughly region T, Figure 1), LVCs other than regions Z, V, and Y are rare. Outside the cone, many individual LVCs exist, mainly due to Vb drops falling towards the equatorial plane through different trajectories with fluctuations (regions R1, R2 and R3, Figure 1). However, in the sky nearly opposite to the Center and its leeward side (roughly region Q, including the furthest point F and the following region, Figure 1), the number densities are very low, because a) the falling drops of Vb would be widely spread and the density would drop quickly: , as this was the furthest CMB sky from the Center (); b) Geometrically, Vb drops would fall into this region of the CMB sky with smaller angles of impact (versus region R1).
In the BAO-like process, the smaller the distance to the Center, the earlier the collision with VBB, the earlier the LVCs formed, and the sooner the LVCs dissipated. To be observed, LVC regions would have to be formed at a specific moment, or equivalently, at a specific distance to the Center. This is true: regions Z , V and W have almost the same distance, about , to the Center. A geometric analysis does show that there would be three and only three large LVC regions across the sky:
The exception is region X. Because of its short distance to the Center: , Vs would have a much stronger collision with VBB and much higher mass-energy densities than any other regions. With high densities, while expanding away from their centers, some outgoing mass-energy would be attracted back to the centers by the inward gravity (as the BAO process), and then be re-expanded (according to Bodnia et al. [10], the most pronounced hot spot at is responsible for all the LVCs in region X). In this way, region X would last longer.
One might wonder why there are no large LVC regions in the southern Universe, given the fact that Vb was also emitted to the south. The reason is the same: the south CMB sky would be too close to the Center. VBB would collide with the tail of the outgoing Vb at SC (almost the furthest in the south CMB sky): . However, since they were formed too early, LVCs would have already been dissipated (for comparison, region Z at ). According to another Planck Collaboration, SC does have two widely apart low-variance angular radii of and (from Figure 26 in ref. [11]). Therefore, it barely missed the criteria [3,4] of “at least 3 low-variance rings” “up to around ”. The falling drops arrived at the SLS later than Vb, hence LVCs were formed later and are observed, such as hot region P (Figure 1), corresponding to Peak 4 (refs. [7,8]).
Note that the equatorial plane, as it was hotter (Peak 3, refs. [7,8]), would still be somewhat opaque right after photon decoupling. Therefore, the signals from the southern Universe, if they originated close to the equator, would have to immediately pass through the thick equatorial plane, and hence appear to have lower temperatures. This would be why region O, extending along the south edge of the equator (the distance to the edge was less than 3.8 Mpc), has many cold LVCs (Figure 1), and why Peak 2 is atypical (refs. [7,8]).
In short, Gurzadyan and Penrose’s LVC map [2,4], as well as the Planck Collaboration’s large-scale temperature extrema [7,8], has been explained by our mechanism in detail. Because of the existence of region Z at , Vb would be emitted in straight lines much further than SC at and NC at ; hence the obtained coordinates of the Center are reasonable.
Independent Observational Evidence
Our mechanism does not provide any massive structures at the Center after the Big Bang (for comparison, before the Big Bang there was a massive DO). With the centripetal force requirement, the spinning Universe would have been expanding faster along the rotationally radial direction and slower along the axis of spin. Thus the Universe would have been veering towards the ellipsoidal (Figure 4a). This deformation would change our observable universe accordingly. Campanelli et al. suspected that the SLS is ellipsoidal [12]. Strictly speaking, the observable universe would not be ellipsoidal, because it does not have orthogonal axes as the Universe does or, equivalently, the LS is not on the equatorial plane. As the size of the Universe is unknown (the lowermost would be ), the exact direction of the fastest or slowest expansion is unknown. However, if the Hubble flow were removed, while always in the northern Universe, the LS would move closer to the equatorial plane. Therefore, approximately, the fastest expansion direction (FED) of the observable universe would be close to the outward rotationally radial direction, skewing towards the Universal equatorial plane, and the slowest expansion direction (SED) would be close to the inward rotationally radial direction , skewing north, away from the rotational plane: (Figure 4a).
This preferred direction is confirmed by multiple astronomical observations [13,14,15,16,17,18,19,20,21,22,23]. Probably because the magnitudes of those anisotropies are very small (, except for the local Universe, Table S1), the observed directions are scattering (Figs. 4b and 4c). With such small anisotropies, the obtained coordinates of the Center are currently unnecessary to correct. Other than the fine-structure constant dipole [13,14] that is generally attributed to a different mechanism [24,25], slower expansion in the SED appears as lower accelerating expansion (dark energy dipole [14]), brighter Type Ia supernovae (SNe Ia dipole [15]), smaller Hubble constant (galaxy cluster anisotropy [16]), or mutually approaching flows of galaxies (such as bulk flows [17,18,19,20]). With the understanding that those anisotropies share the same mechanism, we can convert from one to another (Table S1).
Although the masses of all the flows and beams were negligible compared to that of the DO or VBB, collision clumps discussed above would function as primordial nucleation centers (new fallings after the Big Bang would not be excluded), much earlier and more mature than what the traditional theory of structure formation predicts. Our mechanism would thus explain multiple extraordinary astronomical facts, such as an unexpectedly large number [26] of unexpectedly mature [26] and unexpectedly bright [27] galaxies observed by the JWST with unexpectedly high mass [28,29] formed at an unexpectedly short time [26], as well as the extraordinarily large cosmic structures (such as Ho’oleilana [30]) and black holes (candidates [31]: Phoenix A and 4C+74.13, etc.).
Comparison to CCC
Because of its enormously large mass (considering the observable universe, ), the DO, and all the flows and beams discussed above, must be within a previous-aeon black hole (more specifically, within its inner horizon, see Supplementary Material). As we know, black holes have maximum entropy, while the Big Bang singularity has minimum entropy. It seems obvious that an evolution from a black hole to the Big Bang singularity immensely violates the Second Law of thermodynamics. Penrose therefore chose the ultimate hypersurface to be the crossover in CCC [1,2].
In our mechanism, the precursor DO, excluding all the flows and beams, did collapse into the Big Bang singularity with minimum entropy. However, the DO was absolutely not an isolated system, as the mass-energy flows and beams would continuously be falling into and emitting from it. On the other hand, the collapse and the resulting Big Bang occurred completely within the host black hole. From the exterior point of view, it was always a normal black hole; its entropy kept increasing as the mass increased: . Therefore, even if the host black hole is considered as an isolated system, the Second Law is still sustained.
Conclusions
The Universe emerged from the collapse of the densest object in a previous-aeon black hole. The anisotropic distribution of LVCs supports this mechanism in detail. The coordinates of the Center obtained in this work are virtually the same as those purely from the absolute temperatures [32]. Nature would exist before the Big Bang (in time) and outside this Universe (in space) (Figure 5).
Supplementary Materials
The following supporting information can be downloaded at the website of this paper posted on Preprints.org.
Data Availability Statement
All results in this work are obtained using publicly available data.
Acknowledgments
J.B.B. would like to thank Profs. Z. Shen, K. Yao, X. Jiang, F. Bo, Y. Cheng, S. Han, G. Chen, and Q. Yu at Zhejiang University for their inspiration. N.P.B. would like to dedicate this work to his grandparents in China.
Conflicts of Interest
The authors declare no competing interests.
References
- Penrose, R. Cycles of time: an extraordinary new view of the universe (Bodley Head, London, 2010).
- Penrose, R. Black holes, cosmology and space-time singularities. Nobel Lecture, Dec. 8, 2020. https://www.nobelprize.org/uploads/2024/02/penrose-lecture.pdf.
- Gurzadyan, V. G. & Penrose, R. On CCC-predicted concentric low-variance circles in the CMB sky. Eur. Phys. J. Plus. 2013, 128, 22. [Google Scholar]
- Gurzadyan, V. G. & Penrose, R. CCC and the Fermi paradox. Eur. Phys. J. Plus. 2016, 131, 11. [Google Scholar]
- The Rapid Burster. https://images.nasa.gov/details-PIA21418.
- Bennett, C. L.; et al. Seven-year Wilkinson Microwave Anisotropy Probe (WMAP) observations: are there cosmic microwave background anomalies? Astrophys. J. Supp. Ser. 2001, 192, 17. [Google Scholar] [CrossRef]
- Planck Collaboration: Akrami, Y.; et al. Planck 2018 results. VII. Isotropy and Statistics of the CMB. Astron. Astrophys. 2020, 641, A7. [Google Scholar] [CrossRef]
- Marcos-Caballero, A. The Cosmic Microwave Background radiation at large scales and the peak theory. Univ. Cantabria Thesis ( 2017.
- Gott III, J. R.; et al. A map of the universe. Astrophys. J. 2005, 624, 463–484. [Google Scholar] [CrossRef]
- Bodnia, E.; et al. The quest for CMB signatures of conformal cyclic cosmology. J. Cosmol. Astropart. Phys. 2024, 05, 009. [Google Scholar] [CrossRef]
- Planck Collaboration: Ade, P. A. R.; et al. Planck 2015 results. XVI. Isotropy and statistics of the CMB. Astron. Astrophys. 2016, 594, A16. [Google Scholar] [CrossRef]
- Campanelli, L. , Cea, P. & Tedesco, L. Ellipsoidal universe can solve the CMB quadrupole problem. Phys. Rev. Lett. 2006, 97, 131302. [Google Scholar]
- King, J. A.; et al. Spatial variation in the fine-structure constant – new results from VLT/UVES. Mon. Not. R. Astron. Soc. 2012, 422, 3370–3414. [Google Scholar] [CrossRef]
- Mariano, A. & Perivolaropoulos, L. Is there correlation between fine structure and dark energy cosmic dipoles? Phys. Rev. D 2012, 86, 083517. [Google Scholar]
- Chang, Z. & Lin, H.-N. Comparison between hemisphere comparison method and dipole-fitting method in tracing the anisotropic expansion of the Universe use the Union2 data set. Mon. Not. R. Astron. Soc. 2015, 446, 2952–2958. [Google Scholar]
- Migkas, K.; et al. Cosmological implications of the anisotropy of ten galaxy cluster scaling relations. Astro. Astrophys. 2021, 649, A151. [Google Scholar] [CrossRef]
- Hudson, M. J.; et al. A large-scale bulk flow of galaxy clusters. Astrophys. J. 1999, 512, L79. [Google Scholar] [CrossRef]
- Kashlinsky, A.; et al. A measurement of large-scale peculiar velocities of clusters of galaxies: technical details. Astrophys. J. 2009, 691, 1479–1493. [Google Scholar] [CrossRef]
- Feldman, H. A. , Watkins, R. & Hudson, M. J. Cosmic flows on 100 h−1 Mpc scales: standardized minimum variance bulk flow, shear and octupole moments. Mon. Not. R. Astron. Soc. 2010, 407, 2328–2338. [Google Scholar]
- Turnbull, S. J.; et al. Cosmic flows in the nearby universe from Type Ia supernovae. Mon. Not. R. Astron. Soc. 2012, 420, 447–454. [Google Scholar] [CrossRef]
- Abdalla, E.; et al. Cosmology intertwined: A review of the particle physics, astrophysics, and cosmology associated with the cosmological tensions and anomalies. J. High Energy Astrophys. 2022, 34, 49–211. [Google Scholar]
- Perivolaropoulos, L. & Skara. F. Challenges for ΛCDM: An update. New Astron. Rev. 2022, 95, 101659. [Google Scholar]
- Aluri, P. K.; et al. Is the Observable Universe Consistent with the Cosmological Principle? Class. Quantum Grav. 2023, 40, 094001. [Google Scholar] [CrossRef]
- Davies, P. C. W. , Davis, T. M. & Lineweaver, C. H., Black holes constrain varying constants. Nature 2003, 418, 602–603. [Google Scholar]
- Carlip, S. & Vaidya, S. Do black holes constrain varying constants? Nature 2003, 421, 498. [Google Scholar] [PubMed]
- Witze, A. Four revelations from the Webb telescope about distant galaxies. Nature 2022, 608, 18–19. [Google Scholar] [CrossRef] [PubMed]
- Clery, D. Earliest galaxies found by JWST confound theory. Science 2023, 379, 1280–1281. [Google Scholar] [CrossRef] [PubMed]
- Labbé, I.; et al. A population of red candidate massive galaxies ~600 Myr after the Big Bang. Nature 2023, 616, 266–269. [Google Scholar] [CrossRef]
- Boylan-Kolchin, M. Stress testing ΛCDM with high-redshift galaxy candidates. Nat. Astron. 2023, 7, 731–735. [Google Scholar] [CrossRef]
- Tully, R. B. , Howlett, C. & Pomarède, D. Ho’oleilana: An individual baryon acoustic oscillation? Astrophys. J. 2023, 954, 169. [Google Scholar]
- List of most massive black holes. https://www.wikipedia.org/wiki/List_of_most_massive_black_holes.
- Bao, J.-B. & Bao, N. P. On the fundamental particles and reactions of Nature. Preprints, 2020; 2020120703 (2021). [Google Scholar] [CrossRef]
Figure 1.
A schematic diagram of the LVC regions in the CMB sky. Gurzadyan and Penrose’s LVC map is taken from ref. [4]. The LVC regions: grey; the Universal equator region: white; the direction of spin: grey arrows; NC and SC: CMB cold spots; N at and S at : the intersections of the axis of spin (equation 2) and the SLS; F: the furthest point from the Center: .
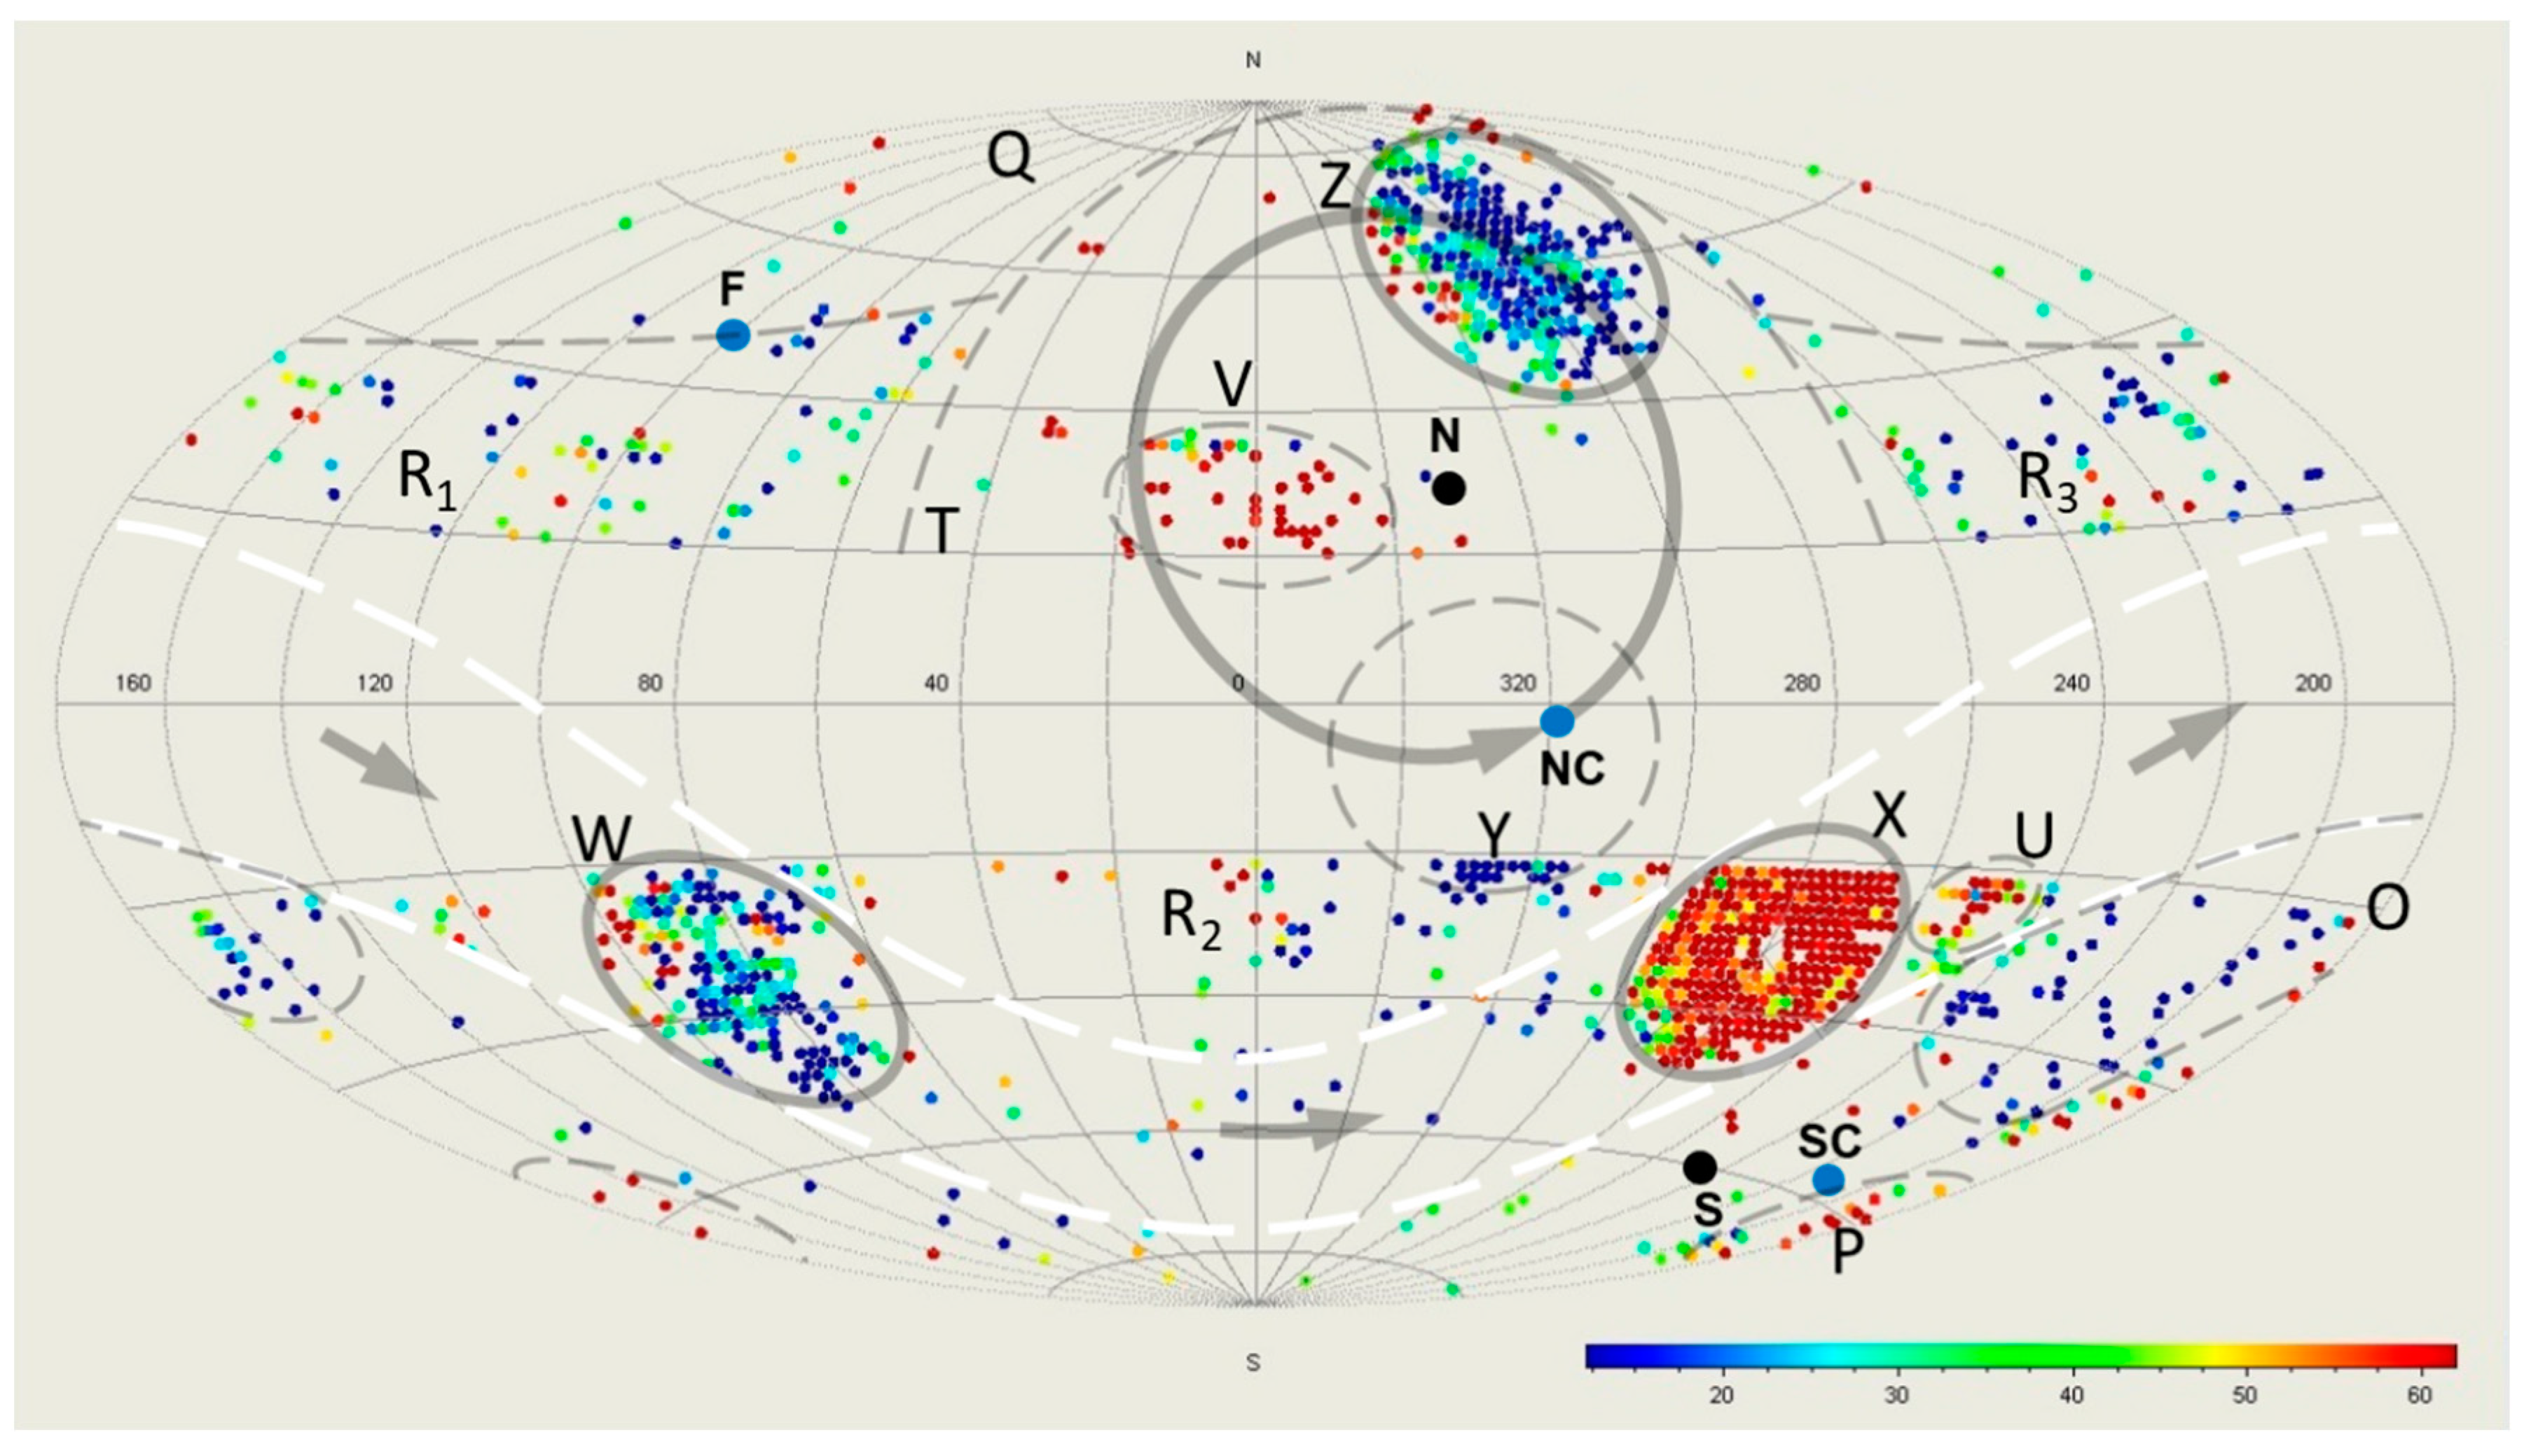
Figure 2.
A schematic diagram of the inner horizon of a rotating black hole. The eclipse (orange) is the inner horizon. The eclipse (red) represents the DO. The vertical line (black) is the axis of spin. The horizontal row of clumps (blue) represents the spiral flows Vs, going in on the left and coming out on the right. The slashed lines (dark red) are the emission beams Vb, developing symmetrically about the DO. The dashed curves (dark red) represent the scattered Vb and falling drops of Vb.
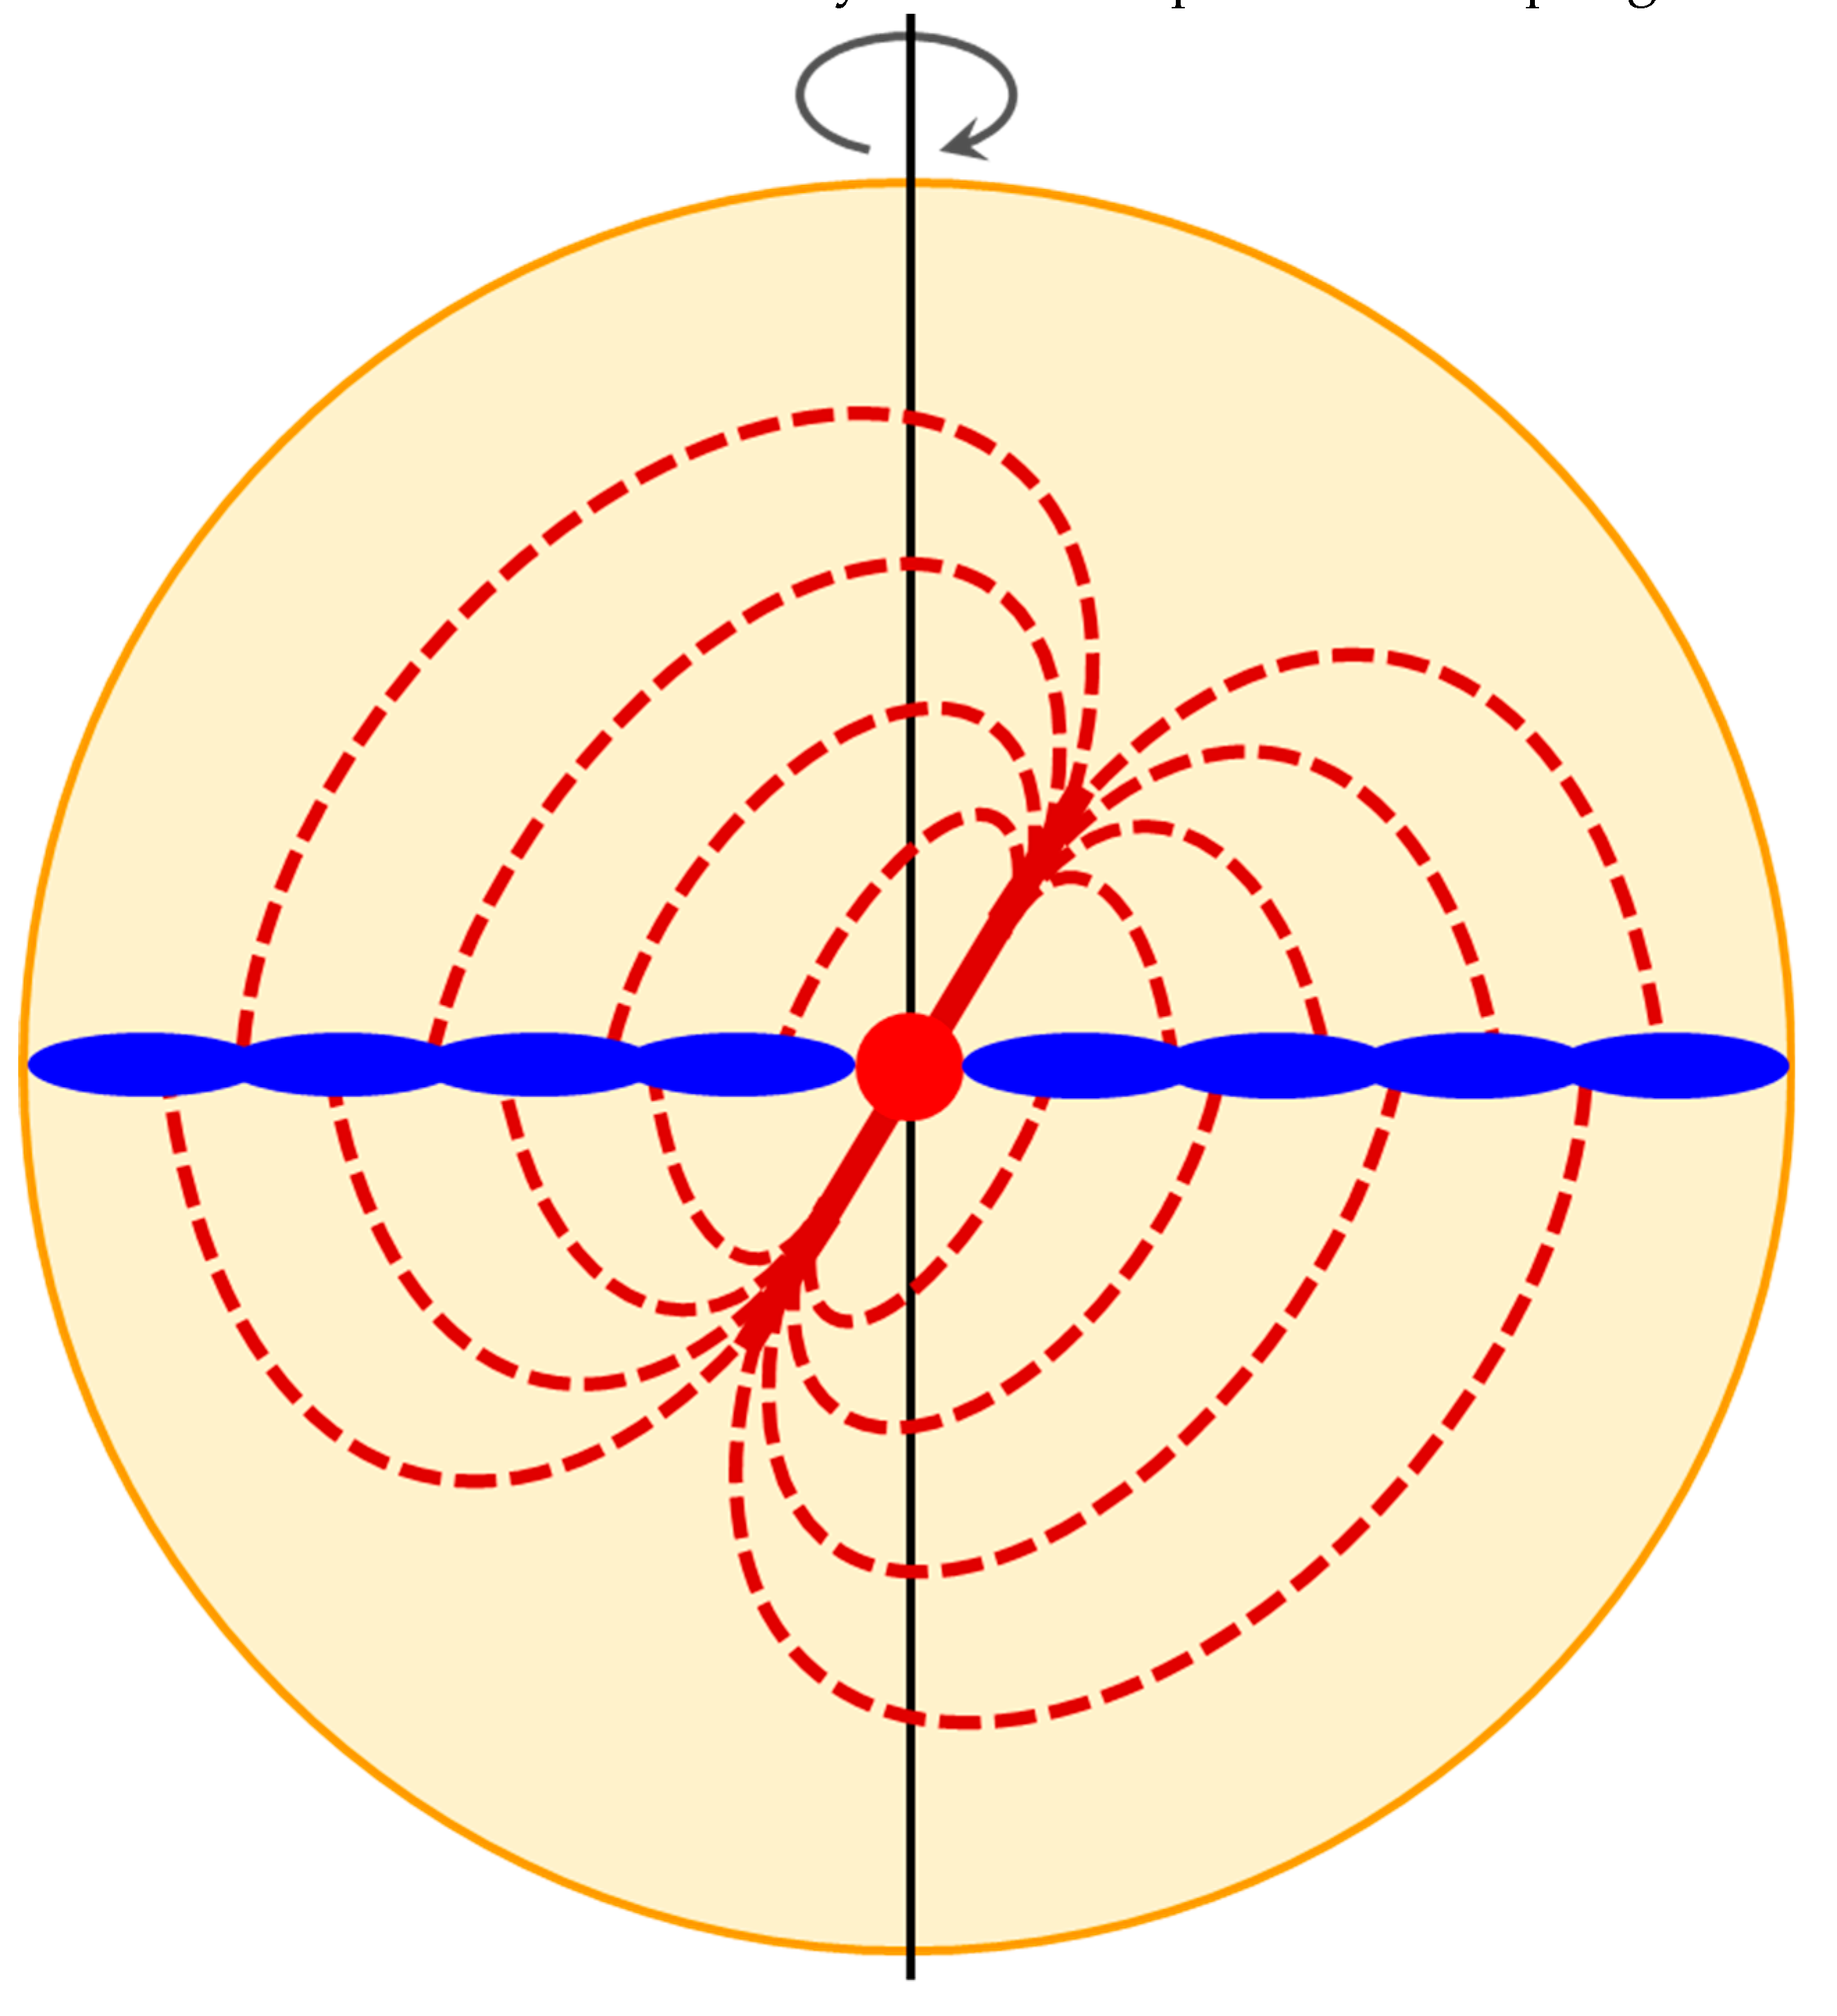
Figure 3.
The Center of the Universe: the intersection (red) of line NC-SC (blue) and the Vs plane (dark red) determined by region X, region W, and Peak 3. Other symbols: the LS (green) and 3D globe of the SLS (green).
Figure 3.
The Center of the Universe: the intersection (red) of line NC-SC (blue) and the Vs plane (dark red) determined by region X, region W, and Peak 3. Other symbols: the LS (green) and 3D globe of the SLS (green).
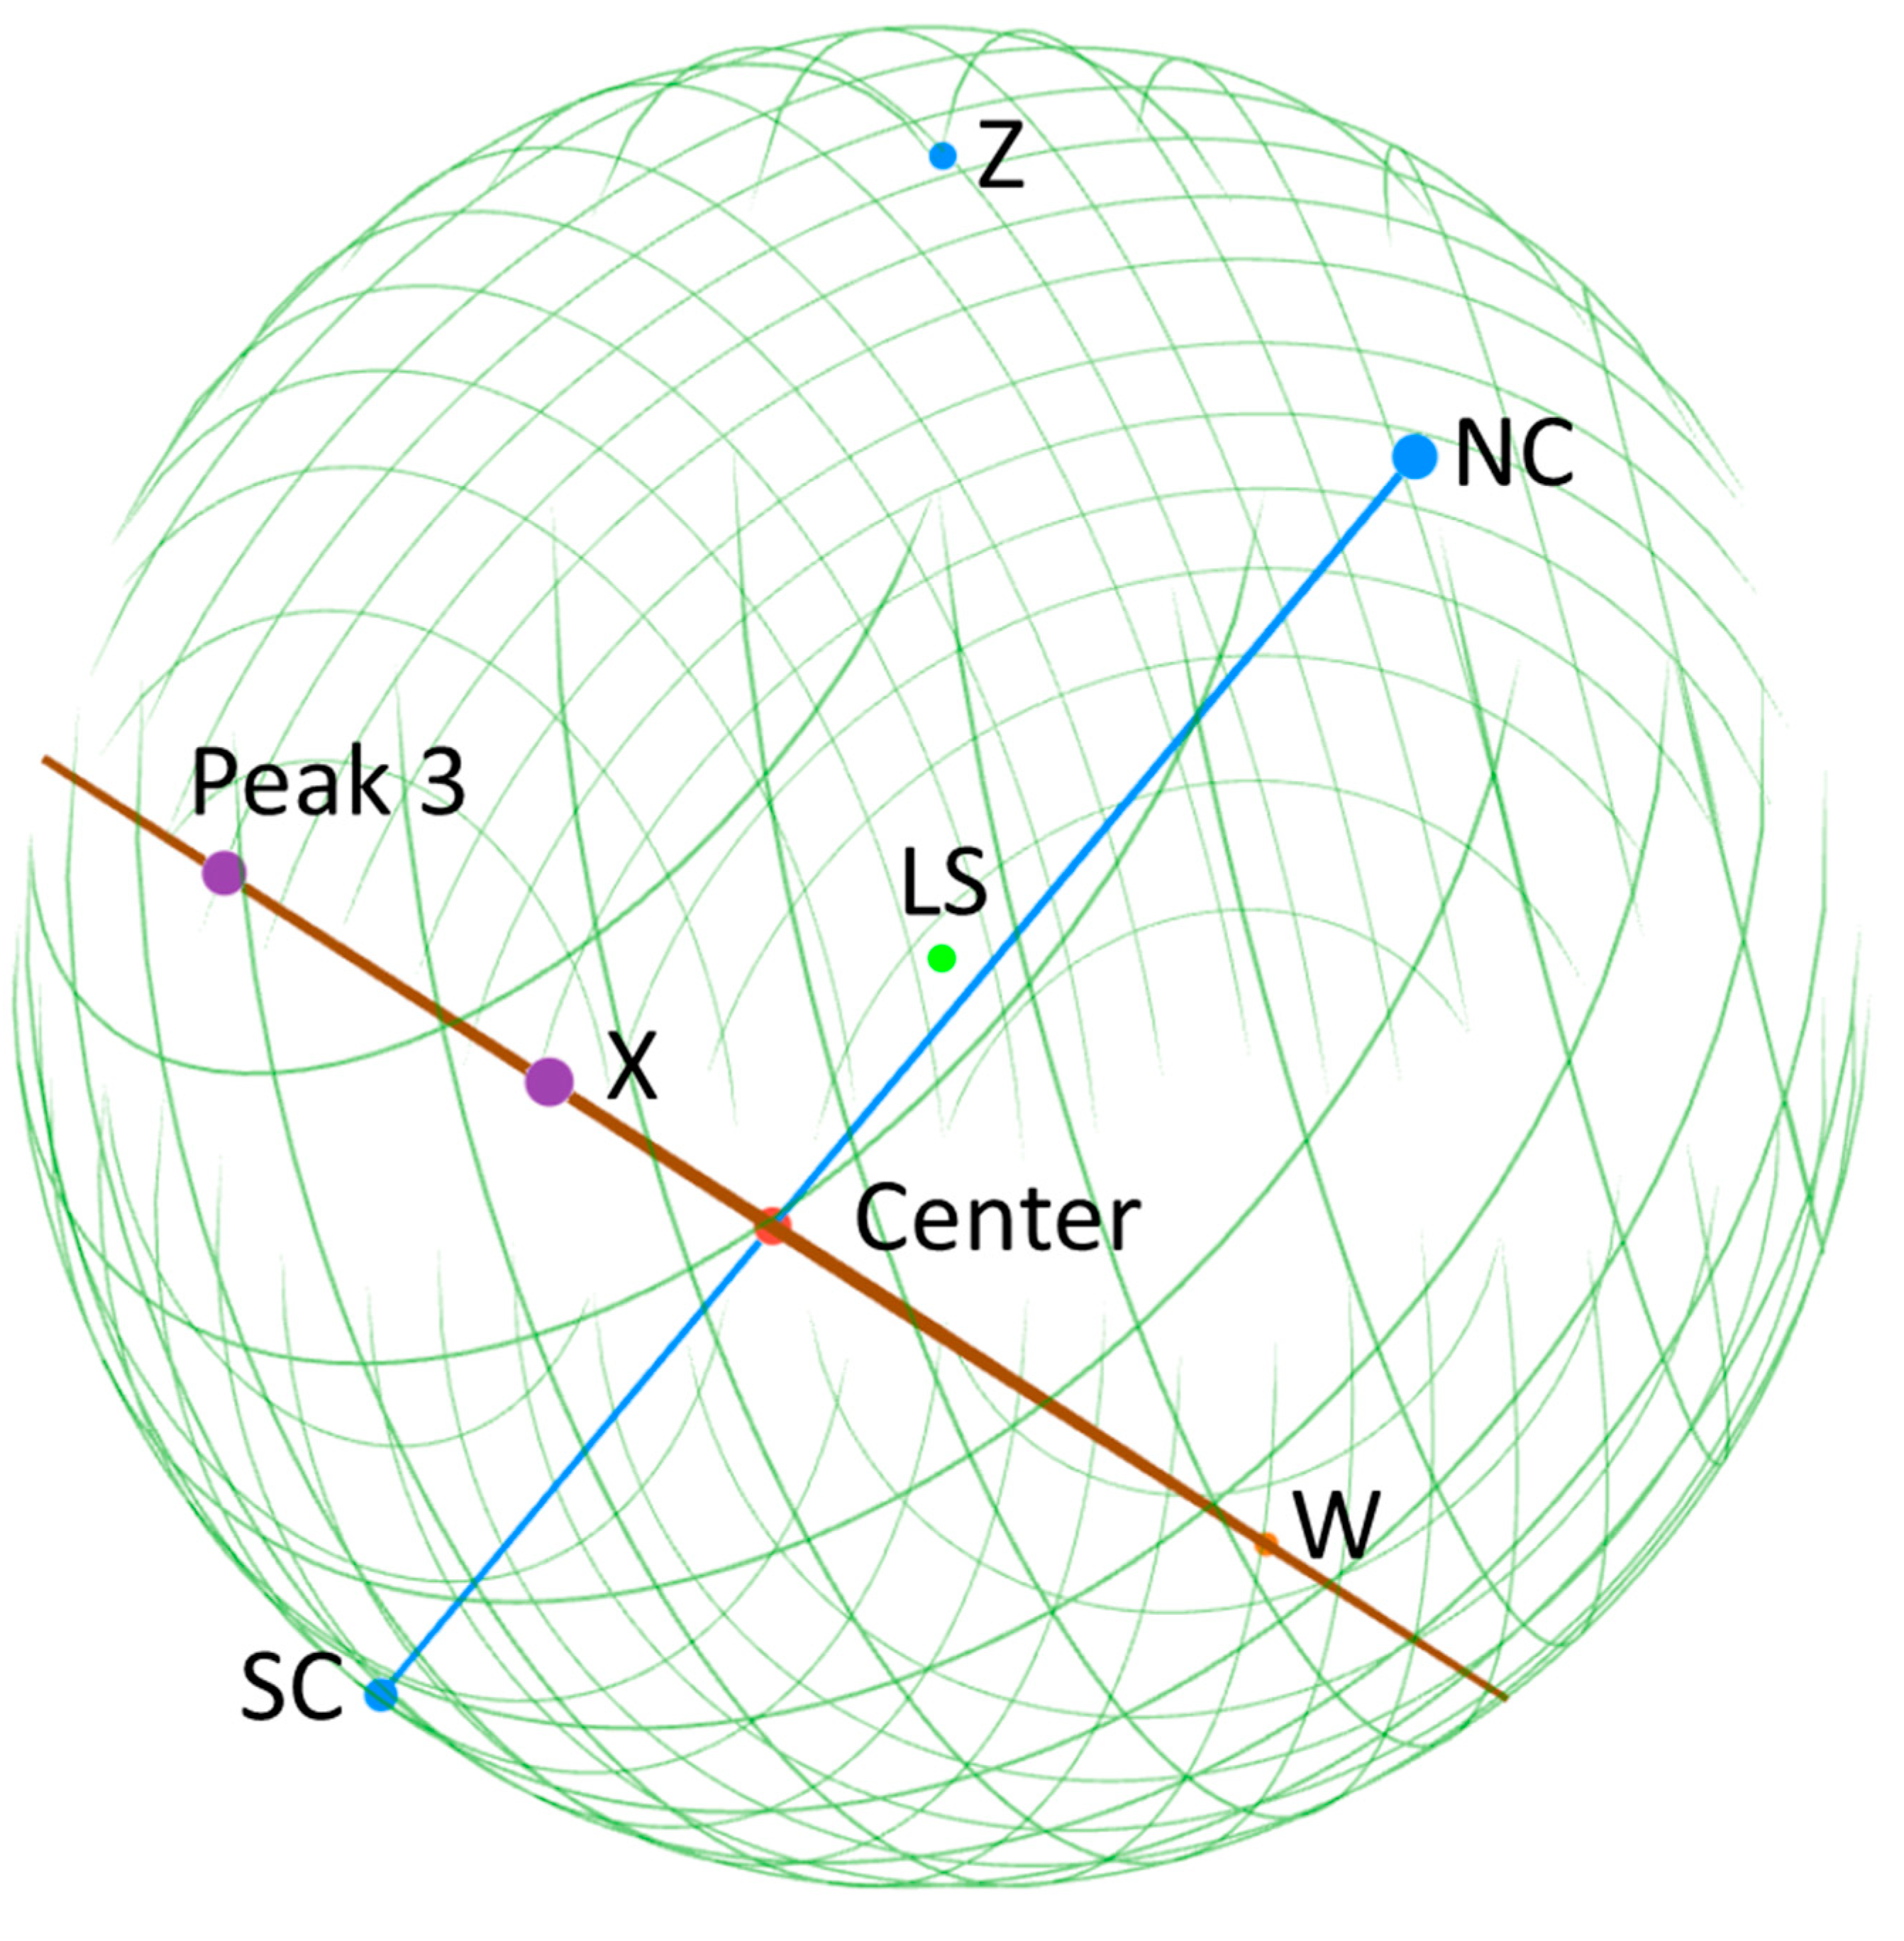
Figure 4.
Anisotropic Universe. a, A schematic picture for the Universe. The Universe was born from the Center (red dot) due to the collapse of one of the densest objects in the previous aeon. Because the precursor DO spun, the Universe is ellipsoidal (represented by a blue eclipse), relatively elongated (orange thick horizontal arrow) in the directions parallel to its equator () and relatively contracted (orange thick vertical arrow) in the direction parallel to its axis of spin (). Note that this figure is not to scale, in particular, the size and eccentricity of the Universe are unknown. The LS (green dot) is rotating about the axis of spin on the plane (dark red): , and moving towards the furthest equatorial plane (the direction of orange thin arrows). The fastest expansion direction is FED (blue), and the slowest expansion direction SED (red). The observable universe is nearly spherical (represented by a green eclipse), within which are: the equatorial plane (red line), and the axis of spin (black line, between N and S). Unit vectors of the observed SED: b, Side view, parallel to the equatorial plane; c, Top view, along the axis of spin. All vectors are plotted in length of the radius of SLS: CMB dipole (red), galaxy cluster anisotropy (blue), bulk flows (grey), Great Attractor (green), SNe Ia dipole (yellow), dark energy dipole (orange), fine-structure constant dipole (violet). The line (dark red) is the rotational plane of the LS (green); the other symbols are the same as in Figure 3.
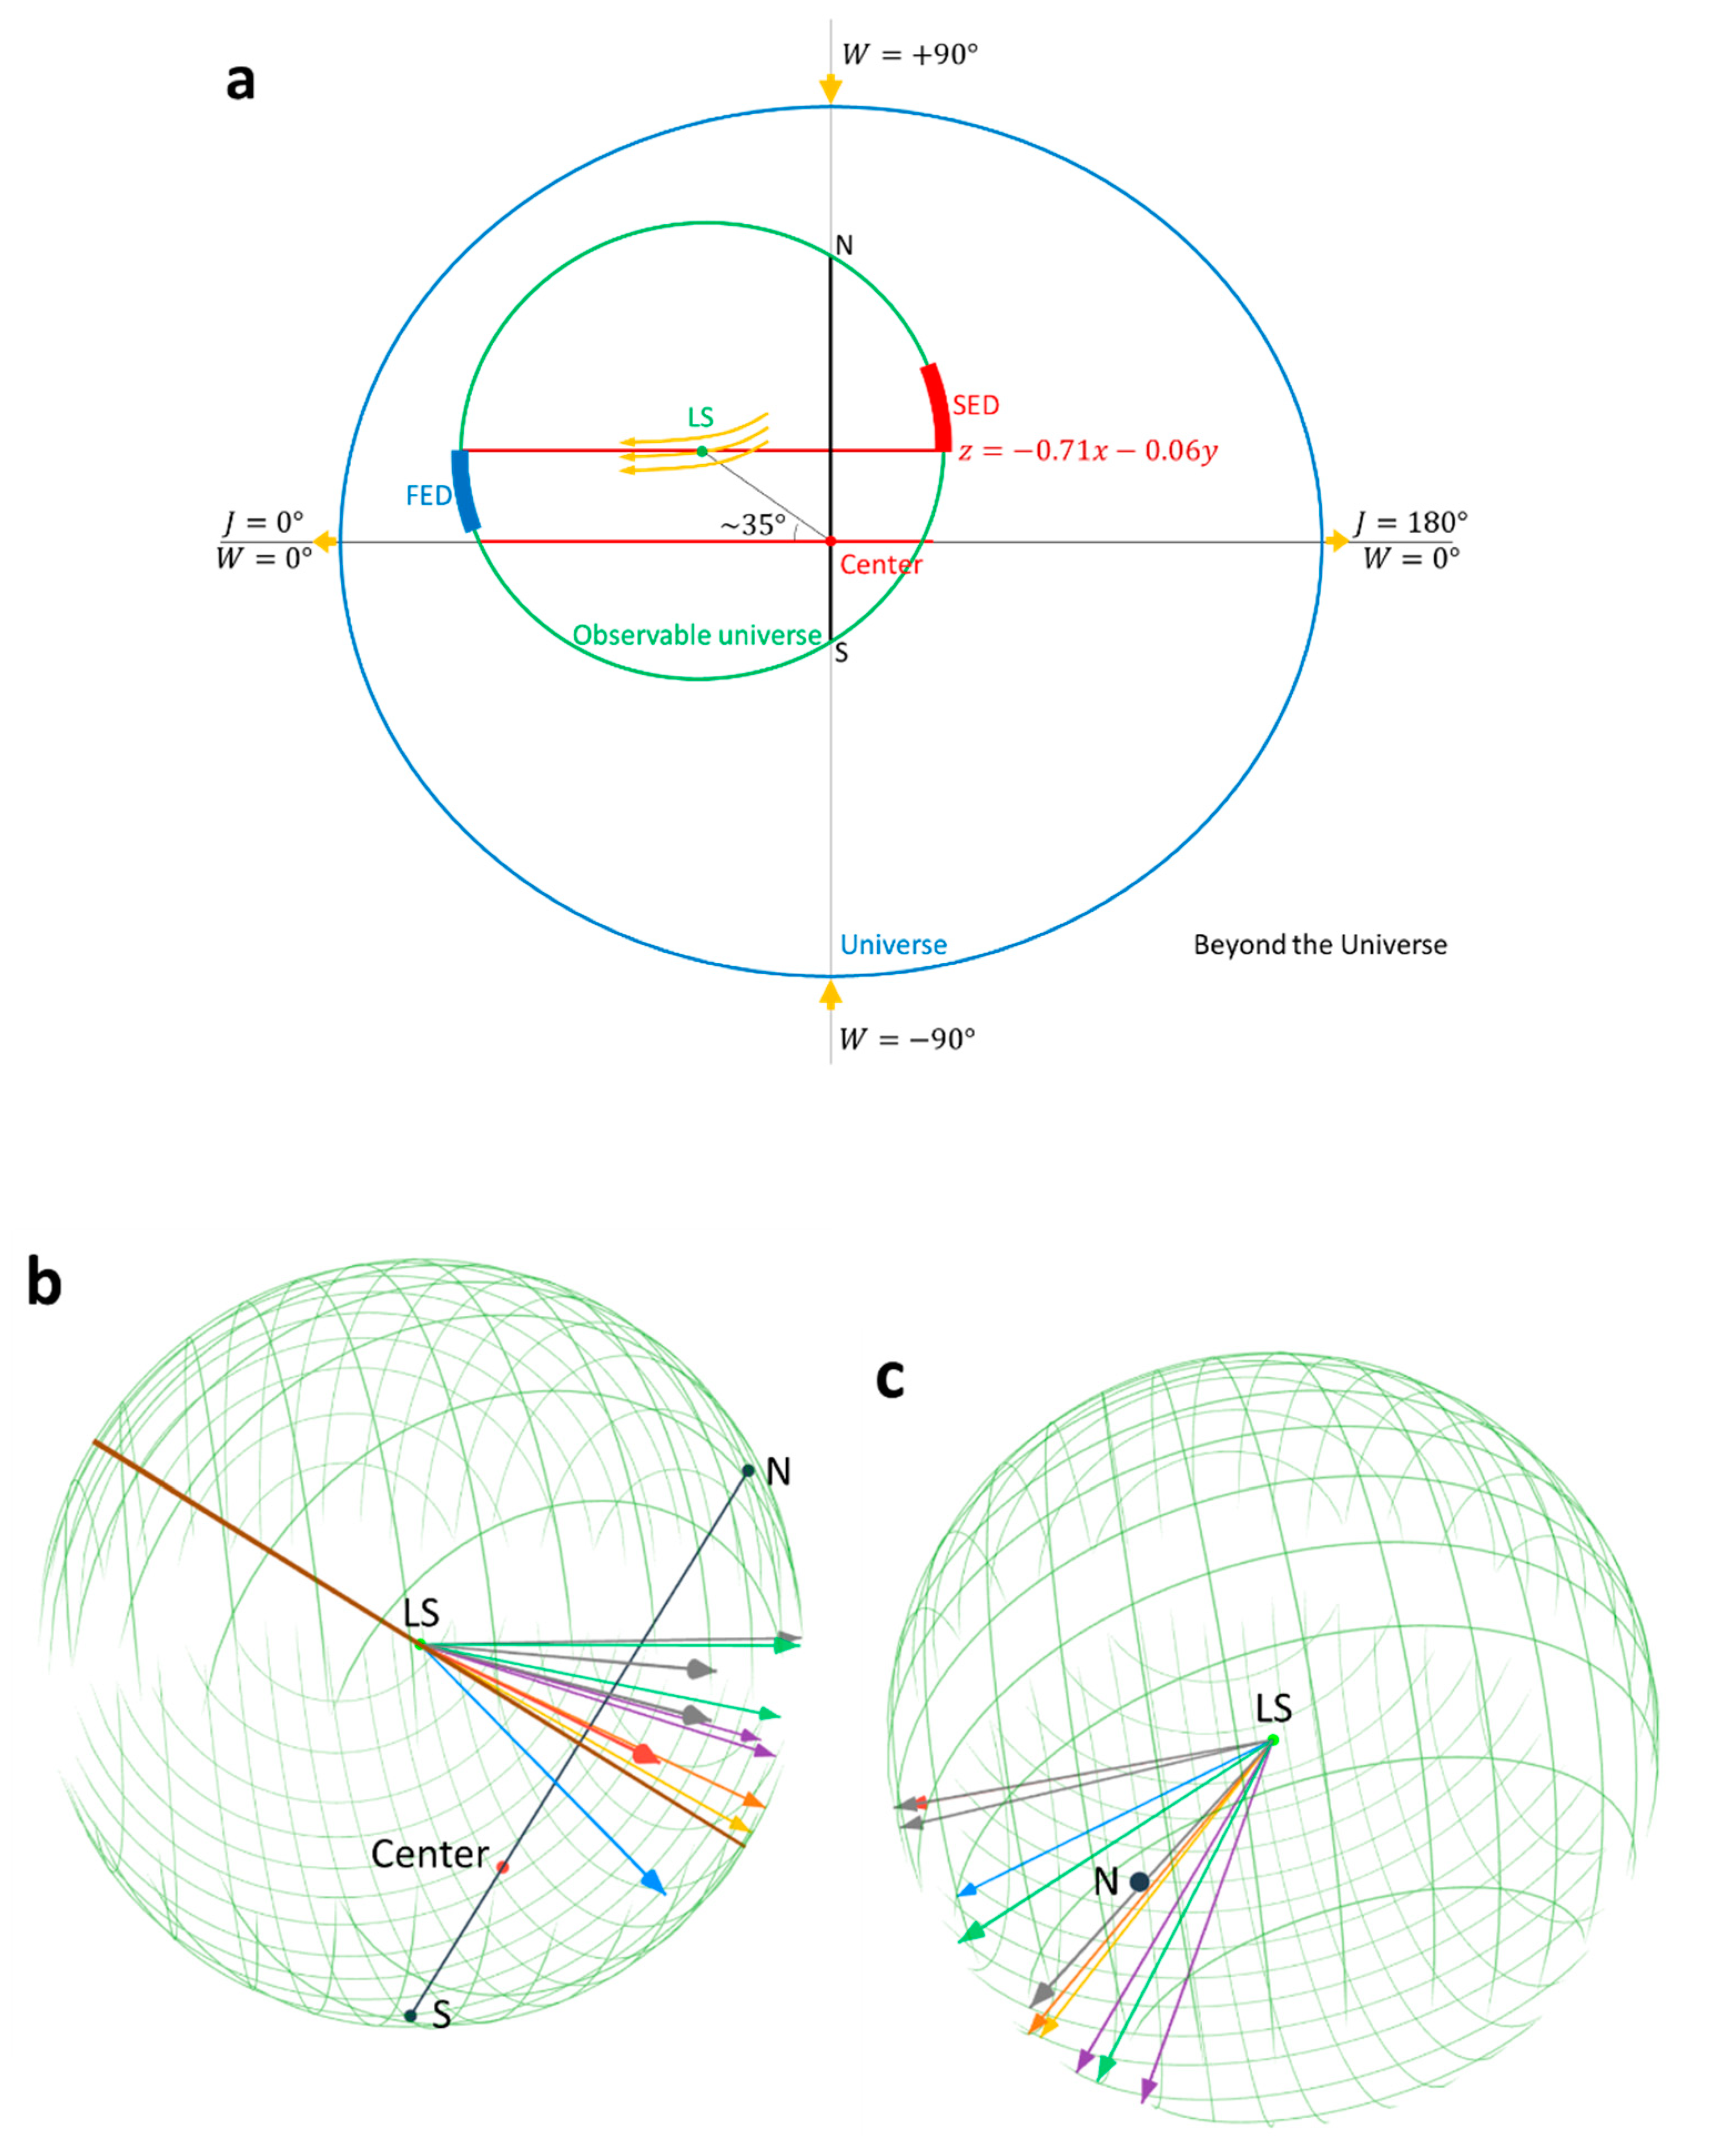
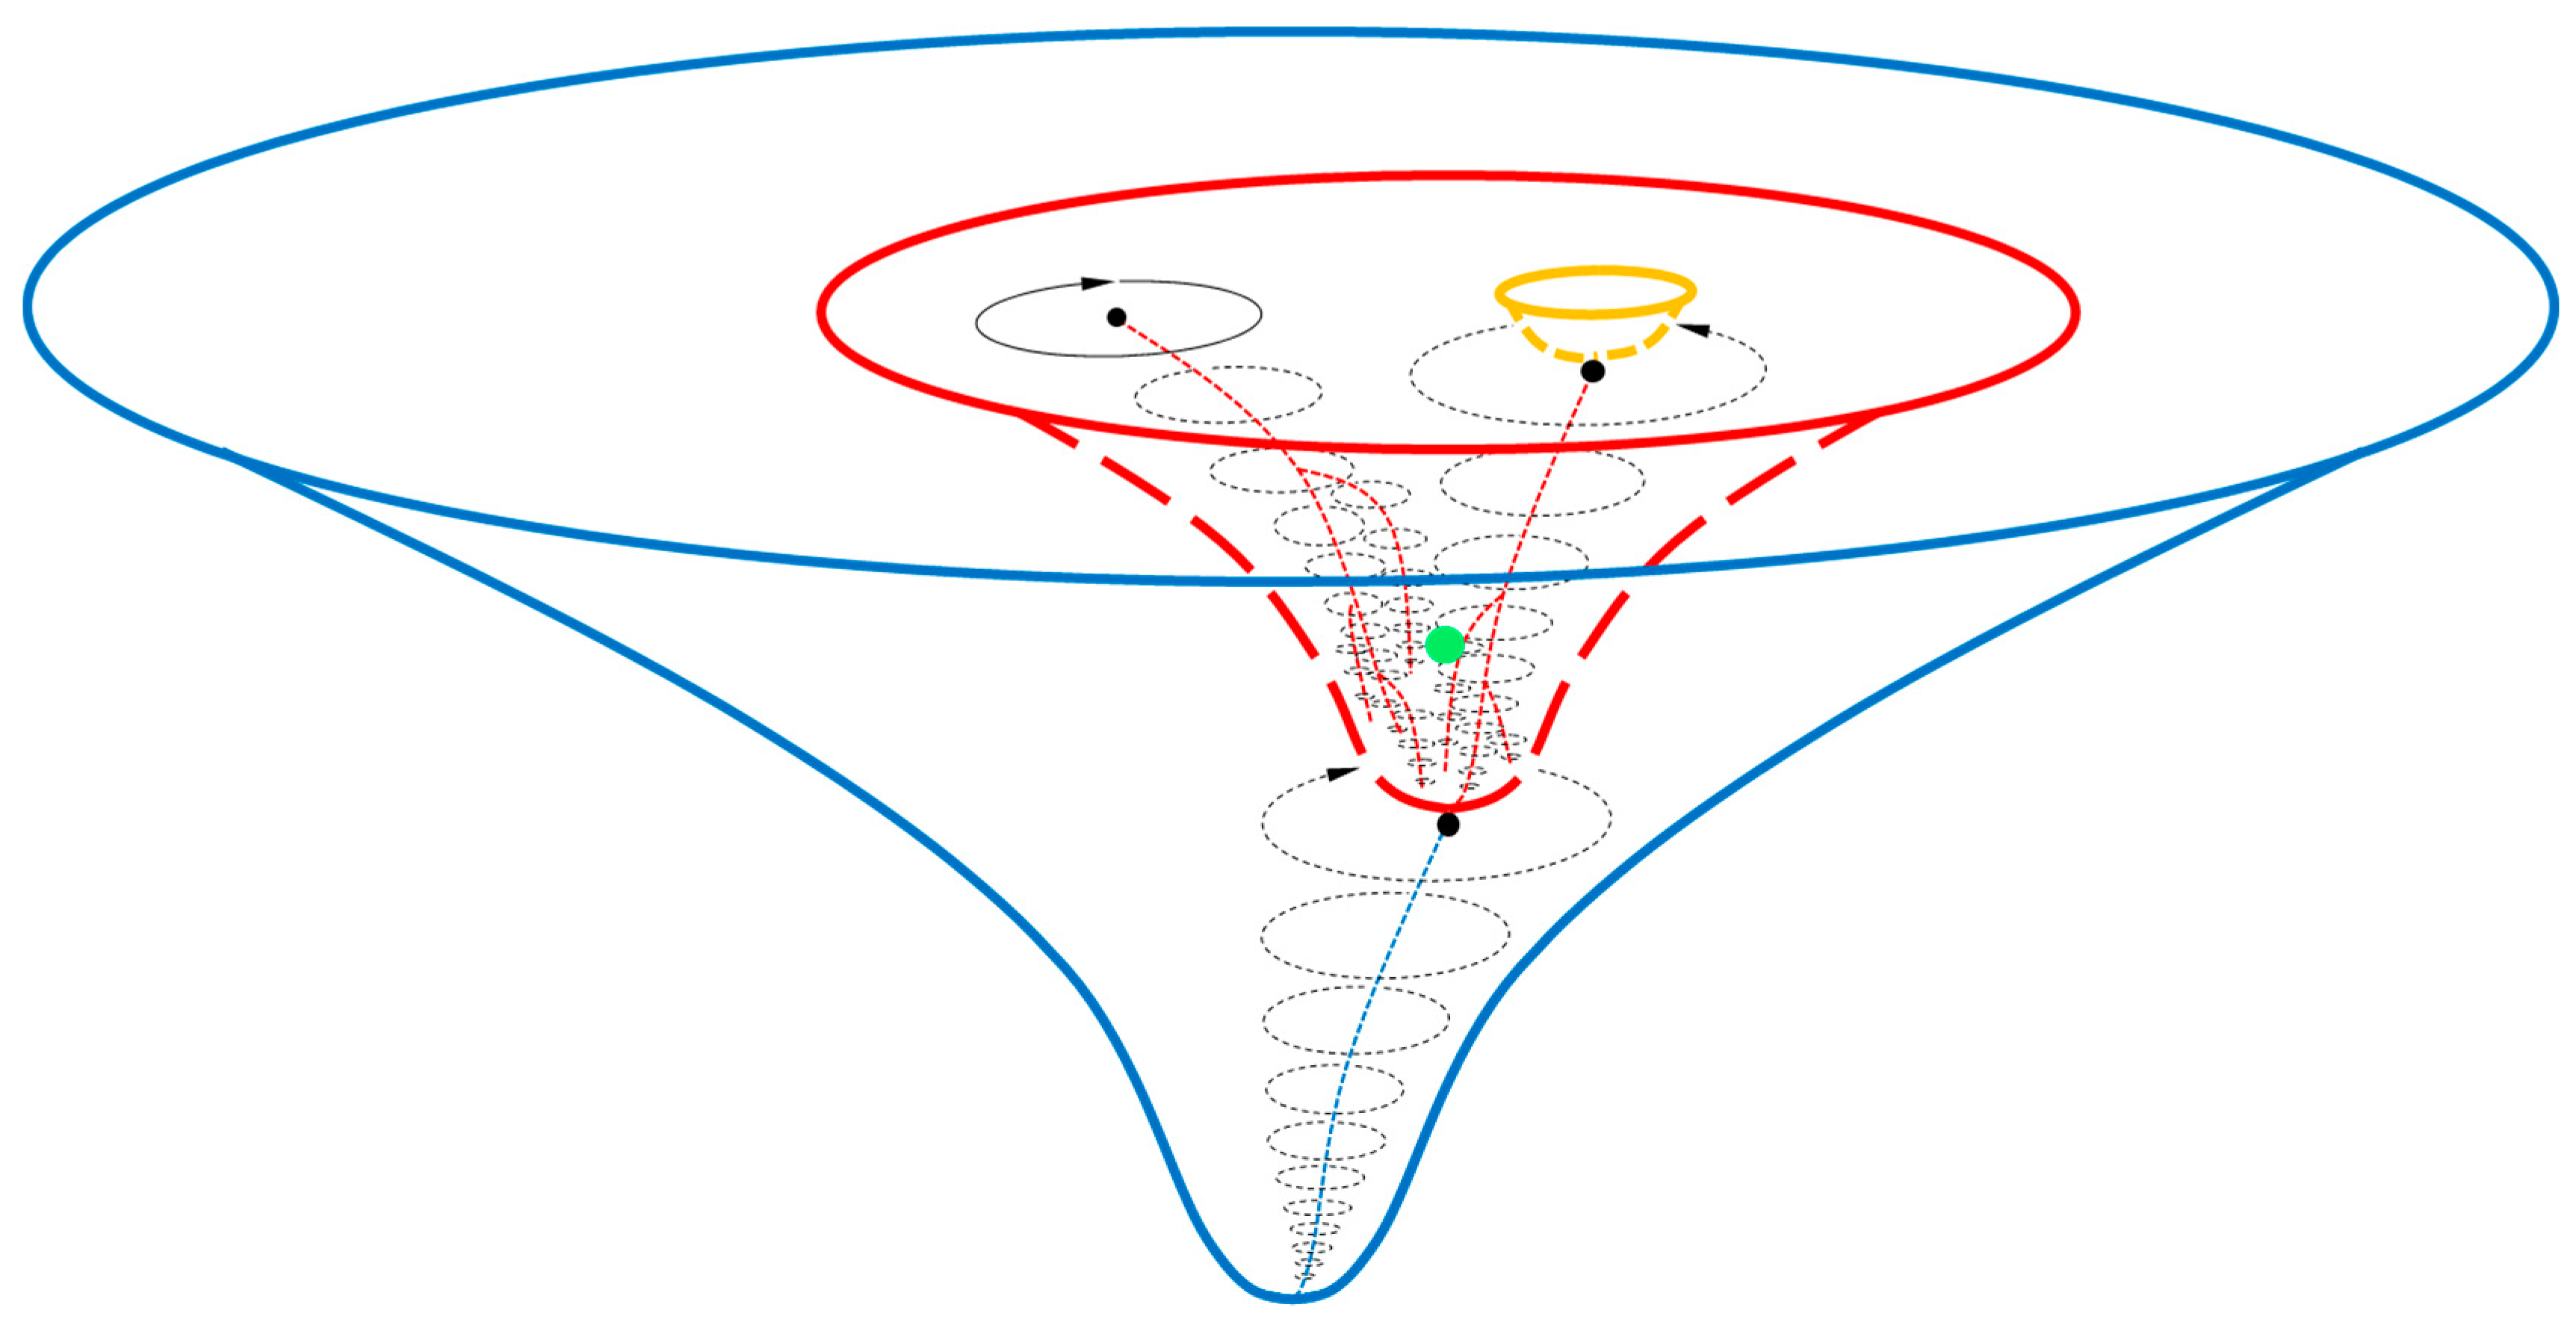
Figure 5.
Figure 5. A schematic diagram of Nature. Before our current Universe, there was a previous aeon (blue), in which there was a host black hole (black eclipses) spinning clockwise. The collapse of its core, the densest object (black dot), generated the Big Bang of our Universe (red). Within our Universe, there are many black holes (black eclipses). As they grow and merge (dashed thin red lines), their masses of the survived black holes have been increasing. Once any one of them exceeds the mass limit of the densest object, a new Big Bang will occur to generate the next aeon (orange). The dot (green) in our Universe (red) represents when and where we are.
Disclaimer/Publisher’s Note: The statements, opinions and data contained in all publications are solely those of the individual author(s) and contributor(s) and not of MDPI and/or the editor(s). MDPI and/or the editor(s) disclaim responsibility for any injury to people or property resulting from any ideas, methods, instructions or products referred to in the content. |
© 2024 by the authors. Licensee MDPI, Basel, Switzerland. This article is an open access article distributed under the terms and conditions of the Creative Commons Attribution (CC BY) license (http://creativecommons.org/licenses/by/4.0/).
Copyright: This open access article is published under a Creative Commons CC BY 4.0 license, which permit the free download, distribution, and reuse, provided that the author and preprint are cited in any reuse.


