
Submitted:
27 December 2024
Posted:
30 December 2024
You are already at the latest version
Abstract
The optimal use of fibers in construction brings tangible benefits, and in many cases even makes it possible to overcome the limitations of traditional reinforcement. Concrete with dispersed reinforcement belongs to the group of special concretes, which are characterized by special properties, i.e. resistance to the formation of cracks and fractures, higher fatigue resistance, as well as higher tensile and shear strength. Increasing demands on structural components have forced contractors to look for innovative solutions. This means that a mixture of only three ingredients doesn't really exist anymore. Selected chemical admixtures and mineral additives are being added to concretes, as well as various types of dispersed reinforcement. The use of fibers significantly improves selected properties of concretes. Therefore, an attempt was made to compare the rheological characteristics and parameters of hardened mortars with selected types of fibers that are generally available on the market. In the literature we can find a lot of research on concrete modification. In contrast, knowledge of the use of fibres in construction mortars is to a much lesser extent. The aim of the study was to determine the physico-mechanical parameters of mortars with the addition of steel, glass and basalt fibres. The effects of fibre addition on the compressive and flexural strength, water absorption and capillary rise of mortars were studied. The rheological characteristics of the mortars, i.e. consistency and bulk density, were also studied. Compressive and flexural strength were tested after 7, 28 and 56 days, while capillary rise and saturation were tested after 28 days of maturation. Relationships were developed for the mortars tested between compressive strength and flexural strength, as well as absorbability and capillary rise. A full statistical analysis was performed for two parameters, i.e. compressive strength and capillary rise. The flexural strength at each test time is definitely influenced by the type of dispersed reinforcement used in the mortar. In the absorption and capillary rise tests, each type of fibre in the mortar results in a reduced weight gain in contact with water.
Keywords:
cement
; basalt fibres
; glass fibres
; steel fibres
; compressive and flexural strength
; mortar
; mortar parameters
; rheological properties
1. Introduction
Composites with fibre additives are called fibre concretes. Their beginning in the Polish construction industry began in the 1990s. At that time, two groups of products appeared simultaneously: materials for reinforcing structures and micro-fibres for reinforcing concrete. In Poland, products for the strengthening and reinforcement of concrete elements initially met with considerable resistance from the engineering community. The main objections were directed at issues relating to the rheology and durability of structures containing fibrous materials in their composition. Today, after more than thirty years of experience in Poland, scientific work and practical applications, it is clear that these are trustworthy materials [1,2]. By using fibres we can to a large extent influence the parameters and characteristics of the material [3,4]. We are referring here to the cracks that appear in a rather brittle cement matrix. These cracks can damage the component, affecting its durability and, in many cases, the safety of the entire structure [5,6]. In view of the brittleness of the cement matrix, it is not possible to avoid cracks. It is therefore important to avoid cracks that can penetrate into the main reinforcement [7]. The most effective way of dealing with the formation of dangerous cracks is the use of fibre dispersed reinforcement. The popularisation of these solutions has led to the inclusion of fibres in the standard for concrete PN-EN 206:2014-04 [8]. In this standard, we can only find two types of fibres in terms of materials. These are steel fibres and polymer fibres. For the other fibres, there are no standard guidelines [9,10]. Among the existing guidelines from the American Society for Testing and Materials, ASTM C1116/C1116M-10a standards have been developed for the requirements for different fibres, depending on the material from which they are made. The classification includes four types. Type one is steel fibre reinforced concrete, type II is glass fibre reinforced element. Type III describes concrete reinforced with synthetic fibres, while type IV is concrete reinforced with natural fibres only [11].
The properties of the composite mainly depend on the orientation of the fibres, the arrangement of the fibres in the component, and the reproducibility of the respective quality of the fibres used. In spite of great care and quality control during fibre production, minor problems at the microscopic level of fibre structure can occur, which can affect the overall properties of the fibre composite. Excessive clustering of fibres at a particular point, or their absence at other points, can lead to significant changes in the properties of a given material. Fibres are characterised by high stiffness and strength, far exceeding the value of a given material in terms of mass. ‘For example, the tensile strength of structural steels is in the order of 0.2–0.7 GPa, whereas the strength of thin steel fibres is around 4 GPa”[12]. This difference is probably due to the fact that the crystal structure of the fibres themselves is more developed and the iron crystals are only oriented along the axis of the fibre in question. The number of defects in the low-volume fibres themselves is much smaller than in the same material with a larger volume. The fibres produced are characterised by diameters, often not exceeding 15 µm. This is because fibres with smaller diameters tend to be much stronger in terms of bending strength. Studies carried out by researchers [13,14] show that the tensile strength increases sharply when the diameter of the fibre under test is smaller than 15 µm. With smaller diameters, there is less risk of defects on the fibre surface, such as microcracks or faults. In other words, the smaller the diameter of the fibre, the less likely it is to have defects, which translates into its strength parameters [15].
Among the materials used for use in concrete or mortar as dispersed reinforcement are steel, glass, basalt, carbon, polymer, polypropylene, organic and other fibres. The use of dispersed reinforcement makes it possible to achieve high flexural tensile strength, higher compressive strength, high frost resistance, high resistance to abrasion and cracking, and resistance to concrete corrosion. Concrete with dispersed steel fibres is used for industrial floors subject to high loads and abrasion. Glass fibres improve the water and fire resistance of concretes. They are used in the construction of concrete elements exposed to water and atmospheric moisture. Concrete with basalt fibre additives has good mechanical properties, as well as high abrasion resistance. It is also a good thermal and electrical insulator. It is resistant to corrosion and high and low temperatures [16]. Nowadays, concrete or mortars with dispersed reinforcement are increasingly used in single-family housing [17,18,19,20]. The solutions and application options for reinforced concrete are constantly evolving. A concrete element made with this technology is definitely more durable, waterproof, durable, ductile and easier to form into any shape [21,22]. Concrete products and architectural elements blend perfectly with the surrounding space, creating an aesthetic whole. In addition, they are characterised by above-average resistance to particularly unfavourable external factors, including low temperatures, sunshine and all types of concrete corrosion. Fibre-reinforced concrete products are well suited for use in today’s industrialised and aggressive urban and industrial environments [23,24,25,26].
2. Materials and Methods
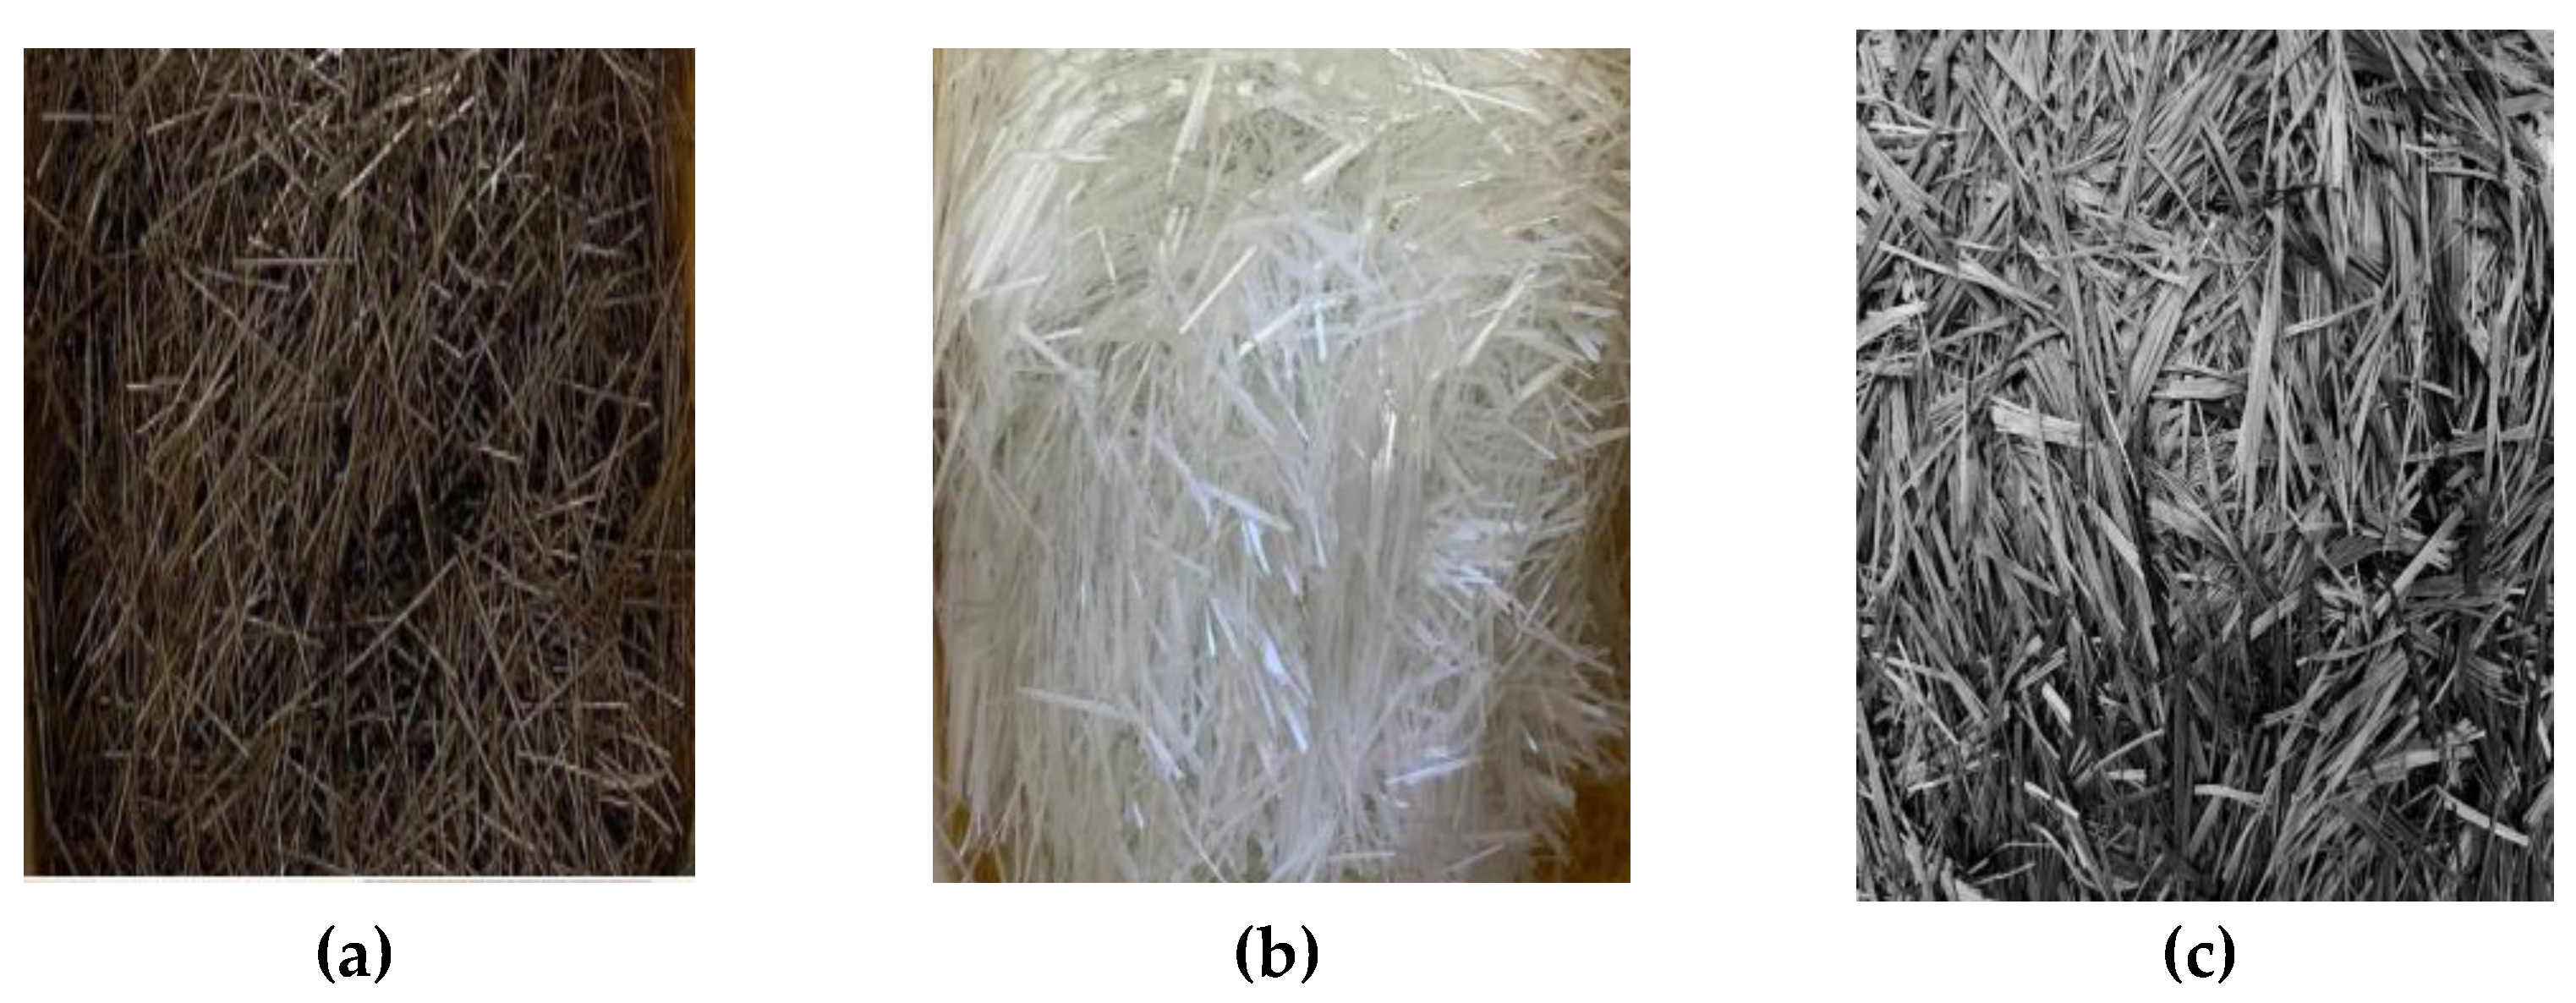
The test program comprised four series of mortars with steel fibre, glass fibre, basalt fibre and a series without fibre. Portland cement CEM I 42.5 R was used for the mortars [Table 1, Figure 2] in accordance with PN-EN 197-1: 2012 [27]. The aggregates used were quartz sand of fraction 0 ÷ 2 mm according to PN-EN 12620+A1:2010 [28], tap water [29] and selected one type of fibre. All planned tests were carried out in the laboratories of the Swietokrzyska University of Technology. A standard mortar composition with a w/c ratio of 0.5 was used for the tests. The mortar components were mixed according to EN 196-1:2016-07 [30] where cement and water were mixed for 30 s, then sand was dosed for 30 s while the components were further mixed. Further mixing of the mortar followed for another 30 s, at which point one type of fibre was dosed. Mortar standstill 90 s. Again the mortar was mixed for a period of 60 s. After this time, specimens measuring 4x4x16 cm were proceeded to be formed. The beams without the addition of fibres were marked with the symbol ‘SW’, with the addition of glass fibres ‘SZ’ with the addition of basalt fibres ‘SB’, and with the addition of steel fibres with the symbol ‘ST’. Steel fibres were used with a length of 12.5 mm, a diameter of 1 mm and a straight shape. The product complied with the standard in EN 14889-1:2007 [31]. The manufacturer provides technical data for the fibres, such as a minimum modulus of 180 GPa and a tensile strength of 1020 N/mm2. The manufacturer recommends using steel fibres at a rate of 20–40 kg/m3 of concrete. 20 kg/m3 mortar was used in this study [Figure 1a].
The glass fibres used in the tests were 12 mm in length, 14 µm in diameter, moisture content <0.6%, binder content 1%, green in colour. The manufacturer recommends using fibres at 5–10 kg/m3. The fibres were prepared based on the reference documents ISO 9001, ISO 3344: 1977, ISO 1887: 1980 and 5 kg/m3 of mortar was used for the tests [Figure 1b].
Basalt fibres have a high resistance to chemically aggressive environments. Their density is 2.65 g/cm3, tensile strength 3.0 GPa, modulus of elasticity 90 GPa. Fibre length 10 mm, diameter 0.01 mm. The manufacturer recommends the use of 1 kg of fibres per 100 kg of cement, and this is the amount used [Figure 1c].
The influence of the length of the mortar maturation period and the type of fibre introduced into the mortar on selected parameters: compressive and flexural strength, water absorption and capillary rise of mortars were considered in laboratory tests. Fresh mortar characteristics such as consistency and bulk density were also studied.
Compressive and flexural strength testing was carried out on standard specimens measuring 4x4x16 cm according to EN 1015-11:2020-04 [33]. After forming, the samples were stored in water at +18±2ºC throughout the maturation period. The compressive strength of the mortars was tested after 7, 28, 56 days, each time on six samples from each batch.
Capillary rise was tested according to PN-88/B-06250 [34] on 4x4x16 cm specimens. After forming, the beams were stored in water at +18±2ºC for 7 days. The samples were then stored in an air-dry environment at +18±2ºC. The weight gain of the tested mortars was controlled after 28 days of maturation. Prior to testing, the mortars were placed in an air-conditioning chamber at a constant temperature of +40ºC for a period of 96 h. After the samples were removed from the chamber, the weight gain of the mortars was tested 15 min, 30 min, 1 h, 4 h after the samples were in contact with water. Subsequent weight measurements were made every 24 h. The samples were immersed to a height of approximately 3 mm in water throughout the test period.
The absorbability test was carried out in accordance with PN-88/B-06250 [34] on samples measuring 4x4x16 cm. Mortar samples were stored for 7 days in water at a temperature of +18±2ºC, and a further 21 days until testing in air at a temperature of +18±2ºC. The mortar samples were dried to a constant weight for a period of 96 h in an air-conditioning chamber at +40ºC. After removal from the chamber, the samples were then placed in water up to half their height for a period of 24 h. After one day, the water was replenished to +1 cm above the height of the samples. The weight gain of the tested mortars was monitored every 24 h until there was no weight gain of the tested mortars.
The determination of water absorption and capillary rise was carried out on three samples from each batch.
3. Results
The consistency determination was carried out on the basis of PN-EN 1015-6:2000 [35] using the spreading table method.
According to EN 1015-6:2000 [35], mortars with a flow value of less than 140 mm belong to the group of dense-plastic mortars [Table 2].
Another rheological test was the determination of the volume density of fresh mortar. The test was performed in accordance with PN-EN 1015-3:2000 [36].
The addition of fibres to the mortars significantly altered the volumetric density of the mortars. The study showed that both the contribution of glass, basalt and steel fibres resulted in an increase in volumetric density, compared to the reference series. When glass fibres were used, the volumetric density increased by 7.67%, relative to the SW sample, while for steel fibres there was an increase of up to 14.44% relative to the reference series [Table 3].
Figure 3 shows the average increase in compressive strength for the tested mortar series with the addition of selected fibres. The determination of compressive and flexural strengths was carried out on three standard specimens measuring 4x4x16 cm according to PN-EN 1015-11:2020-04 [33].
Statistical calculations of compressive strength gain were performed using StatisticaStatSoft 13.00 for an assumed significance level of a=0.05. When comparing measurable variables with a normal distribution and homogeneous variance within groups, the ANOVA test was used, while the FWelch test was applied when the variance was not homogeneous. In addition, for dependent variables having a normal distribution, the ANOVA test for repeated measures was used. A detailed assessment of differences between groups was performed using Tukey’s post-hoc multiple comparisons test. Correlation analysis was calculated using Pearson’s correlation coefficient
The calculated analysis (Table 4 and Table 5) showed a significantly statistical relationship for SW, SZ, ST, SB samples after 7 days (p<0.001). Additionally, there are differences (Tukey’s post-hoc test) between SW and SZ (p<0.001); SW and ST (p=0.023); SW and SB (p=0.029); SZ and ST (p=0.013) and SZ and SB (p=0.010). The highest compressive strength is found in SW mortar (17.37 ± 0.90) while the lowest in SZ mortar (14.46 ± 0.52). The fcm values for the SW, SZ, ST and SB specimens are the same for the experiments conducted after 28 days (p=0.149) and after 56 days (p=0.370). In conclusion, the compressive strengths of the above mortars (SW; SZ; ST and SB) tested after 28 and 56 days are not significantly different from each other.
There are significant statistical differences between the compressive strength for the SW series (p<0.001); SZ (p<0.001); ST (p<0.001); SB (p<0.001) after 7, 28, 56 days (Table 6).
Using the Tukey test, we obtain differences between the compressive strengths for the SW series between 7 and 28 days (p<0.001); 7 and 56 days (p<0.001); 28 and 56 days (p=0.046;). SZ series strength between 7 and 28 days (p<0.001); 7 and 56 days (p<0.001); 28 and 56 days (p=0.002), and ST series strength between 7 and 28 days (p<0.001); 7 and 56 days (p<0.001); 28 and 56 days (p=0.001); SB fibre type between 7 and 28 days (p<0.001); 7 and 56 days (p<0.001). Using Tukey’s test, we obtain differences between the compressive strength for SW; SZ, ST, SB series between 7 and 28 days (p<0.001); 7 and 56 days (p<0.001); while between 28 and 56 days, a correlation is found for the SW series parameter (p=0.046); SZ (p=0.002); ST (p=0.001). In addition, the mean fcm [MPa] value for the SW; SZ; ST; SB series increases with maturation time after 7, 28, 56 days (Table 7, Table 8, Table 9 and Table 10). The addition of basalt fibres to the mortars increased the compressive strength by an average of about 5% throughout the study period.
The results obtained show that glass and steel fibres did not improve the compressive strength of the mortar. The results are quite similar, with the difference ranging from 1÷3 MPa.
Figure 4 shows the average flexural strength gain results for the tested mortars.
Mortars with added basalt fibres showed the greatest increase in flexural strength. Samples with their addition achieved the highest average flexural strength after 7, 28 and 56 days of curing. A slightly smaller increase was recorded for the steel fibre-enriched specimens. The worst flexural strength results were for the samples without fibre addition. After 56 days, the decrease in strength between the SW and SB series is almost 48%.
Absorption and capillary rise tests were carried out on three beads of each mortar series measuring 4x4x16 cm after 28 days of maturation (Figure 5).
There is a significantly statistical high correlation between time and weight gain of SW (p<0.001); SZ (p<0.001); ST (p<0.001); SB (p<0.001) samples. The calculated correlation coefficient is positive and therefore the weight gain of SW; SZ; ST; SB samples increases with time (Table 11).
The weight gain of the samples [kg/m2] varies according to the type of fibres used in the SW, SZ, ST, SB series in question (p=0.018) (Table 12). Using the Tukey test, we obtain significantly statistical differences between SW and SZ (p=0.009). In addition, equal weight gain of samples was observed between SW and ST (p=0.188); SW and SB (p=0.336); SZ and ST (p=0.576); SZ and SB (p=0.373); ST and SB (p=0.986). The largest increase in sample weight [kg/m2] occurs for the SW samples (1.59±1.02); while the smallest for the SZ series (0.66±0.38) (Table 13, Figure 6).
Analyzing the results of the weight gain of the specimens in the capillary rise and saturation test, it can be observed that for mortars with fibre additives, the weight gain after 28 days of maturation is significantly lower compared to the reference series. For the mortars with fibre addition, the weight gain is approximately 30% lower in the capillary rise test. The addition of fibres to the mortars reduced the water absorption capacity of the mortars tested. For the mortars with fibre addition, a lower weight gain in the absorbency test of about 2 percentage points was recorded for all the mortars with fibres considered.
In Figure 9 and Figure 10, a linear relationship is developed between absorbability and capillary rise and for compressive strength and flexural strength for mortars after 28 days of maturation for the tested mortar series with steel, glass and basalt fibres. Instead of estimating two parameters, we can perform one laboratory test and estimate the second parameter based on linear relationships.
4. Discussion
After conducting laboratory tests, i.e. mortars of standard composition with the addition of steel (ST), glass (SZ) and basalt (SB) fibres, it must be stated that the problem raised in the article–will the use of any fibre available on the market improve all the rheological characteristics and parameters of the hardened mortars? If we care about two parameters, which fibre to choose? Does the addition of fibres worsen any characteristics of fresh or already hardened mortars? We will start by saying that the addition of fibres causes a reduction in the spread of the consistency on the spreading table. For glass fibres, this spreading has been reported to be the lowest. It can be concluded that basalt fibres have the least effect on this parameter. Here, the use of a chemical admixture should also be considered if the workability of such a mortar with more fibres is difficult. The addition of fibres to the mortars had a significant effect on the change in volumetric density of the mortars. The study showed that the proportion of fibres in the mortars increased the bulk density, compared to the reference series. When glass fibres were used, the volumetric density increased by 7.7 per cent, relative to the SW sample, while for steel fibres there was an increase of up to 14.4 per cent relative to the reference series. In conclusion, the compressive strengths of the tested mortars with fibre additions after 28 and 56 days of maturation do not differ substantially from each other. The differences in compressive strength increase range from 1 to 3 MPa. Here, the type of fibre used does not affect the changes in this parameter. In the flexural strength test, the type of fibre used in the mortar is very important. Compared to the reference series (SW), mortars with basalt fibre achieved the greatest increase in flexural strength after 28 days by 48% and after 56 days of maturing by 47%. The extended maturation time of the mortars did not affect the trend in flexural strength gain. The next mortars to achieve higher flexural strength gains were those with steel fibres. Their flexural strength was 16.7 per cent lower than mortars with basalt fibres after 28 days of maturation. In the capillary rise test, the steel-fibre series showed the smallest weight gain compared to the other series tested. Compared to the reference series, the decrease is 60.6%. In general, all series with added fibre in the composition have a lower weight gain in the capillary rise test. In the absorption test, we have a similar trend that the mortar samples with glass fibre showed the lowest weight gain. Compared to the reference series, the decrease is 33.8 per cent. All the series tested have a water absorption capacity of less than 5%. They can therefore be used in areas exposed to moisture. Laboratory tests are also time-consuming. What can be done without performing all the tests? Develop correlations for the series to be tested. Then we only need to carry out a test for one parameter. In this paper, such correlations are defined for the series tested. A statistical analysis was also carried out for the results obtained for the two parameters of compressive strength and capillary rise. Depending on the parameters that we want to improve in the mortars, we choose a particular mortar. Glass fibres primarily reduce the capillary rise and absorbability of mortars. If you want to achieve the highest possible flexural strength, you should choose mortars with basalt fibres. Mortars modified with basalt fibres are also less resistant to moisture than mortars with glass fibres.
5. Conclusions
The results of the study form the basis for the following conclusions:
- 1.
-
The introduction of the basalt fibre additive into the mortars increased the compressive strength by approximately 5%. The results of the compressive strengths are quite close to each other, with the difference varying between 1÷3 MPa.
- -
- Mortars with added basalt fibres showed the greatest increase in flexural strength after 7, 28 and 56 days of maturation. Comparable results were recorded for mortars enriched with steel fibres. The worst flexural strength results were for the reference mortar. A statistical analysis was developed to conclude that the fcm values for the SW, SZ, ST and SB specimens are the same for tests carried out after 28 days (p=0.149) and after 56 days (p=0.370). In conclusion, the compressive strengths of the mortars in question (SW; SZ; ST and SB) tested after 28 and 56 days do not differ between each other.
- 2.
- In the capillary rise test, it can be observed that mortars with fibre additives show a weight increase of approximately 30 % after 28 days of maturation. The weight gain of the specimens differs depending on the type of fibres used SW, SZ, ST, SB (p=0.018). In addition, equal weight gain of samples was observed between SW and ST (p=0.188); SW and SB (p=0.336); SZ and ST (p=0.576); SZ and SB (p=0.373); ST and SB (p=0.986). The largest increase in specimen weight [kg/m2] occurs for the SW specimens (1.59±1.02); while the smallest for the SZ series (0.66±0.38).
- 3.
- In the absorbability test, mortars with fibre additions show a lower weight gain of approximately 2 % compared to mortars without fibre additions.
The improved absorbability and capillary rise parameters of the mortars are influenced by the air pore characteristics. In mortars with dispersed reinforcement, there is a favourable reduction in the pore distribution index L. The main mechanism influencing the improvement of these parameters appears to be the mechanism of so-called microcrack bridging by fibres. Thanks to this phenomenon, there is a smaller increase in the weight of the mortars.
- 4.
- Linear relationships were developed between compressive strength and flexural strength, and between water absorption and capillary rise for the mortars tested. The relationship will allow only one parameter to be tested in the laboratory, while the other can be estimated from the linear relationship.
Author Contributions
Anna Kotwa.
Funding
Not applicable.
Data Availability Statement
Not applicable.
Acknowledgments
Not applicable.
Conflicts of Interest
Not applicable.
References
- Górski, M. , Kotara B., Białozor R., Types and properties of non-metallic reinforcement, XXXIII National Construction Designer’s Workshops, Szczyrk, 2018, pp. 45-90.
- Siwowski, T. , Rajchel M.: A Polish approach to FRP bridges, SSP–Journal of Civil Engineering, Volume 2, 2017, pp. 47-54.
- Urban, T. Testing the tensile strength of concrete with microfibres,Materiały budowlane, Volume 09/2023, pp. 1-4. [CrossRef]
- Glinick, M.A. Equivalent flexural strength of fibre concrete Inżynier Budownictwa, Volume 1, 2008, pp. 1-5.
- Karwacki J, Fibre composite concrete, Polski Cement, Krakow 2001.
- Drzazga, M. , Kamiński H.: FRP reinforcing bars as primary reinforcement of flexural concrete elements—review of recommendations and design efficiency, Przegląd Budowlany, Volume 3, 2015, pp. 22-28.
- Fejdyś, M. Łandwijt M., Engineered fibres to reinforce composite materials, Techniczne Wyroby Włókiennicze, 2010, pp. 12-22.
- PN-EN 206:2014-04 Concrete–Requirements, properties, production and conformity, Polski Komitet Normalizacyjny, Warsaw, Poland, 2014.
- Karwowska, J. Łapko A., Suitability of using modern fibre concrete composites in building structures, Civil and Environmental Engineering 2011, Volume 2, pp. 41–46.
- Morozov, N.M. Borovskich I.V., Khozin V.G., Sand basaltfiber concrete. World Applied Science Journal, Volume 201325, pp. 832–838.
- ASTM C1116/C1116M-10a. Standard Specification for Fiber-Reinforced Concrete.
- Sankiewicz, B. Use of glass fibre-based composites (GFRP) in bridge decks, Politechnika Opolska, Opole 2015.
- PN-EN 1015-3:2000 Test methods for mortars for masonry -- Determination of consistency of fresh mortar (using a spreading table), Polski Komitet Normalizacyjny, Warsaw, Poland, 2000.
- Blazy J, Blazy R, Drobiec Ł. Glass Fiber Reinforced Concrete as a Durable and Enhanced Material for Structural and Architectural Elements in Smart City–A Review. Materials. 2022.
- Zych, T. Najduchowska M., Rewera B., Influence of fibre type on the strength and durability properties of floor concrete, Dni Betonu, 2021, pp. 420-438.
- Śliwiński, J. Plain concrete: design and basic properties, Polski Cement, Kraków 1999.
- Górski, M. , et al.: Smart textiles for strengthening of structures., Open Engineering 2016, Volume 6. 1, 2016, pp. 548-553.
- Jarek, B. , Kubik A.: The use of glass fibre reinforcement bars (GRFP) in construction, Przegląd Budowlany, Volume 12, 2014, pp. 21-26.
- Królikowski, W. Reinforced plastics and reinforcing fibres, Wydawnictwo Naukowo-Techniczne, Warszawa 1988.
- Leda, H. , Glass or carbon fibres in polymer composites? Kompozyty 3/2003.
- Moyo, P. , Habimana P., Kabani M. The behaviour of R.C. beams patch-repaired and strengthened with CFRP strips subjected to impact loading. Materiały Budowlane. 2024. Volume 623, Volume 7,pp. 1-4. [CrossRef]
- Szmatuła, F. , Blazy J. Shaping a decorative concrete face for the renovation and modernization of buildings. Materiały Budowlane. 2024. Volume 627, Volume 11,pp. 149-156. [CrossRef]
- Owsiak, Z. Composite materials: selected issues, Wydawnictwo Politechniki Świętokrzyskiej, Kielce. 2006. [Google Scholar]
- Szumigała, M. , Pawłowski D., The use of composite reinforcing bars in building structures, Przegląd Budowlany, Volume 3, 2014, pp. 47-50.
- Zarański, Z. Łosik I., Bojar Z., Investigations into the properties of carbon fibres after surface modification, Kompozyty 2/2002.
- Boczkowska, A. KapuścinskiJ., Puciłowski K., Wojciechowski S., Composites, Wydawnictwo Politechniki Warszawskiej, Warszawa. 2000. [Google Scholar]
- PN-EN 197-1: 2012 Cement -- Part 1: Composition, requirements and conformity criteria for cements for general use, Polski Komitet Normalizacyjny: Warsaw, Poland. 2012.
- PN-EN 12620+A1:2010, Aggregates for concrete, Polski Komitet Normalizacyjny: Warsaw, Poland, 2010.
- PN-EN 1008:2004 Concrete batching water, Polski Komitet Normalizacyjny: Warsaw, Poland, 2004.
- PN-EN 196-1:2016-07 Methods of testing cement -- Part 1: Determination of strength, Polish Committee for Standardisation, Warsaw, Poland. 2016.
- PN-EN 14889-2:2007–Fibres for concrete–Part 2: Polymer fibres–Definitions, requirements and conformity, Polski Komitet Normalizacyjny,Warsaw, Poland. 2007.
- www.dyckerhoff.pl, Cement Information Materials.
- PN-EN 1015-11:2020-04 Test methods for mortars for masonry -- Part 11: Determination of flexural and compressive strength of hardened mortar, Polski Komitet Normalizacyjny, Warsaw, Poland, 2020.
- PN-88/B-06250 Plain concrete, Polski Komitet Normalizacyjny, Warsaw, Poland, 1988.
- PN-EN 1015-6:2000 Methods for testing mortars for masonry -- Determination of volume density of fresh mortar, Polish Committee for Standardization, Warsaw, Poland, 2000.
- PN-EN 1015-3:2000 Test methods for mortars for masonry -- Determination of consistency of fresh mortar (using a spreading table), Polski Komitet Normalizacyjny, Warsaw, Poland, 2000.
- PN-EN 206:2014-04 Concrete. Requirements, properties, production and conformity, Polski Komitet Normalizacyjny: Warsaw, Poland. 2014.
- PN-EN 196-1:2016-07 Methods of testing cement -- Part 1: Determination of strength, Polski Komitet Normalizacyjny, Warsaw, Poland. 2016.
Figure 1.
Fibres added to mortar: a). steel, b). glass, c). basalt.
| No. | Name | Chemical composition, % | Specific surface area | fcm, MPa | |||||
|---|---|---|---|---|---|---|---|---|---|
| SiO2 | CaO | MgO | Fe2O3 | Al2O3 | cm2/g | R2 | R28 | ||
| 1 | CEM I 42,5R | 19,84 | 63,2 | 2,08 | 2,72 | 4,65 | 4086 | 32,0 | 53,0 |
Figure 2.
Grain size of CEM I 42.5R cement.
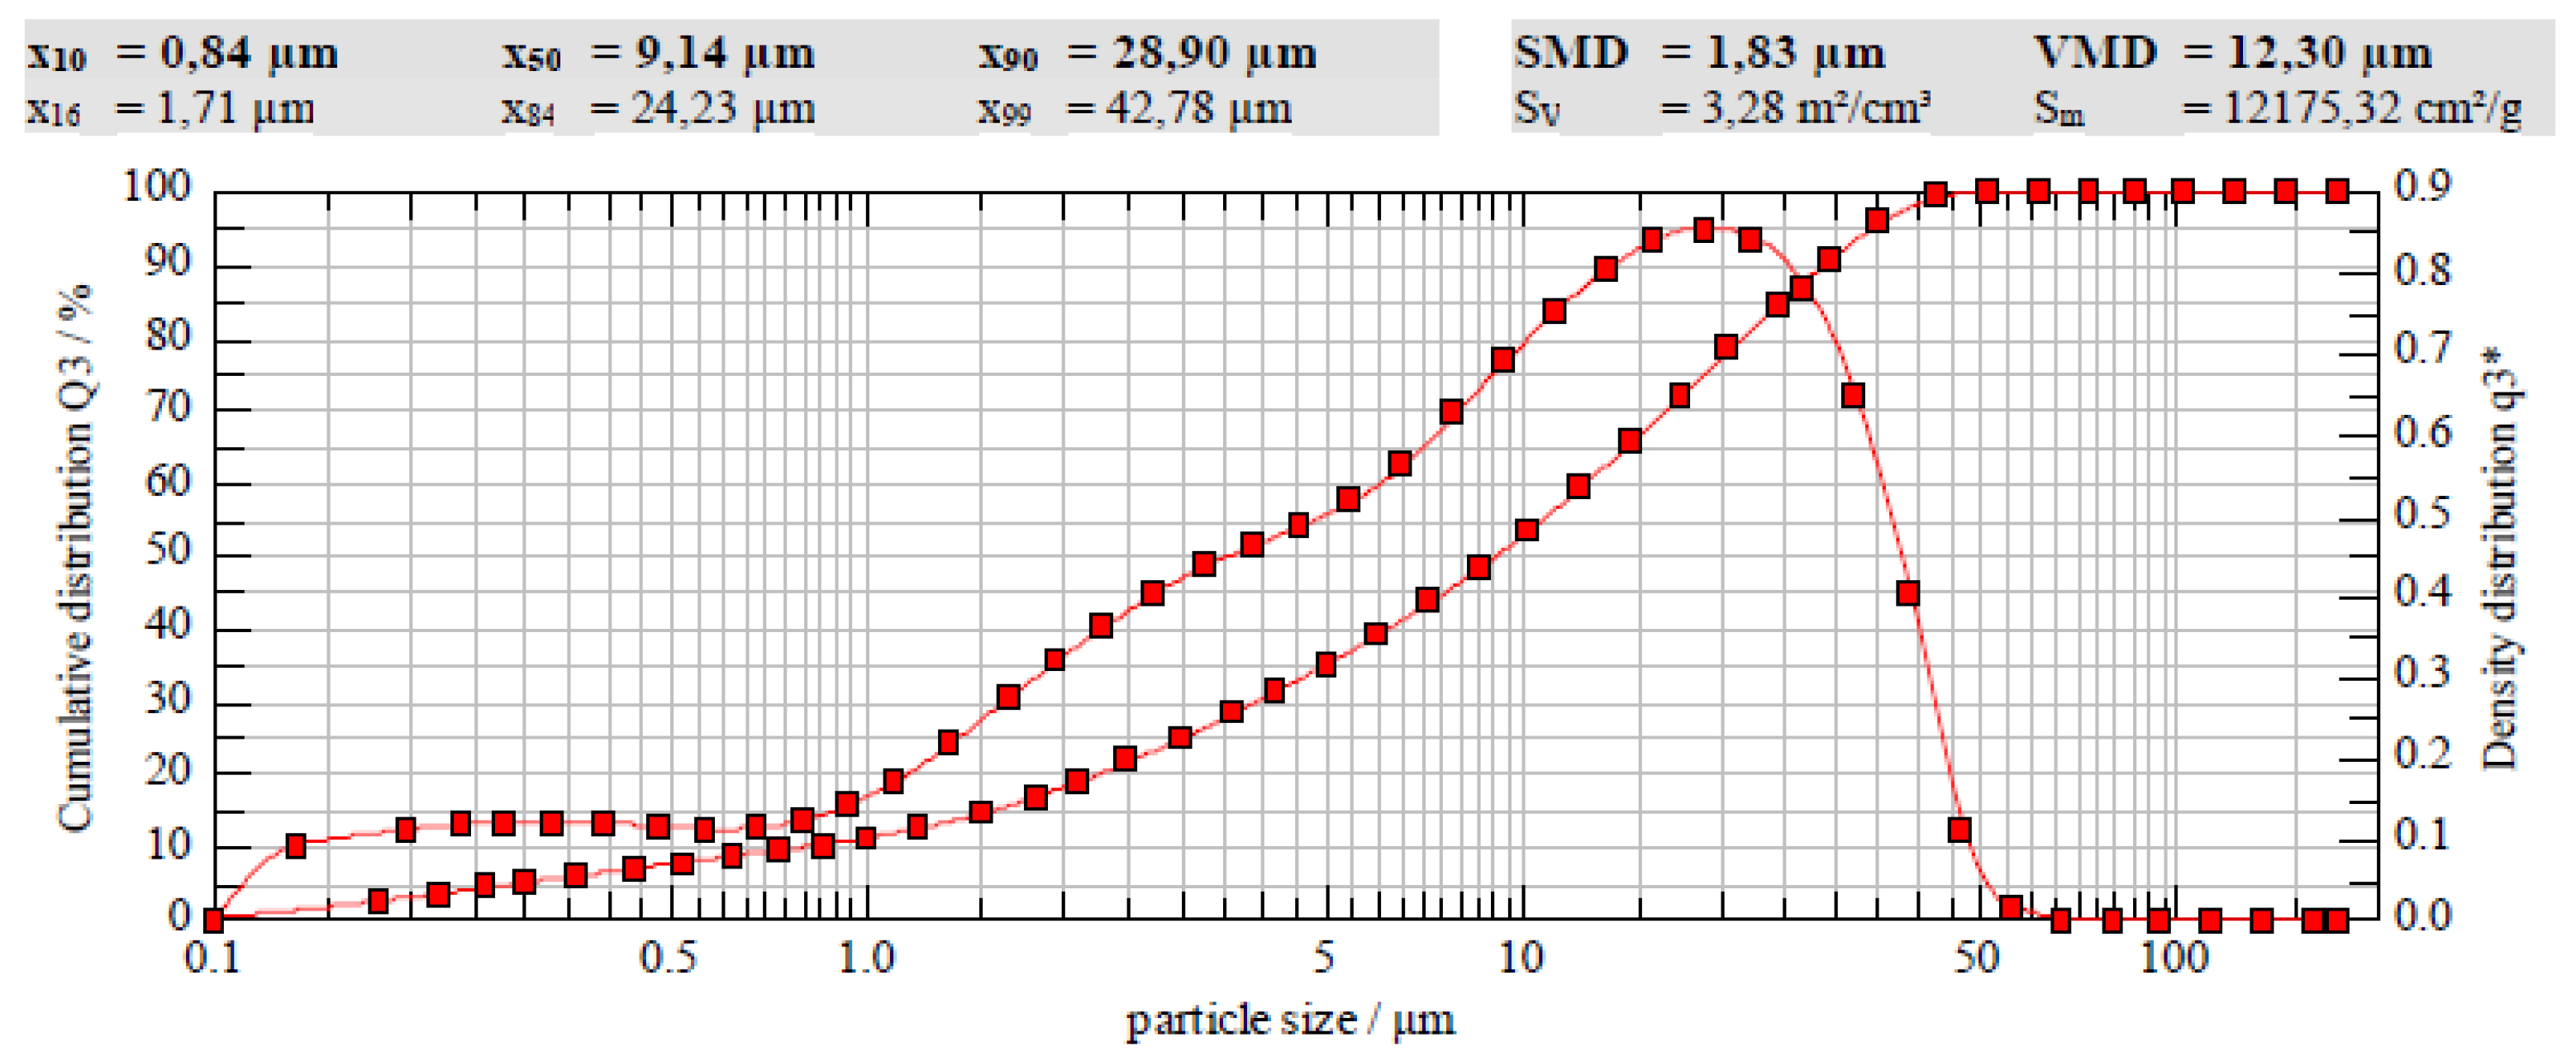
Figure 3.
Average compressive strength gain of the tested series.
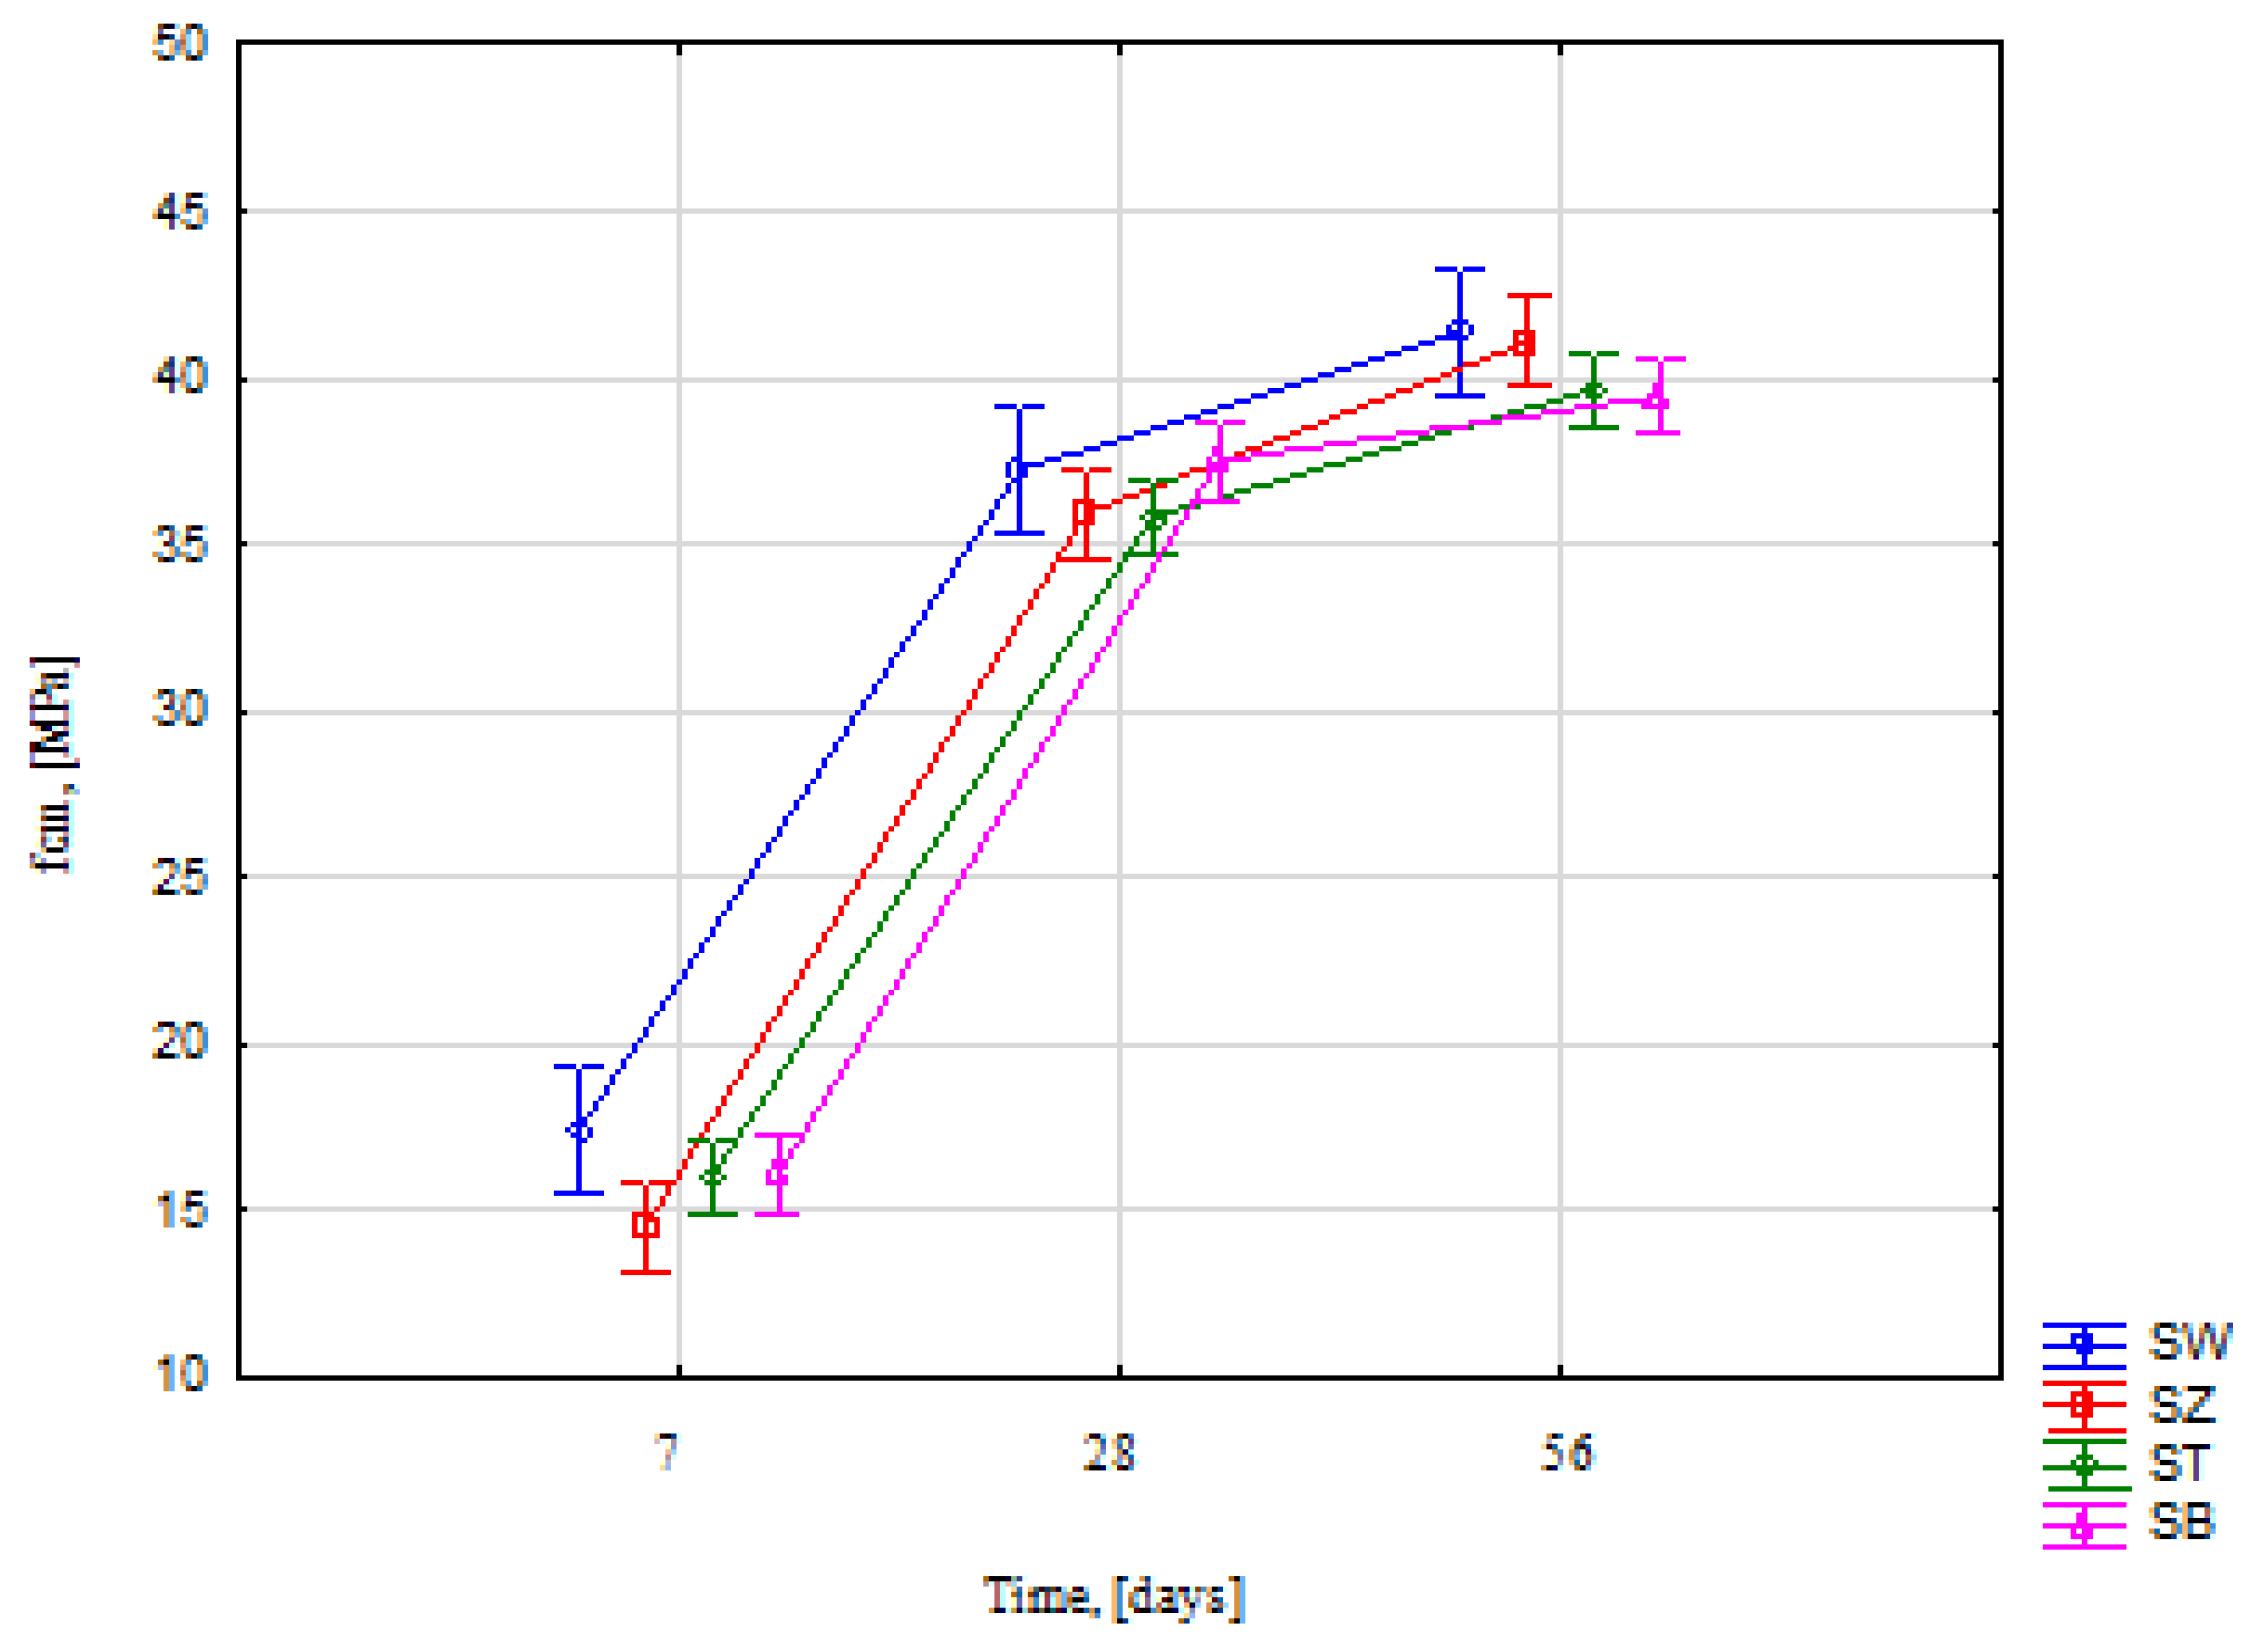
Figure 4.
Average flexural strength gain of the tested series.
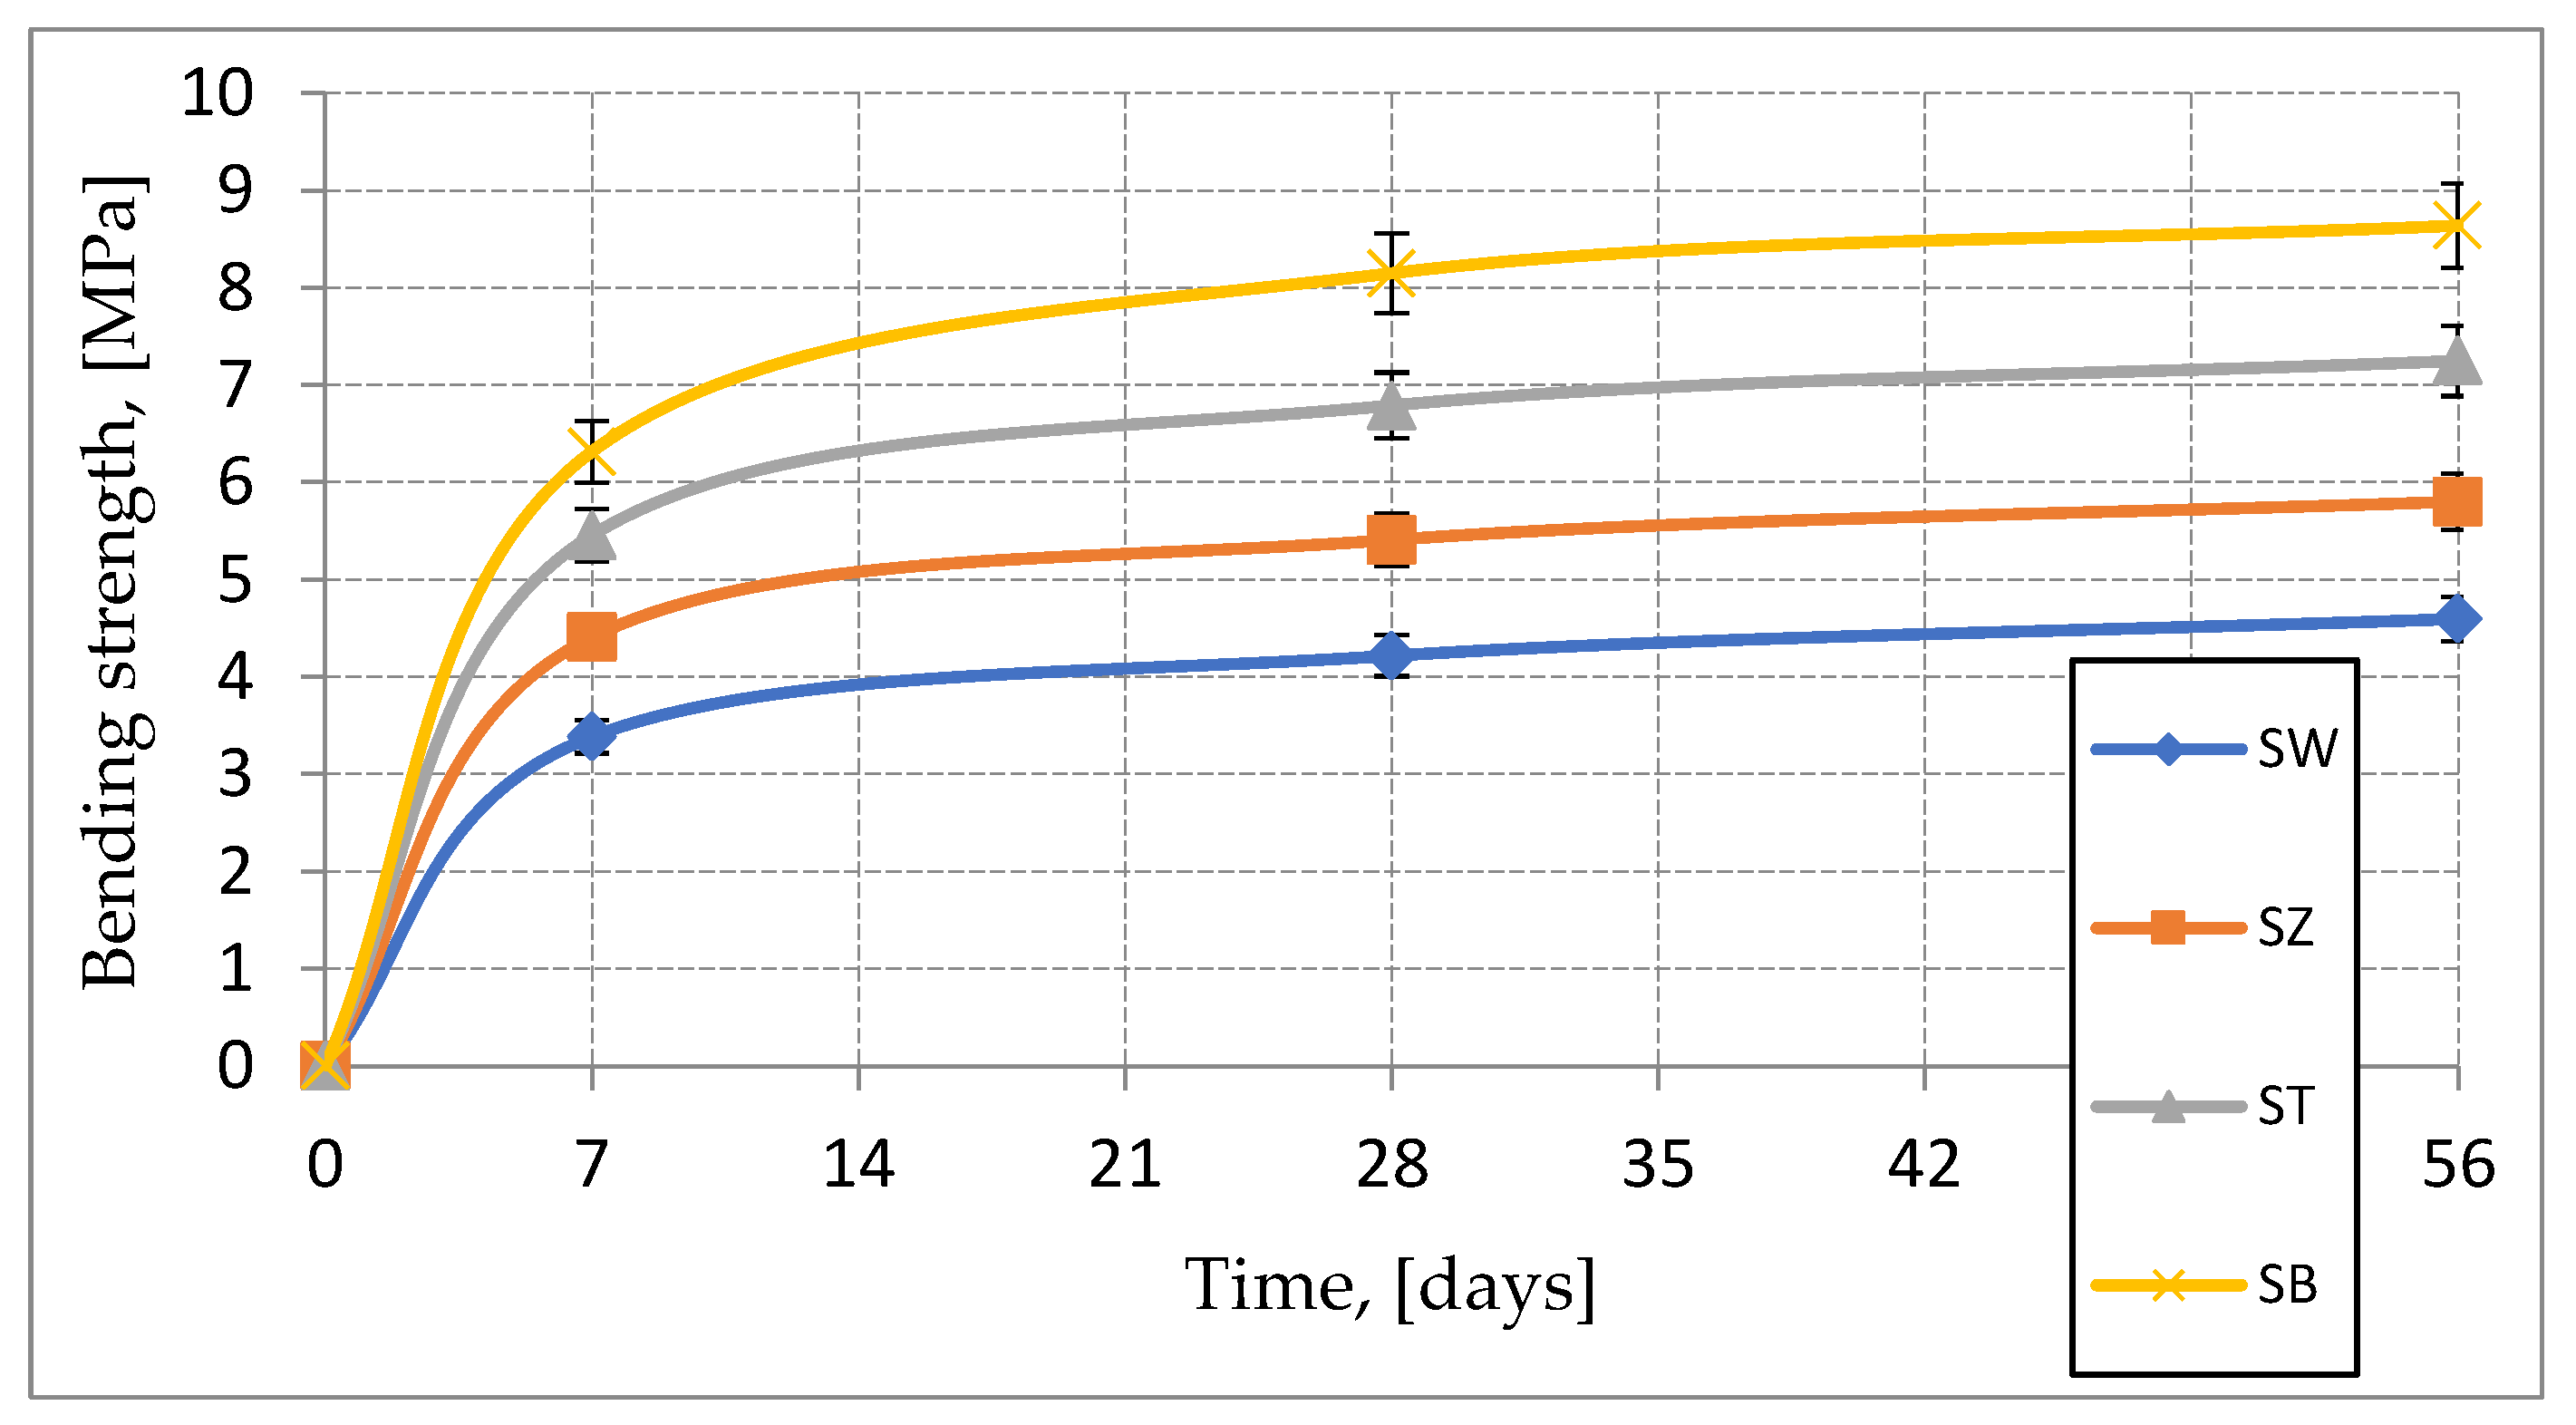
Figure 5.
Weight gain in capillary pull-up test, [kg/m2].
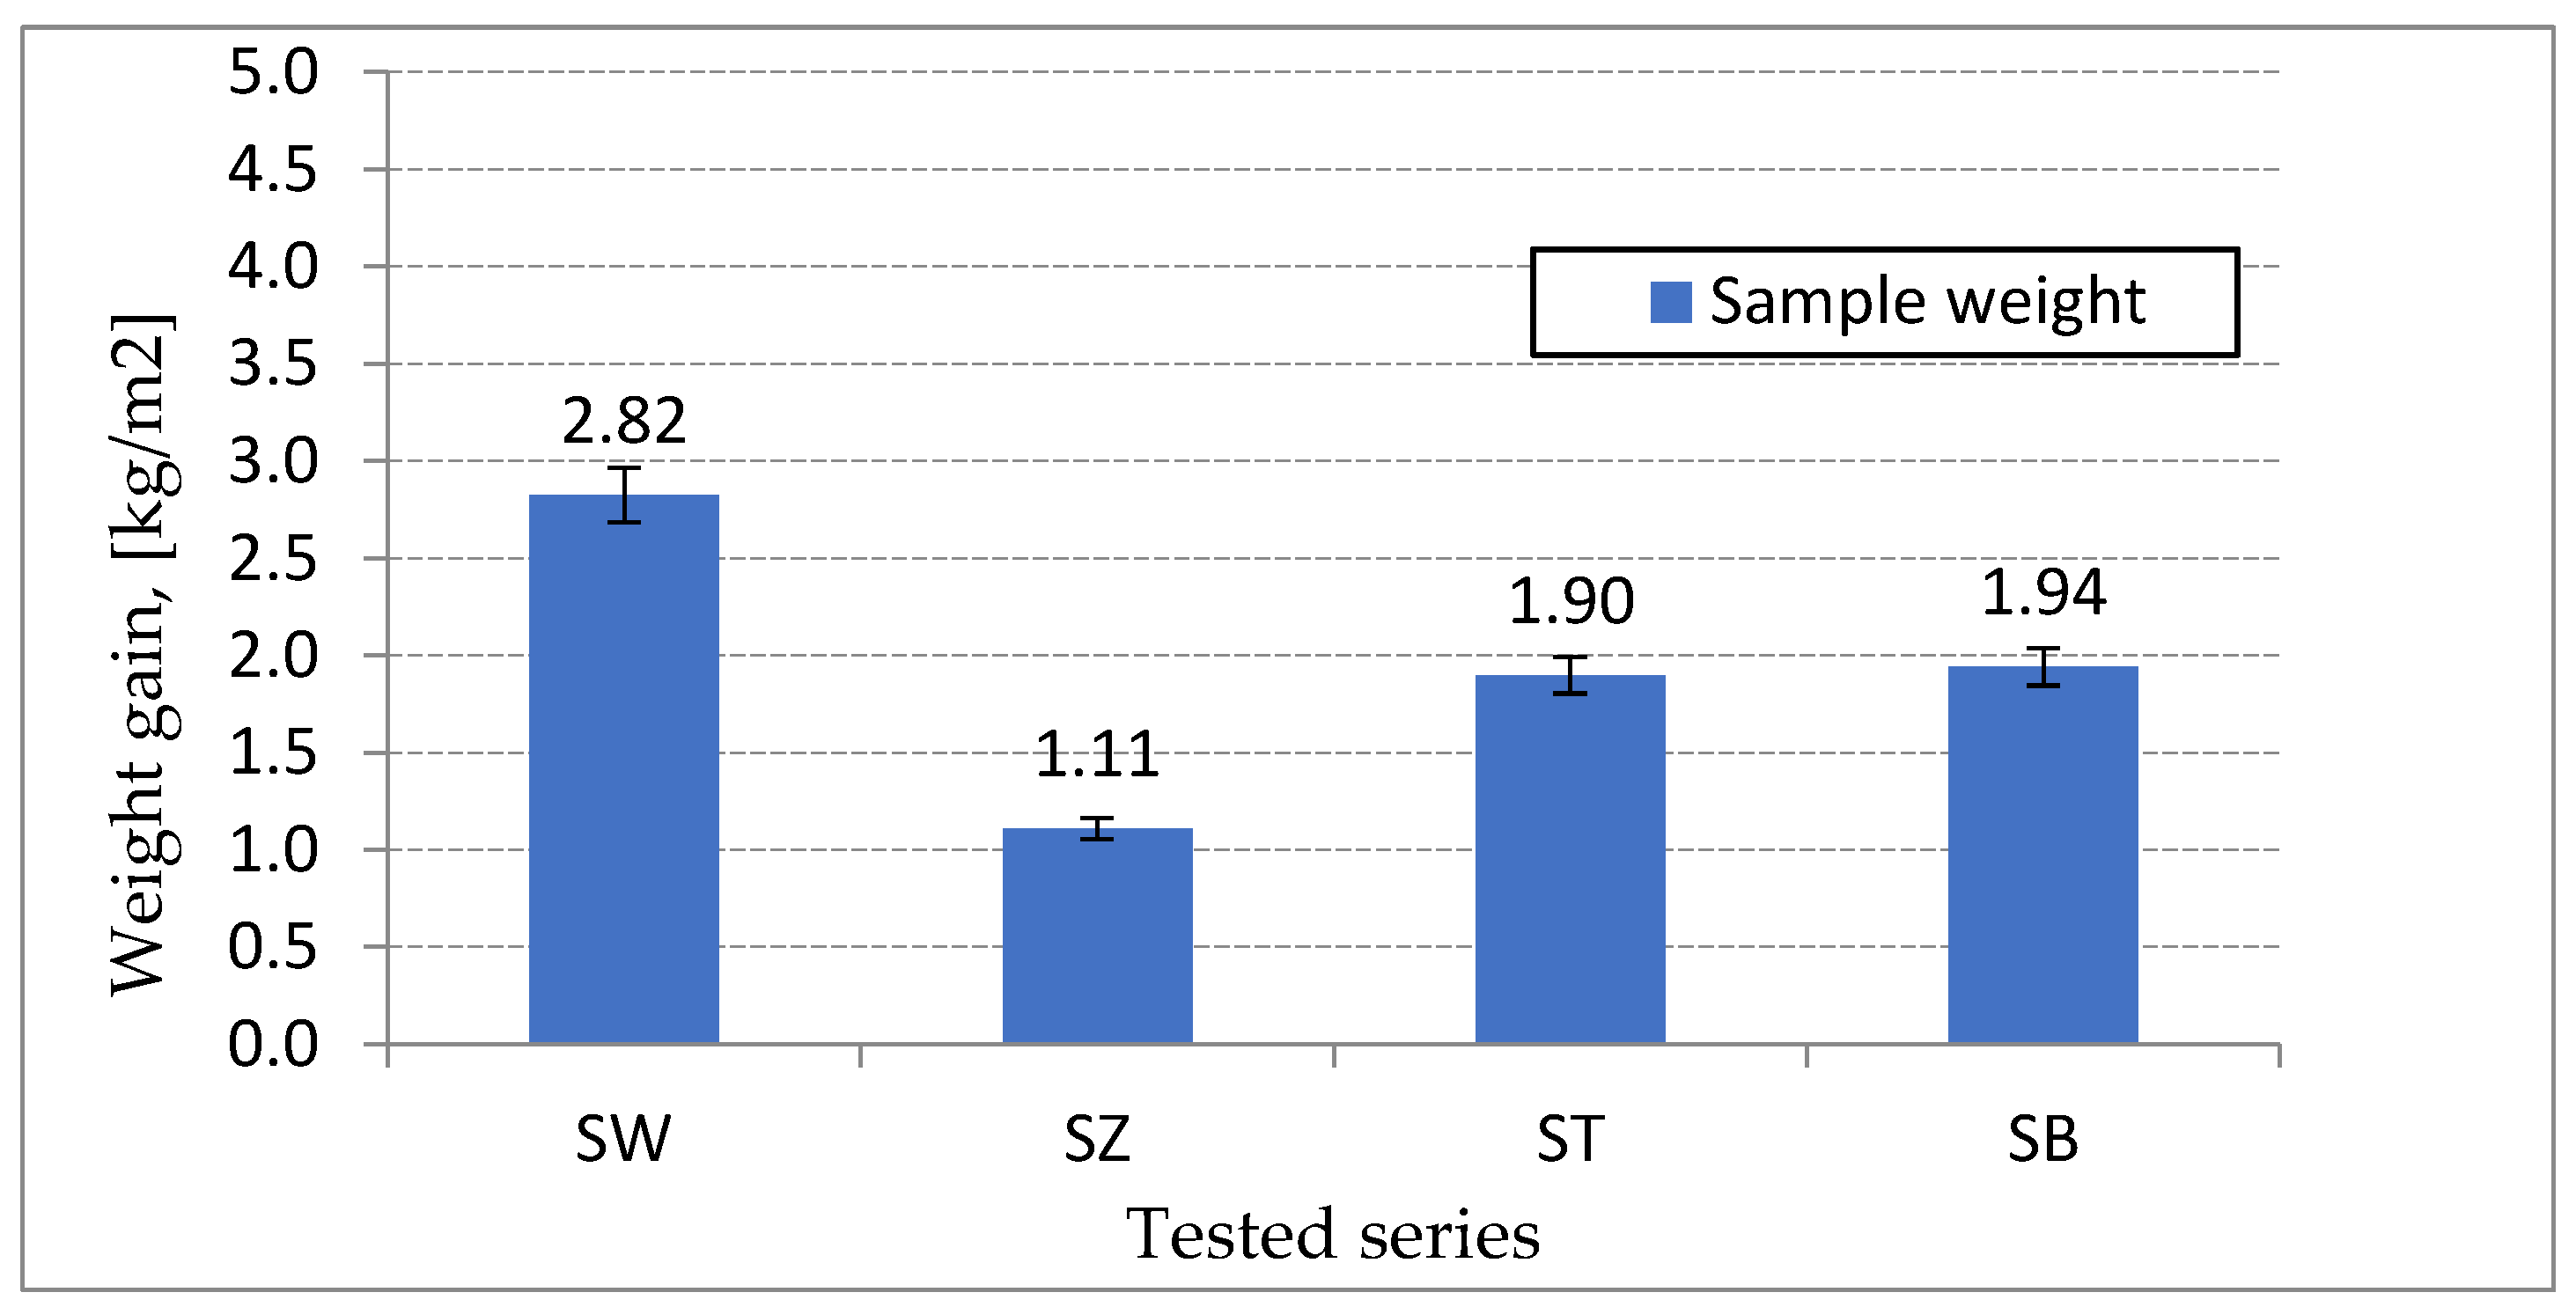
Figure 6.
Increase in weight of the tested series over time, [kg/m2].
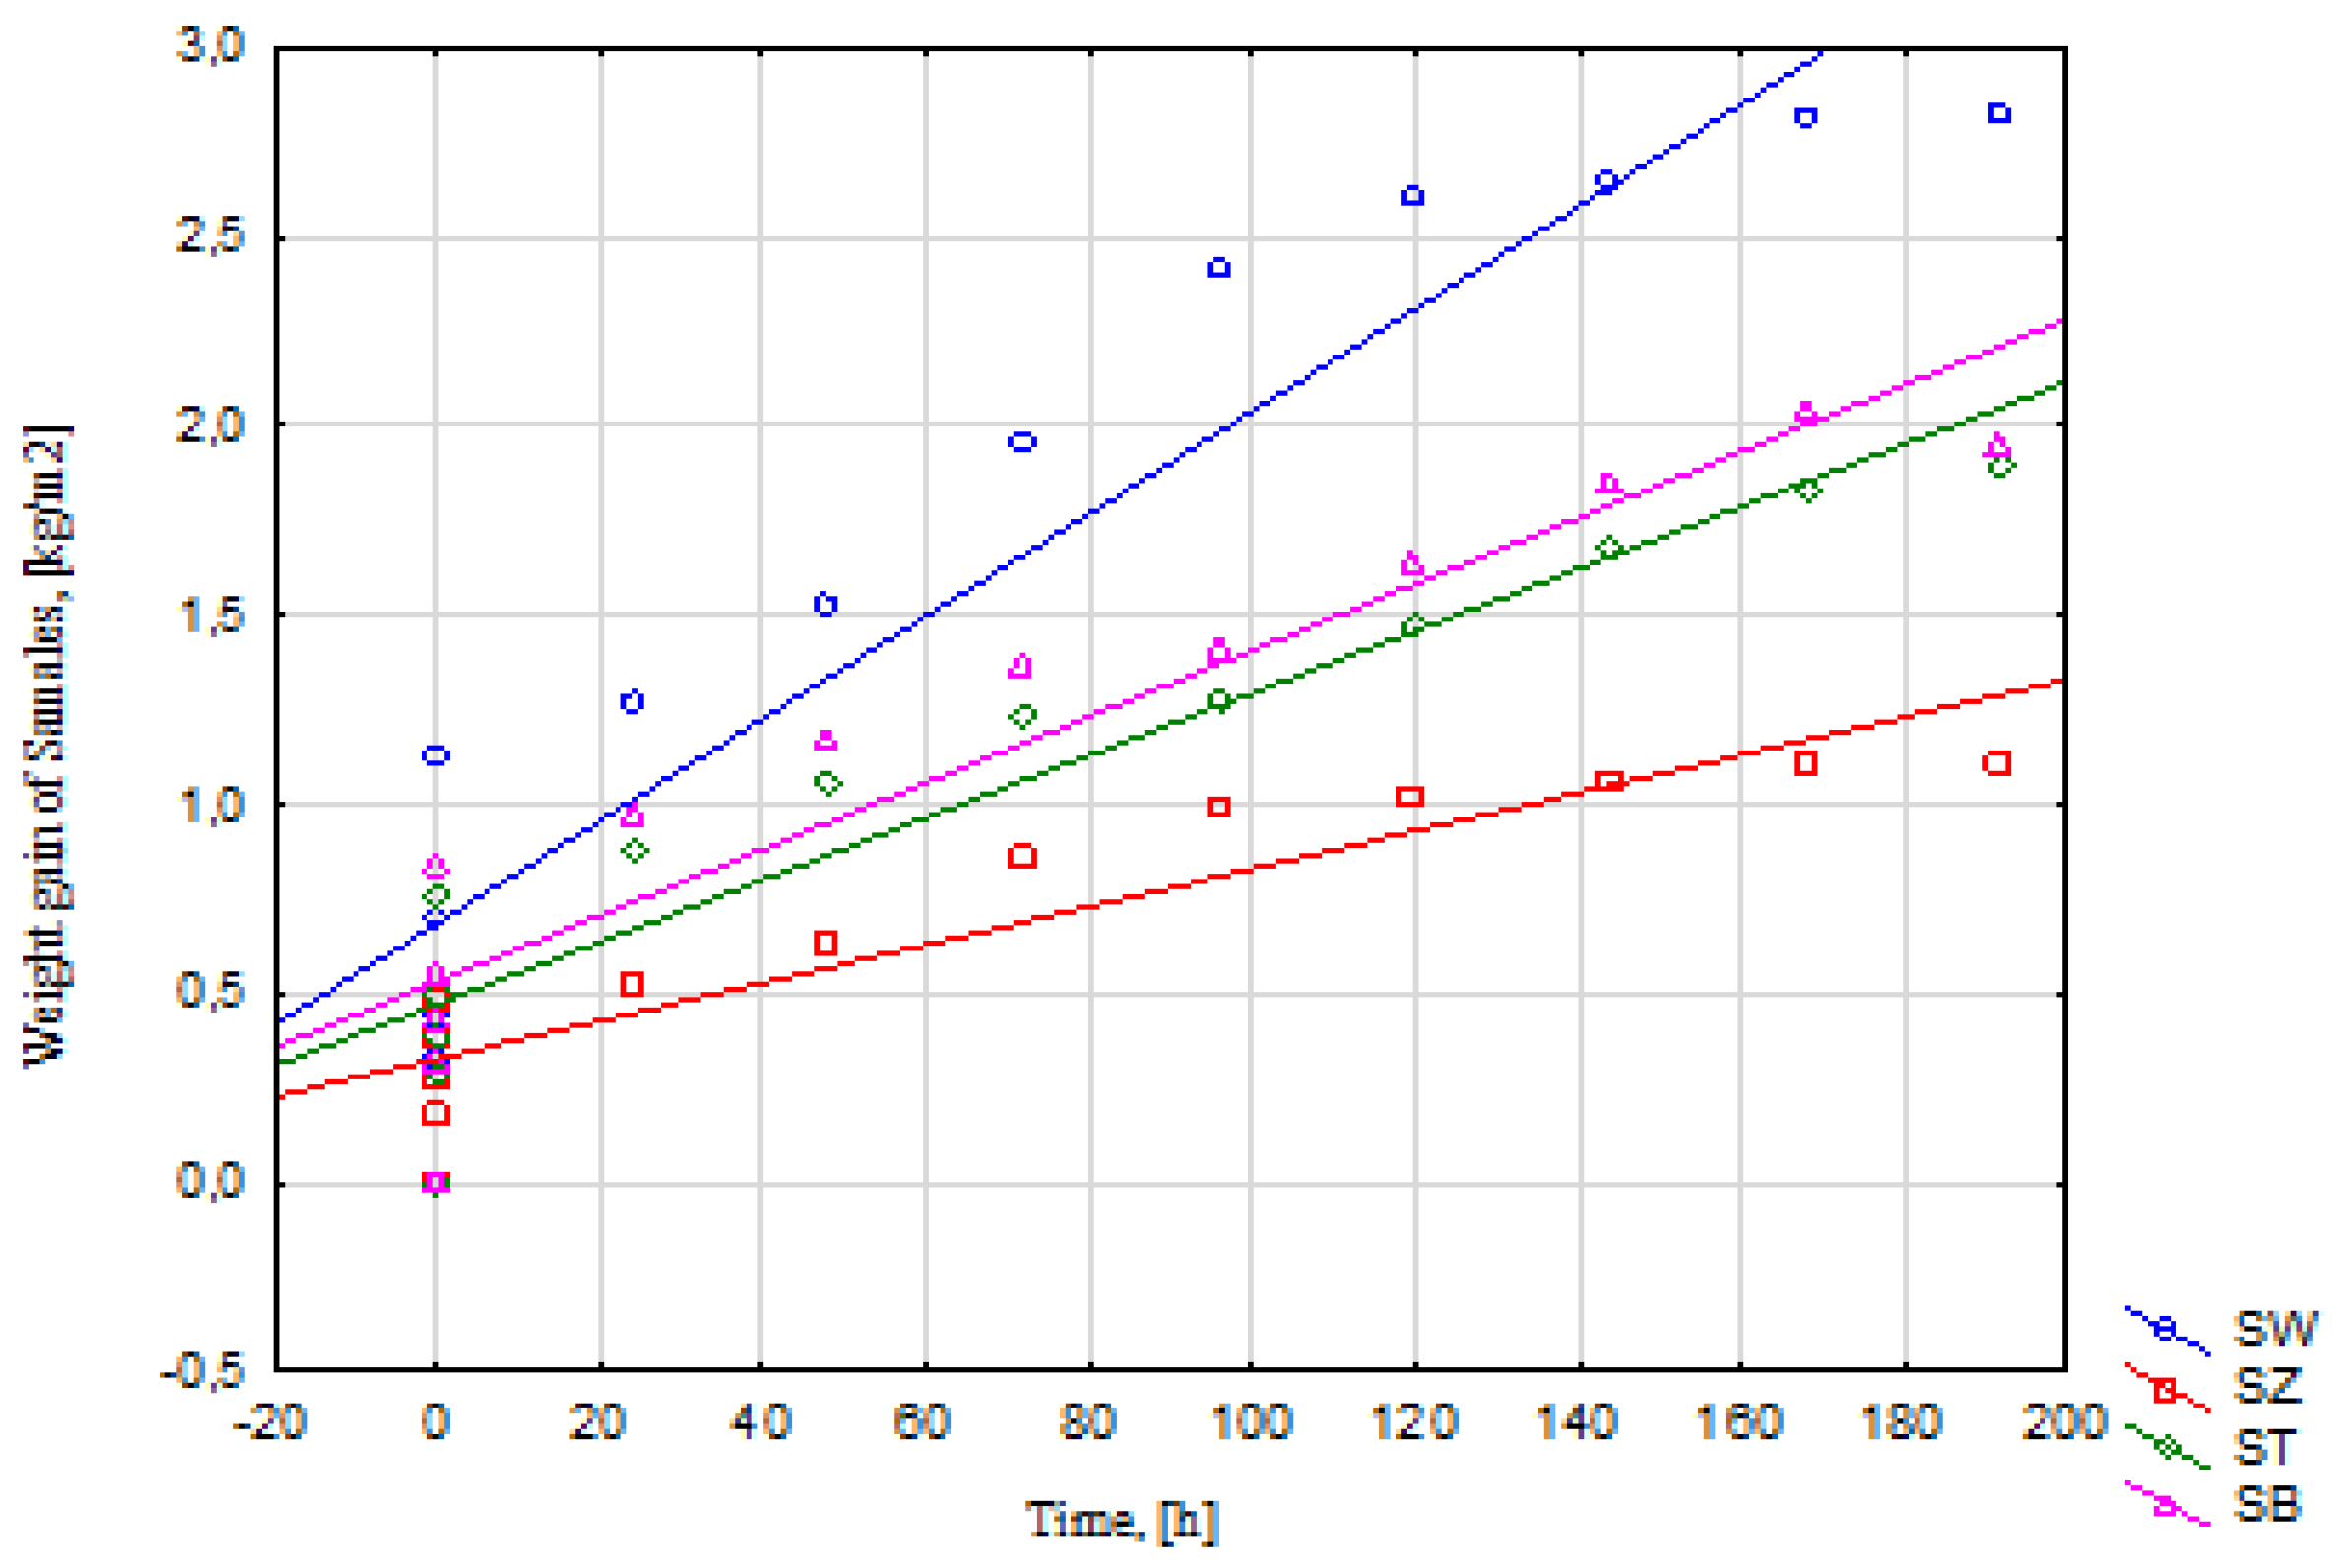
Figure 6.
Estimation of the statistical error for the series under study.
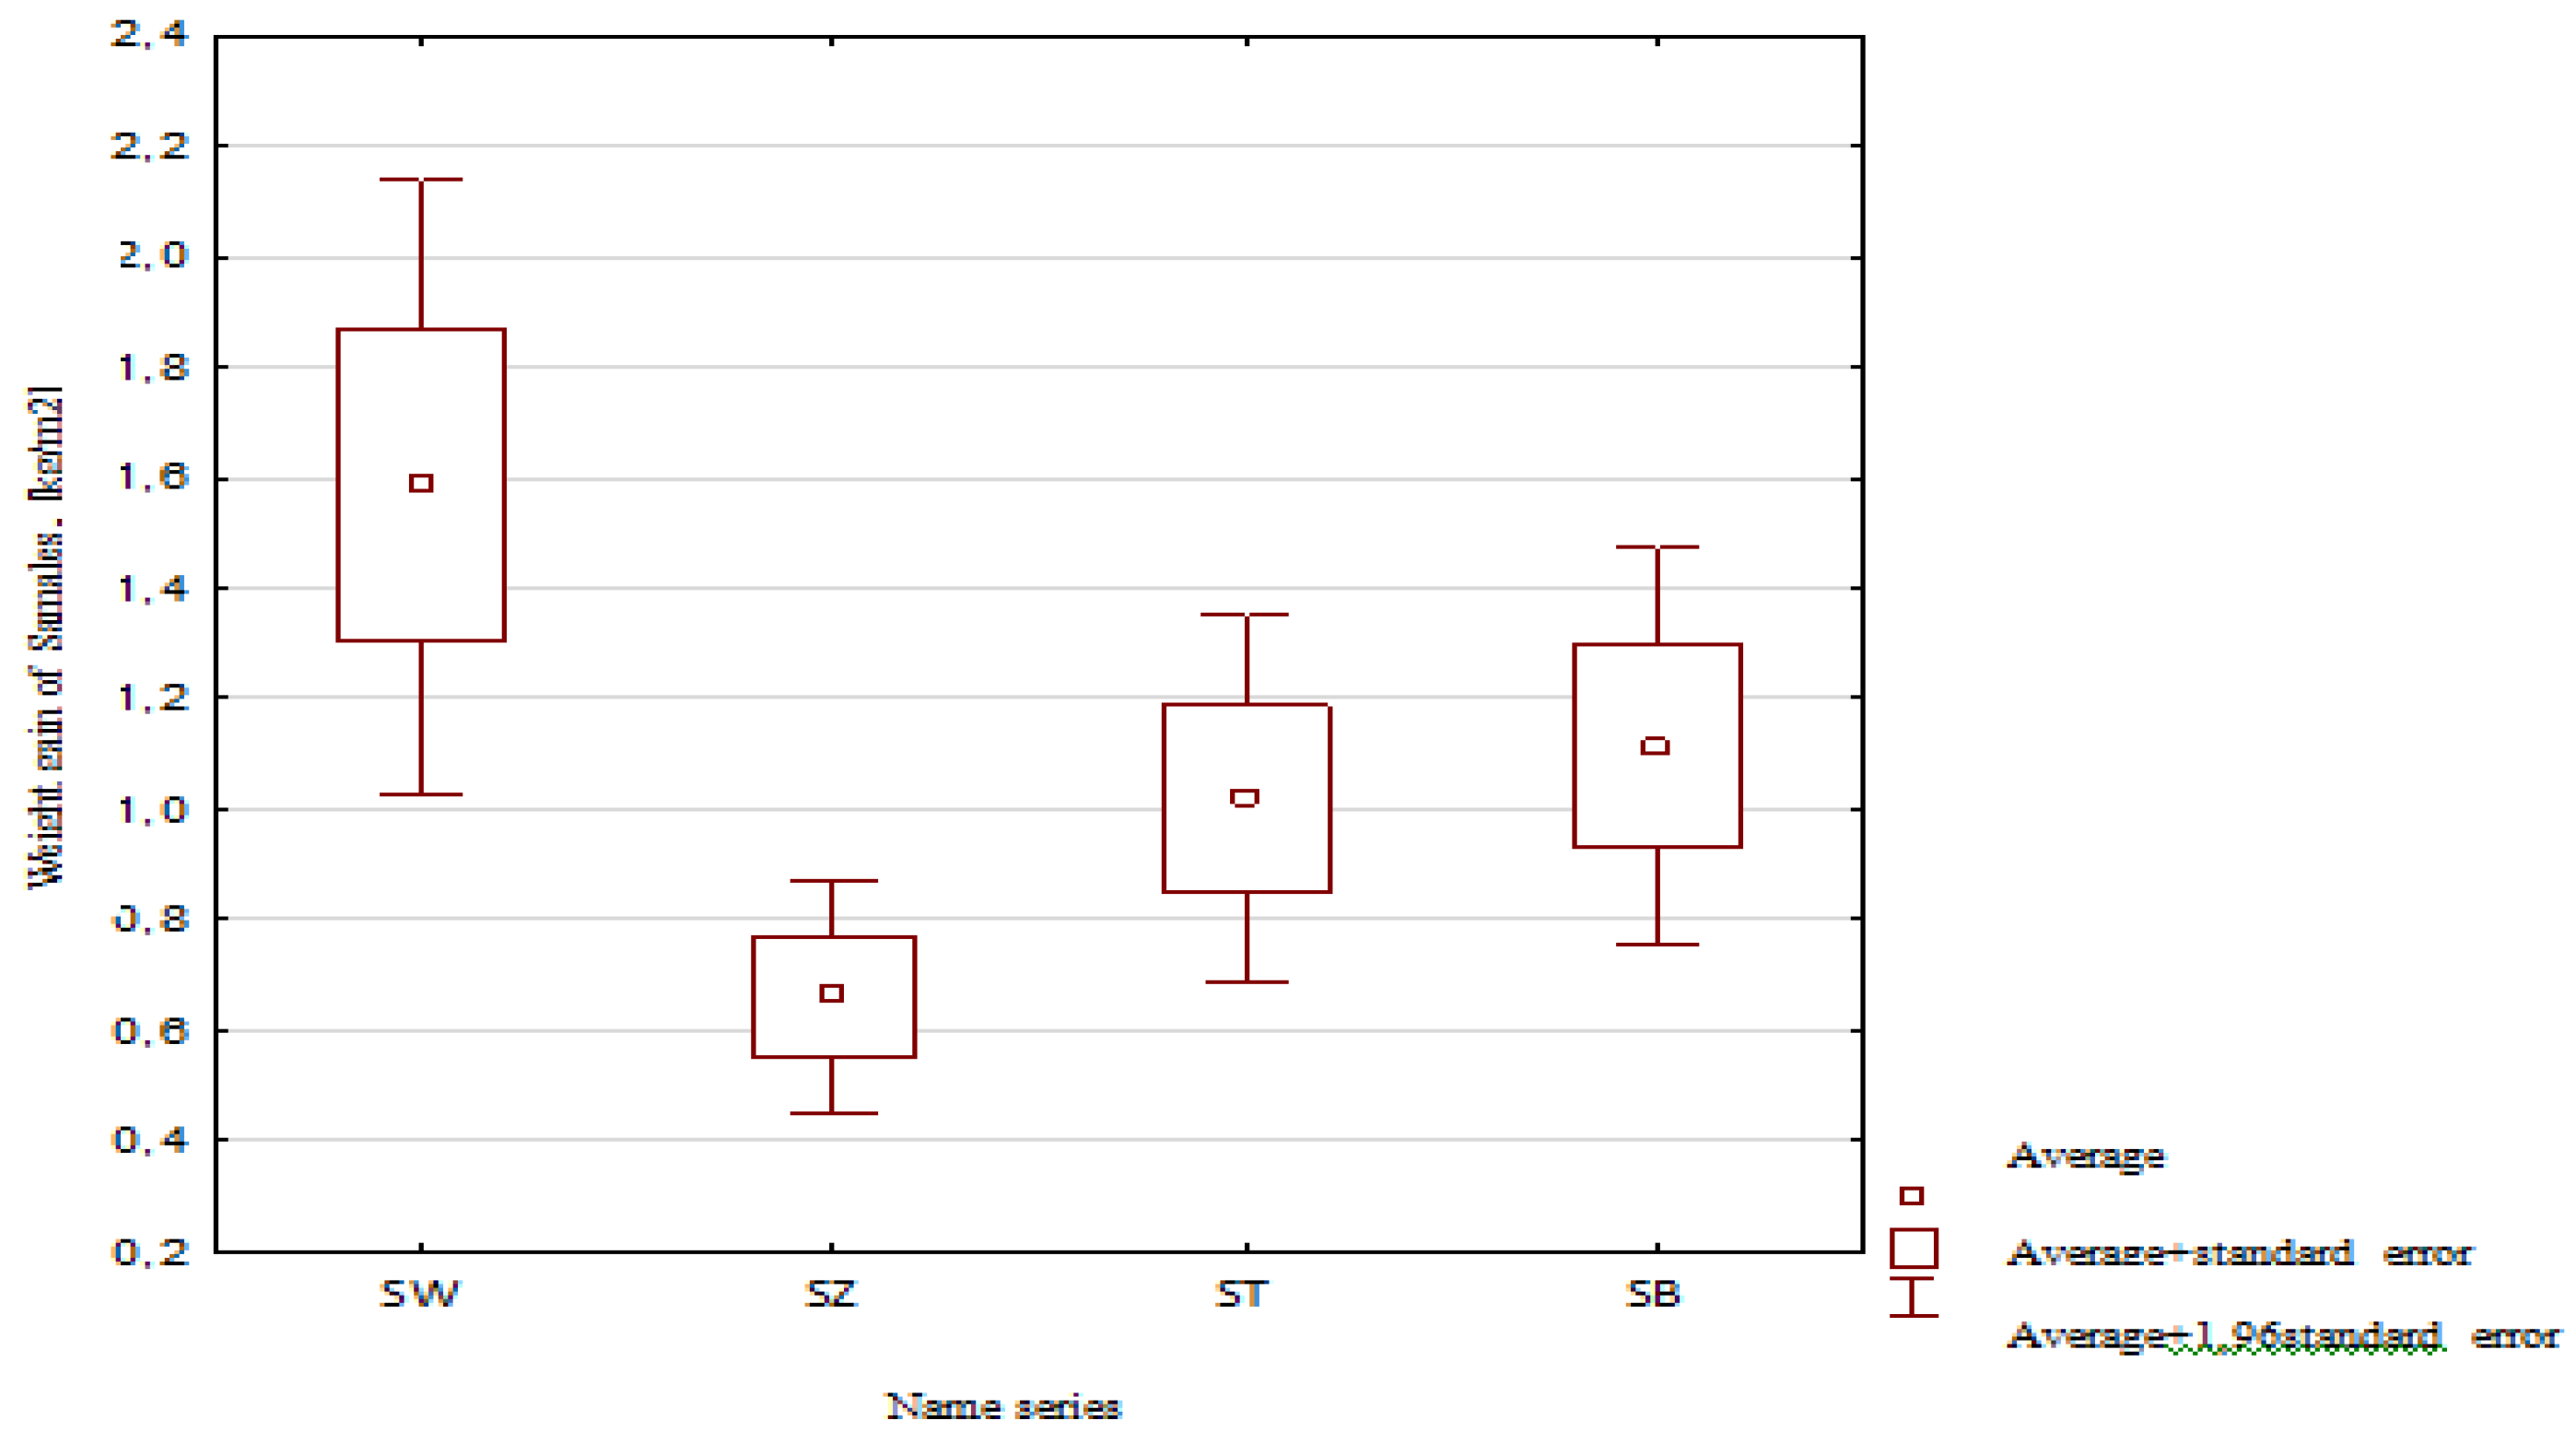
Figure 9.
Linear relationship between flexural strength and compressive strength.
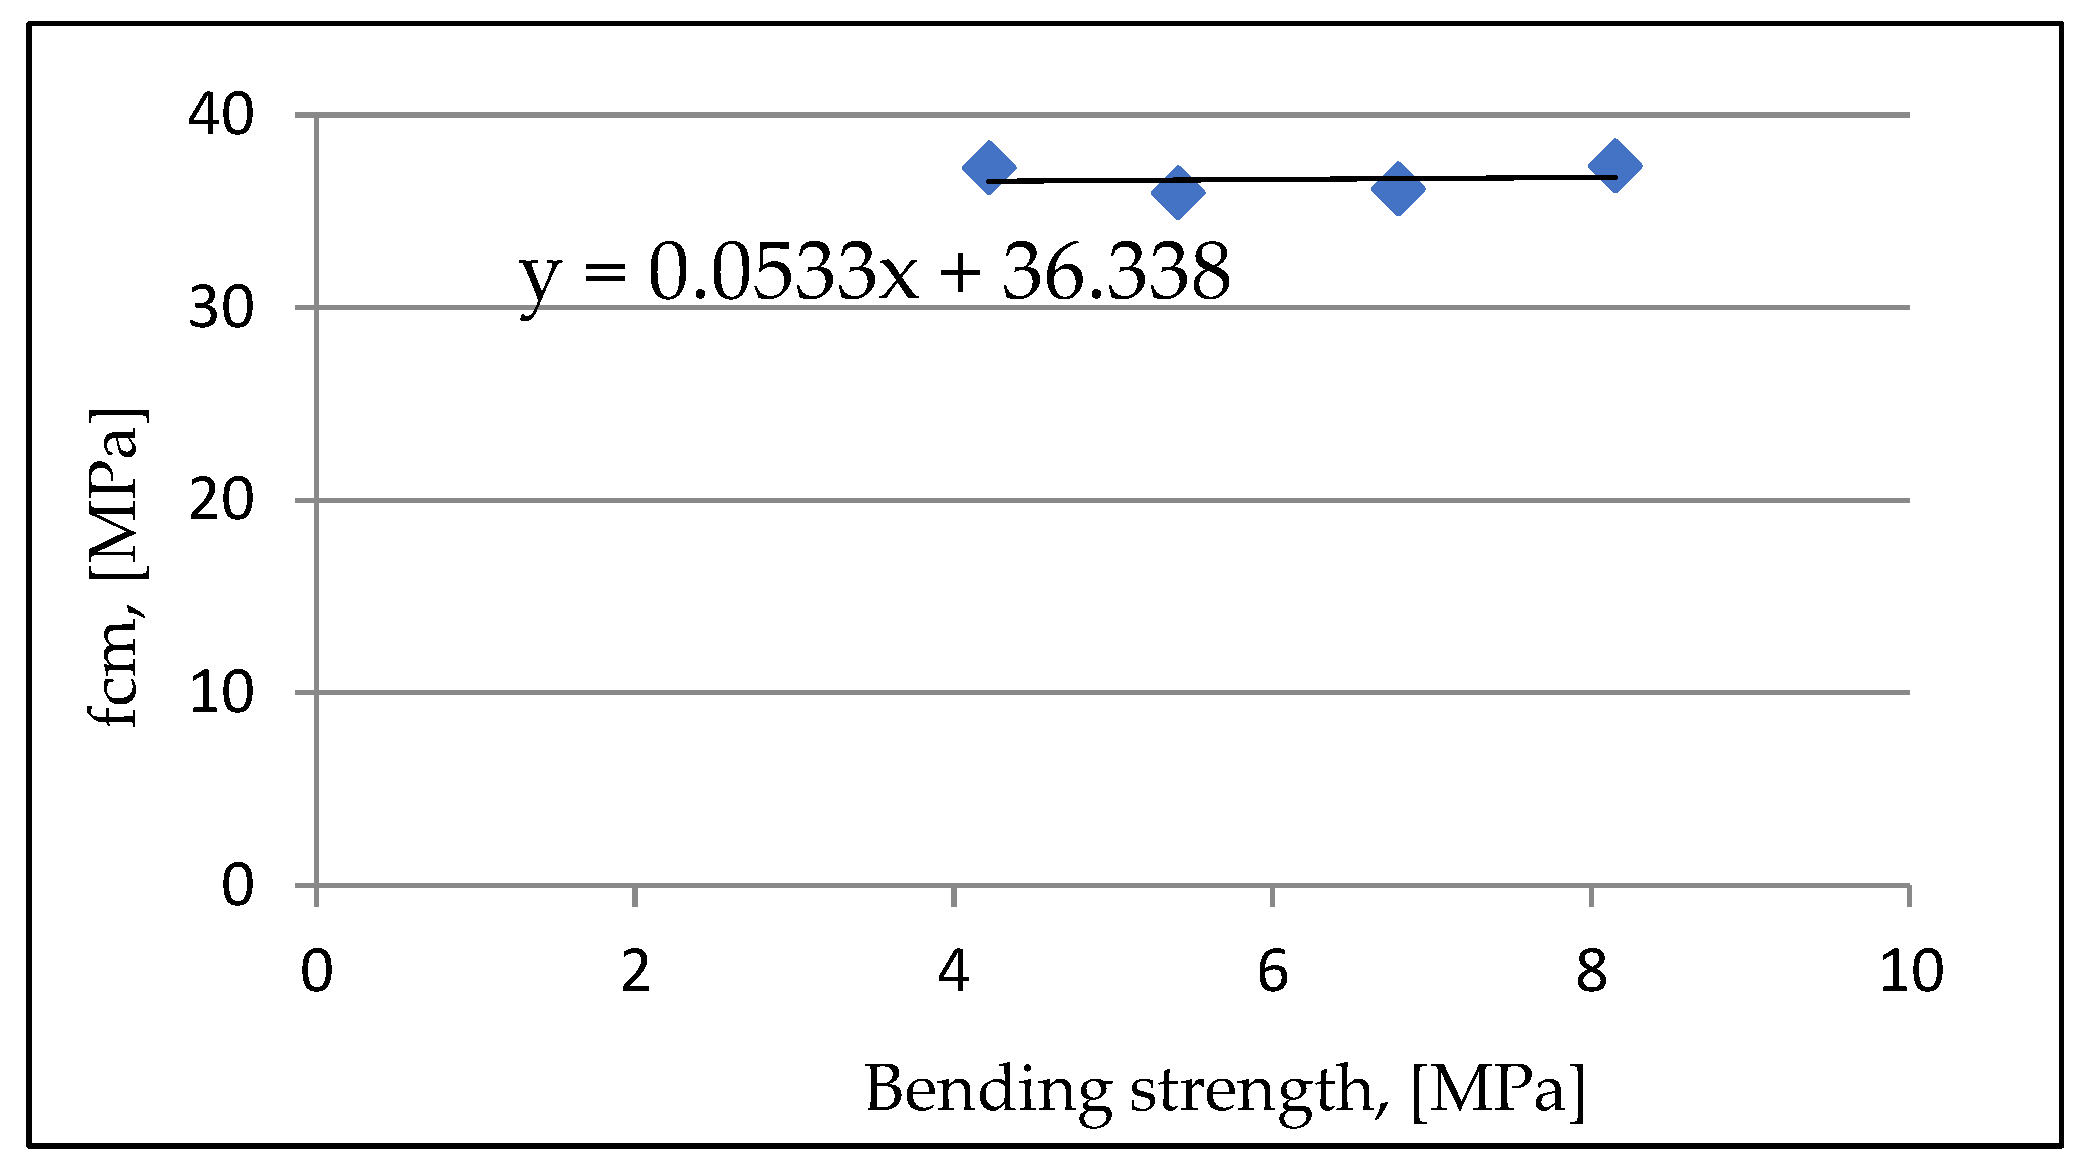
Figure 10.
Linear relationship absorbability and capillary rise of mortars.
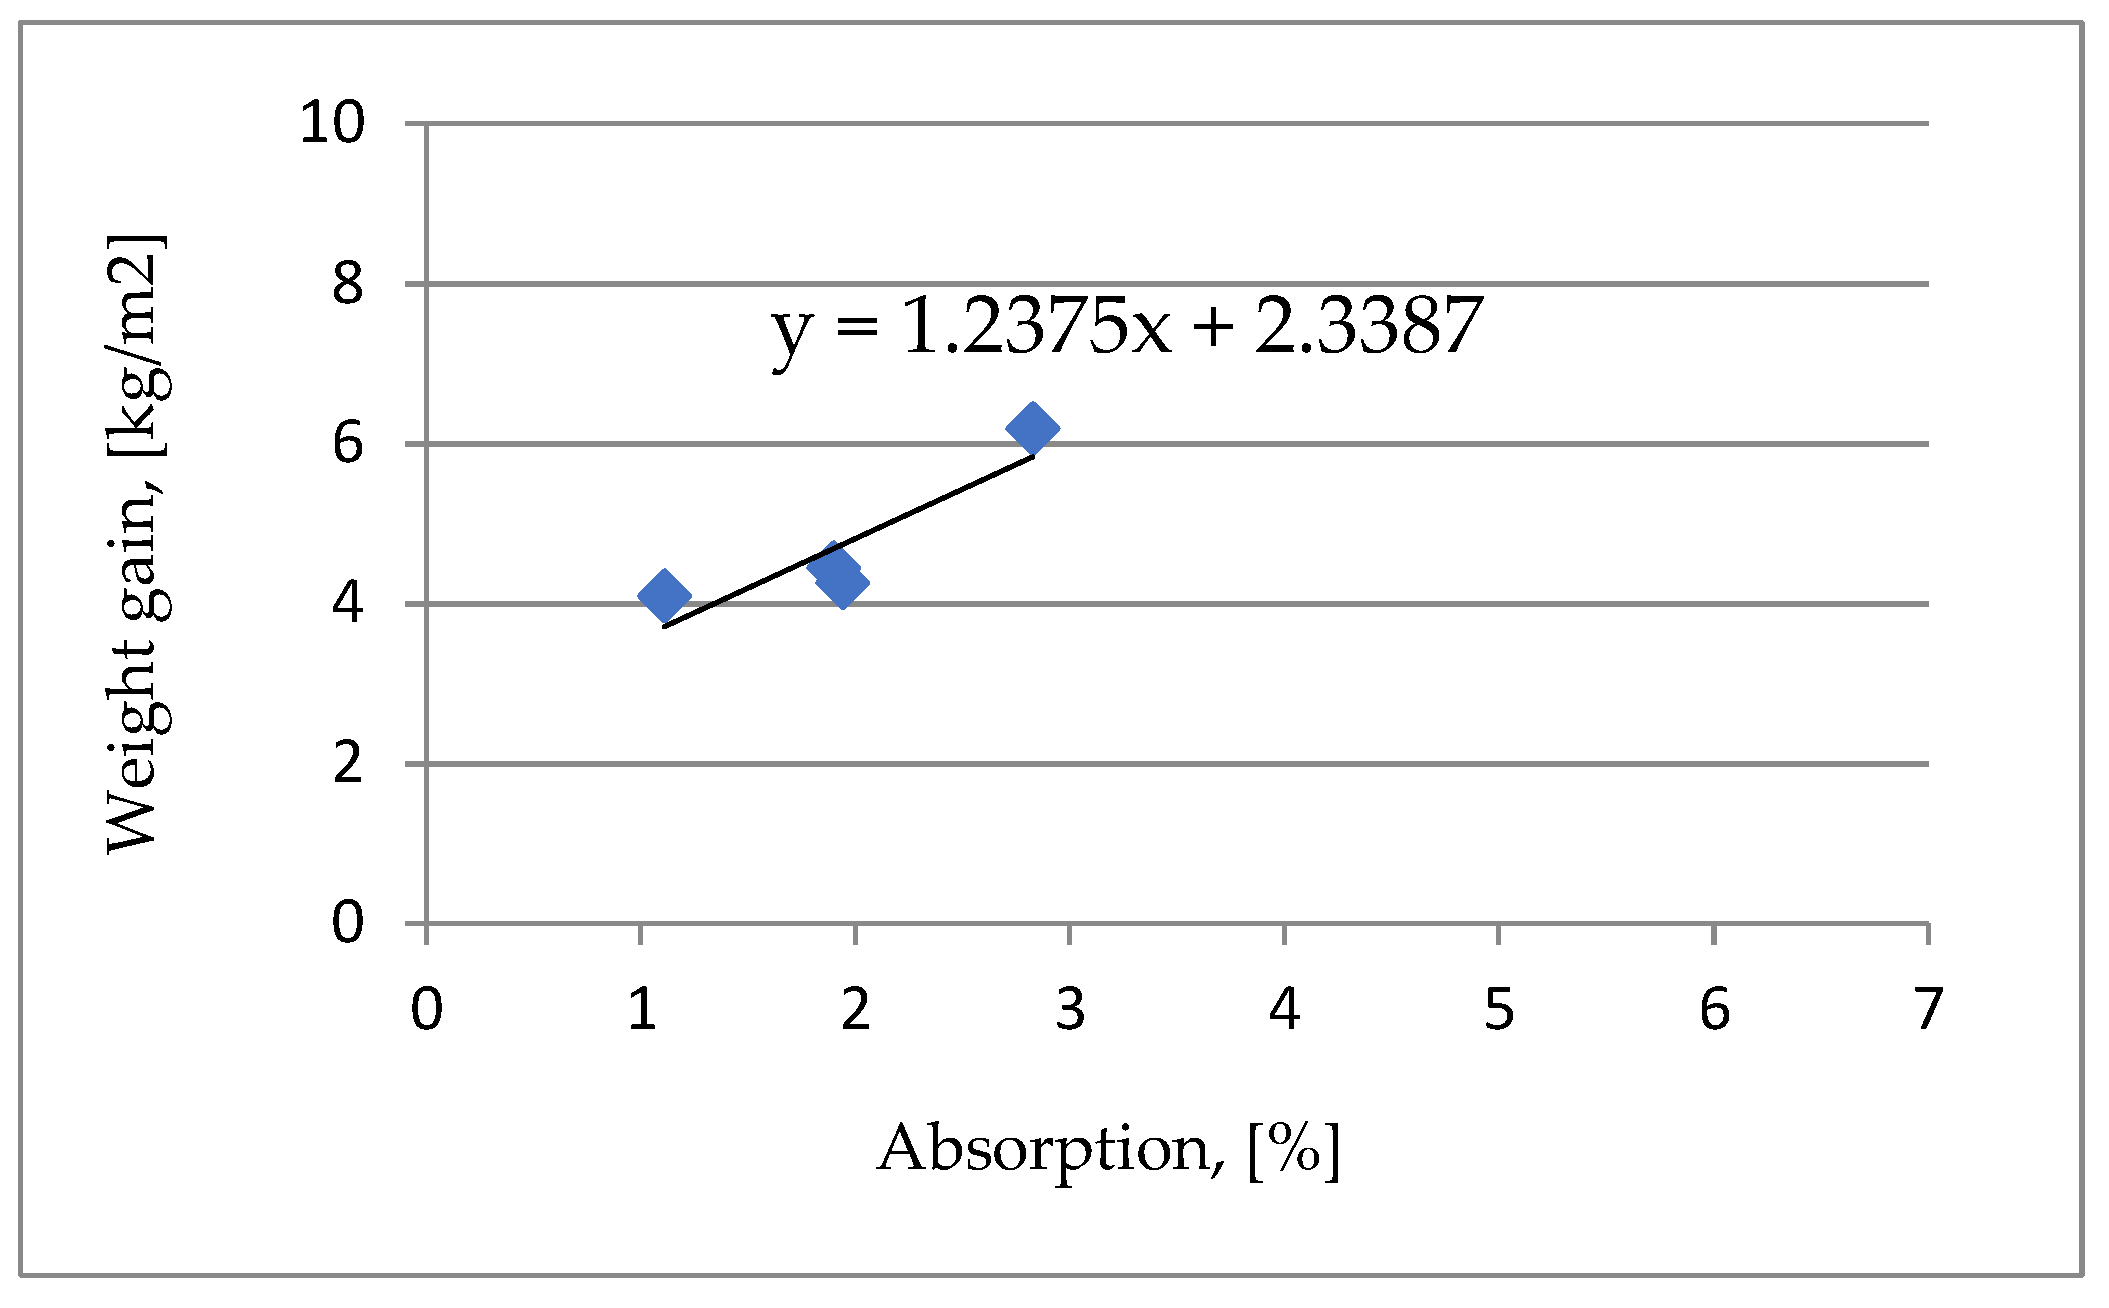

Table 1.
Basic information about the properties of cement [32].
Table 1.
Basic information about the properties of cement [32].
| No. | Name | Chemical composition, % | Specific surface area | fcm, MPa | |||||
|---|---|---|---|---|---|---|---|---|---|
| SiO2 | CaO | MgO | Fe2O3 | Al2O3 | cm2/g | R2 | R28 | ||
| 1 | CEM I 42,5R | 19,84 | 63,2 | 2,08 | 2,72 | 4,65 | 4086 | 32,0 | 53,0 |
Table 2.
Results of spreading measurements of the tested mortars.
| Series name | Spreading, [mm] |
|---|---|
| SW | 115 |
| ST | 107 |
| SZ | 105 |
| SB | 110 |
Table 3.
Results of volumetric density.
| Series name | Volumetric density, [g/cm3] |
|---|---|
| SW | 1,80 |
| ST | 2,06 |
| SZ | 1,94 |
| SB | 2,01 |
Table 4.
Statistical analysis ANOVA test.
| SW | SZ | ST | SB | Analysis of variance | |||
|---|---|---|---|---|---|---|---|
| ± s | ± s | ± s | ± s | F | p | ||
| 7 days | 17,37 ± 0,90 | 14,46 ± 0,52 | 15,97 ± 0,82 | 16,03 ± 0,76 | 14,65 | <0,001 | |
| 28 days | 37,23 ± 1,68 | 35,93 ± 1,46 | 35,81 ± 1,76 | 37,49±1,05 | 1,98 | 0,149 | |
| 56 days | 41,36 ± 3,31 | 41,06 ± 2,17 | 39,65 ± 1,04 | 39,45±1,94 | 1,11 | 0,370 | |
Table 5.
Tukey’s post-hoc multiple comparison tests (after 7 days).
| SW | SZ | ST | SB | |
|---|---|---|---|---|
| SW | <0,001 | 0,023 | 0,029 | |
| SZ | <0,001 | 0,013 | 0,010 | |
| ST | 0,023 | 0,013 | 0,999 | |
| SB | 0,029 | 0,010 | 0,999 |
Table 6.
Static analysis ANOVA test repeated measures.
| po 7 dniach | po 28 dniach | po 56 dniach | Analysis of variance | ||
|---|---|---|---|---|---|
| ± s | ± s | ± s | F | p | |
| SW | 17,37 ± 0,90 | 37,23 ± 1,68 | 41,36 ± 3,31 | 151,08 | <0,001 |
| SZ | 14,46 ± 0,52 | 35,93 ± 1,46 | 41,06 ± 2,17 | 370,25 | <0,001 |
| ST | 15,97 ± 0,82 | 35,81 ± 1,76 | 39,65 ± 1,04 | 635,83 | <0,001 |
| SB | 16,03 ± 0,76 | 37,49 ± 1,05 | 39,45 ± 1,94 | 460,73 | <0,001 |
Table 7.
Tukey’s post-hoc multiple comparison tests (SW).
| 7 days | 28days | 56days | |
|---|---|---|---|
| 7 days | <0,001 | <0,001 | |
| 28 days | <0,001 | 0,046 | |
| 56 days | <0,001 | 0,046 | |
Table 8.
Tukey’s post-hoc multiple comparison tests (SZ).
| 7 days | 28 days | 56 days | |
|---|---|---|---|
| 7 days | <0,001 | <0,001 | |
| 28 days | <0,001 | 0,002 | |
| 56 days | <0,001 | 0,002 | |
Table 9.
Tukey’s post-hoc multiple comparison tests (ST).
| 7 days | 28 days | 56 days | |
|---|---|---|---|
| 7 days | <0,001 | <0,001 | |
| 28 days | <0,001 | 0,001 | |
| 56 days | <0,001 | 0,001 | |
Table 10.
Tukey’s post-hoc multiple comparison tests (SB).
| 7 days | 28 days | 56 days | |
|---|---|---|---|
| 7 days | <0,001 | <0,001 | |
| 28 days | <0,001 | 0,105 | |
| 56 days | <0,001 | 0,105 | |
Table 11.
Statistical analysis Pearson correlation test. Time versus weight gain of samples over the study period for the series: SW, SZ, ST, SB.
Table 11.
Statistical analysis Pearson correlation test. Time versus weight gain of samples over the study period for the series: SW, SZ, ST, SB.
| r | t | p | |
|---|---|---|---|
| Time and SW | 0,94 | 8,85 | <0,001 |
| Time and SZ | 0,92 | 7,84 | <0,001 |
| Time and ST | 0,95 | 9,63 | <0,001 |
| Time and SB | 0,94 | 8,78 | <0,001 |
Table 12.
Statistical analysis FWelch test.
| SW | SZ | ST | SB | Analysis of variance | ||
|---|---|---|---|---|---|---|
| ± s | ± s | ± s | F Welcha | p p p | ||
| Weight gain of samples [kg/m2] | 1,59±1,02 | 0,66±0,38 | 1,02±0,61 | 1,11±0,66 | 4,01 | 0,018 |
Table 13.
Tukey’s RIR post-hoc multiple comparison tests (weight gain of samples).
| SW | SZ | ST | SB | |
|---|---|---|---|---|
| SW | 0,009 | 0,188 | 0,336 | |
| SZ | 0,009 | 0,576 | 0,373 | |
| ST | 0,188 | 0,576 | 0,986 | |
| SB | 0,336 | 0,373 | 0,986 |
Disclaimer/Publisher’s Note: The statements, opinions and data contained in all publications are solely those of the individual author(s) and contributor(s) and not of MDPI and/or the editor(s). MDPI and/or the editor(s) disclaim responsibility for any injury to people or property resulting from any ideas, methods, instructions or products referred to in the content. |
© 2024 by the authors. Licensee MDPI, Basel, Switzerland. This article is an open access article distributed under the terms and conditions of the Creative Commons Attribution (CC BY) license (http://creativecommons.org/licenses/by/4.0/).
Copyright: This open access article is published under a Creative Commons CC BY 4.0 license, which permit the free download, distribution, and reuse, provided that the author and preprint are cited in any reuse.


