
Submitted:
31 December 2024
Posted:
03 January 2025
You are already at the latest version
Abstract
Although significant progress has been made in recent years regarding jumping biomechanics of agility dogs, there is still a lack of data on the specific biomechanical pattern of the jump. The main objective of the present study was to describe the biomechanic variables involved in the jumping pattern of agility dogs, analyzing both intra- and inter-individual variability. Eleven agility dogs were analyzed while jumping over a 60-cm hurdle. Results of low or acceptable and similar intra and inter-individual coefficients of variation obtained in variables such as percentage of take-off and landing distances, percentages of take-off and landing durations, maximum jump height, jump height at the hurdle and percentage duration to maximum jump height, may indicate these variables as components of a general biomechanical pattern of jumping in agility dogs. Low or acceptable and consistent intra- and inter-individual variation observed in variables such as percentage of take-off and landing distances, percentages of take-off and landing durations, maximum jump height, jump height at the hurdle, and percentage duration to maximum jump height suggests that these variables could represent key elements of a general biomechanical jumping pattern in agility dogs. This stability, maintained across multiple jumps by the same dog and across different dogs, highlights their potential as reliable indicators of a shared biomechanical framework for jumping. Lower intra-individual than interindividual coefficients of variation obtained in most of the angular variables, jump distance, jump duration and speed, take-off, and landing distances, and jump heights at take-off and at landing indicate these variables as related with the individual technique of each animal. All of this data can be used in the design of training plans as well as when monitoring the progress of canine athletes.
Keywords:
dog
; jumping
; biomechanics
; agility
; jump pattern
1. Introduction
Agility competition is becoming more and more relevant in the field of canine sport. To compete successfully, agility dogs are trained to clear the obstacles at high speed with the least possible effort (Alcock et al., 2015; Birch et al., 2015b; Daniels & Burn, 2018; Miró et al., 2020; Pfau et al., 2011; C. Zink, 2018; M. C. Zink & Daniels, 1996; M. C. Zink & Van Dyke, 2013). Injuries in agility dogs are common (Cullen, 2014; Levy et al., 2009; Pechette Markley et al., 2024). According to different authors, many of these injuries result from a lack of understanding of the biomechanics involved when dogs jump over obstacles, so a thorough understanding of these biomechanics may help preventing such injuries (Cullen, 2014; Söhnel et al., 2020, 2021).
In animals, the initial studies on jumping biomechanics were carried out in horses, providing detailed descriptions of the phases of jumping (Clayton, 1989; Clayton et al., 1996; Clayton & Barlow, 1991; Galloux & Barrey, 2010) and studying the influence of different variables on the process (Powers & Harrison, 2000). In dogs, studies on this field began in the 1990s by M. C. Zink & Daniels (1996) and were based on the observations and references of horse and human biomechanics.
The studies on free jumping horses are better comparable to the situation that occurs in dogs (Bobbert et al., 2005; Santamaría, 2004), as the rider has a significant effect on the successful horse jump (Powers & Harrison, 2002, 2000) and this effect is not present in agility dogs.
Currently, the studies of biomechanics of jumping dogs have focused on the effect of different aspects. Daniels & Burn (2018) presented a descriptive theoretical model taking into account the dog´s center of gravity and height (Söhnel et al., 2017, 2020). These studies raised the importance of tissue stiffness, limb length and limb dynamics and as objective measures of the agility skill level. Others have focused on the importance of different angles (Alcock et al., 2015; Pfau et al., 2011), experience and running technique (Birch et al., 2015b) and landing dynamics (Pfau et al., 2011; Söhnel et al., 2017) as key factors for optimal jumping. In the author´s opinion, there are no in-depth descriptive studies on the variables associated with the general jumping pattern of agility dogs. A detailed descriptive study could significantly contribute to the understanding of the biomechanics involved in this activity, facilitating not only a better understanding of its functional dynamics, but also aiding in the prevention and detection of injuries.
The main objective of this study was to describe the variables involved in the jumping pattern during the suspension phase in agility dogs analyzing intra- and inter-individual Coefficient of variation.
2. Materials and Methods
The study was approved by the Ethics Committee of the Veterinary Teaching Hospital of the Complutense University of Madrid, Spain (UCM10/2020). Informed consents based on clear and detailed information about the research were signed by the dog´s owners previously to the study.
2.1. Animals
Eleven agility dogs competing in large category (height of 48 cm or more at the withers- Fédération Cynologique Internationale (FCI), (Claes, 2020) were analyzed while jumping over a 60-cm hurdle through a videobased analysis system. All dogs were free of any pain or lameness. Data of breed, and height to the withers were taken before the jumping trials and weight to height ratios were calculated for each dog. All the above data are shown in Table 1.
2.2. Measurement Protocol and Data Analysis
All dogs were filmed during the same session in an indoor dog agility course (Connecting dogs agility training center, Girona, Spain) equipped with artificial grass turf, jumping over a 60-cm hurdle in a systematize environment. After their normal warm-up routine, all dogs one by one performed a series of jumps. Dogs standing still at the starting point proceeded to jump when the handler, placed next to the hurdle, gave them their usual command. After hurdle clearance the dogs entered an agility tunnel, which ensured straight and stable jumps.
As shown schematically in Figure 1, an experimental setup was created to standardize the analysis. A 60-cm hurdle was placed 10 meters away and in front of the starting point, and an agility tunnel with its entrance 8 meters behind the hurdle was disposed. Two cameras (Casio Exilim® EXZR100, Casio España, Barcelona, Spain) were used for data collection. One of the cameras (camera 1, Figure 1) was placed perpendicular to the left side of the line of movement, 4 meters away from the middle of the hurdle. The camera body was set on a tripod 0,95 meters in height. The zoom lens was adjusted to allow a 6-meter field of view, and shutter-speed was adjusted to 240fps. The other camera (Camera 2, Figure 1) was used for validation of the trials and was aligned with the line of motion behind the tunnel entrance. According to the recordings of this camera, trials in which the dog cleared the obstacle over the central third of the hurdle without touching the highest bar were declared valid. Four valid trials per dog were chosen for analysis. A 2D structure designed for calibration of the analysis system placed in the plane of movement at the center of the hurdle was recorded before trials.
Downstream data analysis was conducted using a validated video-based analysis system (UCOTrack®, (Garrido et al., 2006). A low-pass filter (Butterworth, sampling frequency 480 Hz, cutoff frequency 15 Hz) was used, as it has been found to be the more convenient to minimize methodological errors during the analysis (Schreven et al., 2015). The suspension phase of the jump was determined between take-off and landing events. Take-off was defined as the first frame with the trailing hind limb off the floor, and landing as the first frame where the leading forelimb first contacted the ground. Based on previously published studies (Alcock et al., 2015; Birch et al., 2015a, 2015b; Miró et al., 2020) the apparent anatomical references of the withers and the tuber sacrale of the ilium (prominent point of the hip bone) were marked along the jump in the series of video recordings. The moment where the dog´s withers was exactly on top of the hurdle was set as the reference point used to subdivide the suspension phase of the jump into the take-off and the landing phases. The back line, line between the osseous references of the withers and the tuber sacrale, and its inclination with respect to the horizontal plane, henceforth the back inclination angle, were automatically calculated by the system. The jump height, distance between the withers and the turf level, throughout the entire suspension phase of the jump, as well as linear and angular measurements were automatically calculated by the system. Temporal measurements were calculated based on the number of frames and the shutter speed.
2.3. Variables
Linear variables and abbreviations
Jump distance (JD): horizontal distance between the trailing hind paw on the ground at take-off and the leading forepaw at landing.
Take-off distance (DTO): horizontal distance between the trailing hind paw on the ground at take-off and the hurdle.
Landing distance (DLA): horizontal distance between the hurdle and the leading forepaw on the ground at landing.
Percentage of take-off distance (%DTO:): horizontal distance between the trailing hind paw on the ground at take-off and the hurdle, expressed in percentage of the jump distance.
Percentage of landing distance (%DLA): horizontal distance between the hurdle and the leading forepaw on the ground at landing, expressed in percentage of the jump distance.
Ratio landing/take-off distance (RD)
Jump height at take-off (HwTO): Vertical distance between the withers and the ground at take-off.
Jump height at landing (HwLA): Vertical distance between the withers and the ground at landing.
Jump height at the hurdle (HwF): Vertical distance between the withers and the ground when the withers is right over the hurdle.
Maximum jump height (maxJH): Maximum value of vertical distance between the withers and the ground throughout the entire jump.
Difference between maximum jump height and jump height at the hurdle (maxJH-HwF).
Difference between Jump height at the hurdle and height of the hurdle (HwF-HF).
2.4. Temporal Variables
Jump duration (JT) Time elapsing between take-off and landing.
Jump speed (JV): jump distance divided by jump duration.
Percentage of take-off duration (%TTO): Time from take-off to the instant in which the withers is right over the hurdle, expressed in percentage of the jump duration.
Percentage of landing phase duration or time (%TLA): Time from the instant in which the withers is right over the hurdle to landing, expressed in percentage of the jump duration.
Percentage of jump duration to maximum jump height (% TmaxJH): Time from take-off to the instant of maximum jump height, expressed in percentage of the jump.
Percentage of duration to horizontal back (%TBzero): Time from take-off to the instant at which the value of the back inclination angle is closest to zero, expressed in percentage of the jump duration.
Percentage difference between duration to maximum height and duration to hurdle (%TmaxJH-THwF).
Percentage difference between duration to back angle zero and duration to the hurdle (%TBzero-THwF): Time from the instant at which the value of the back inclination angle is closest to zero to the instant in which the withers is just over the hurdle, expressed in percentage of the jump duration.
2.5. Angular Variables
As stated previously, the back angle throughout the jump was automatically calculated by the system. The following related variables were measured:
Back inclination angle at take-off (BTO).
Back inclination angle at landing (BLA).
Range of motion of back inclination angle (BROM): Difference between back inclination angle at take-off and at landing.
Back inclination angle over the hurdle (back at fence) (BF): Value of the back inclination angle when the withers is right over the hurdle.
Back inclination angle at Maximum jump height (BmaxJH): Value of the back angle when the withers reach their maximum height.
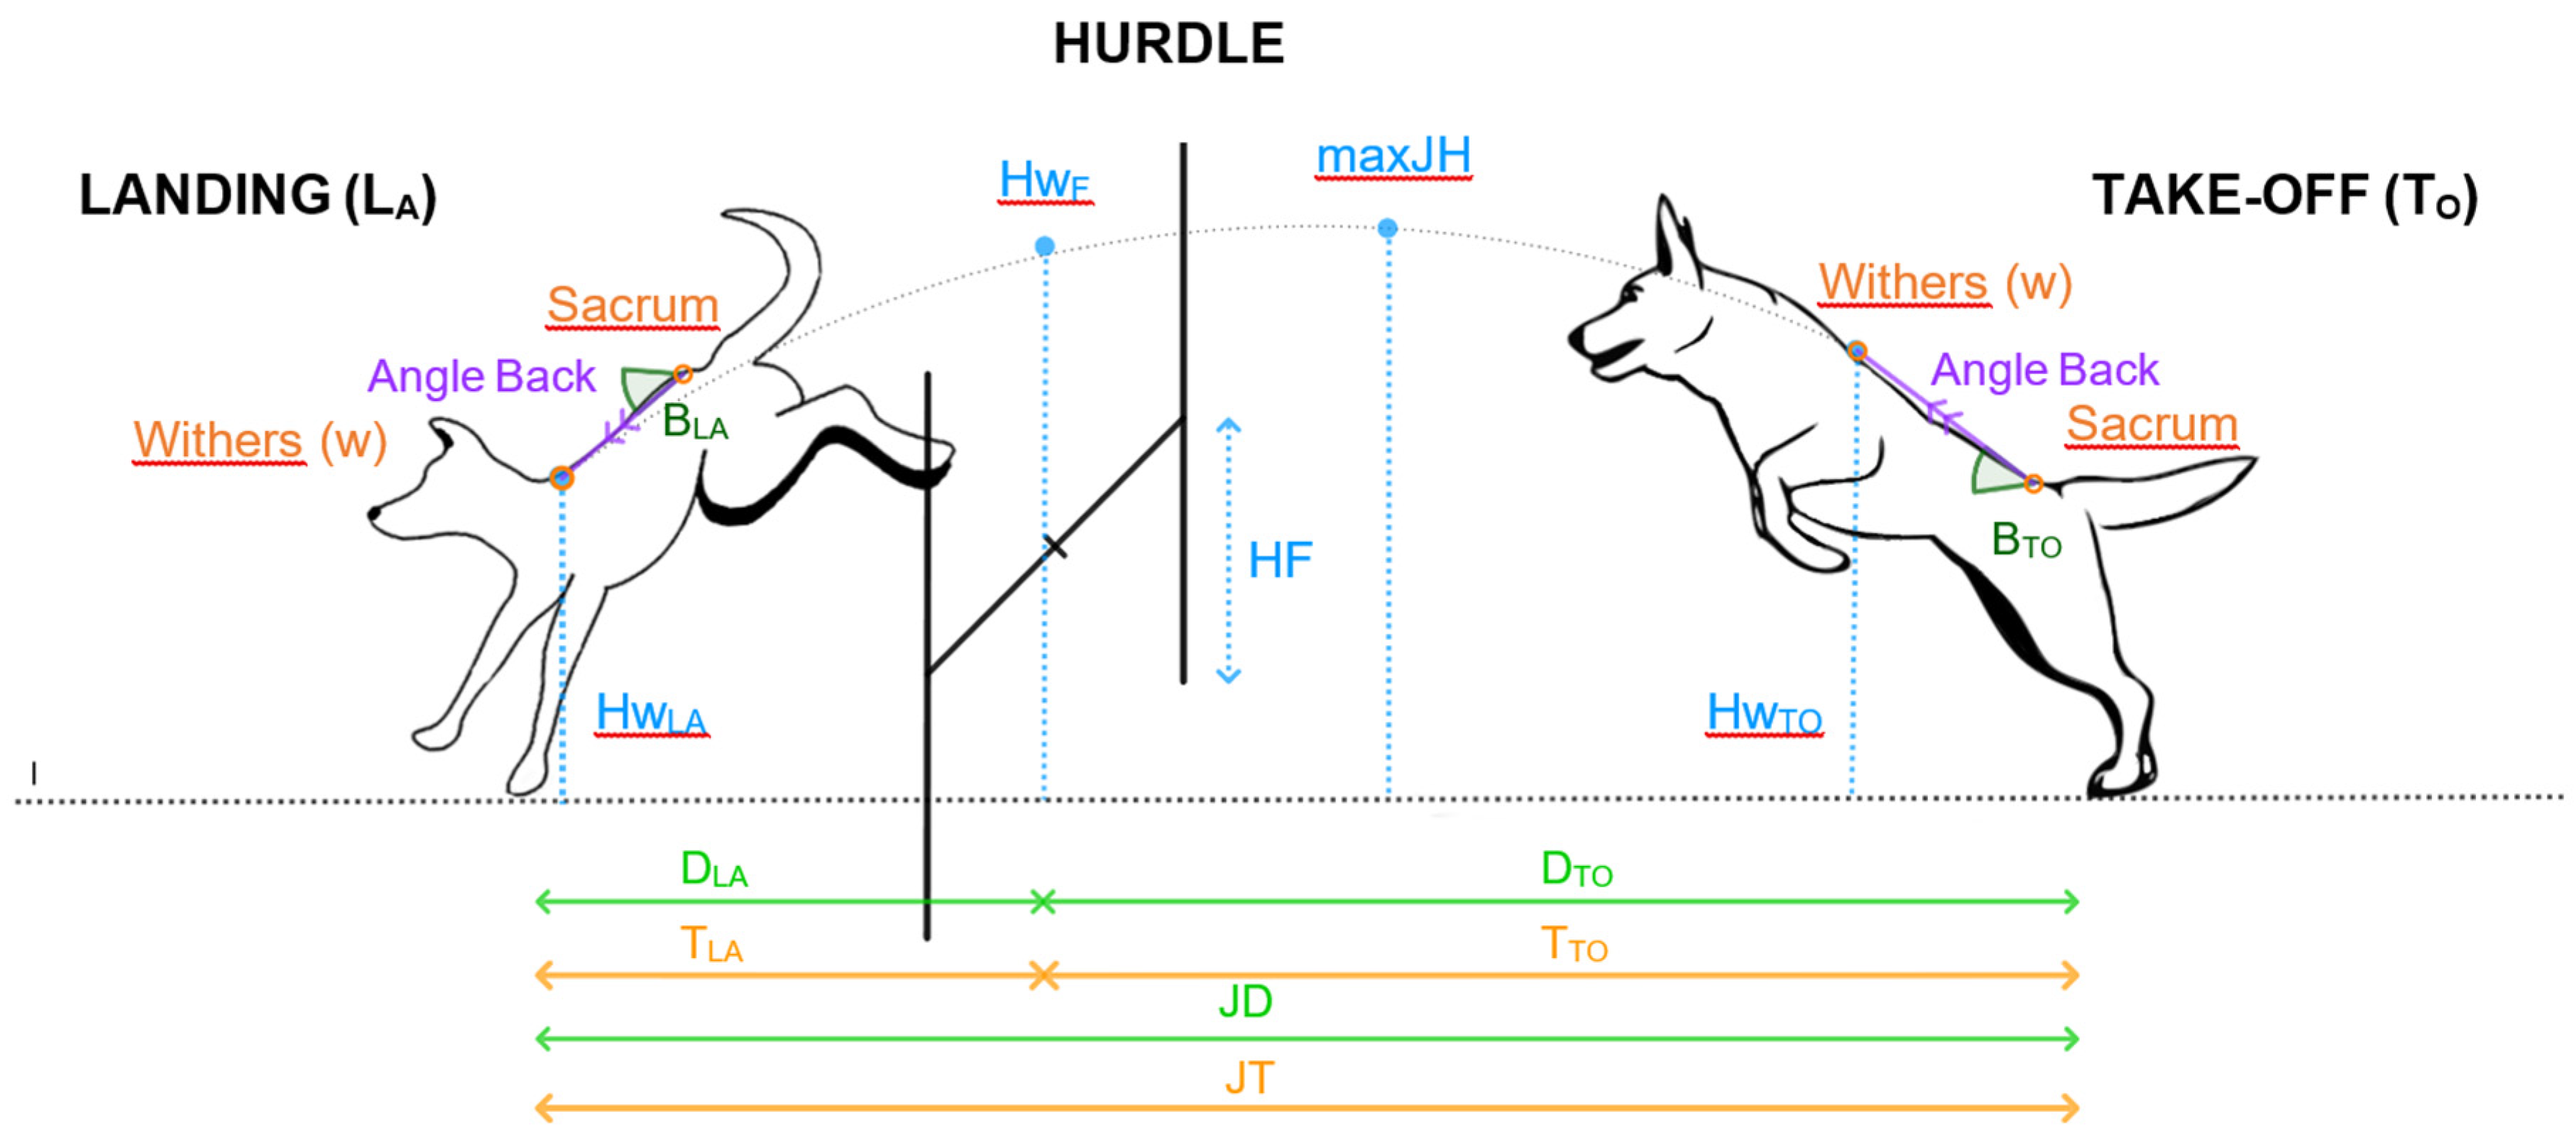
Figure 2.
Diagram of some of the variables analyzed in the jump of the agility dogs studied. The variables are grouped in 4 types: Temporal (T), Height (H), Distancie (D), Angular (B). The variables are distributed before and after the fence, and are related to the take-off phase (TO= Take-off), and landing (LA= Landing) and the points in the different moments of the jump, being the height of the withers (Hw), maximun height (maxJH) and Fence or Hurdle (FF). Thus we will have height of the withers at the beginning of the jum por take-off (HwTO) and at landing (HwLA), height when the dog reaches the maximun height (maxJH) and jump at the fence (HwF). Take-off (DTO) and landing (DLA), distances, total jump distance (JD)and total jump duration (JT). Back angle at take-off (BTO) and back angle at landing (BLA).
2.6. Statistical Analysis
As mentioned in experimental design four valid trials per dog were chosen to be analyzed. For each of the above variables, mean, standard deviation (S.D), maximum (max) and minimum (min) values, and intra- and inter-individual coefficient of variation (intra-CV and inter-CV, respectively) were calculated. Coefficient of variation less than 5 % were considered low, between 5 and 25 % acceptable and exceeding 25 % unacceptable (Dirección de Censos y Demografía, 2008; Särndal et al., 2003).
Data were presented as mean, median and standard deviation values. Significant differences were considered when p ≤ 0.05. Data were processed using the SPSS. IBM Corp. Released 2019. IBM SPSS Statistics for Windows, Version 26.0. Armonk, NY: IBM Corp. Normality in the distribution of variables was checked using the Shapiro-Wilk test with 44 degrees od freedom and it is accepted that a variable is normal when its significance >0,05.
3. Results
Mean, standard deviation, maximum and minimum values and intra- and inter-individual coefficients of variation of morphometric measurements (breed, gender, height at the withers, and weight to height ratio (Table 1) of the dogs studied are shown in Table 2. Coefficient of variation are graphically represented in Figure 3.
The intra-individual coefficient of variation (Intra-CV) for the morphometric variables were 0, as they remain constant for the same dog. Interindividual coefficient of variation (Inter-CV) for the weight and weight to height ratio was considered unacceptable, reflecting substantial variability across different dogs.
Mean, standard deviation, maximum and minimum values and intra- and inter-individual coefficients of variation of linear variables studied are shown in Table 3. Their coefficients of variation are graphically represented in Figure 4.
The dogs in the study performed long jumps (428 ± 68.56 cm), with greater jump distance (60 ± 4 %) traveled in front of the hurdle. Low intra-individual coefficient of variation was obtained in jump distance (JD) and low intra- and inter-individual coefficients of variation were obtained in percentage of take-off distance (%DTO). According to the values of jump height throughout the whole jump, all of them have not been expressed in the table, dogs followed a parabolic trajectory from take-off to landing. Values of jump heigh at take-off (HwTO) were greater than at landing (HwLA) and values of maximum jump height (maxJH) were slightly greater (2,26 ± 1,48 cm) than jump height at the hurdle (HwF). Intra-individual coefficients of variation of jump height at the chosen events (take off, landing, over the hurdle and maximum) were low and lower than their corresponding inter-individual coefficients. Inter-individual coefficients of variation were acceptable for the jump heights at take-off and at landing and low for the maximum jump height and jump height at the hurdle.
Mean, standard deviation, maximum and minimum values and intra- and inter-individual coefficients of variation of angular variables studied are shown in Table 4. Their coefficients of variation are graphically represented in Figure 5.
According to the results of the angular variables, dogs of the study started the jump with the greater positive values of back inclination angle (27,09 ± 2,89 º). The smallest values of this variable were found over the hurdle (-2,71 ± 4,06 º) and the greater negative values at landing (32,09 ± 4,06). Intra- and inter-individual coefficients of variation of back inclination angle were acceptable at take-off and at landing and unacceptable to maximum jump height and over the hurdle. For the range of motion of back inclination angle intra-individual coefficient of variation was low while inter-individual coefficient was acceptable.
Mean, standard deviation, maximum and minimum values and intra- and inter-individual coefficients of variation of temporal variables studied are shown in Table 5. Their coefficients of variation are graphically represented in Figure 6.
Dogs performed quick jumps (ump speed 9,73 ± 1,15 m/s), with a greater percentage of jump duration spent in front of the hurdle (55,95 ± 5,59 %) than behind it (44,05 ± 5,59 %). Temporal data indicate a sequential pattern of some events, occurring first the maximum height of the jump (at 42 ± 5,56 % of the jump duration), then back inclination angle close to zero (at 50,48 ± 4,75 % of the jump duration), and finally the hurdle crossing (at 55,95 ± 5,59 % of the jump duration). Except for variables of percentage differences, low or acceptable intra- and inter-individual coefficients of variation were obtained for the angular variables. Jump duration and jump speed showed the lowest intra-individual coefficients of variations.
4. Discusion
Both ability and speed, in addition to other essential training skills such as dynamic strength or anaerobic endurance, are important in Agility competition (Miró et al., 2020). Similar to previous research on jumping agility dogs (Alcock et al., 2015; Birch et al., 2015a, 2015b, 2016; Birch & Leśniak, 2013; Daniels & Burn, 2018; Miró et al., 2020; Pfau et al., 2011), the present study was focused on analyzing the kinematics of the suspension phase of the jump. The biomechanics of jump trajectory have been extensively studied in canines (Alcock et al., 2015; Birch et al., 2015b, 2016; Daniels & Burn, 2018; Miró et al., 2020; Pfau et al., 2011), equines (Clayton et al., 1995, 1996; Dutto et al., 2004; Galloux & Barrey, 2010; Powers, 2002; Powers & Harrison, 1999, 2000; Stinner, 2014; Wejer et al., 2013) and humans (Čoh, 2003; Čoh et al., 2017; Hay, 1978; Linthorne, 2001; Suárez, 2009). It has been studied extensively by several authors that the height of the hurdle affects the jump kinematics of dogs (Birch et al., 2016; Birch & Leśniak, 2013; Pfau et al., 2011). In order to reduce the influence of this variable, all the dogs included in the present study were recorded while jumping over the same hurdle´s height. Biomechanical variability refers to the subtle fluctuations in an athlete’s movement pattern, often imperceptible to the naked eye, which may be crucial for unlocking untapped potential and mitigating the risks associated with intense physical activity (Valldecabres, 2023). The biomechanical characteristic of jumping dogs can be accurately assessed using objective methods such as computer-assisted videography (Alcock et al., 2015; Birch et al., 2016; Birch & Leśniak, 2013; Miró et al., 2020; Pfau et al., 2011; Söhnel et al., 2020; Williams et al., 2021). With the aim of evaluating and describing biomechanics of sporting gestures and drawing conclusions it is essential to assess the variability across different trials on the same subject as well as the variability between subjects (Rojas Ruiz et al., 1998).
Morphometric variables, such as weight and height, play an important role in athletic performance (Birch & Leśniak, 2013; Daniels & Burn, 2018; Hay, 1978; Miró et al., 2020; Sellon et al., 2018; C. Zink, 2018, 2018; M. C. Zink & Van Dyke, 2013). As previously mentioned, according to their height all the eleven dogs of the present study competed in the same category (large, 48 cm or more at the withers). Based on the results of interindividual coefficients of variation, dogs differed less in height at the withers (inter-CV 8.34%) than in in weight (inter-CV 31,51 %) and, therefore, in weight to height ratio (inter-CV 23,52 %). Some authors have highlighted the notable influence that weight to height ratio has in the athletic ability of agility dogs, and their jump kinematic (C. Zink, 2018; M. C. Zink & Daniels, 1996; M. C. Zink & Van Dyke, 2013). It has been suggested that dogs with a ratio equal to or greater than 2,5 pounds/inches (0,45 kg/cm in international units) may be at an athletic disadvantage and may be less likely to have a long jumping career compared to dogs with ratio below 2,5 pounds/inches (M. C. Zink & Daniels, 1996; M. C. Zink & Van Dyke, 2013). Border Collies (BC) dogs, in particular, are considered to be especially gifted in agility sport (Alcock et al., 2015; Birkbeck et al., 2012). In fact, Alcock et al. (2015) found differences in the jump kinematics between BC and non-collie breeds dogs , with BC jumping faster than the others. In our opinion, in addition to their unique character component, they have specific morphometric characteristics, such as weight-to-height ratio, which would make them especially suitable for this sport. In our study, three of the dogs, no BC among them, had a weight-to-height ratio ≥ 0.45 IU, two of them, BC, had ratios between 0.33 and 0.36 IU and the other four dogs, being three BC and one a BC crossbreed individual, had ratios ≤ 0.32 IU. In agreement with the previously cited authors, we believe that both weight, and especially weight-to-height ratio are important factors in canine jumping technique. We strongly maintain that future extensive research in this field will be of great practical application in agility training and competition.
Several authors have suggested the kinetic particularities required for a successful jump in both horses and dogs. As mentioned for dogs (Pfau et al., 2011) and horses (Bobbert et al., 2005; Powers & Harrison, 1999), in order to effectively clear an obstacle, the animal must adequately position its body, calculate the appropriate combination of distance to the obstacle and jumping speed, and, as suggested by Bobbert et al. (2005) (Bobbert et al., 2005) and (Santamaría, 2004), achieve an optimal displacement of the center of gravity during the suspension phase. Powers and Harrison (2000) suggested that riderless jumping horses with inherent abilities to perform optimal jumps were better at adjusting distances and heights by selecting the most appropriate speed. In our opinion the previously mentioned kinematic characteristic would determine an appropriate jump trajectory for a successful jump. We believe that jump speed, back inclination angle at take-off, take-off distance and height to the hurdle are parameters that the individual calculates and adjusts, while jump maximum jump height, jump duration, landing distance, back inclination angle at landing and range of motion of back inclination angle are outcomes of these adjustments.
In our study, the variables jump height at take-off, maximum jump height and jump height at the hurdle and at landing were considered as key moments of the jump trajectory. Low intra-individual coefficients of variation were obtained in these four variables, indicating that every individual consistently exhibited similar values of these parameters. In fact, we obtained low or acceptable intra- and inter- individual coefficient of variation in most of the linear, angular, and temporal variables analyzed in the study. For some of these variables, such us percentage of take-off and landing distances, percentages of take-off and landing durations, maximum jump height, jump height at the hurdle and percentage duration to maximum jump height, both intra- and inter- individual coefficients of variation showed similar values. This consistency suggests that these variables may represent components of a general biomechanical pattern of jumping, applicable across all agility dogs analyzed in the study.
As previously mentioned, the intra-individual coefficients of variation of both jump height at take-off and at landing were low but greater (although acceptable) than their inter-individual coefficients of variation. Differences may be due to variations in height at the withers or in weight-to-height ratio among the dogs in the study. Further research with a larger sample of animals with diverse weights and heights at the withers could help to test this hypothesis.
With respect to angular variables, both intra- and inter-individual coefficients of variation for back inclination angle at take-off and at landing were acceptable and not very different and were relatively similar. This suggests intra- and inter-individual stability of the variable.
Low intraindividual coefficient of variation for the range of motion of the back inclination angle and just an interindividual coefficient of variation acceptable indicate greater stability of the variable in individuals than in the group.
Variables such as difference between the maximum jump height and jump height at the hurdle, back angle to maximum jump height, back over the hurdle, percentage difference between duration to maximum jump height and duration to the hurdle and percentage difference between duration to back angle zero and duration to the hurdle had unacceptable and hight intra- and inter-individual coefficients of variation. In the author´s opinion significant variability may be due to their small numerical value, making it difficult to fully understand their nature. Future studies are needed to understand their potential relevance to the jumping pattern and better assess their impact on agility performance
For most of the angular variables, as well as for jump distance, jump duration and speed, take-off and landing distances and jump heights at take-off and at landing, the intra-individual coefficients of variation were lower than the inter-individual coefficients. This reflects that the values of these variables are more consistent across trials for each specific dog, while they vary between individuals. This may indicate that these variables could be related to each individual´s unique jumping technique. A previous study (Söhnel et al., 2020), revealed general strategies of limb control in dogs jumping, but also highlighted differences between advanced and beginner dogs.
As previously mentioned, our results suggest that some variables better represent the general pattern of jumping biomechanics of agility dos, while others could be more related to the individual´s biomechanical technique.
5. Conclusions
The present study in jumping agility dogs confirmed variables such as percentage of take-off and landing distance, percentages of take-off and landing duration, maximum jump height, jump height at the hurdle and percentage duration to maximum jump height, as having similar low or acceptable intra- and inter- individual coefficients of variation, which could be considered as components of a general biomechanical pattern of jumping in agility dogs. Besides, variables with a lower intra-than inter-individual coefficients of variation, as is the case for most of the angular variables, jump distance, jump duration and speed, take-off and landing distance, and jump height at take-off and at landing, are suspected to be related to the individual´s jumping technique. This information can be valuable for designing training plans and monitoring the progress of canine athletes.
Acknowledgments
The authors would like to thank Álex Sabini (“Connecting dogs” canine center), Laia Borràs (Vet Rehab), the handlers and their dogs, as well as the dog owners for providing the experimental subjects during data collection. We wish to thank Pedro Cuesta and the UCM for service for the statistical support, and Juan Luis Garrido-Castro, Julio Contreras Rodríguez and Melinda Saravo for the support provided.
Conflict of Interest Statement
None of the authors of this paper has a financial or personal relationship with other people or organizations that could inappropriately influence or bias the content of the paper.
References
- Alcock, J., Birch, E., & Boyd, J. (2015). Effect of Jumping Style on the Performance of Large and Medium Elite Agility Dogs. Comparative Exercise Physiology, 11(3), 145–150. [CrossRef]
- Birch, E., Boyd, J., Doyle, G., & Pullen, A. (2015a). Small and medium agility dogs alter their kinematics when the distance between hurdles differs. Comparative Exercise Physiology, 11(2), 75–78. [CrossRef]
- Birch, E., Boyd, J., Doyle, G., & Pullen, A. (2015b). The effects of altered distances between obstacles on the jump kinematics and apparent joint angulations of large agility dogs. The Veterinary Journal, 204(2), 174–178. [CrossRef]
- Birch, E., Carter, A., & Boyd, J. (2016). An Examination of Jump Kinematics in Dogs Over Increasing Hurdle Heights. Comparative Exercise Physiology, 12(2), 91–98. [CrossRef]
- Birch, E., & Leśniak, K. (2013). Effect of Fence Height on Joint Angles of Agility Dogs. The Veterinary Journal, 198, e99–e102. [CrossRef]
- Birkbeck, L., Boyd, J., Croxford, S., & White, C. (2012, June 25). A Comparison of Conformational Traits of Elite and Non-Elite Agility Border Collie Dogs: A Preliminary Study. Conference: ICEL 7 - Canine and Equine Locomotion, Stromsholm, Sweden. https://www.researchgate.net/publication/283642150_A_comparison_of_conformational_traits_of_elite_and_non-elite_agility_Border_Collie_dogs_a_preliminary_study.
- Bobbert, M. F., Santamaría, S., van Weeren, P. R., Back, W., & Barneveld, A. (2005). Can Jumping Capacity of Adult Show Jumping Horses Be Predicted on the Basis of Submaximal Free Jumps at Foal Age? A Longitudinal Study. The Veterinary Journal, 170(2), 212–221. [CrossRef]
- Claes, W. (2020, September). FEDERATION CYNOLOGIQUE INTERNATIONALE (AISBL). 19.
- Clayton, H. M. (1989). Terminology for the description of equine jumping kinematics. Journal of Equine Veterinary Science, 9(6), 341–348. [CrossRef]
- Clayton, H. M., & Barlow, D. A. (1991). Stride characteristic of four grand prix jumping horses. Equine Exercise Physiology, 3, 151–157.
- Clayton, H. M., Colborn, G. R., Lanovaz, J., & Burns, T. E. (1996). Linear kinematics of water jumping in Olympic show jumpers: Pferdeheilkunde Equine Medicine, 12(4), 657–660. [CrossRef]
- Clayton, H. M., Colborne, G. R., & Burns, T. E. (1995). Kinematic analysis of successful and unsuccessful attempts to clear a water jump. Equine Veterinary Journal, 27(S18), 166–169. [CrossRef]
- Čoh, M. (2003). Biomechanical Analysis of Colin Jackson’s Hurdle Clearance Technique. New Studies in Athletics, 1/2003, 37–45.
- Čoh, M., Žvan, M., & Kugovnik, O. (2017). Kinematic and Biodynamic Model of the Long Jump Technique. In E. G. Hurtado (Ed.), Kinematics. InTech. [CrossRef]
- Cullen, K. L. (2014). Patterns and risk factors for injuries and shoulder muscular activation in dogs performing agility tasks. [Thesis, The University of Guelph]. https://dam-oclc.bac-lac.gc.ca/eng/home/index/82be6f2c-4f2b-4ce1-99b6-883f07ffeaea.
- Daniels, K. A. J., & Burn, J. F. (2018). A Simple Model Predicts Energetically Optimised Jumping in Dogs. Journal of Experimental Biology, 221(Pt 9), jeb167379. [CrossRef]
- Dirección de Censos y Demografía. (2008). Estimación E Interpretación Del Coeficiente De Variación De La Encuesta Cocensal. Departamento administrativo nacional de estadística de Colombia. https://www.dane.gov.co/files/investigaciones/boletines/censo/est_interp_coefvariacion.pdf.
- Dutto, D. J., Hoyt, D. F., Clayton, H. M., Cogger, E. A., & Wickler, S. J. (2004). Moments and power generated by the horse ( Equus caballus ) hind limb during jumping. Journal of Experimental Biology, 207(4), 667–674. [CrossRef]
- Galloux, P., & Barrey, E. (2010). Components of the Total Kinetic Moment in Jumping Horses. Equine Veterinary Journal, 29(S23), 41–44. [CrossRef]
- Garrido, J. L., Medina-Carnicer, R., & Galisteo, A. M. (2006). Design and Evaluation of a New Three-Dimensional Motion Capture System Based on Video. Gait & Posture, 24(1), 126–129. [CrossRef]
- Hay, J. (1978). The Biomechanics of Sports Techniques. Prairie Striders Library Collection. https://openprairie.sdstate.edu/prairiestriders_pubs/251.
- Levy, I., Hall, C., Trentacosta, N., & Percival, M. (2009). A Preliminary Retrospective Survey of Injuries Occurring in Dogs Participating in Canine Agility. Veterinary and Comparative Orthopaedics and Traumatology, 22(04), 321–324. [CrossRef]
- Linthorne, N. P. (2001). Optimum release angle in the shot put. Journal of Sports Sciences, 19(5), 359–372. [CrossRef]
- Miró, F., López, P., Vilar, J. M., Galisteo, A. M., Vivo, J., Garrido-Castro, J. L., & Gutierrez-Cepeda, L. (2020). Comparative Kinematic Analysis of Hurdle Clearance Technique in Dogs: A Preliminary Report. Animals, 10(12), 2405. [CrossRef]
- Pechette Markley, A., Shoben, A. B., & Kieves, N. R. (2024). Risk Factors for Injury in Border Collies Competing in Agility Competitions. Animals, 14(14), 2081. [CrossRef]
- Pfau, T., Garland de Rivaz, A., Brighton, S., & Weller, R. (2011). Kinetics of jump landing in agility dogs. The Veterinary Journal, 190(2), 278–283. [CrossRef]
- Powers, P. (2002). THE TAKE OFF KINEMATICS OF JUMPING HORSES IN A PUISSANCE COMPETITION. 4. https://www.eweb.unex.es/eweb/isbs2002/index2.htm.
- Powers, P., & Harrison, A. (1999). Models for biomechanical analysis of jumping horses. Journal of Equine Veterinary Science, 19(12), 799–806. [CrossRef]
- Powers, P., & Harrison, A. (2002). Show-Jumping: Effects of the rider on the linear kinematics of jumping horses. Sports Biomechanics, 1(2), 135–146. [CrossRef]
- Powers, P., & Harrison, A. J. (2000). A Study on the Techniques Used by Untrained Horses During Loose Jumping. Journal of Equine Veterinary Science, 20(12), 845–850. [CrossRef]
- Rojas Ruiz, F. J., Oña Sicilia, A., & Gutiérrez Dávila, M. (1998). Valoración de la variabilidad inter e intraindividual en el lanzamiento en salto en baloncesto a través del análisis biomecánico. Biomecánica. [CrossRef]
- Santamaría, S. (2004). From foal to performer: Development pf the jumping technique and the effect of early training. Faculty of Veterinary Medicine, Utrech University, The Netherlands.
- Särndal, C.-E., Swensson, B., & Wretman, J. (2003). Model Assisted Survey Sampling.
- Schreven, S., Beek, P. J., & Smeets, J. B. J. (2015). Optimising filtering parameters for a 3D motion analysis system. Journal of Electromyography and Kinesiology: Official Journal of the International Society of Electrophysiological Kinesiology, 25(5), 808–814. [CrossRef]
- Sellon, D. C., Martucci, K., Wenz, J. R., Marcellin-Little, D. J., Powers, M., & Cullen, K. L. (2018). A Survey of Risk Factors for Digit Injuries Among Dogs Training and Competing in Agility Events. Journal of the American Veterinary Medical Association, 252(1), 75–83. [CrossRef]
- Söhnel, K., Andrada, E., De Lussanet, M. H. E., Wagner, H., Fischer, M. S., & Rode, C. (2021). Single limb dynamics of jumping turns in dogs. Research in Veterinary Science, 140, 69–78. [CrossRef]
- Söhnel, K., Andrada, E., de Lussanet, M., Wagner, H., & Fischer, M. S. (2017). Kinetics of jumping regarding agility dogs. Engineering for a Changing World: Proceedings; 59th IWK, Ilmenau Scientific Colloquium, Technische Universität Ilmenau, September 11-15, 2017, 59, 2017(3.2.01). Ilmenau Scientific Colloquium. Technische Universität Ilmenau ; 59 (Ilmenau) : 2017.09.11-15. https://www.db-thueringen.de/receive/dbt_mods_00033181.
- Söhnel, K., Rode, C., de Lussanet, M. H. E., Wagner, H., Fischer, M. S., & Andrada, E. (2020). Limb dynamics in agility jumps of beginner and advanced dogs. Journal of Experimental Biology, 223(Pt 7), jeb202119. [CrossRef]
- Stinner, A. (2014). The Physics of Equestrian Show Jumping. The Physics Teacher, 52(4), 202–206. [CrossRef]
- Suárez, G. R. (Ed.). (2009). Biomecánica deportiva y control del entrenamiento. Funámbulos Editores.
- Valldecabres, R. (2023). The Significance of Measuring Biomechanical Variability in Sports Performance. Academic Journal of Sports Science & Medicine, 1(2), 1–3.
- Wejer, J., Lendo, I., & Lewczuk, D. (2013). The Effect of Training on the Jumping Parameters of Inexperienced Warmblood Horses in Free Jumping. Journal of Equine Veterinary Science, 33(6), 483–486. [CrossRef]
- Williams, E., Carter, A., & Boyd, J. (2021). Kinetics and Kinematics of Working Trials Dogs: The Impact of Long Jump Length on Peak Vertical Landing Force and Joint Angulation. Animals, 11(10), 2804. [CrossRef]
- Zink, C. (2018). The Agility Advantage: Health and Fitness for the Canine Athlete. (1–1 online resource (161 pages)). Dogwise Publishing. https://public.ebookcentral.proquest.com/choice/publicfullrecord.aspx?p=5583649.
- Zink, M. C., & Daniels, J. (1996). JUMPING FROM A TO Z: Teacho your dog to soar (1st ed.). Canine Sports Productions.
- Zink, M. C., & Van Dyke, J. B. (Eds.). (2013). Canine sports medicine and rehabilitation. John Wiley & Sons.
Figure 1.
Schematic representation of setup for biomechanical analysis of eleven agility dogs jumping. .
Figure 1.
Schematic representation of setup for biomechanical analysis of eleven agility dogs jumping. .
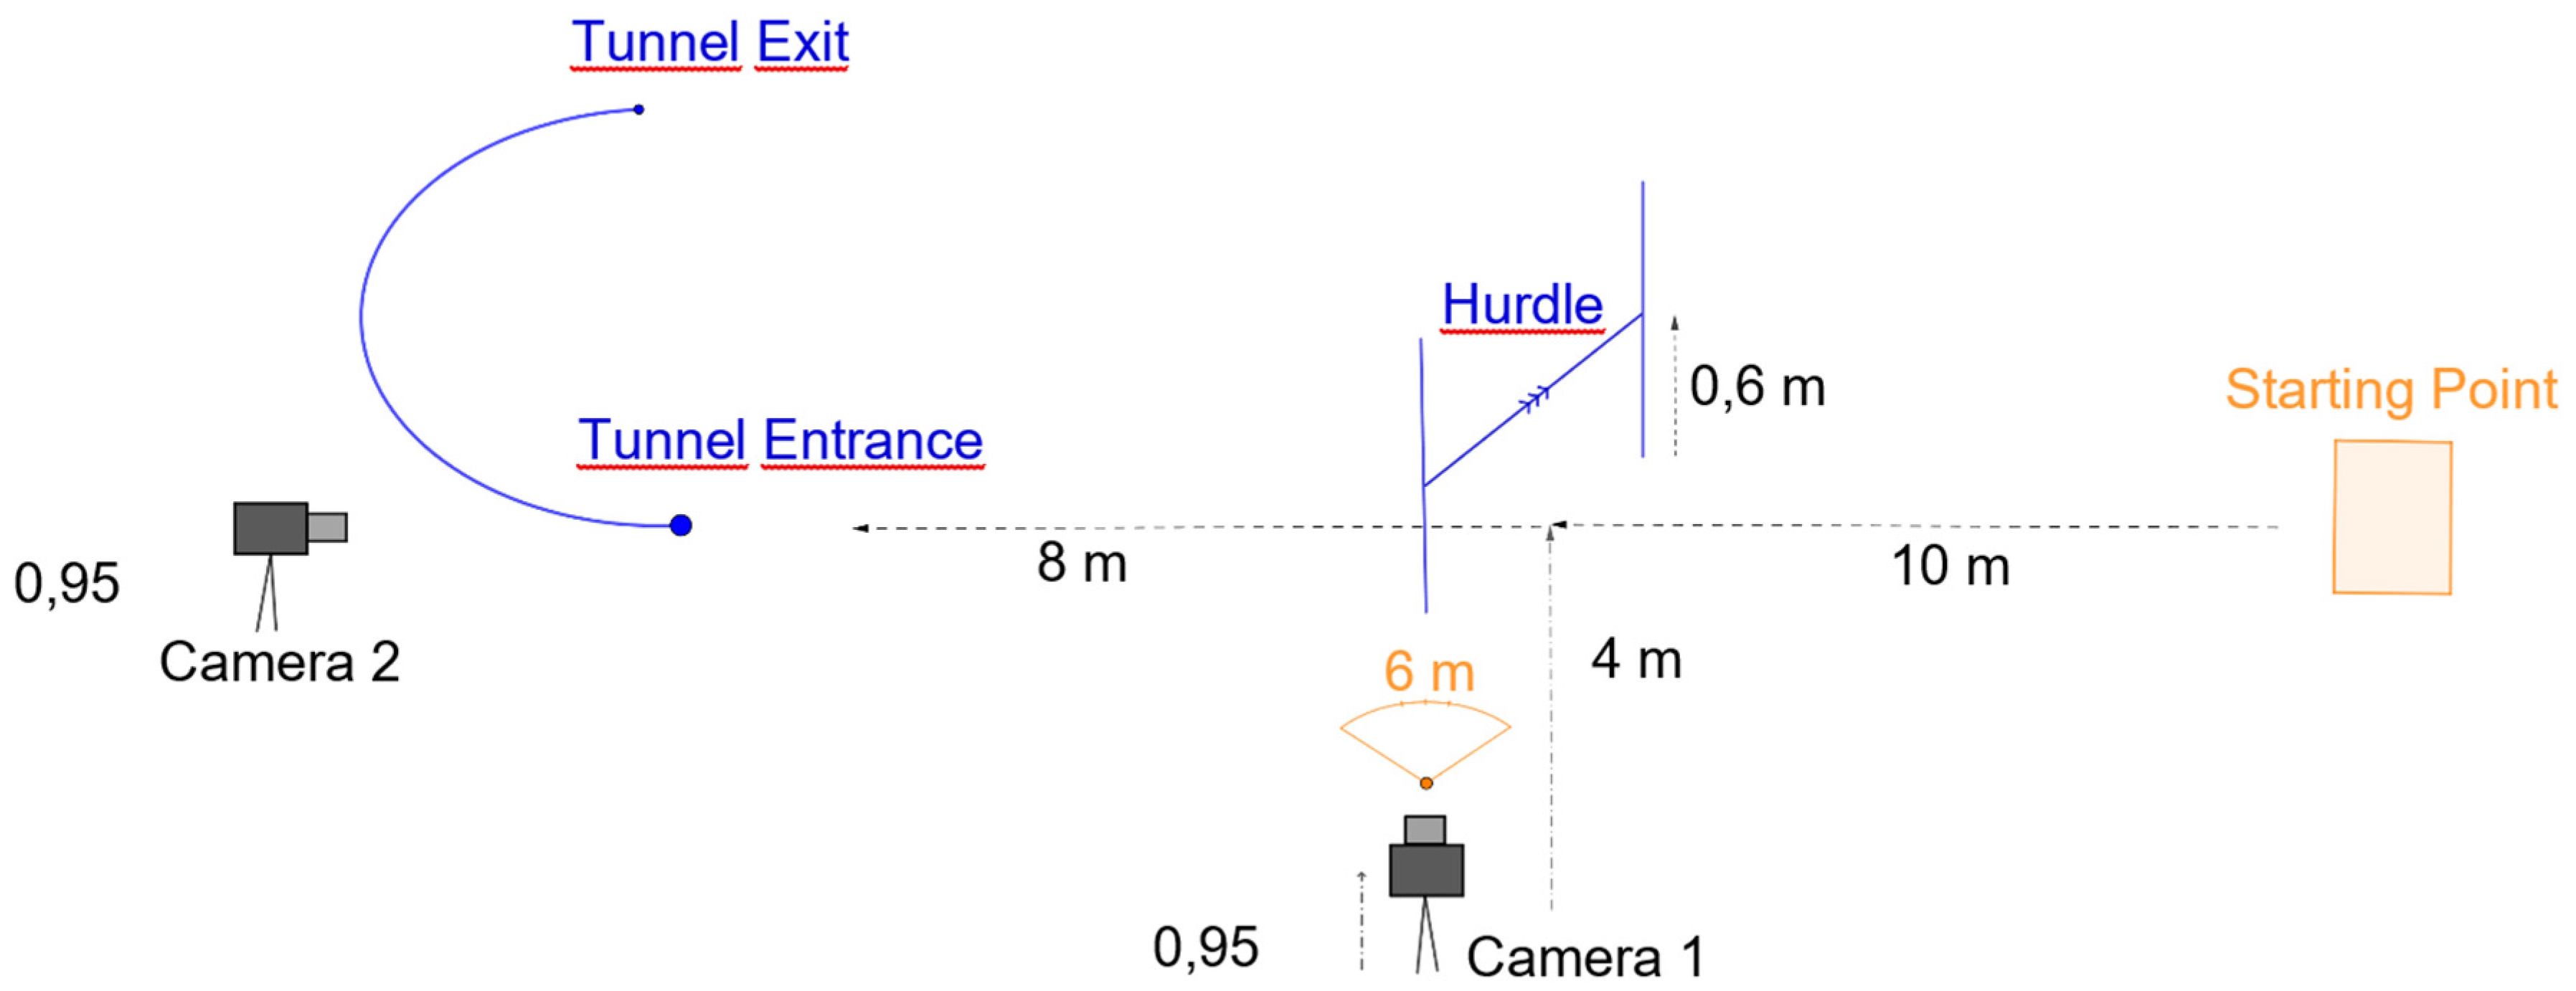
Figure 3.
Graphic representation of intra- and inter-individual coefficients of variation of the morphometric variables analyzed in the study. Coefficient of variation less than 5 % were considered low, between 5 and 25 % acceptable and exceeding 25 % unacceptable (Dirección de Censos y Demografía, 2008; Särndal et al., 2003).
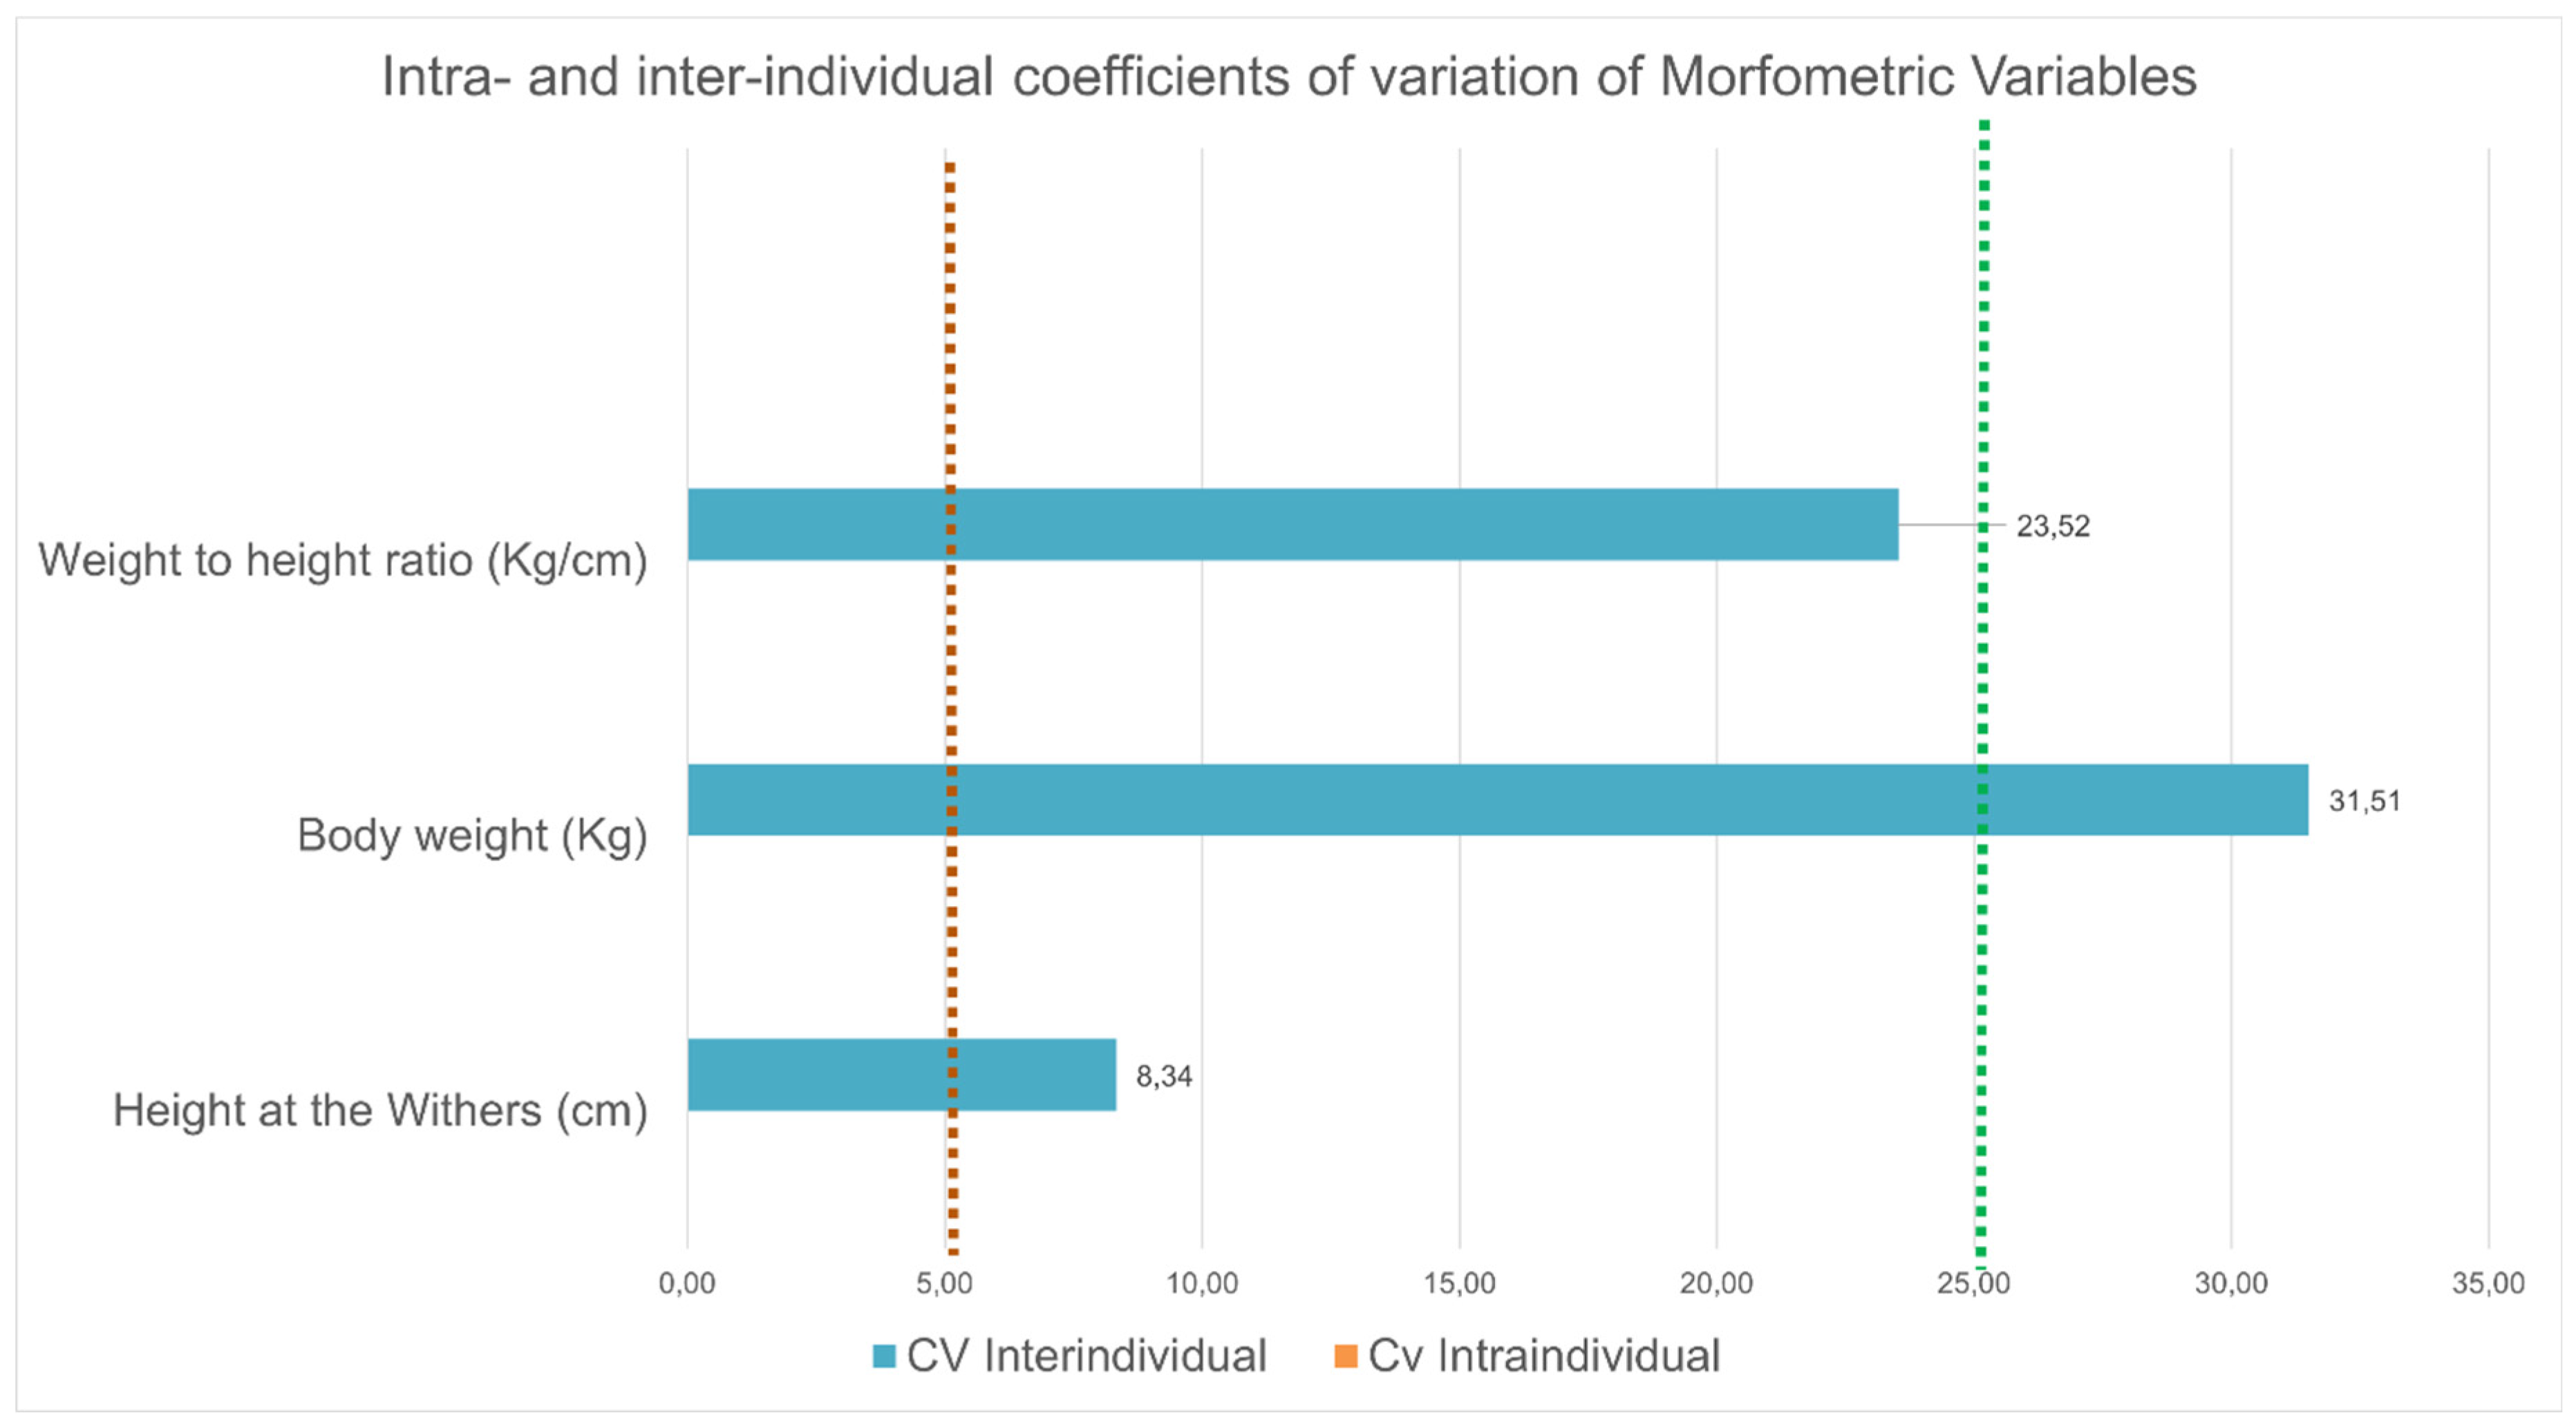
Figure 4.
Graphic representation of intra- and inter-individual coefficients of variation of the linear variables analyzed in the study. Coefficient of variation less than 5 % were considered low, between 5 and 25 % acceptable and exceeding 25 % unacceptable (Dirección de Censos y Demografía, 2008; Särndal et al., 2003).
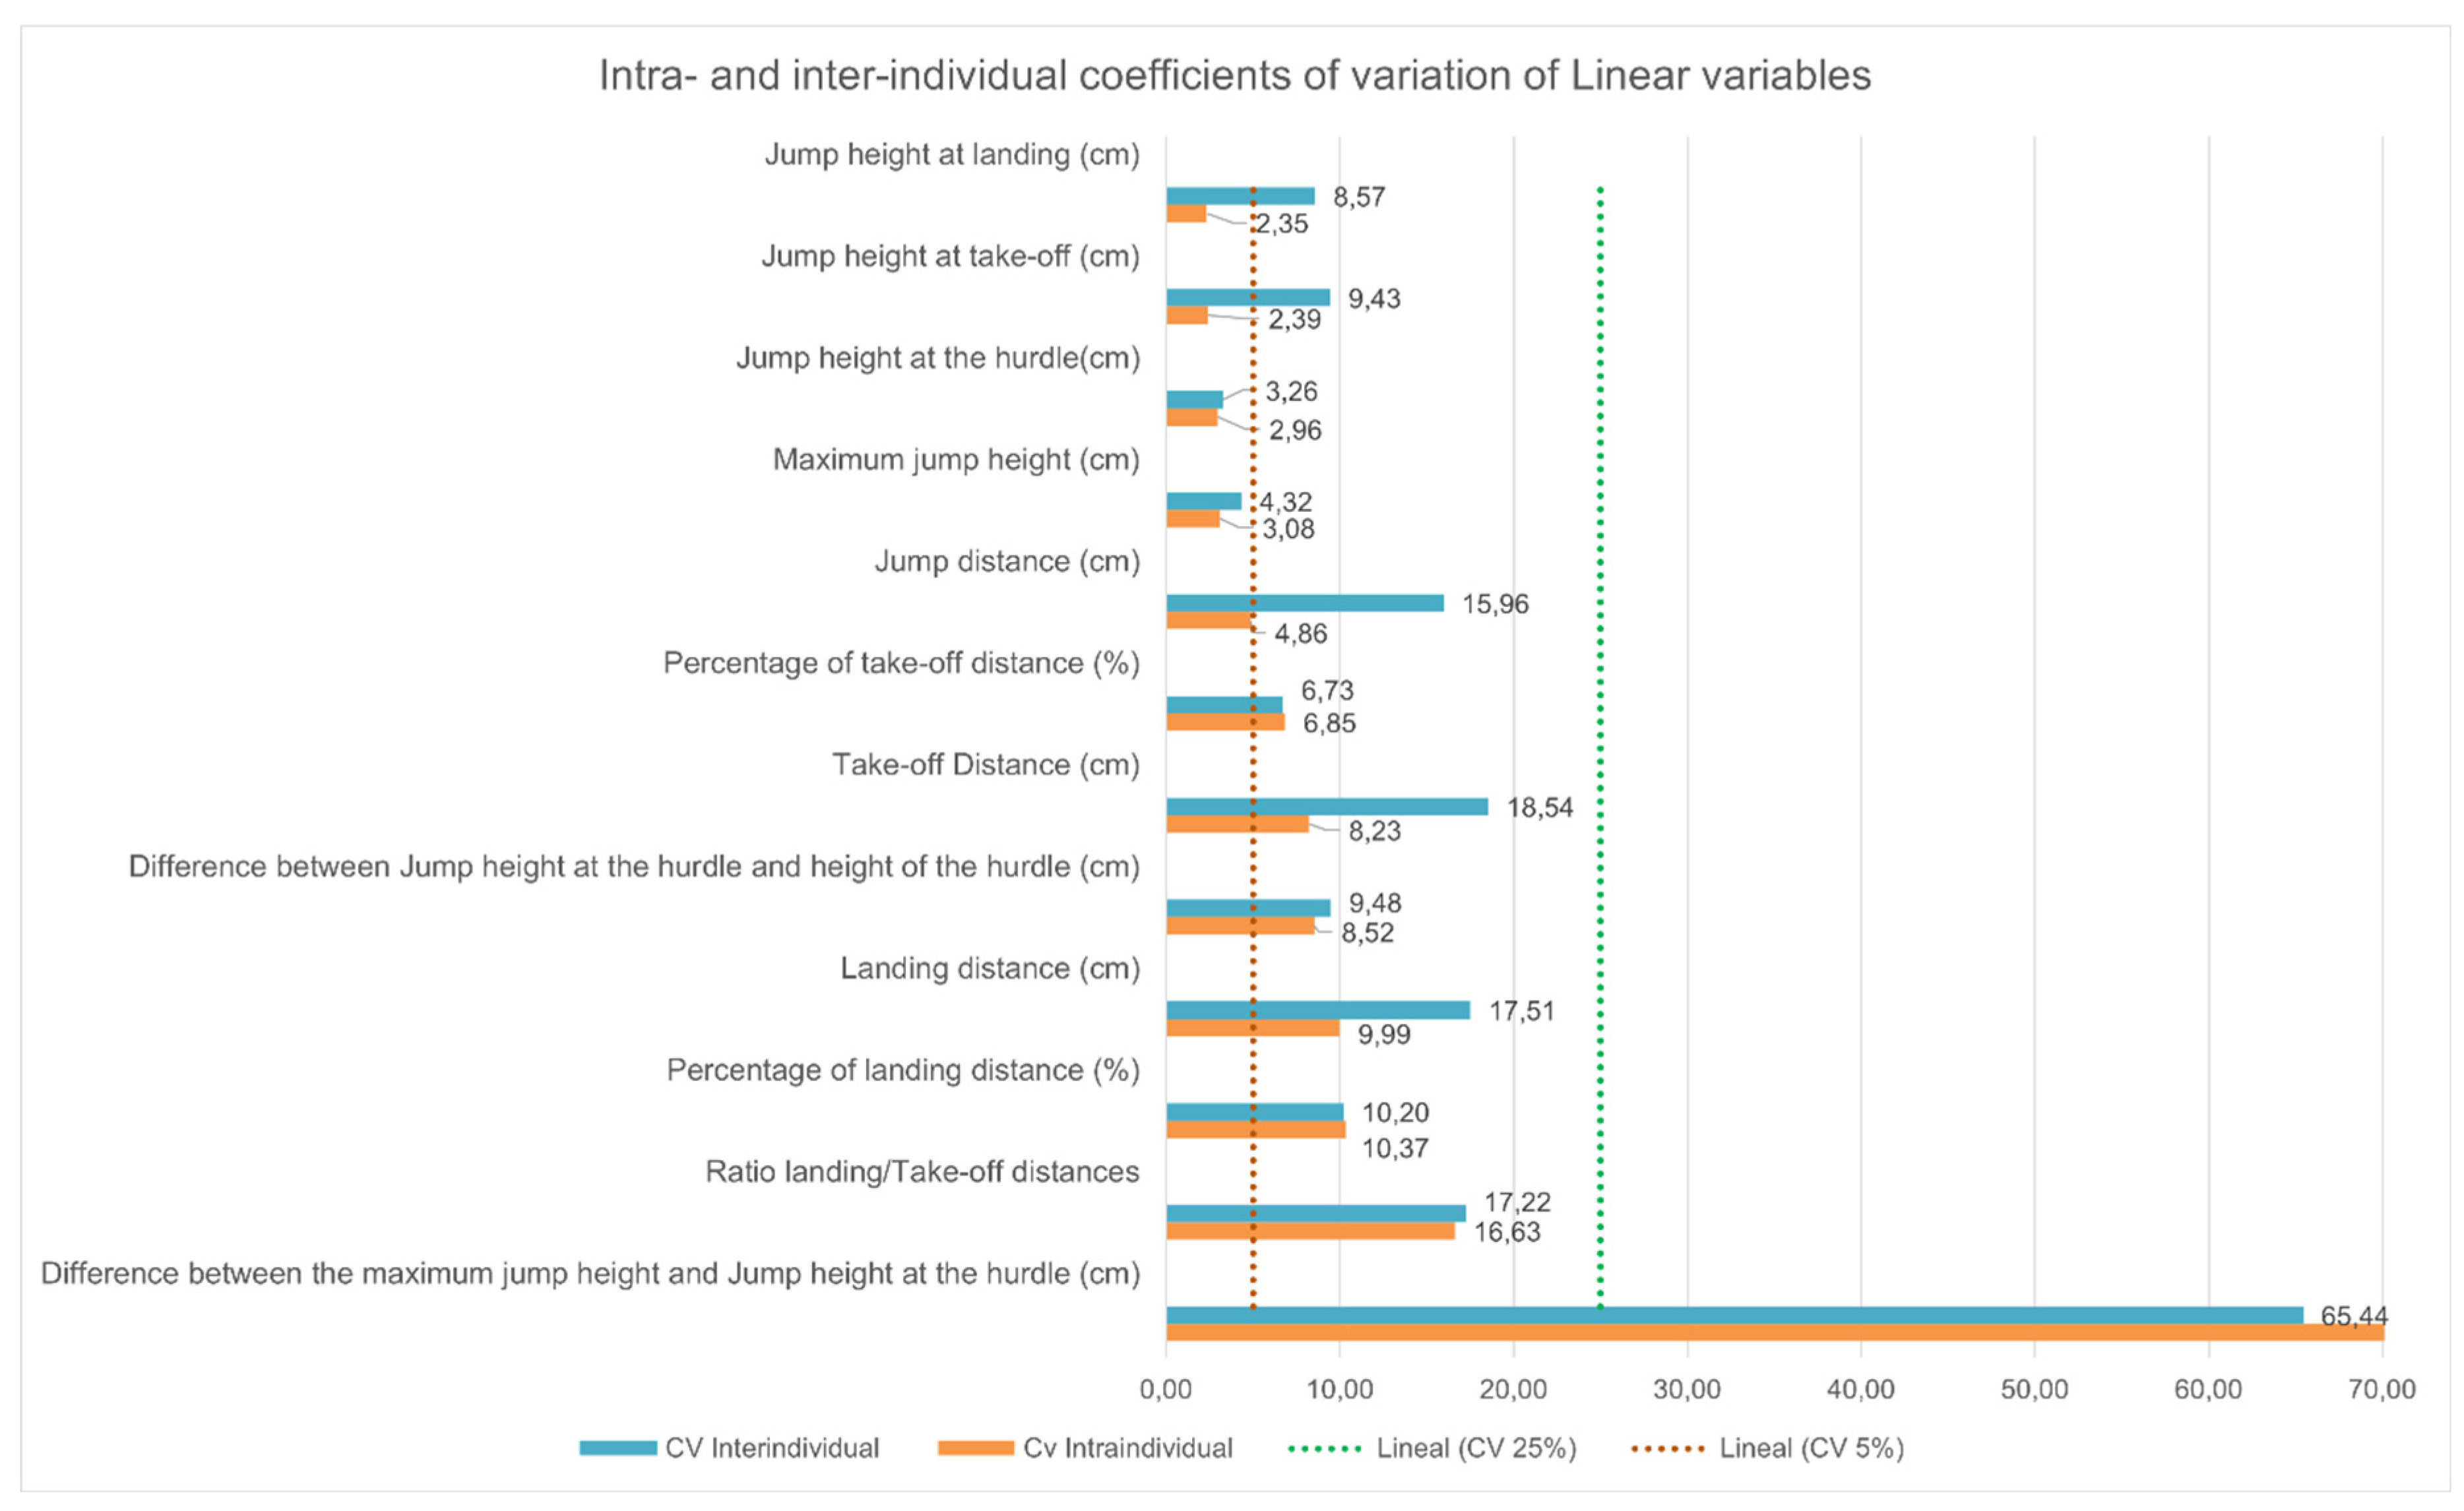
Figure 5.
Graphic representation of intra- and inter-individual coefficients of variation of the angular variables analyzed in the study. Coefficient of variation less than 5 % were considered low, between 5 and 25 % acceptable and exceeding 25 % unacceptable (Särndal et al., 2003).
Figure 5.
Graphic representation of intra- and inter-individual coefficients of variation of the angular variables analyzed in the study. Coefficient of variation less than 5 % were considered low, between 5 and 25 % acceptable and exceeding 25 % unacceptable (Särndal et al., 2003).
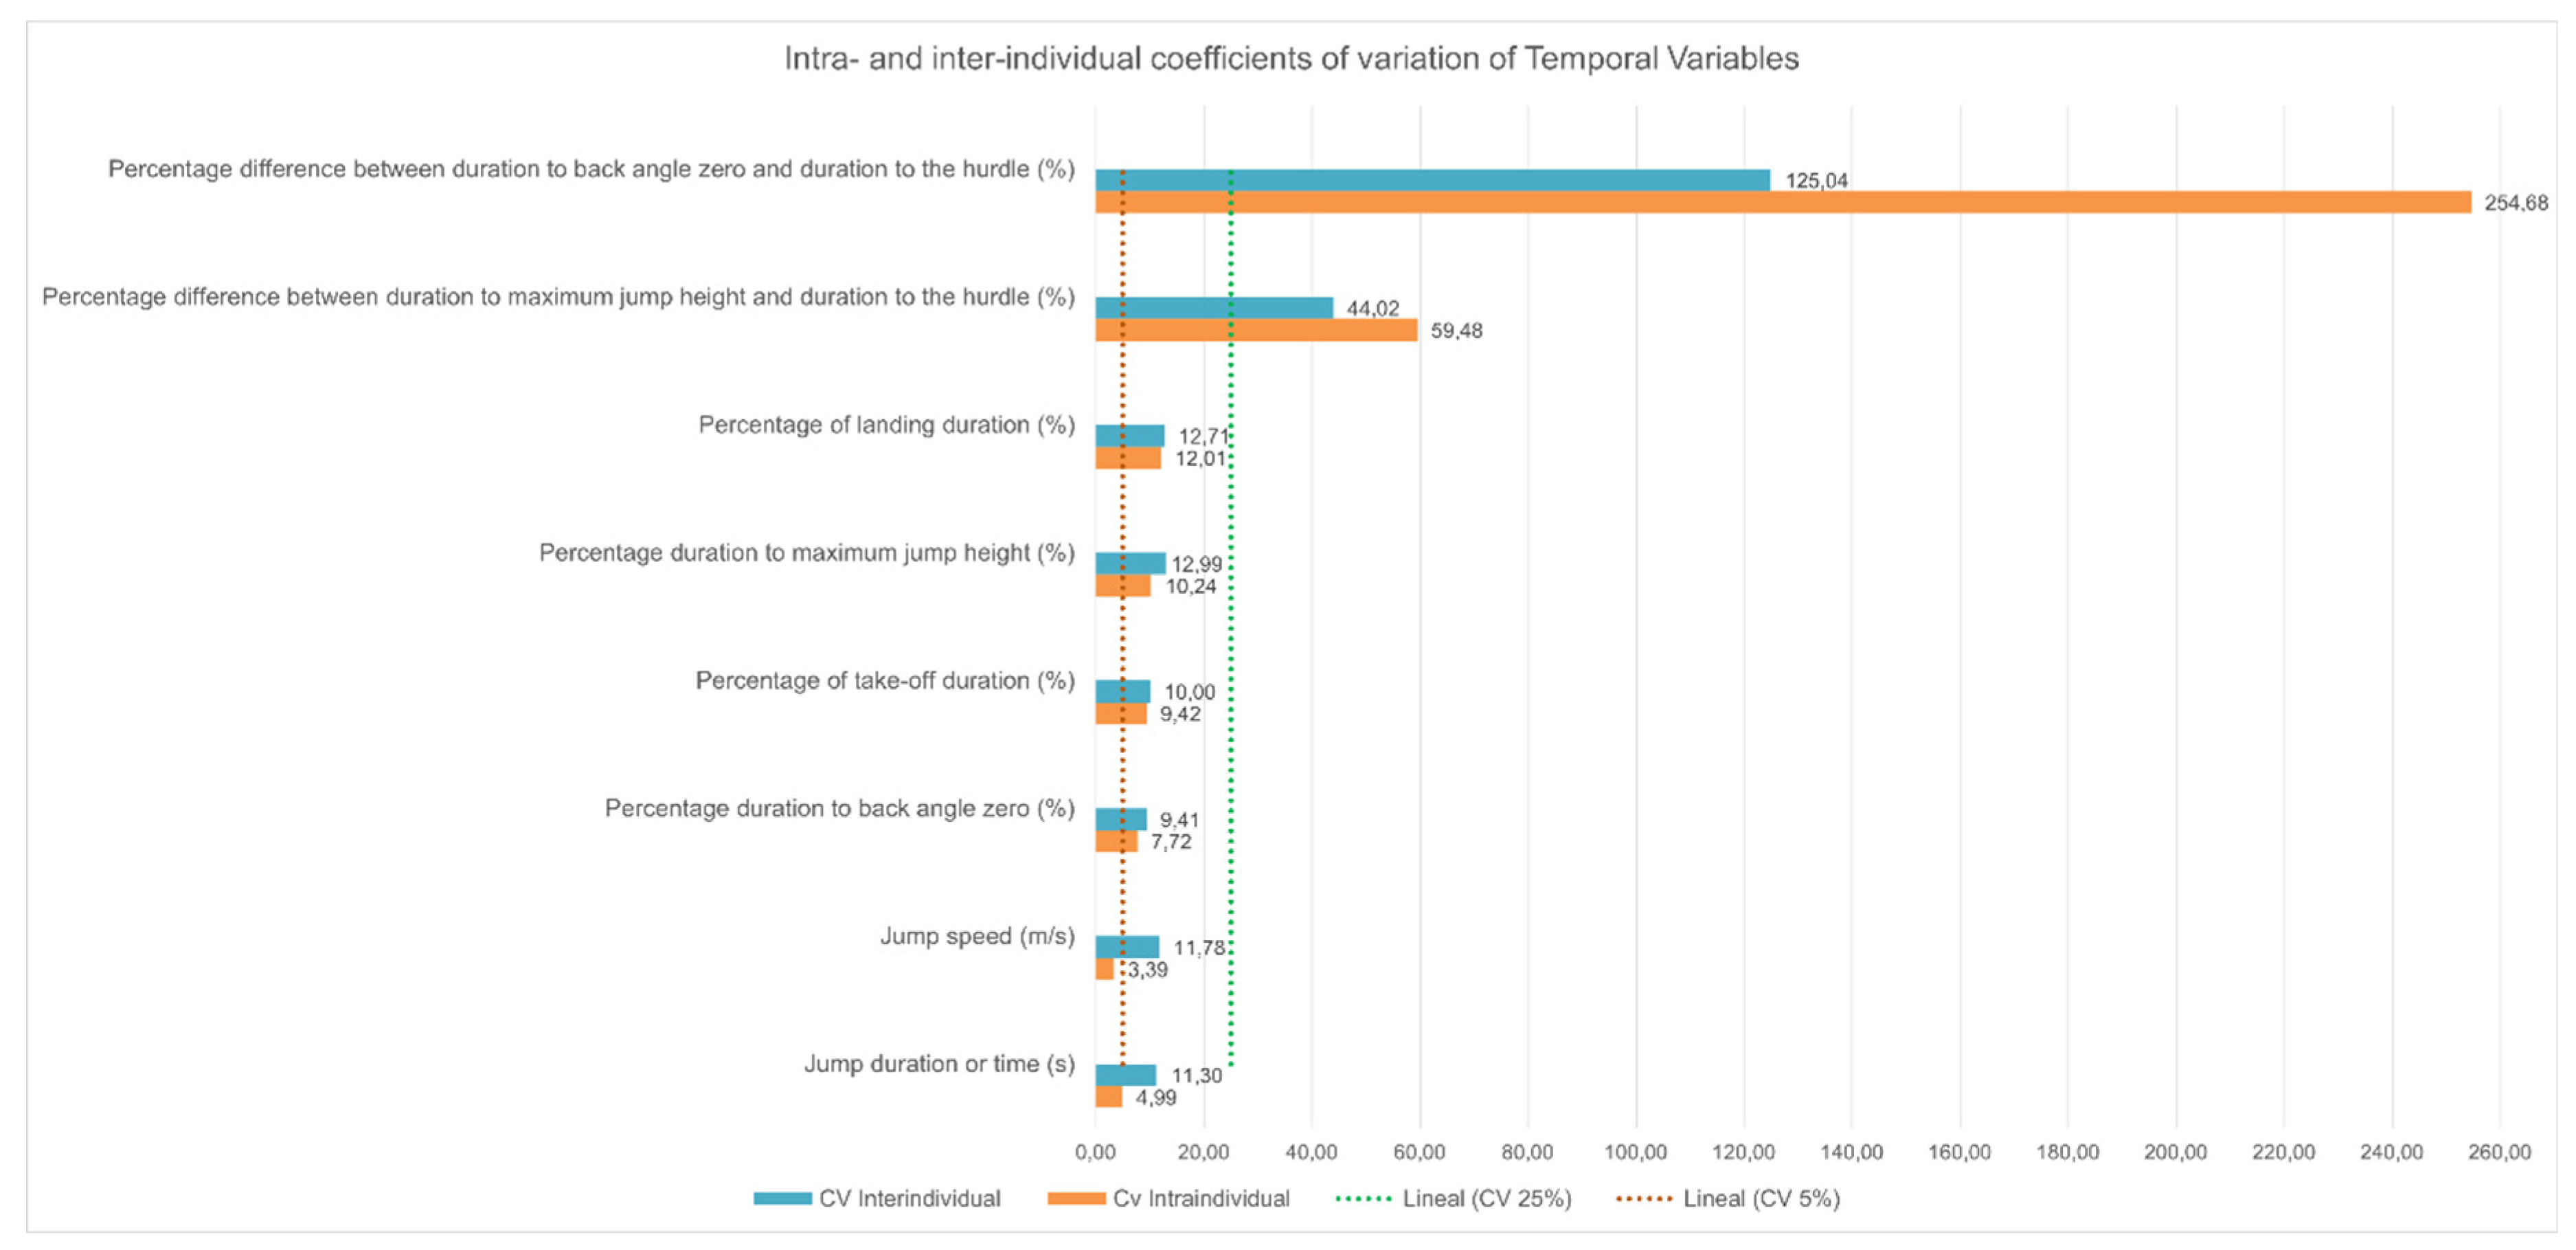
Figure 6.
Graphic representation of intra- and inter-individual coefficients of variation of the temporal variables analyzed in the study. Coefficient of variation less than 5 % were considered low, between 5 and 25 % acceptable and exceeding 25 % unacceptable (Särndal et al., 2003).
Figure 6.
Graphic representation of intra- and inter-individual coefficients of variation of the temporal variables analyzed in the study. Coefficient of variation less than 5 % were considered low, between 5 and 25 % acceptable and exceeding 25 % unacceptable (Särndal et al., 2003).
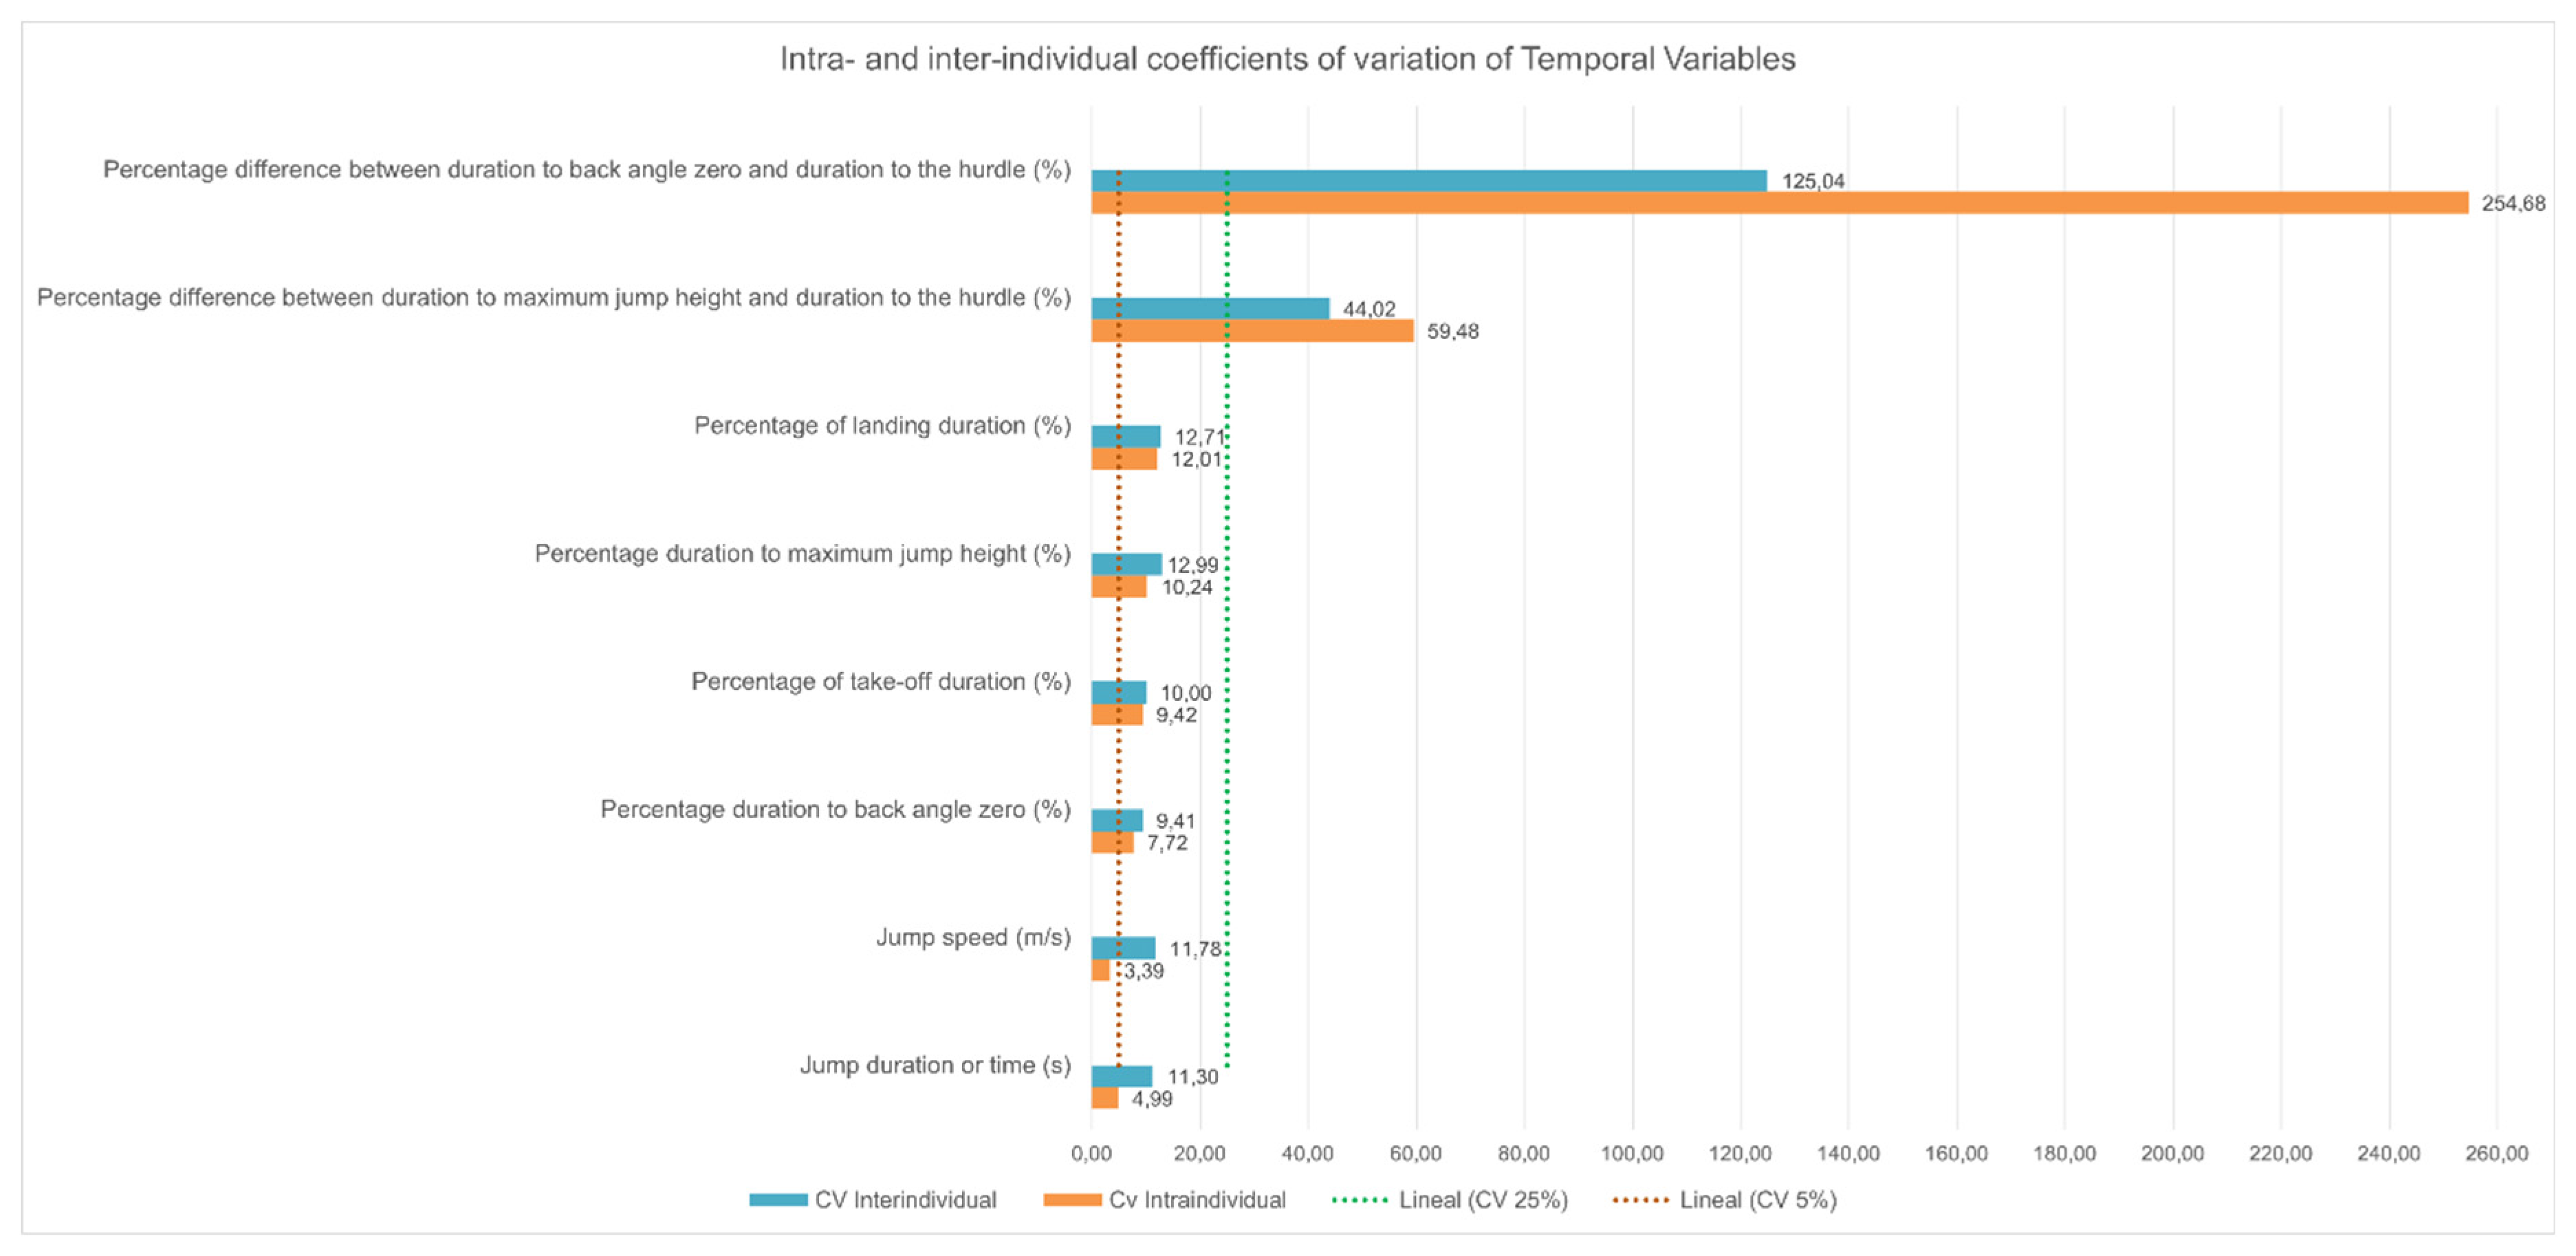

Table 1.
Data of breed, gender (F, male; M, male) weight (W), height to the withers (Hw) and weight to height ratio (Rw) of 11 agility dogs assessed in the study.
Table 1.
Data of breed, gender (F, male; M, male) weight (W), height to the withers (Hw) and weight to height ratio (Rw) of 11 agility dogs assessed in the study.
| Dog | Breed | Gender | W (Kg) | Hw (cm) | Rw (Kg/cm) |
|---|---|---|---|---|---|
| 1 | Crossbreed | F | 27,00 | 57,00 | 0,47 |
| 2 | Border Collie | M | 17,00 | 51,00 | 0,33 |
| 3 | Australian Shepherd | M | 18,50 | 52,00 | 0,36 |
| 4 | Border Collie | F | 14,85 | 48,00 | 0,31 |
| 5 | Border Collie | F | 14,50 | 52,00 | 0,28 |
| 6 | Border Collie | F | 13,00 | 48,00 | 0,27 |
| 7 | Brie Shepherd | M | 32,20 | 63,00 | 0,51 |
| 8 | BorderCollie Crossbreed | F | 15,00 | 54,00 | 0,28 |
| 9 | Bearded Collie | F | 24,00 | 52,00 | 0,46 |
| 10 | Belg.Malinois Crossbreed | F | 18,30 | 55,10 | 0,33 |
| 11 | Border Collie | F | 16,35 | 49,00 | 0,33 |
Table 2.
Mean, standard deviation (S.D), maximum (Max), minimum (Min), intra- (intra-CV) and inter-individual (Inter-CV) coefficients of variation of weight (W), height to the withers (Hw) and weight to height ratio (Rw) of the 11 agility dogs assessed in the study.
Table 2.
Mean, standard deviation (S.D), maximum (Max), minimum (Min), intra- (intra-CV) and inter-individual (Inter-CV) coefficients of variation of weight (W), height to the withers (Hw) and weight to height ratio (Rw) of the 11 agility dogs assessed in the study.
| W (Kg) | Hw (cm) | Rw (Kg/cm) | |
|---|---|---|---|
| Mean | 19,15 | 52,83 | 0,36 |
| S. D | 6,04 | 4,41 | 0,08 |
| Max | 32,20 | 63,00 | 0,51 |
| Min | 13,00 | 48,00 | 0,27 |
| Intra- CV | 0,00 | 0,00 | 0,00 |
| Inter- CV | 31,51 | 8,34 | 23,52 |
Table 3.
Abbreviations (Abbr) of the variables and mean, standard deviation (S.D), maximum (Max), minimum (Min), intra- (intra-CV) and inter-individual (Inter-CV) coefficients of variation of the linear variables analyzed in 11 large agility dogs jumping over a 60-cm hurdle.
Table 3.
Abbreviations (Abbr) of the variables and mean, standard deviation (S.D), maximum (Max), minimum (Min), intra- (intra-CV) and inter-individual (Inter-CV) coefficients of variation of the linear variables analyzed in 11 large agility dogs jumping over a 60-cm hurdle.
| Abbr | Mean | S. D | Max | Min | Intra- CV | Inter-CV | |
|---|---|---|---|---|---|---|---|
| Jump distance (cm) | JD | 429,68 | 68,56 | 512,74 | 296,65 | 4,86 | 15,96 |
| Percentage of take-off distance (%) | %DTO | 60 | 4,00 | 66 | 54 | 6,85 | 6,73 |
| Percentage of landing distance (%) | %DLA | 40 | 4,00 | 47 | 34 | 10,37 | 10,20 |
| Take-off Distance (cm) | DTO | 259,89 | 45,49 | 320,90 | 164,02 | 9,99 | 17,51 |
| Landing distance (cm) | DLA | 169,79 | 31,48 | 213,09 | 118,52 | 8,23 | 18,54 |
| Ratio landing/Take-off distances | RD | 0,67 | 0,12 | 0,88 | 0,51 | 16,63 | 17,22 |
| Jump height at take-off (cm) | HwTO | 74,43 | 7,02 | 88,25 | 66,65 | 2,39 | 9,43 |
| Jump height at landing (cm) | HwLA | 63,74 | 5,46 | 76,67 | 56,54 | 2,35 | 8,57 |
| Jump height at the hurdle(cm) | HwF | 91,38 | 2,97 | 97,30 | 86,46 | 2,96 | 3,26 |
| Maximum jump height (cm) | maxJH | 93,64 | 4,04 | 103,20 | 88,55 | 3,08 | 4,32 |
| Difference between the maximum jump height and Jump height at the hurdle (cm) | maxJH-HwF | 2,26 | 1,48 | 5,90 | 0,40 | 73,89 | 65,44 |
| Difference between Jump height at the hurdle and height of the hurdle (cm) | HwF-HF | 31,38 | 2,97 | 37,30 | 26,46 | 8,52 | 9,48 |
Table 4.
Abbreviations (Abbr) of the variables and mean, standard deviation (S.D), maximum (Max), minimum (Min), intra- (intra-CV) and inter-individual (Inter-CV) coefficients of variation of the angular analyzed in 11 large agility dogs jumping over a 60-cm hurdle.
Table 4.
Abbreviations (Abbr) of the variables and mean, standard deviation (S.D), maximum (Max), minimum (Min), intra- (intra-CV) and inter-individual (Inter-CV) coefficients of variation of the angular analyzed in 11 large agility dogs jumping over a 60-cm hurdle.
| Abbr | Mean | S. D | Max | Min | Intra- CV | Inter-CV | |
|---|---|---|---|---|---|---|---|
| Back inclination angle at take-off (°) | BTO | 27,09 | 2,89 | 32,43 | 22,60 | 6,90 | 10,66 |
| Back angle to Maximum jump height (°) | BmaxJH | 5,27 | 4,34 | 12,90 | 0,68 | 111,56 | 82,41 |
| Back over the hurdle (°) | BF | -2,71 | 4,06 | 3,51 | -7,99 | 174,84 | 150,26 |
| Back inclination angle at landing (°) | BLA | -32,09 | 4,06 | -26,27 | -38,68 | 8,26 | 12,64 |
| Range of motion of back angle (°) | BROM | 59,45 | 5,69 | 68,57 | 50,93 | 3,93 | 9,57 |
Table 5.
Abbreviations (Abbr) of the variables and mean, standard deviation (S.D), maximum (Max), minimum (Min), intra- (intra-CV) and inter-individual (Inter-CV) coefficients of variation of the temporal analyzed in 11 large agility dogs jumping over a 60-cm hurdle.
Table 5.
Abbreviations (Abbr) of the variables and mean, standard deviation (S.D), maximum (Max), minimum (Min), intra- (intra-CV) and inter-individual (Inter-CV) coefficients of variation of the temporal analyzed in 11 large agility dogs jumping over a 60-cm hurdle.
| Abbr | Mean | S.D. | Max | Min | Intra- CV | Inter-CV | |
|---|---|---|---|---|---|---|---|
| Jump duration (s) | JT | 0,44 | 0,05 | 0,51 | 0,31 | 4,99 | 11,30 |
| Jump speed (m/s) | JV | 9,73 | 1,15 | 11,16 | 7,68 | 3,39 | 11,78 |
| Percentage of take-off duration (%) | %TTO | 55,95 | 5,59 | 63,00 | 48,00 | 9,42 | 10,00 |
| Percentage of landing duration (%) | %TLA | 44,05 | 5.59 | 52,00 | 37,00 | 12,01 | 12,71 |
| Percentage duration to maximum jump height (%) | % TmaxJH | 42,85 | 5,56 | 48,15 | 28,56 | 10,24 | 12,99 |
| Percentage duration to back angle zero (%) | %TBzero | 50,48 | 4,75 | 59,73 | 44,05 | 7,72 | 9,41 |
| Percentage difference between duration to maximum jump height and duration to the hurdle (%) | %TmaxJH-THwF | -13,16 | 5,79 | -4,92 | -24,05 | 59,48 | 44,02 |
| Percentage difference between duration to back angle zero and duration to the hurdle (%) | %TBzero-THwF | -5,53 | 6,92 | 5,11 | -15,62 | 254,68 | 125,04 |
Disclaimer/Publisher’s Note: The statements, opinions and data contained in all publications are solely those of the individual author(s) and contributor(s) and not of MDPI and/or the editor(s). MDPI and/or the editor(s) disclaim responsibility for any injury to people or property resulting from any ideas, methods, instructions or products referred to in the content. |
© 2025 by the authors. Licensee MDPI, Basel, Switzerland. This article is an open access article distributed under the terms and conditions of the Creative Commons Attribution (CC BY) license (http://creativecommons.org/licenses/by/4.0/).
Copyright: This open access article is published under a Creative Commons CC BY 4.0 license, which permit the free download, distribution, and reuse, provided that the author and preprint are cited in any reuse.


