
Submitted:
13 January 2025
Posted:
14 January 2025
You are already at the latest version
Abstract
The crack width assessment and reliable modelling of the crack localization process are essential for sustainability control in reinforced concrete structures affected by corrosion. Accurate modeling of crack propagation is critical for evaluating deflections, serviceability limit states, and the redistribution of internal forces, which influence ultimate limit states. This paper examines various modeling approaches and their impact on crack width predictions and load-displacement responses. The applied concrete cracking model uses the finite element method and nonlinear fracture mechanics. Influences of mesh size, reinforcement modeling approaches, and critical material parameters are analyzed. Results are validated against experimental data from direct tension tests of reinforced concrete prisms.
Keywords:
nonlinear analysis
; reinforced concrete
; fracture mechanics
; crack width
; crack localization
; crack band model
Introduction
A reliable crack width assessment is a fundamental component of sustainability control in reinforced concrete (RC) structures subjected to corrosion degradation. Accurate modeling of crack propagation and the process of crack localization are also crucial for evaluating structural deflections and deformations and assessing serviceability limit states (SLS) [1]. It also plays an essential role in redistributing internal forces and may affect the assessment accuracy of structural ultimate limit states (ULS).
The model uncertainty in numerical simulations of the resistance of RC structures under ULS is well understood [2,3]. In contrast, verifying SLS for crack width assessments remains challenging despite significant advancements in theoretical solutions. This study uses the smeared crack concept to model crack propagation, a method pioneered by Rashid [4], Cervenka & Gerstle [5,6], Bazant & Oh [7], and Rots & Blaauwendraad [8]. Its adoption in engineering practice is primarily due to its computational efficiency.
Several alternative models have also been proposed. The discrete crack approach, which introduces geometric discontinuities, was the first prominent model applied to RC beams developed by Ngo & Scordelis [9]. Subsequent advances included using linear elastic fracture mechanics (LEFM), as Saouma et al. [10] demonstrated, primarily in the analysis of concrete dams. This method was also extended to incorporate cohesive crack stresses under non-linear fracture mechanics (NLFM), as explored by Hillerborg et al. [11], Xie & Gerstle [12], and Shahbazpanahi & Paknahad [13]. However, the discrete crack model requires geometry modification during crack propagation and re-meshing, making it computationally intensive. Due to these limitations, its application in practical RC engineering has been limited.
Investigating elements under direct tension is essential for understanding the cracking behavior of RC composites [1,14,15]. While the direct tension test of a concrete prism with an embedded reinforcing bar is the most commonly used experimental configuration [16], it does not always accurately represent the behavior of building structures [14]. A central reinforcing bar in such test specimens simplifies loading conditions unrealistically, as the load is applied directly to the bar rather than uniformly distributed across the cross-section. Additionally, this setup does not account for the group effects of closely spaced reinforcement bars [17,18,19].
Numerical models tailored to simulate the deformation and cracking behavior of RC elements realistically must be validated using reliable experimental data [14]. Various techniques for strain monitoring in RC specimens have been developed [20,21,22]. The simplest and most widely used method involves measuring displacement between two points to calculate the average strain over a gauge length. Linear variable displacement transducers (LVDT) attached to the concrete surface are commonly employed for this purpose, enabling the assessment of average surface strains. However, differences often exist between the deformations of the concrete surface and the internal reinforcing bar [14]. Adequate model verification requires monitoring deformations at both locations during testing. Hence, this study relies on well-documented experimental results from Vilnius Gediminas Technical University [23]. These tests included average strain measurements on both the concrete surface and the reinforcing bars to evaluate the global deformation behavior of the samples; optical microscopy and digital image correlation (DIC) were employed to capture crack localization and the formation process.
Furthermore, in practical applications of nonlinear finite element (NLFE) models to full-scale engineering problems, it is often necessary to apply relatively coarse finite element (FE) meshes, where the process of crack propagation and localization can be captured only in a very approximate way [2,24,25].
Thus, this manuscript deals with the smeared crack model and focuses on the 3D deformation problem, assuming homogeneous and heterogeneous material modeling concepts. It investigates the assumed modeling approaches’ effect on the reliability of the crack with predictions as well as the overall load-displacement response. The applied concrete cracking model is based on nonlinear fracture mechanics. The paper investigates the influence of FE mesh size, three reinforcement modeling approaches, and critical material parameters’ influence on crack simulation and deformation prediction results. The predicted crack width and patterns are validated against experimental data from direct tension experiments of RC prisms.
Design verification of serviceability and ultimate limit states based on NLFE analysis offers an alternative to the standard design method based on elastic analysis. It is typically applied in complex structures with higher safety demands when the additional effort required can be justified or a robust reliability assessment is substantiated, such as in accidents and forensic investigations. This process is also supported by the recent development of the new generation of design standards, which contain guidelines and safety formats for NLFE analysis, such as the fib Model Code 2020 [1] and the recent generation of Eurocode 2 [26].
Constitutive Model for Concrete Cracking
Numerous material models have been developed over the years. This paper does not aim to provide a comprehensive overview or summary of all these models. For a detailed exploration of the topic, readers are referred to [27]. Given the vast diversity of material models and approaches to nonlinear analysis, offering universal guidelines or recommendations for their application in engineering practice is impractical. Consequently, detailed guidelines or methods for addressing modeling uncertainties can only be specific to certain classes of constitutive models, individual material models, or even particular software platforms.
The examples presented in this paper were computed using the FE software ATENA [28]. Therefore, some conclusions are specific to this software or, at most, applicable to models based on the smeared crack approach and crack band method.
The material model employed in this work is a fracture-plastic model, described in greater detail in [29,30]. This concrete material constitutive model assumes minor strains and is based on the decomposition of strain tensor into elastic (), plastic (), and fracture () components. Stress development is governed by a rate equation that captures the progressive damage (concrete cracking) and plastic yielding (concrete crushing).
The following rules govern the evolution of plastic and fracturing strains:
In the above formulas, is the stress tensor, with ij being the tensor indices, is t the fourth order elasticity tensor representing the concrete elastic stiffness, is the plastic multiplier rate and is the plastic potential function, is the inelastic fracturing multiplier and is the potential to define the direction of inelastic fracturing strains. The multipliers are evaluated based on the consistency conditions.
The strength criterion of Menetrey & Willam [31] is used to determine the plasticity of concrete in a multiaxial stress state in compression (Figure 1a) with nonlinear hardening/softening (Figure b and 1c).
The Rankine criterion with exponential softening of Hordijk [32] (Figure 1d) is used for tensile cracking, where w stands for the crack width. The crack band model (CBM) approach of Bazant & Oh [7] relates crack opening displacement to fracturing strains. An analogical approach is used also in compression, according to Cervenka et al. [33]. The crack band Lt and the crush band size Lc are adjusted regarding the crack orientation approach proposed by Cervenka & Margoldova [34]. Figure 2 and Equation 4 illustrate this method, where the crack angle θ is the average angle between the crack direction and element sides.
with
The above formulation controls the strain localization, accounting for the mesh size and the crack orientation. According to Slobbe et al. [35], parameter α is introduced to cover the localization effect due to the various element types.
Additional governing features of cracked RC include the reduction of compressive strength, shear stiffness, and shear strength degradation, often referred to as a shear retention effect. These features represent key elements of the constitutive model of RC [30] and are crucial in problems dominated by shear failure.
Cervenka et al. [33] highlighted the limitations of the CBM approach in modeling reinforced concrete when extremely coarse or over-refined FE meshes are employed. Figure 3a and b illustrate this issue for the coarse mesh case. When coarse FE meshes are used, the standard assumption of the CBM approach—that a single crack or localization zone will develop within the finite element—no longer holds. Reinforcement spacing, cover size, and reinforcement diameter cause cracks to localize at specific distances, which may be smaller than the FE mesh size utilized. A similar situation may appear in the other limiting case if over-refined FE meshes are used, as schematically described in Figure 3c. This figure (the top image) visualizes crack localization near the reinforcement bar influenced by rib spacing and aggregate size. The over-refined FE mesh results in parasitic crack initiation (the bottom image), overestimating the initial crack energy release and artificially stiff response at the crack initiation stage [36].
Experimental Database
This study aims to determine the most efficient and accurate modeling approach to the calculation of crack width and crack localization using the NLFE analysis with the concrete material model described in Section 2. The used material model can be interpreted as a typical representation of smeared crack models, so it may be possible to generalize the results obtained to other smeared crack models based on the CBM approach. Crack development and localization in reinforced concrete members occur mainly in the areas of reinforced concrete structures in tension. Therefore, the most straightforward and practical problem for evaluating a proper modeling procedure is considering a tensile concrete prism reinforced with several steel bars. The test data of Gribniak et al. [23] are selected as a reference solution because of precise crack measurement and well-documented results.
Gribniak et al. [23] extensively studied crack width data and localization processes for different reinforcement arrangements, diameters, and cover depths for prismatic reinforced concrete members in direct tension. The experimental data represent an excellent information source for validating numerical modeling methods and approaches. This study represents the first step in a research project to develop suitable and efficient models for crack width and pattern assessment. It aims to identify an appropriate modeling approach and the most critical parameters affecting the reliability of crack width and localization identification. These results will further be used to develop a more general model and method for other reinforcement arrangements and complex loading scenarios. Therefore, only a single specimen geometry is selected from this study and will be tested using various modeling methods and approaches. This geometry is denoted as P4x10-C30-L in the reference [23]. It corresponds to a concrete prism element with a square cross-section of 150×150 mm and 1210 mm in length, which is reinforced by four bars with a diameter of 10 mm and a cover depth (c) of 30 mm (Figure 4).
Numerical Model
Although the geometry of the RC prism (Figure 4) is simple, its numerical model is not straightforward. Several modeling approaches are investigated to evaluate their effectiveness and accuracy for modeling crack width evolution and accuracy.
Figure 5 shows the RC prism model. Figure 5a shows the full 3D model. Figure 5b shows the quarter model utilizing the geometrical symmetry of the problem. Several meshes are used to model the concrete prismatic element (Figure 5c). The reinforcement is modeled as embedded 1D elements. The embedded 1D elements are meshed independently and constrained by the “master/slave” condition with the surrounding 3D solid concrete element, describing the typical reinforcement modeling approach in ATENA software [28,37]. This method also allows efficient modeling of the bond failure of reinforcement in concrete, as exemplified in [38]. In this study, however, the potential bond failure is not considered, and it is assumed to be resolved by cracking the surrounding concrete elements.
The embedded 1D reinforcement elements can be modeled as truss elements with only axial stiffness or as 1D beam elements with axial and bending behavior (Figure 6). This bending propagates the unsymmetric cracks, resulting in eccentricity tension of the RC elements [39]. This study also considers the solid (3D) model of the reinforcement bars shown in Figure 7. In this model, the reinforcement is modeled using 3D solid finite elements with the properties of a steel material.
Figure 5c also shows the mesh with extremely coarse FE meshes, i.e., 500 mm. This model cannot adequately capture the crack localization process, and the number of obtained cracks is incomparable to the experimental observations since the CBM approach (Figure 2) assumes that a single crack can form inside a finite element. The purpose of this coarse model is to mimic the situation in most practical NLFE analyses when relatively coarse FE meshes are used when analyzing large-scale models of bridges, tunnels, and whole buildings. It is impossible to model such structures with sufficiently small FE mesh sizes that can accurately capture the evolution and localization of cracks around each reinforcement bar.
The second objective of this study is to investigate whether a proper choice of modeling parameters of large-scale models can provide correct results regarding crack width and structural stiffness, making it applicable in practice. Cervenka et al. [40] described the CBM limits for RC structures with coarse and refined FE meshes in detail. For coarse FE meshes, it was proposed that a direct definition of crack spacing cs be used instead of Lt in Equation 4. Another contributing parameter to the crack width predictions for coarse FE meshes with embedded reinforcement is the tension stiffening parameter cts. This parameter limits the softening diagram of concrete in tension (Figure 8). It represents a somewhat crude but straightforward way to consider the complexity of crack localization and development in reinforced concrete [41,42].
The material parameters for the NLFE models are selected based on the data provided by the experimental program as described in [23], and they are summarized in Table 1. The table contains all the material parameters of the used concrete constitutive model, although the presented analysis activates only the fracturing part of the model. Therefore, the main parameters affecting the model behavior in this study are Ec, ft, and GF.
Evaluation of the Results
This section summarizes the crack development and propagation results of the different FE models discussed in Section 4. Two nominally identical prismatic RC specimens, P4x10-C30-L [23], were selected for this study and used as a reference for comparing and evaluating the numerical models’ adequacy. Table 2 summarizes the analysis results.
The subsequent figures show the load-strain diagrams for these FE models. The vertical axis represents the applied load P, and the horizontal axis is the average strain in the four reinforcement bars calculated as the relative elongation between the exit points of each bar at the ends of the concrete prism denoted as M1 and M2 in Figure 4. They include comparing the experimental data for two nominally identical test specimens P4x10-C30-L [23], denoted by dashed red lines. For comparison, the diagrams also include the response of a model with reinforcement bars only without the surrounding concrete, denoted as “Bare Bar.”
Figure 9 shows the effect of using the full 3D model compared to the symmetric quarter model. Even though the model’s initial behavior should be symmetric, once the crack starts due to numerical rounding errors, crack propagation, and localization, the behavior is not symmetric anymore, which can be observed in the subsequent plots of crack pattern and widths. This limitation explains why the results from the quarter model show a much stiffer response.
Figure 10 shows the effect of the reinforcement modeling using 1D truss or beam elements (Figure 6). In this direct tensile test, the reinforcement’s bending stiffness does not affect the simulation results, even though minor bending develops along the prism due to the unsymmetric crack propagation and localization.
Figure 11 investigates the effect of mesh size. It shows that if a sufficiently fine mesh is used (below 30 mm), the FE analysis can adequately simulate the response of the RC prism. The proper fracture mechanics-based concrete material model reasonably captures the well-known tension stiffening effect [42] in reinforced concrete structures. However, the coarse FE mesh (B M500) cannot adequately represent the tension-stiffening effect.
Figure 11 shows the overestimation of the cracking resistance by all the models. It is interesting to observe that this can be remedied by the introduction of random fields for the material parameters. Thus, Figure 12 shows the nonlinear analysis results when a random distribution of tensile strength ft and fracture energy GF is considered with the coefficient of variation (COV) of 0.2 and 0.25. For each case, two samples of two different random distributions were used. Vorechovsky & Novak [43] proposed a method to generate random fields in the reliability module SARA [43] for ATENA. Figure 13 shows the distributions of mechanical properties for two random field samples generated for the models “B M15, RF, COV=0.25,s-001” and “B M15, RF, COV=0.25,s-002.”
Figure 14 exemplifies the problem of modeling crack width and localization in relatively coarse FE meshes, which are used to model large-scale structures such as bridges, buildings, and nuclear containments. It shows that too-brittle behavior with overestimation of crack width is obtained unless some additional material parameters, such as crack spacing cs or tension stiffening cts, are used.
The loading procedure [23] was performed up to the load level of 100 kN as it focused mainly on the crack width in serviceability limit states, i.e., well below the yielding of reinforcement. It is interesting to evaluate the model behavior when the yielding of reinforcement is reached. The results for the selected best modeling approaches are summarized in Figure 15. It shows that reasonable results are obtained for the models with the fine mesh and average material parameters, i.e., “T M15 mean”. The best results are obtained for the case with random fields of ft and GF, i.e., model “TM 15, RF”. For the coarse FE mesh, reasonable results are obtained if the crack spacing and tension stiffening are used, i.e., cs = 130 mm and cts = 0.4.
Verifying the crack width and pattern predictions is essential for ensuring the serviceability limit state (SLS) and durability analysis [1]. The serviceability state is typically evaluated at significantly lower loading levels well below the levels when reinforcement yielding occurs. Therefore, this study compares the crack width results at the service load level P = 100 kN. This load level corresponds to approximately 60% of the ultimate load when cracks should be well developed, but reinforcement yielding is not yet occurring. The average experimentally observed crack width was 0.15 mm, while the maximal crack width was determined to be 0.22 mm (Table 3). It should be noted that in experiments, only visible surface cracks are typically evaluated. Thus, the DIC system assessed the crack width in the experimental program [23], estimating the average and maximal crack width for a single surface; the measurements were localized along the reinforcement location. This limitation should be considered when comparing with the subsequent contour plots of the crack widths calculated by the numerical analyses.
Figure 16 shows the simulated crack width contour plot corresponding to the service load level P = 100 kN, which is typical for ATENA software [28]. Figure 16a shows the crack widths on the outer surface extrapolated over each finite element surface. Figure 16b displays the average crack location and direction inside each finite element in the model's interior. The figure shows the cracks exceeding 0.05 mm; otherwise, the view would be confused by micro-cracks. The plots are taken from the model “B M15, total” (Table 2). It is relevant to mention that with this mesh size of 15 mm, the model quite well represents the expected development of cracks around the reinforcement that essentially simulates the loss of bond between the reinforcement and concrete, and the well-known tension stiffening effect is thus automatically captured just by the proper constitutive model of concrete based on fracture mechanics and crack band model.
Figure 17 shows the crack width and localization in the random field models. The experimentally measured maximal crack width (0.22 mm) is slightly overestimated. Still, it should be noted that in the experiment, the crack width was evaluated by DIC only at the location of the reinforcement at one surface, as Figure 18 shows. This figure shows the experimental crack pattern on all four outer surfaces, obtained crack spacing, and comparison with the results obtained in the numerical models with random field application. It shows that the crack pattern is captured adequately and that the dependence of the crack pattern and localization is based on the randomness of the distribution of the material heterogeneity.
Due to the material heterogeneity and randomness of the material properties, the value of the maximal and average crack width is a statistical property. Statistical and probabilistic methods may evaluate it. A detailed analysis of crack width modeling uncertainty was performed in [45].
For this investigation, the assessment of crack width predictions is summarized in Table 3. It lists the model uncertainty, which is defined as:
Table 3 shows that the crack width prediction error does not reach 20%. The model is more accurate for the mean crack width than the maximum one. Still, conclusions about the overall accuracy cannot be made on a single case, and a more statistically representative study should be performed. Such investigation is presented in the research [45]. The primary purpose of this study was to compare the various modeling approaches available in typical NLFE simulation software and, namely, to investigate how they can be extended for modeling large-scale problems using coarse FE meshes with a discretization size exceeding 200 mm. The FE mesh size of 500 mm was selected as a representative FE mesh size applicable for large-scale NLFE analysis. Still, the practical models typically require FE mesh sizes exceeding 500 mm.
The overall structural response with relatively coarse FE meshes for the investigated problem was already evaluated in Figure 14 and 15. The results show that satisfactory results can be obtained if additional parameters are introduced into the concrete constitutive model in the case of the coarse mesh. In this study, it was the application of a suitable value of crack spacing csp and tension stiffening parameter cts. Figure 19 shows how this approach works to predict crack width and localization. This figure demonstrates that the average crack width can be predicted adequately. The crack localization and spacing cannot be obtained as this was our input through the spacing parameter csp. Because of that, the maximal width cannot be accurately calculated.

Table 2.
Model uncertainty for mean θμ and maximal crack θmax widths.
| Model | Bar | Mesh [mm] | θμ | θmax |
|---|---|---|---|---|
| T M15 | Truss | 15 | 1.168 | 1.031 |
| B M15 | Beam | 15 | 1.090 | 0.838 |
| B M10 | Beam | 10 | 1.048 | 1.136 |
| Solid | 3D | 10 | 1.048 | 1.249 |
| B M15, RF | Beam | 15 | 1.221 * | 0.797 * |
| Average crack width in the experiment at P = 100 kN [23] | 0.15 mm | |||
| Maximum crack width in the experiment at P = 100 kN [23] | 0.22 mm | |||
* Calculated averages from four samples/analyses with COV 0.2 and 0.25.
Based on the above analysis and discussions, the most successful models and approaches are summarized in Figure 20. Based on these results, the following conclusions can be identified:
- If sufficiently fine mesh is used with FE mesh sizes in the range of 15–30 mm, which corresponds to typical concrete aggregate sizes, a good match of structural response and crack width and spacing can be obtained).
- Applying random fields for the governing material parameters such as tensile strength ft of fracture energy GF improves the model behavior at the onset of cracking and the overall response (model “T M15, RF, COV=0.2, s-001”).
- For large-scale modeling with coarse FE meshes, suitable limits of crack spacing (cs) and tension stiffening (cts) should be prescribed to reasonably predict crack width and structural response (model “T M500, cs = 130, cts = 0.4”).
The results of this investigation will be used to develop suitable macro-scale models for the large-scale analysis of RC structures.
Concluding Remark
This paper presents a numerical investigation into the most suitable modeling approaches for simulating crack development in reinforced concrete structural elements. It marks the initial phase of a research project to develop efficient numerical models for assessing crack width and patterns, employing carefully documented test results conducted at Vilnius Gediminas Technical University. The study seeks to identify the best modeling approaches and the critical parameters that influence the reliability of crack width and localization identification, focusing on relatively coarse finite element meshes typical in large-scale engineering problems. The findings from this investigation will be used to create a more comprehensive model and method applicable to various reinforcement configurations and complex loading scenarios.
Author Contributions
Conceptualization, methodology, software, formal analysis, investigation, visualization, resources, funding acquisition, writing—original draft preparation, Č.V., and Č.J.; tests, data curation, data analysis, validation, writing—review and editing, A.R., and G.V.
Funding
This research was funded by the Grant Agency of the Czech Republic, grant number 24-10892S, under the project “Machine Learning for Multiscale Modelling of Spatial Variability and Fracture for Sustainable Concrete Structures.”
Conflicts of Interest
The authors declare no conflicts of interest. The funders had no role in the study’s design, data collection, analysis, interpretation, manuscript writing, and publication.
References
- International Federation for Structural Concrete (fib). fib Model Code for Concrete Structures (2020); fib: Lausanne, Swiss, 2024. [Google Scholar]
- Cervenka, V.; Cervenka, J.; Kadlec, L. Model uncertainties in numerical simulations of reinforced concrete structures. Structural Concrete 2018, 19, 2004–2016. [Google Scholar] [CrossRef]
- Ibrahim, N.; Elkholy, S.; Godat, A. Implementation of modified compression field theory to simulate the behavior of fiber-reinforced polymer shear-strengthened reinforced concrete beams under monotonic loading. Buildings 2023, 13, 898. [Google Scholar] [CrossRef]
- Rashid, Y. Ultimate strength analysis of prestressed concrete pressure vessels. Nuclear Engineering and Design 1968, 7, 334–344. [Google Scholar] [CrossRef]
- Cervenka, V.; Gerstle, K.H. Inelastic analysis of reinforced concrete panels: theory. IABSE Publications 1971, 31, 31–45. [Google Scholar]
- Cervenka, V.; Gerstle, K.H. Inelastic analysis of reinforced concrete panels: experimental verification and application. IABSE Publications 1972, 32, 25–39. [Google Scholar]
- Bažant, Z.P.; Oh, B.H. Crack band theory for fracture of concrete. Materials and Structures 1983, 16, 155–177. [Google Scholar] [CrossRef]
- Rots, J.G.; Blaauwendraad, J. Crack models for concrete, discrete or smeared? Fixed, multi-directional or rotating? Heron 1989, 34, 1–59. [Google Scholar]
- Ngo, D.; Scordelis, A.C. Finite element analysis of reinforced concrete beams. ACI Journal Proceedings 1967, 64, 152–163. [Google Scholar] [CrossRef]
- Saouma, V.E.; Ayari, M.L.; Leavell, D.A. Mixed mode crack propagation in homogeneous anisotropic solids. Engineering Fracture Mechanics 1987, 27, 171–184. [Google Scholar] [CrossRef]
- Hillerborg, A.; Modéer, M.; Petersson, P. Analysis of crack formation and crack growth in concrete by means of fracture mechanics and finite elements. Cement and Concrete Research 1976, 6, 773–781. [Google Scholar] [CrossRef]
- Xie, M.; Gerstle, W.H. Energy-based cohesive crack propagation modeling. ASCE Journal of Engineering Mechanics 1995, 121, 1349–1358. [Google Scholar] [CrossRef]
- Shahbazpanahi, S.; Paknahad, M. Simulation of the Mode I fracture of concrete beam with cohesive models. Journal of Computational Applied Mechanics 2017, 48, 207–216. [Google Scholar] [CrossRef]
- Gribniak, V.; Rimkus, A.; Torres, L.; Jakstaite, R. Deformation analysis of reinforced concrete ties: Representative geometry. Structural Concrete 2017, 18, 634–647. [Google Scholar] [CrossRef]
- García, R.; Caldentey, A.P. Influence of type of loading (tension or bending) on cracking behaviour of reinforced concrete elements. Experimental study. Engineering Structures 2020, 222, 111134. [Google Scholar] [CrossRef]
- Naotunna, C.N.; Samarakoon, S.S.M.; Fosså, K.T. Applicability of existing crack controlling criteria for structures with large concrete cover thickness. Nordic Concrete Research 2021, 64, 69–91. [Google Scholar] [CrossRef]
- Otsuka, K.; Ozaka, Y. Group effects on anchorage strength of deformed bars embedded in massive concrete block. In Proceedings of the International Conference – Bond in Concrete from Research to Practice, Riga, Latvia, 1992, 1, 38–47. [Google Scholar]
- Calderón, E.; Fernández, J. Investigación experimental sobre los modelos normativos de fisuración en piezas de hormigón armado sometidas a flexión pura. Informes de la Construcción 2010, 62, 62:43–56. [Google Scholar] [CrossRef]
- Gribniak, V.; Jakubovskis, R.; Rimkus, A.; Ng, P.; Hui, D. Experimental and numerical analysis of strain gradient in tensile concrete prisms reinforced with multiple bars. Construction and Building Materials 2018, 187, 572–583. [Google Scholar] [CrossRef]
- Zuccarello, B.; Di Franco, G. Analysis of the accuracy of fiber-optic strain transducers installed by using composite smart patches. The Journal of Strain Analysis for Engineering Design 2015, 50, 373–385. [Google Scholar] [CrossRef]
- Quadflieg, T.; Stolyarov, O.; Gries, T. Carbon rovings as strain sensors for structural health monitoring of engineering materials and structures. The Journal of Strain Analysis for Engineering Design 2016, 51, 482–492. [Google Scholar] [CrossRef]
- Ye, Z.; Zhu, Z.; Xing, F.; Zhou, Y. Performance assessment of reinforced concrete structures using self-sensing steel fiber-reinforced polymer composite bars: theory and test validation. Engineering. [CrossRef]
- Gribniak, V.; Rimkus, A.; Caldentey, A.P.; Sokolov, A. Cracking of concrete prisms reinforced with multiple bars in tension-the cover effect. Engineering Structures 2020, 220, 110979. [Google Scholar] [CrossRef]
- Engen, M.; Hendriks, M.A.N.; Øverli, J.A.; Åldstedt, E. Non-linear finite element analyses applicable for the design of large reinforced concrete structures. European Journal of Environmental and Civil Engineering 2019, 23, 1381–1403. [Google Scholar] [CrossRef]
- Rajesh, S.; Babu, K.S.J.; Selvi, M.C.; Chellapandian, M. automated surface crack identification of reinforced concrete members using an improved YOLOv4-Tiny-based crack detection model. Buildings 2024, 14, 3402. [Google Scholar] [CrossRef]
- European Committee for Standardization (CEN). Eurocode 2: Design of Concrete Structures - Part 1-1: General Rules and Rules for Buildings EN 1992-1-1: 2023, 2nd Generation; CEN: Brussels, Belgium, 2023. [Google Scholar]
- Jirásek, M.; Bažant, Z.P. Inelastic Analysis of Structures; John Willey & Sons: Baffins Lane, Chichester, UK, 2001. [Google Scholar]
- Červenka, V.; Červenka, J.; Jendele, L. ATENA Program Documentation, Part 1: Theory; Cervenka Consulting s.r.o.: Prague, Czech Republic, 2024. [Google Scholar]
- Červenka, J.; Červenka, V.; Eligehausen, R. Fracture-plastic material model for concrete, application to analysis of powder actuated anchors. In Proceedings of the Third International Conference on Fracture Mechanics of Concrete and Concrete Structures, FRAMCOS-3, Gifu, Japan, 1107–1116., 12-16 October 1998. [Google Scholar]
- Červenka, J.; Papanikolaou, V. Three dimensional combined fracture-plastic material model for concrete. International Journal of Plasticity 2008, 24, 2192–220. [Google Scholar] [CrossRef]
- Menetrey, P.; Willam, K.J. Triaxial failure criterion for concrete and its generalization. ACI Structural Journal 1995, 92, 311–318. [Google Scholar] [CrossRef]
- Hordijk, D.A. Local Approach to Fatigue of Concrete . PhD Thesis, Delft University of Technology, The Netherlands, 1991.
- Červenka, J.; Červenka, V.; Laserna, S. On finite element modelling of compressive failure in brittle materials. In Computational Modeling of Concrete Structures, 1st ed.; Bicanic, N., Mang, H., Meschke, G., René de Borst, R., Eds.; CRC Press: St. Anton, 2014; Volume 1, pp. 273–282. [Google Scholar]
- Červenka, V.; Margoldová, J. Tension stiffening effect in smeared crack model. In Engineering Mechanics: Proceedings of 10th Conference; Sture, S., Ed.; Sture, S., Ed.; ASCE: New York, 1995; Volume 1, pp. 655–658. [Google Scholar]
- Slobbe, A.T.; Hendriks, M.A.N.; Rots, J.G. Systematic assessment of directional mesh bias with periodic boundary conditions: Applied to the crack band model. Engineering Fracture Mechanics 2013, 109, 186–208. [Google Scholar] [CrossRef]
- Gribniak, V.; Kaklauskas, G.; Idnurm, S.; Bacinskas, D. Finite element mesh size effect on deformation predictions of reinforced concrete bridge girder. The Baltic Journal of Road and Bridge Engineering 2010, 5, 19–27. [Google Scholar] [CrossRef]
- Jendele, L.; Cervenka, J. On the solution of multi-point constraints – Application to FE analysis of reinforced concrete structures. Computers and Structures 2009, 87, 87(15–16). [Google Scholar] [CrossRef]
- Jendele, L.; Cervenka, J. Finite element modelling of reinforcement with bond. Computers and Structures 2006, 84, 1780–1791. [Google Scholar] [CrossRef]
- Jakubovskis, R.; Kupliauskas, R.; Rimkus, A.; Gribniak, V. Application of FE approach to deformation analysis of RC elements under direct tension. Structural Engineering and Mechanics 2018, 68, 345–358. [Google Scholar] [CrossRef]
- Cervenka, J.; Cervenka, V.; Laserna, S. On crack band model in finite element analysis of concrete fracture in engineering practice. Engineering Fracture Mechanics 2018, 197, 27–47. [Google Scholar] [CrossRef]
- Cervenka, V. Constitutive model for cracked reinforced concrete. ACI Journal Proceedings 1985, 82, 877–882. [Google Scholar] [CrossRef]
- Borosnyoi, A.; Balazs, G.L. Models for flexural cracking in concrete: the state of art. Structural Concrete 2005, 6, 53–62. [Google Scholar] [CrossRef]
- Vorechovsky, M.; Novak, D. Simulation of random fields for stochastic finite element analysis. In Proceedings of the International Conference on Structural Safety and Reliability, ICoSSaR 2005; Augusti, G., Schuëller, G.I., Ciampoli, M., Holland, 2005, Eds.; Millpress: Rotterdam; pp. 2545–2552.
- Havlasek, P., Pukl. R., SARA. Software for Probabilistic Analysis of Reinforced Concrete Structures; Cervenka Consulting s.r.o.: Prague, Czech Republic, 2024. [Google Scholar]
- Cervenka, V.; Rimkus, A.; Gribniak, V.; Cervenka, J. Simulation of the crack width in reinforced concrete beams based on concrete fracture. Theoretical and Applied Fracture Mechanics 2022, 121, 103428. [Google Scholar] [CrossRef]
Disclaimer/Publisher’s Note: The statements, opinions, and data contained in all publications are solely those of the individual author(s) and contributor(s) and not of MDPI and/or the editor(s). MDPI and/or the editor(s) disclaim responsibility for any injury to people or property resulting from any ideas, methods, instructions, or products referred to in the content. |
Figure 1.
Concrete material model: (a) 3D failure criterion in principal stress frame; (b) hardening law in compression; (c) softening law in compression using the crush band approach; (d) crack band model for concrete in tension.
Figure 1.
Concrete material model: (a) 3D failure criterion in principal stress frame; (b) hardening law in compression; (c) softening law in compression using the crush band approach; (d) crack band model for concrete in tension.
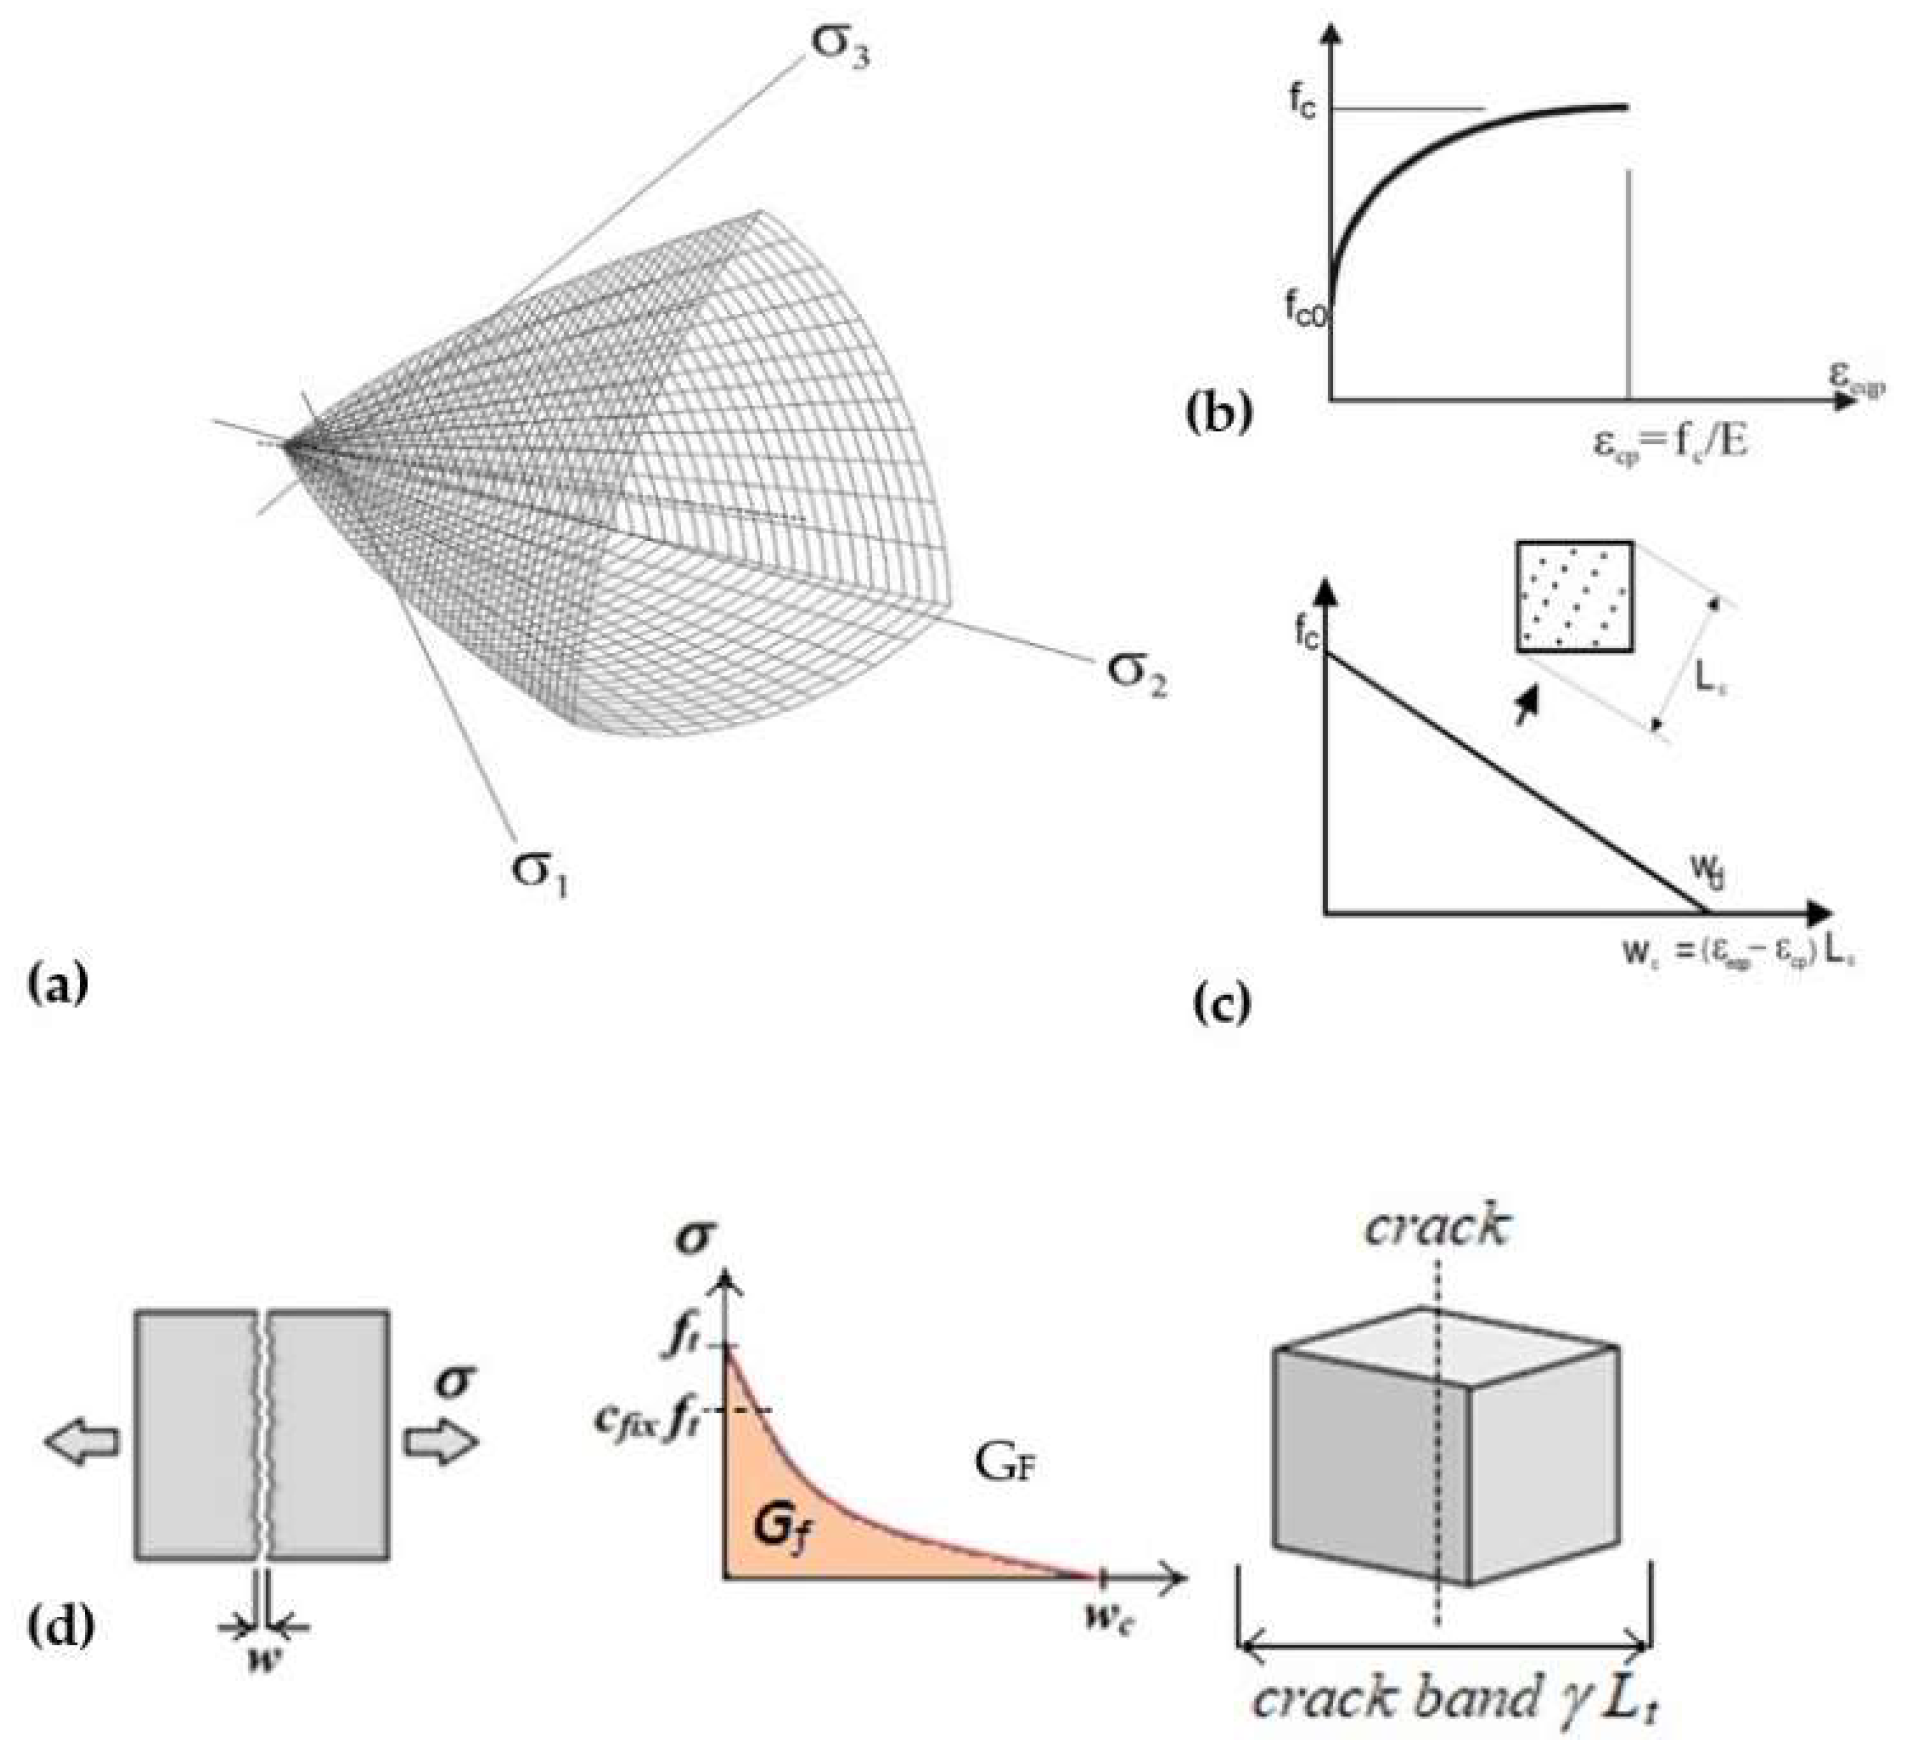
Figure 2.
Crack band definition accounting for crack orientation inside the finite element.
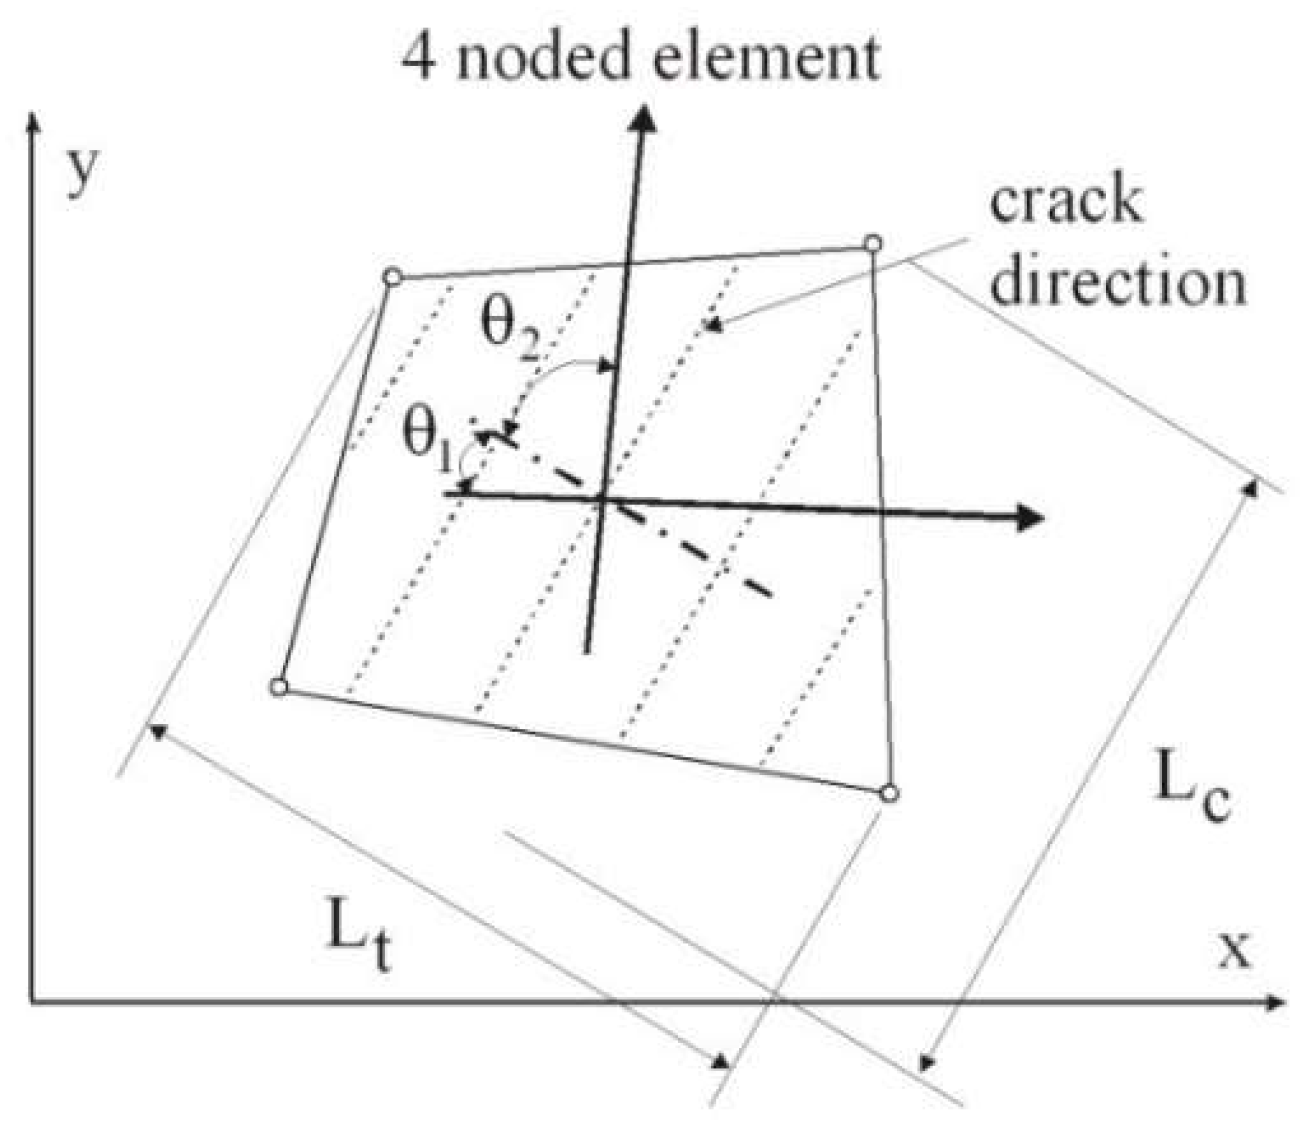
Figure 3.
Finite element (FE) meshing: (a) adequate mesh size with valid assumption of the crack band, (b) incorrect assumption for the large mesh size when more than one crack shall localize inside the finite element, (c) visualization of crack localization near reinforcement bar and parasitic crack initiation for the over-refined FE mesh.
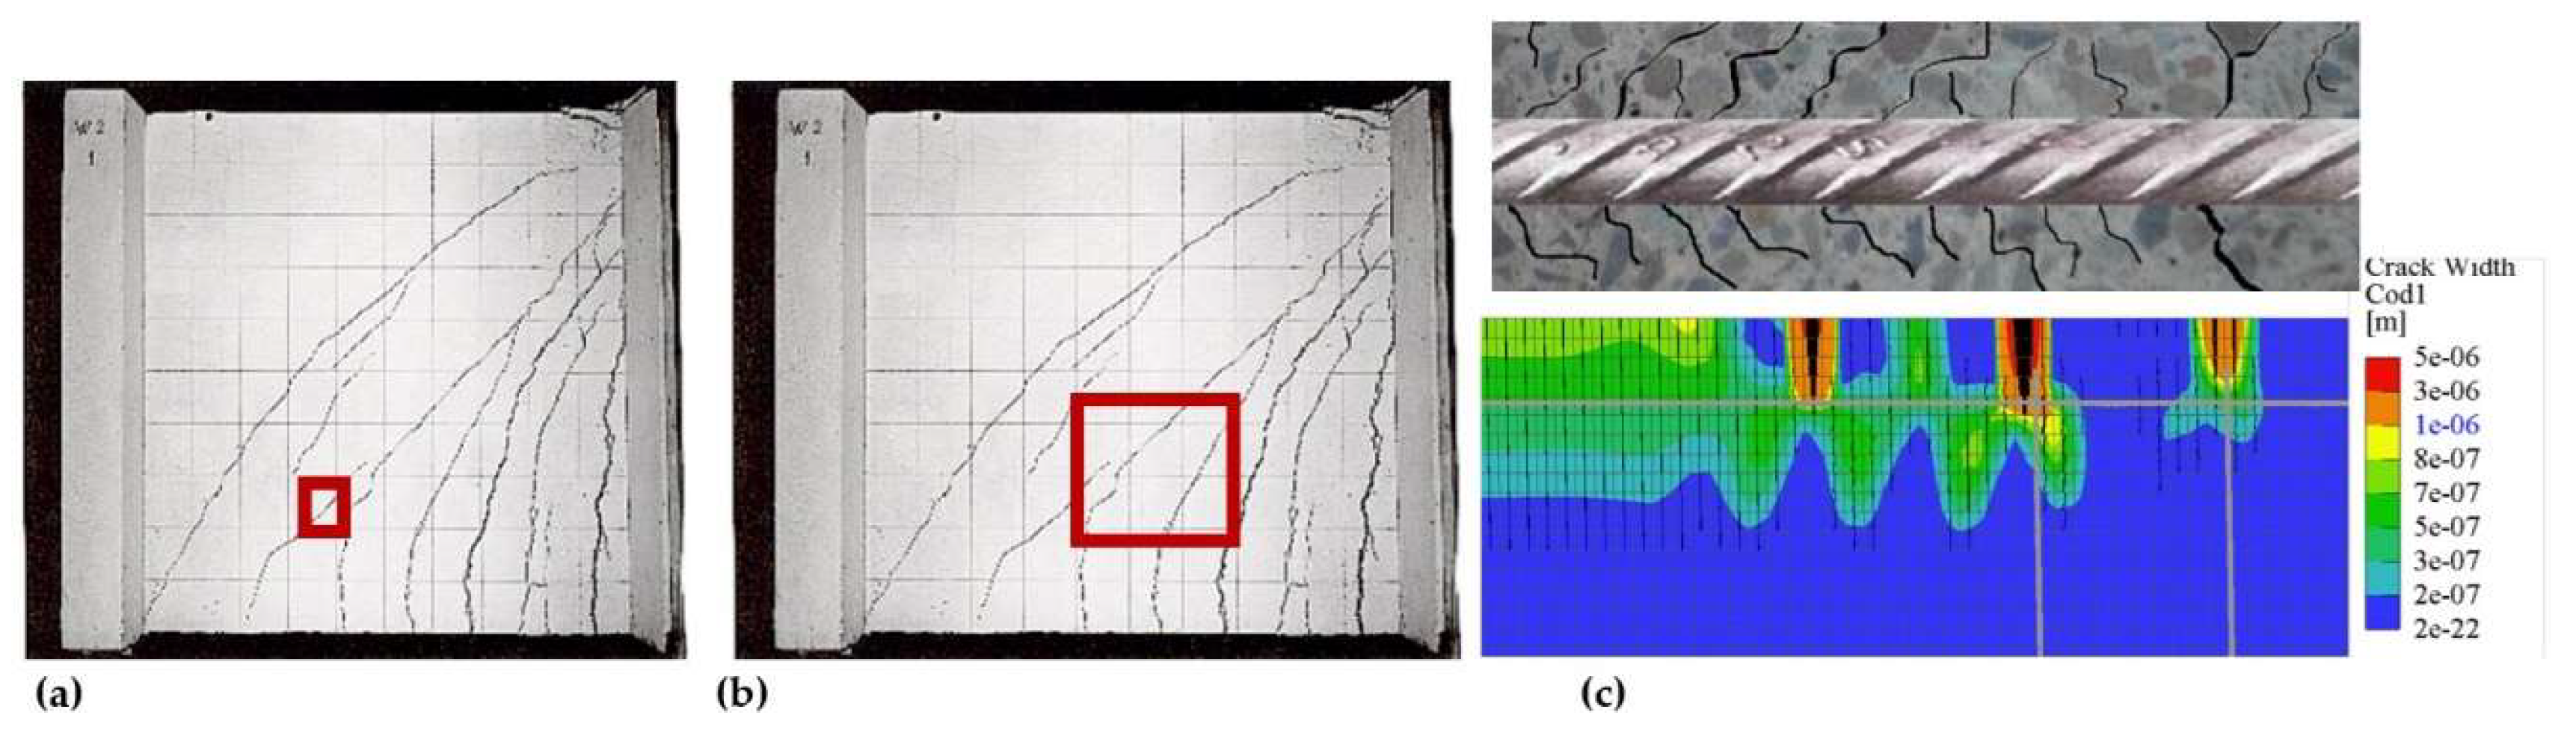
Figure 4.
The geometry of the reinforced concrete tensile prism P4x10-C30-L [23].
Figure 4.
The geometry of the reinforced concrete tensile prism P4x10-C30-L [23].
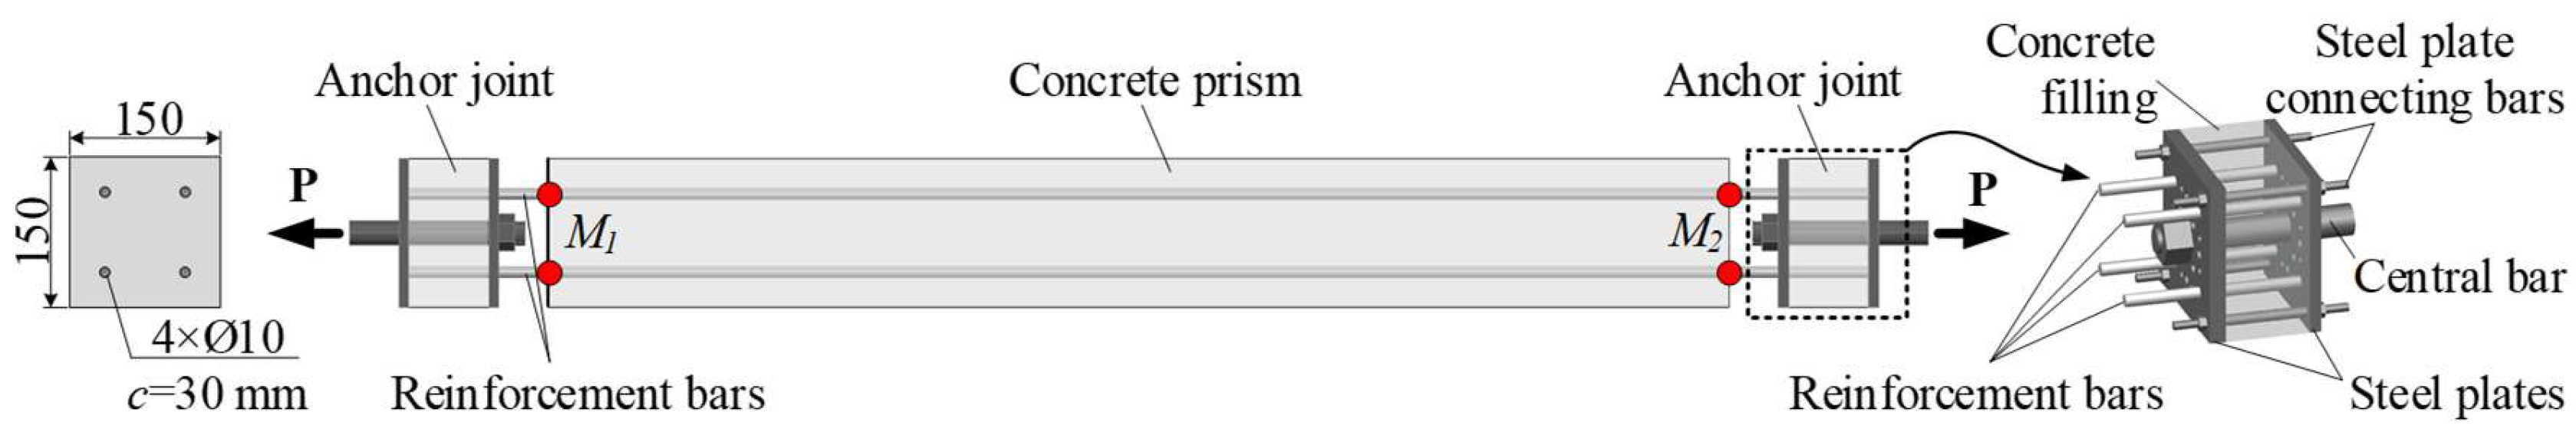
Figure 5.
3D model of the tensile RC prism with embedded discrete reinforcement: (a) and (b) a 3D model of the RC prism; (c) a 3D symmetric quarter model; (d) a side view of the 3D meshes: a 15 mm mesh size (refined mesh), a 30 mm size (regular mesh), and a 500 mm size (coarse mesh).
Figure 5.
3D model of the tensile RC prism with embedded discrete reinforcement: (a) and (b) a 3D model of the RC prism; (c) a 3D symmetric quarter model; (d) a side view of the 3D meshes: a 15 mm mesh size (refined mesh), a 30 mm size (regular mesh), and a 500 mm size (coarse mesh).
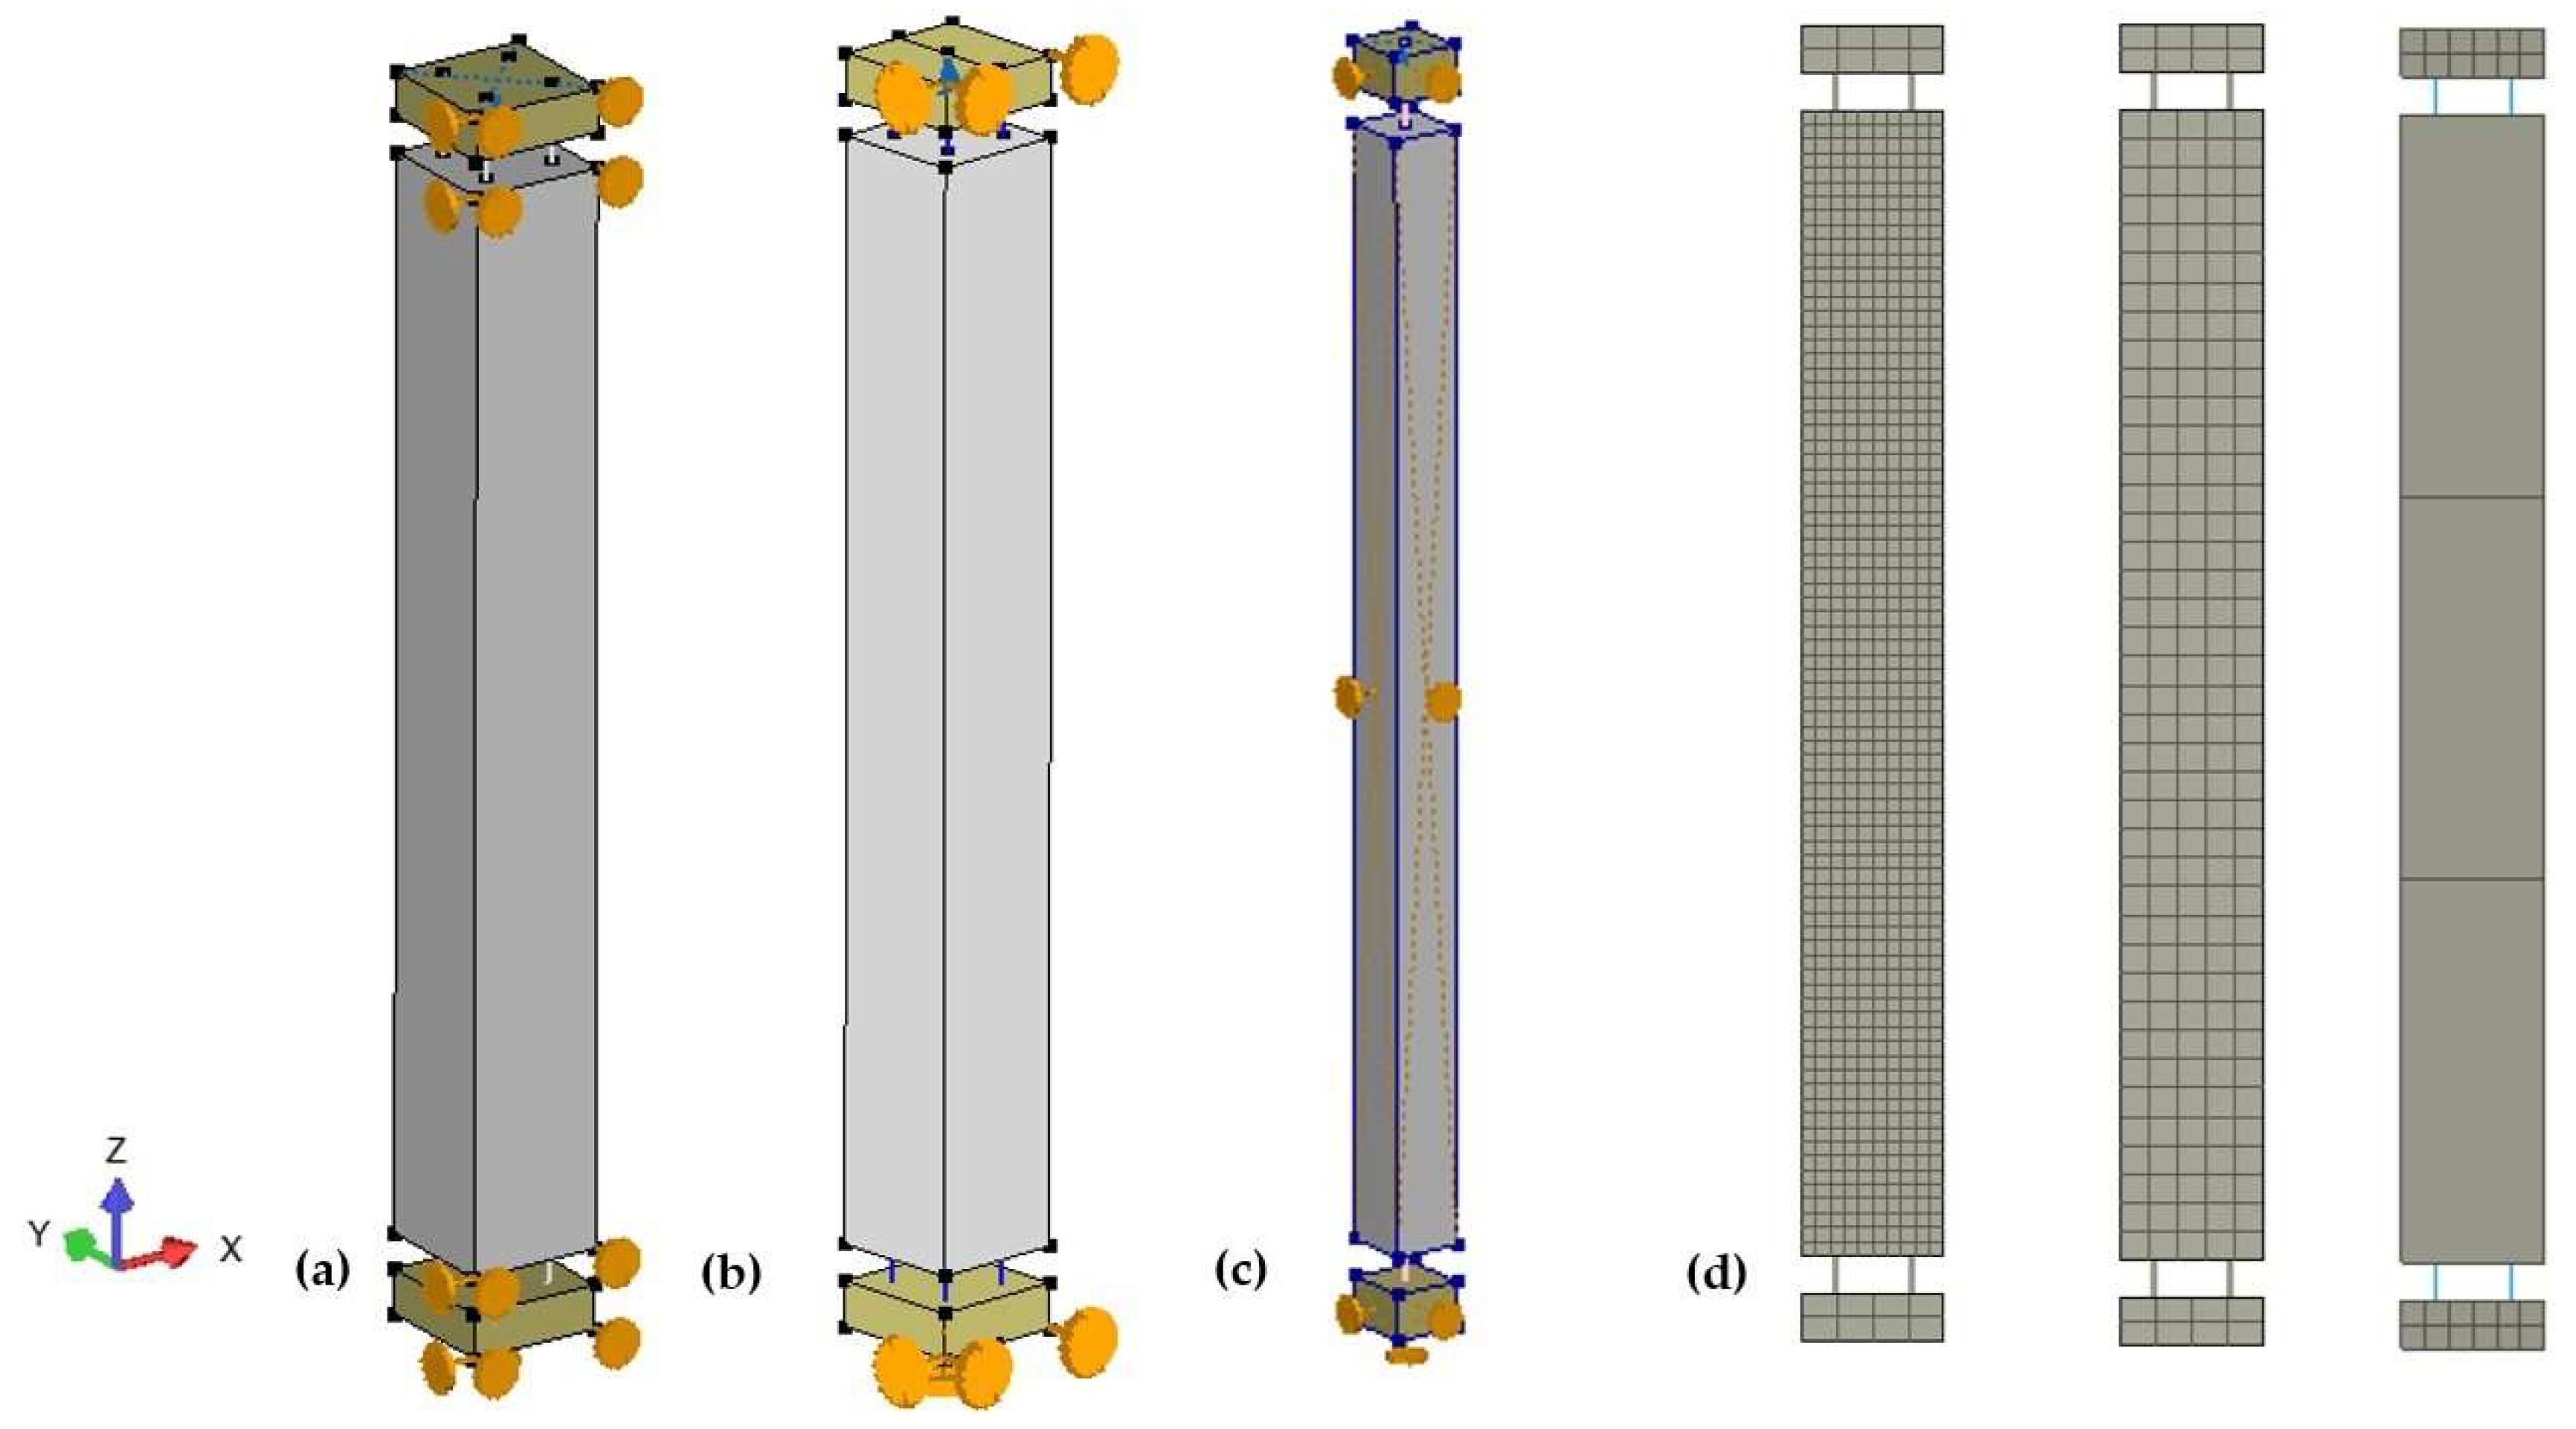
Figure 6.
Modeling embedded reinforcement as truss or beam elements.
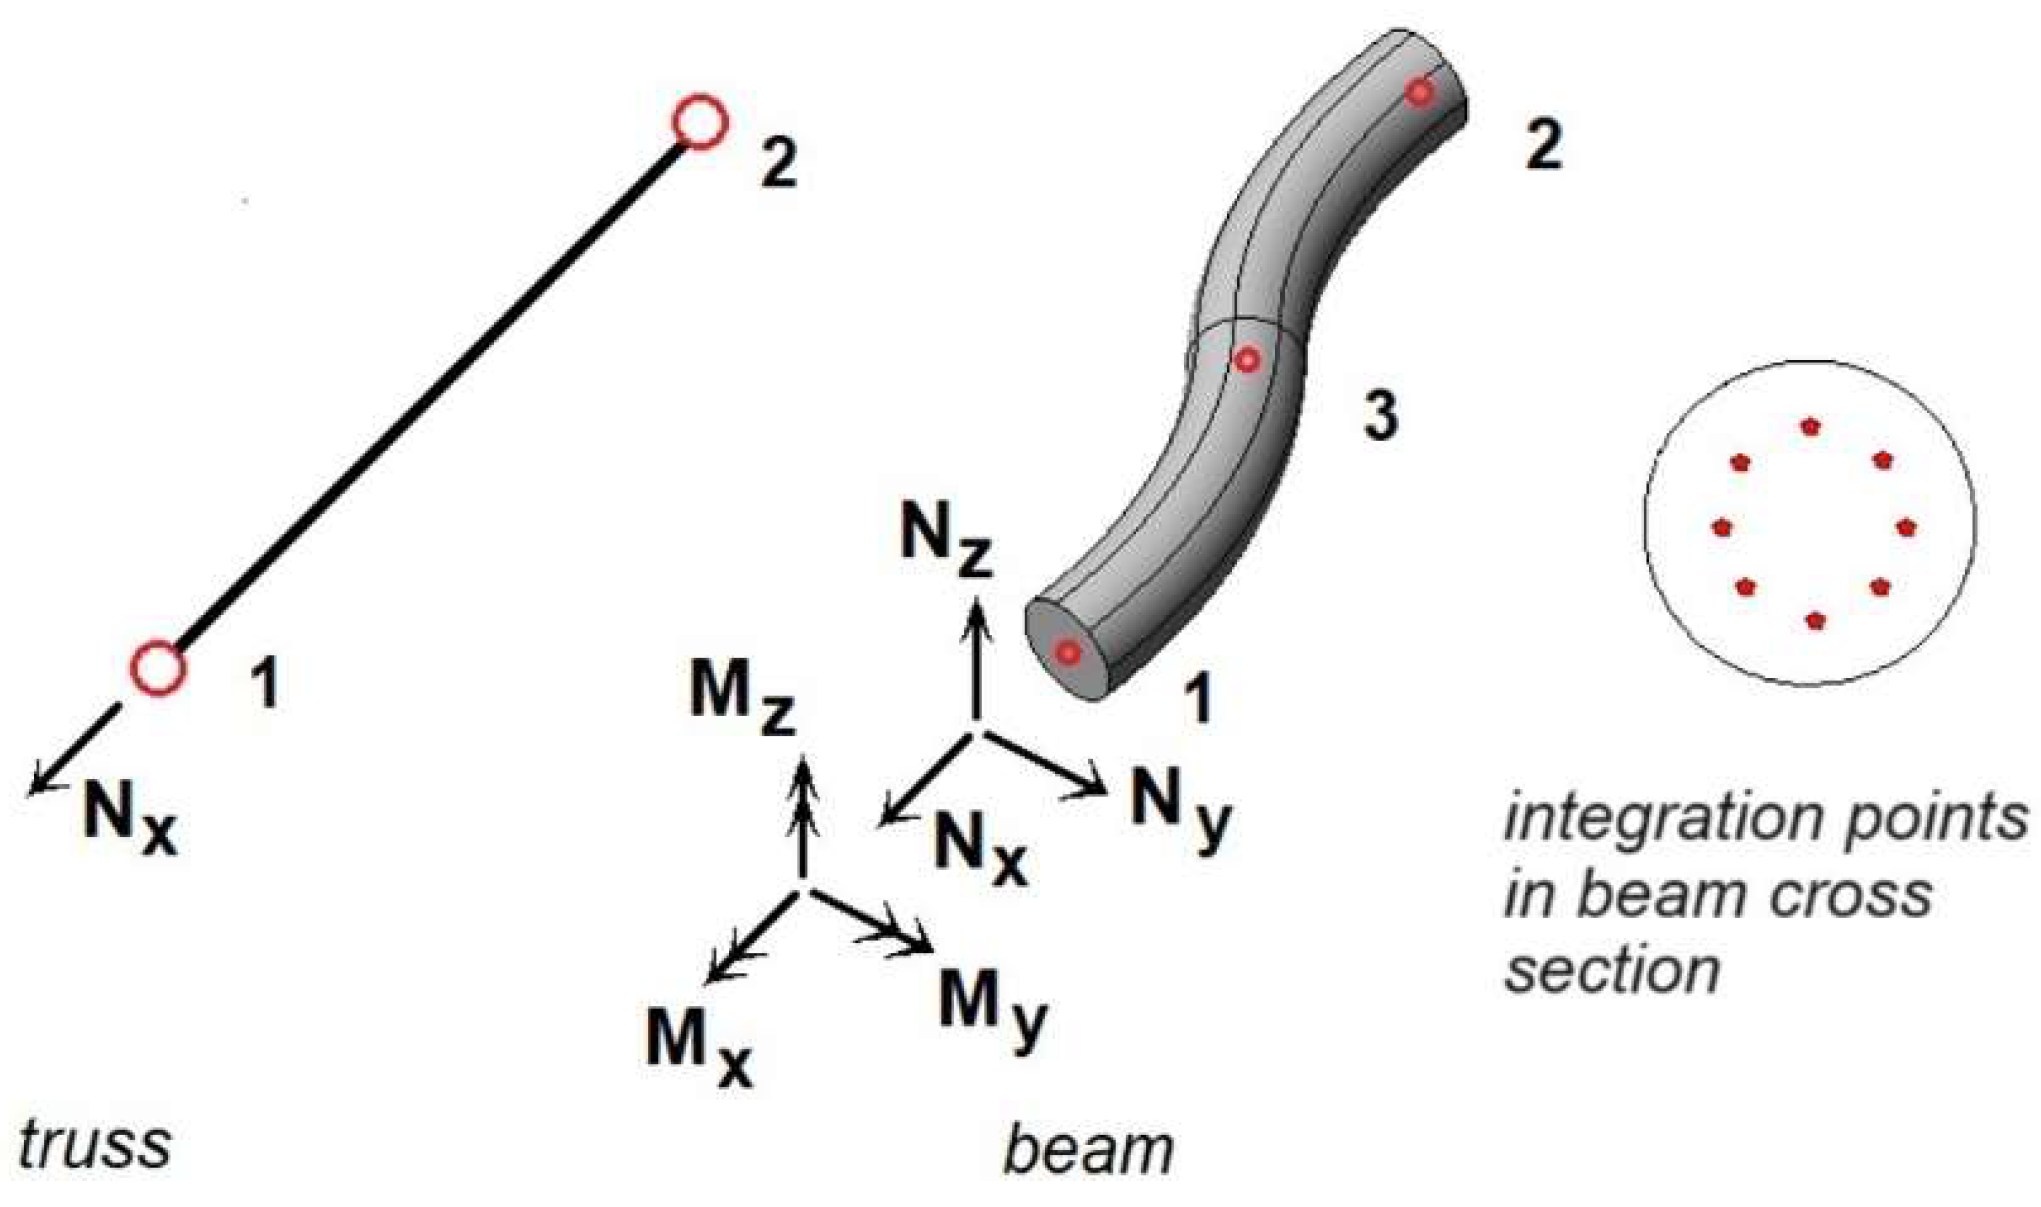
Figure 7.
The solid 3D FE model of the concrete prism reinforced with four bars.
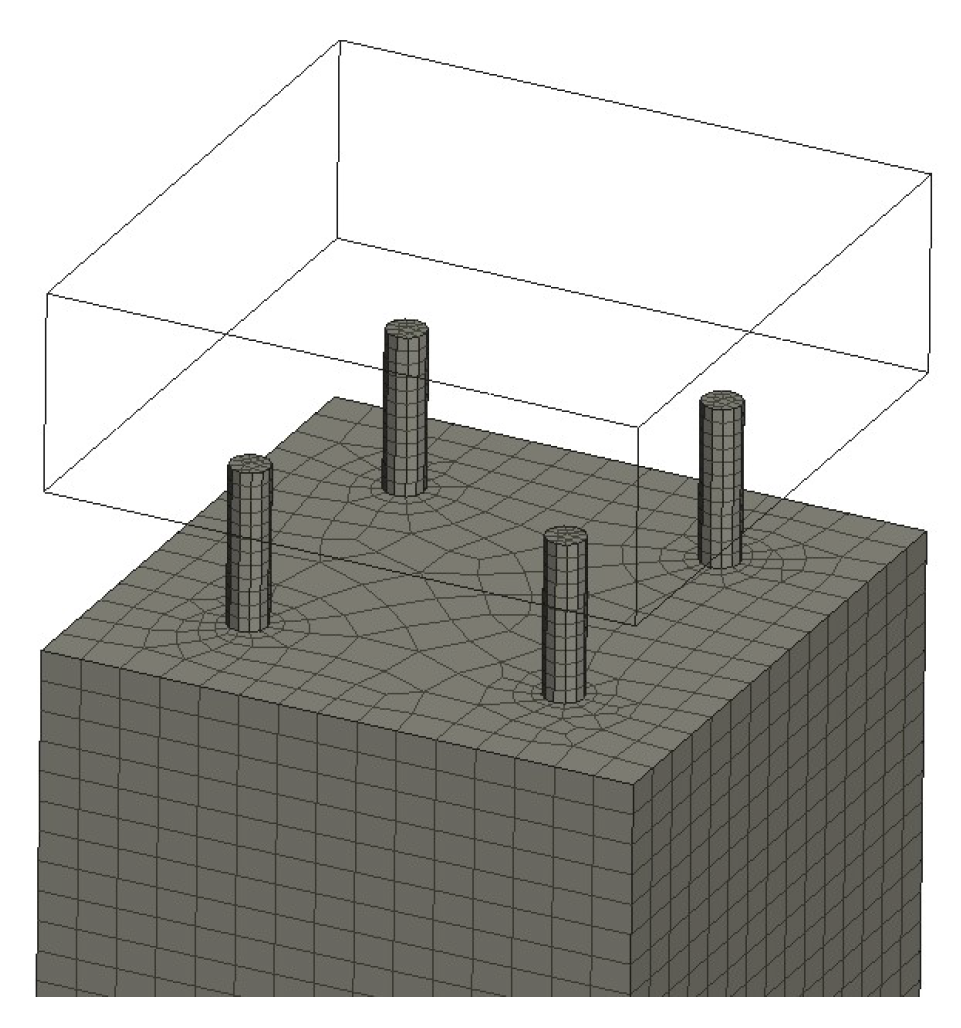
Figure 8.
The tensile concrete softening limit cts.
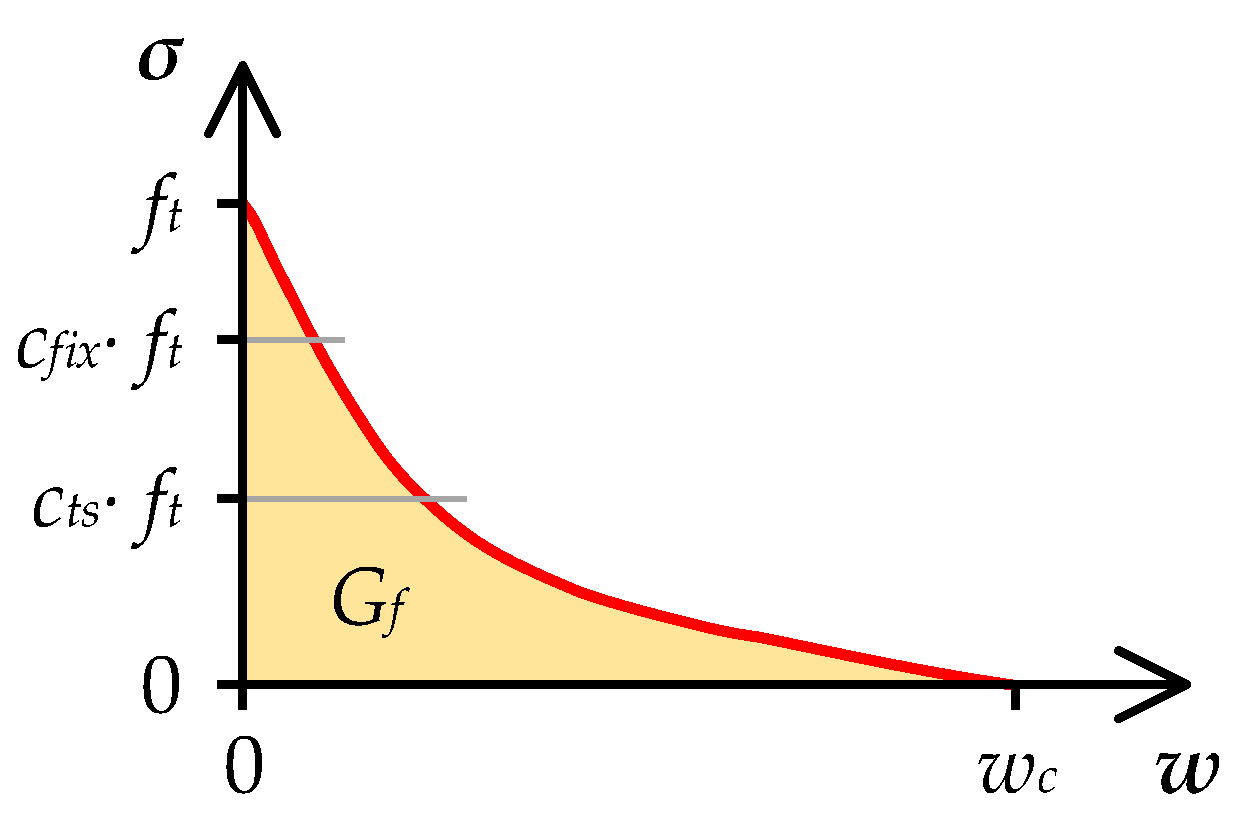
Figure 9.
The influence of symmetric quarter ‘Q’ versus full 3D model.
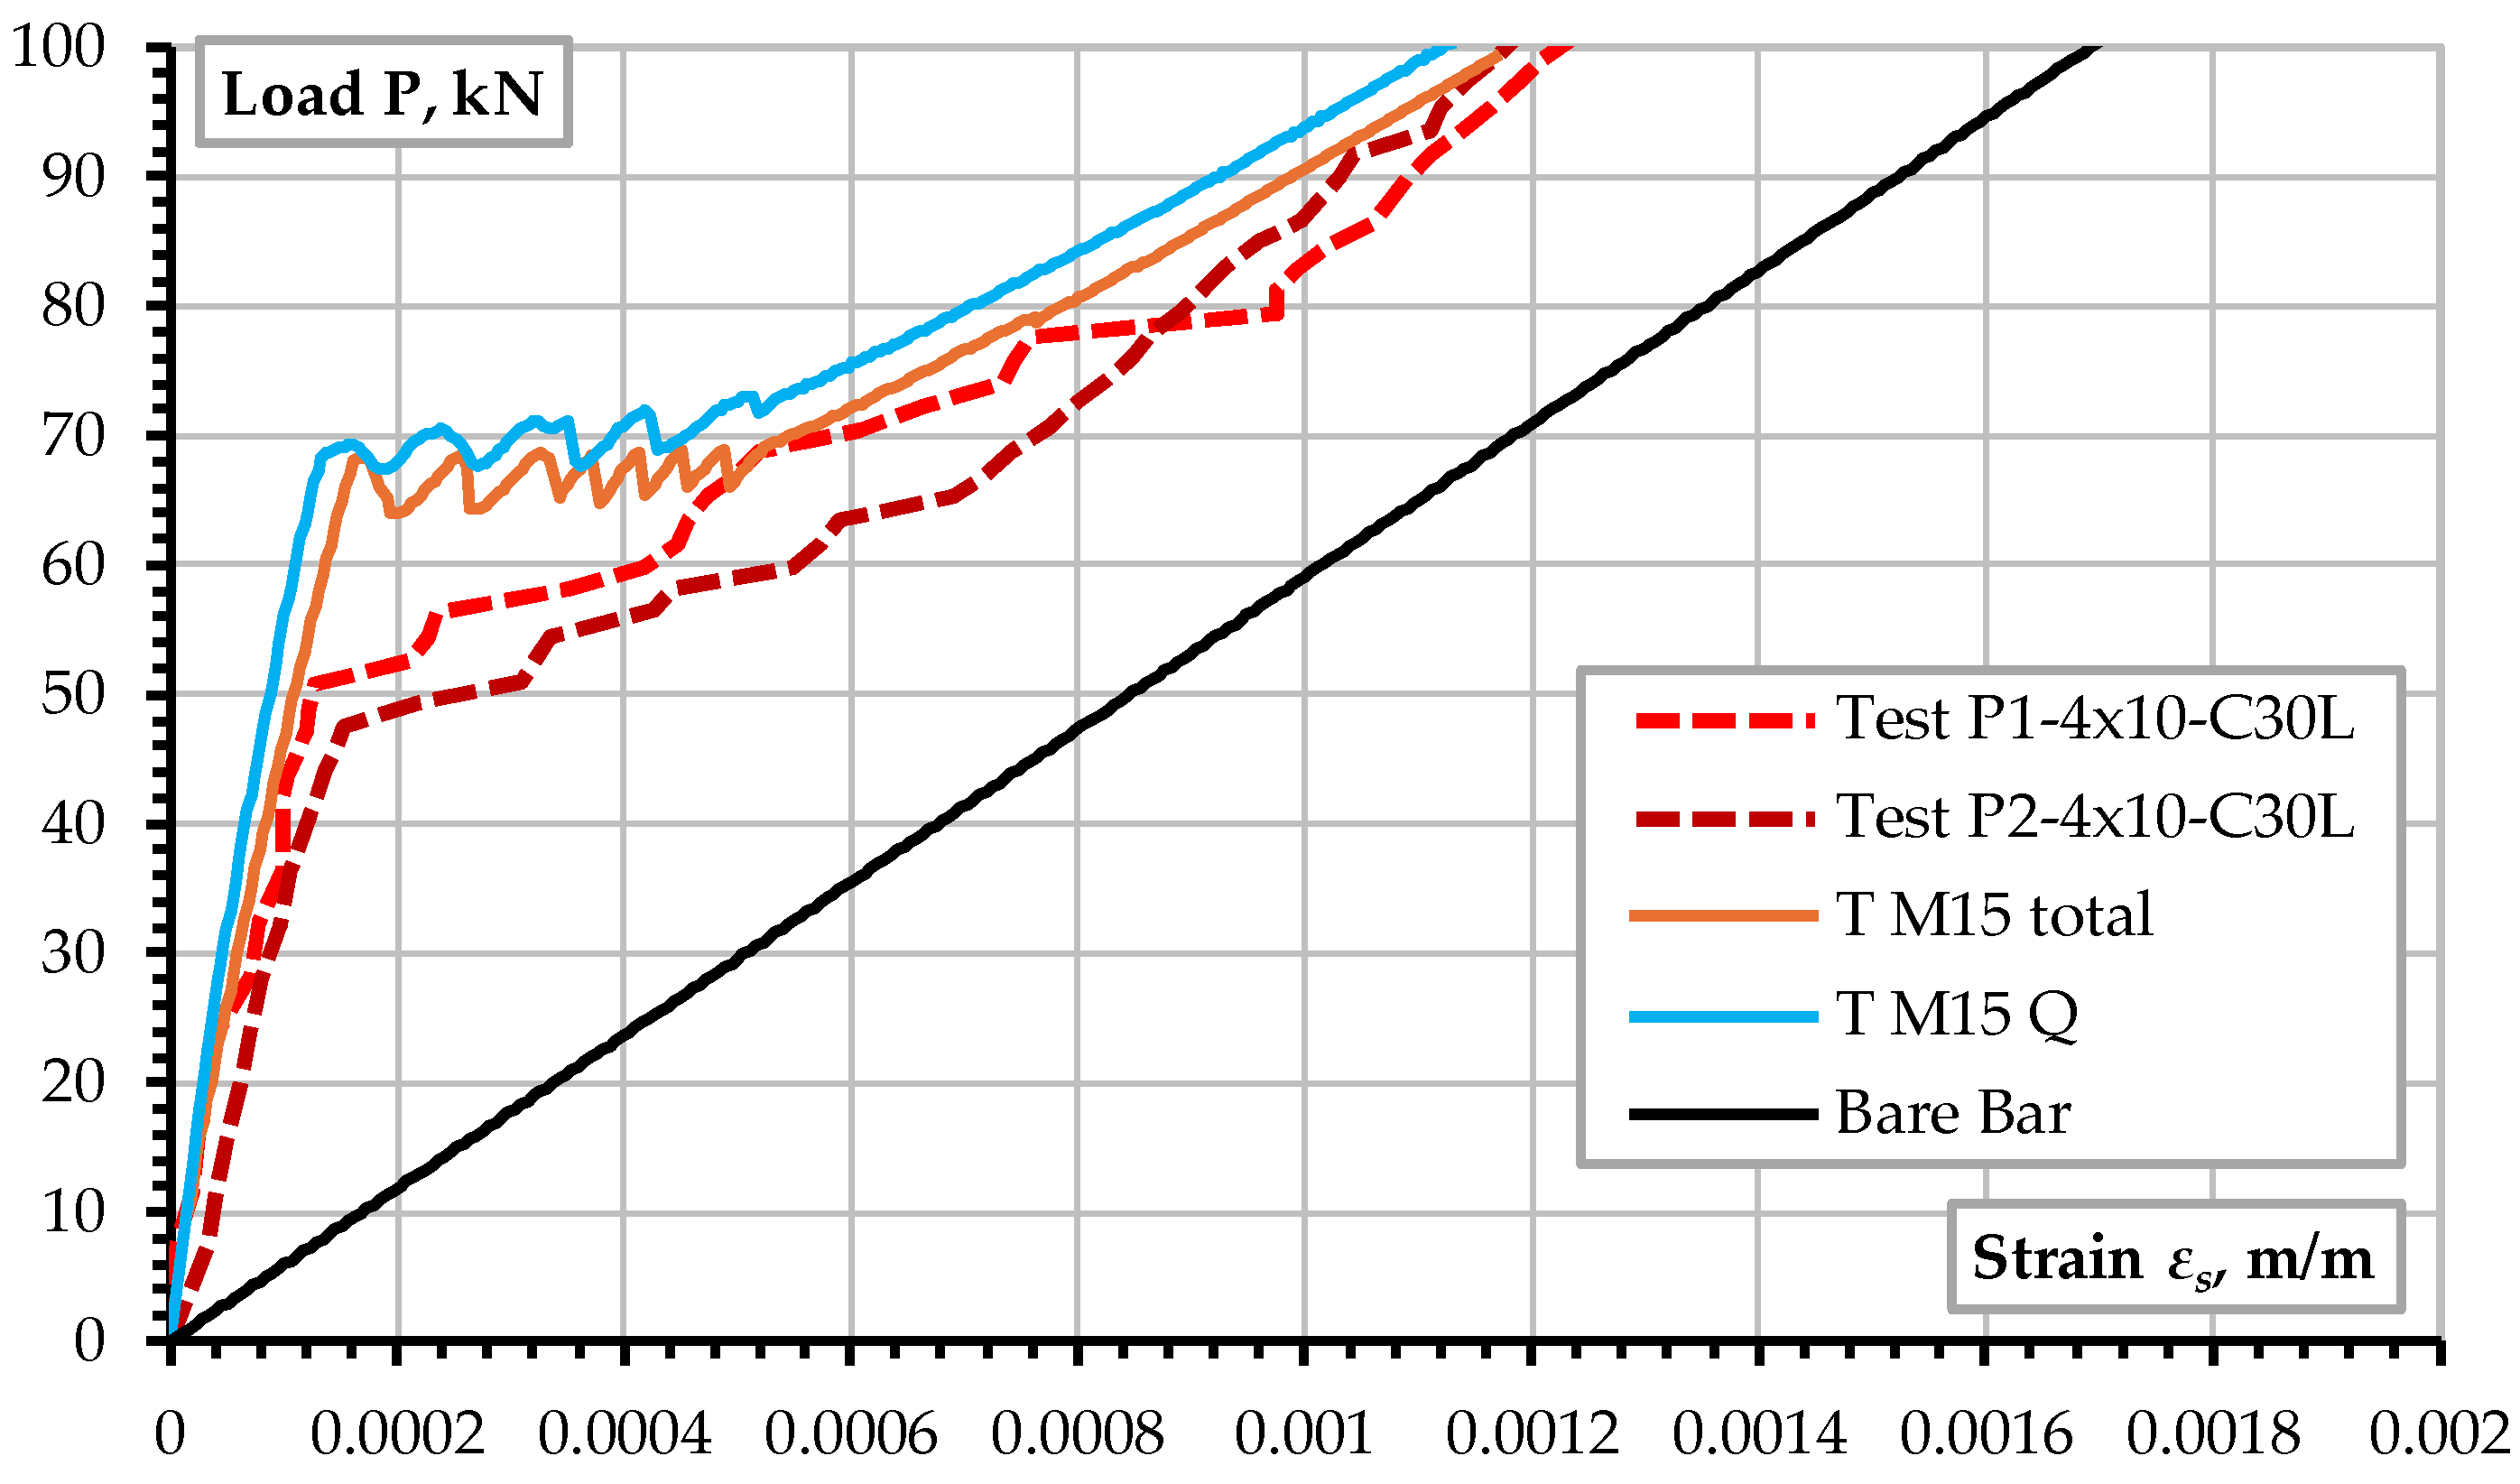
Figure 10.
The influence of truss and beam elements for modeling reinforcement.
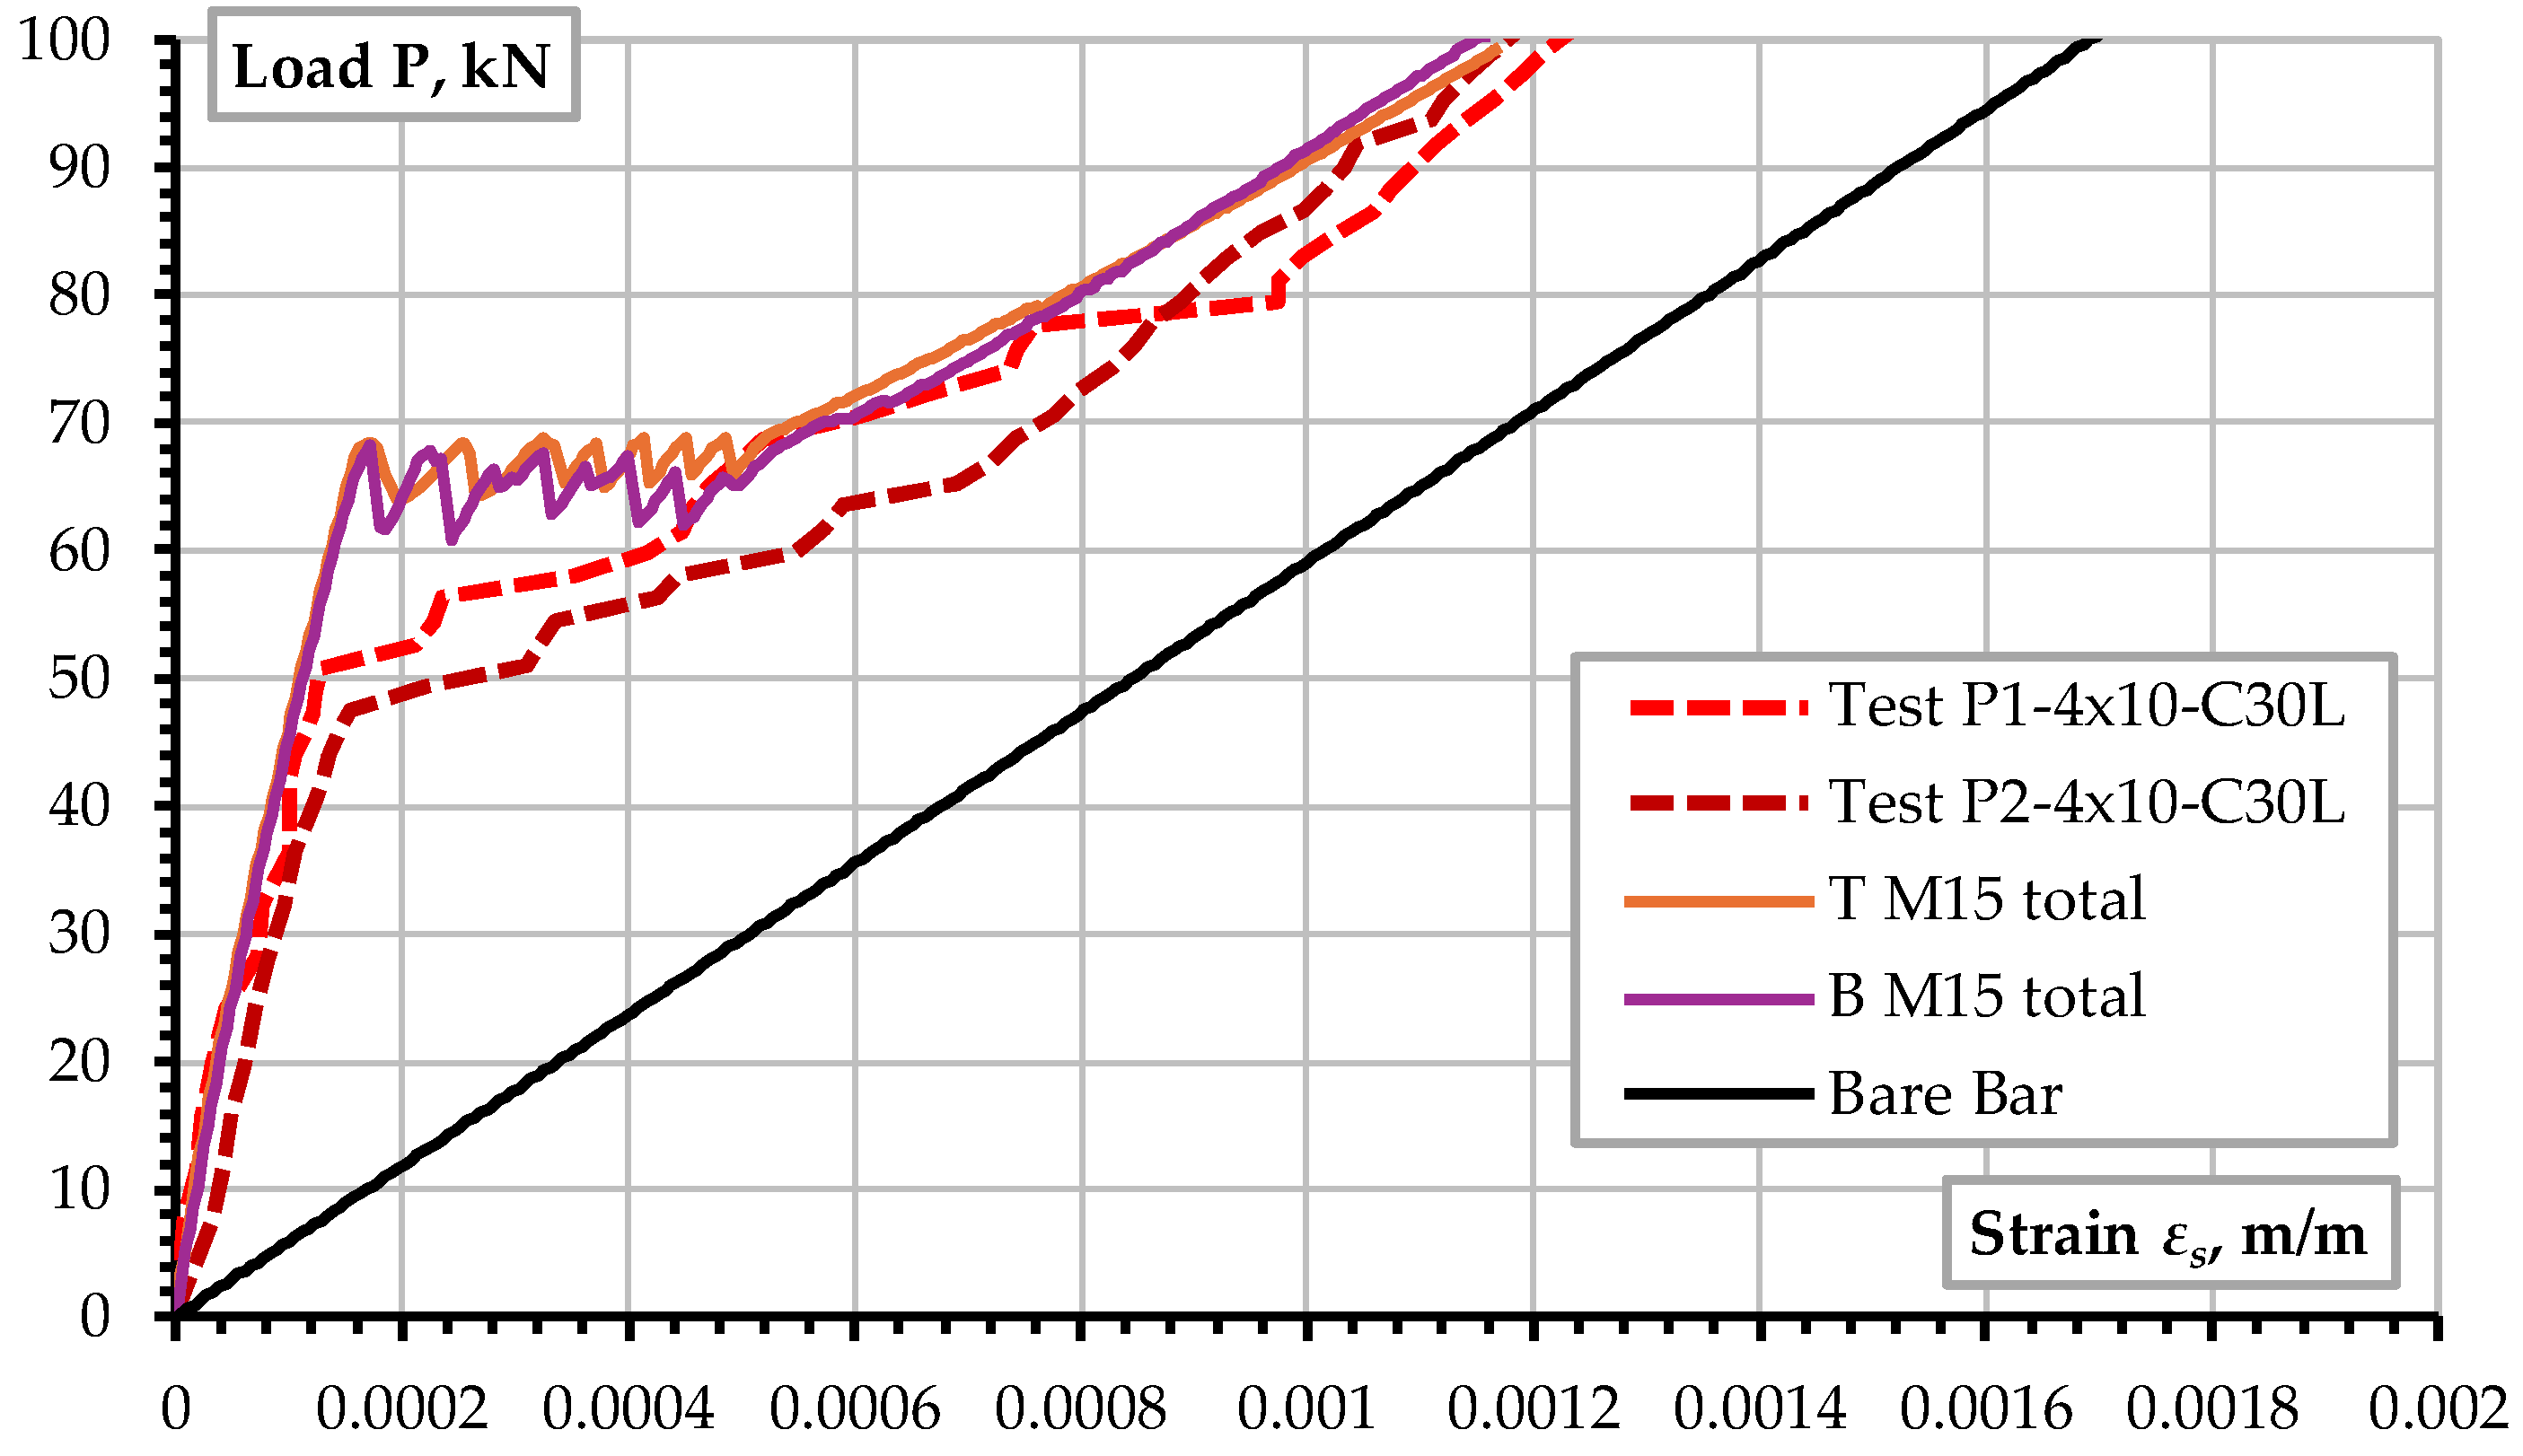
Figure 11.
The influence of mesh size.
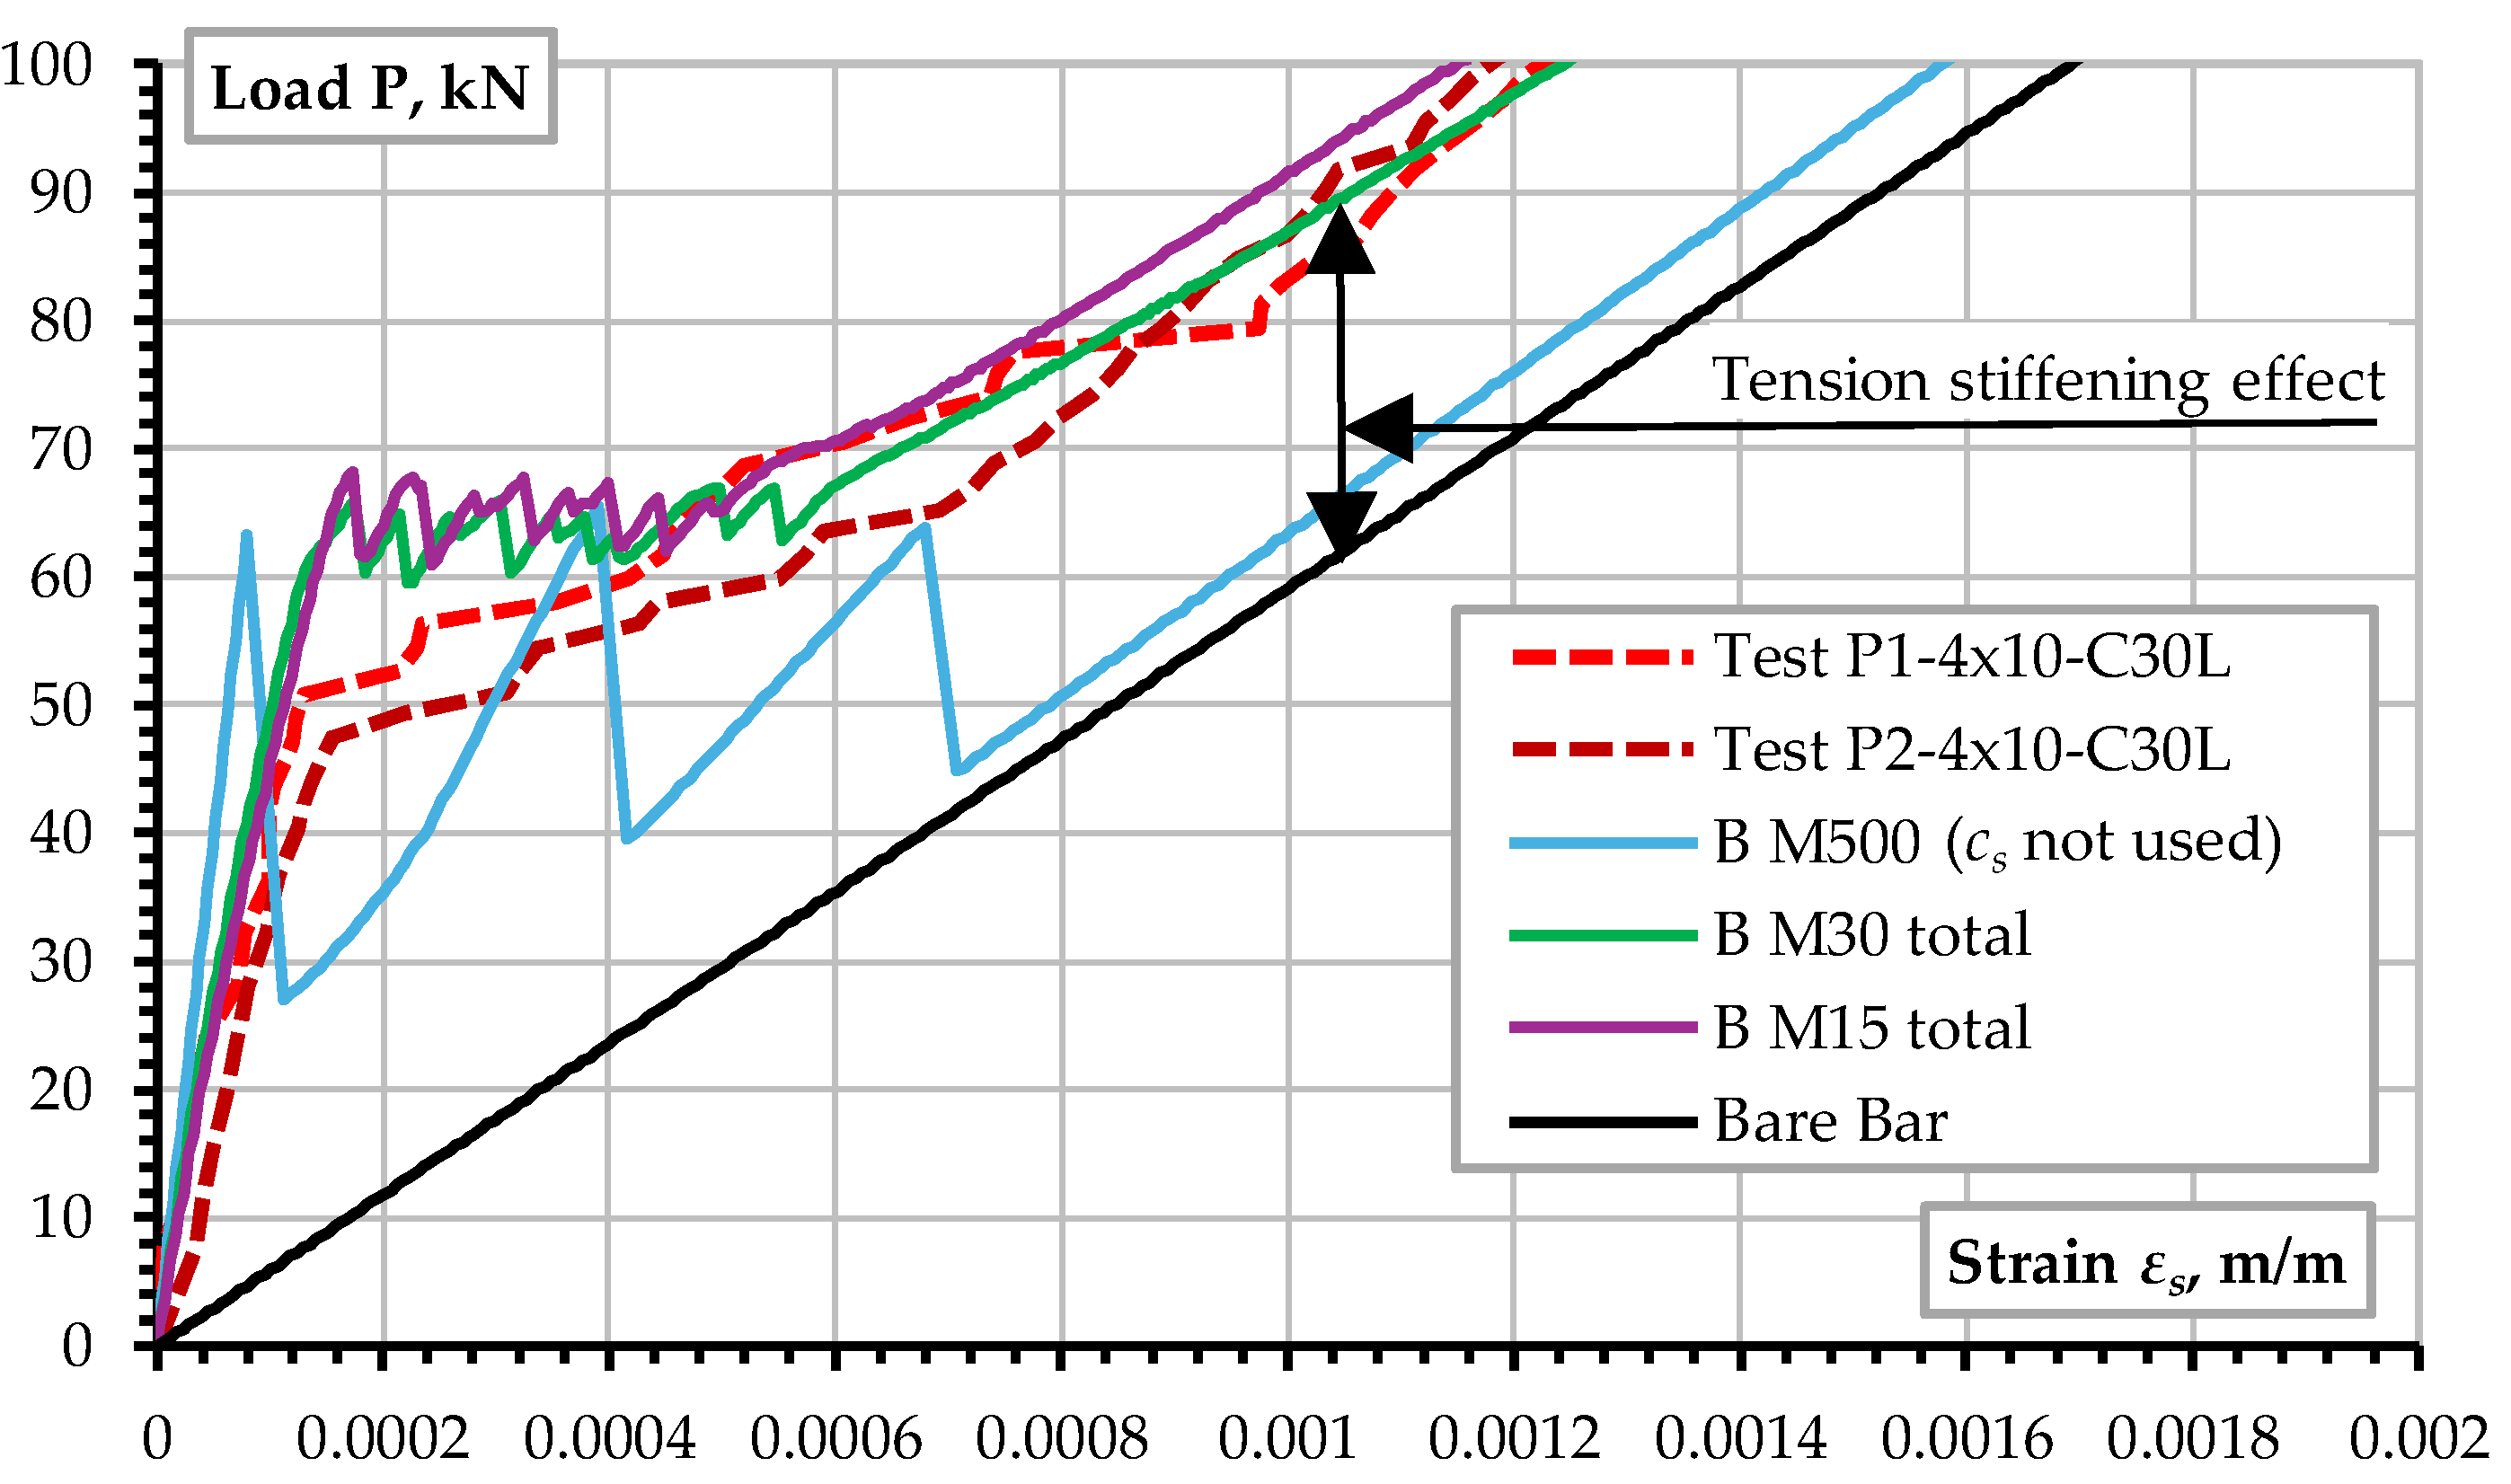
Figure 12.
The random field effect on the tensile resistance prediction.
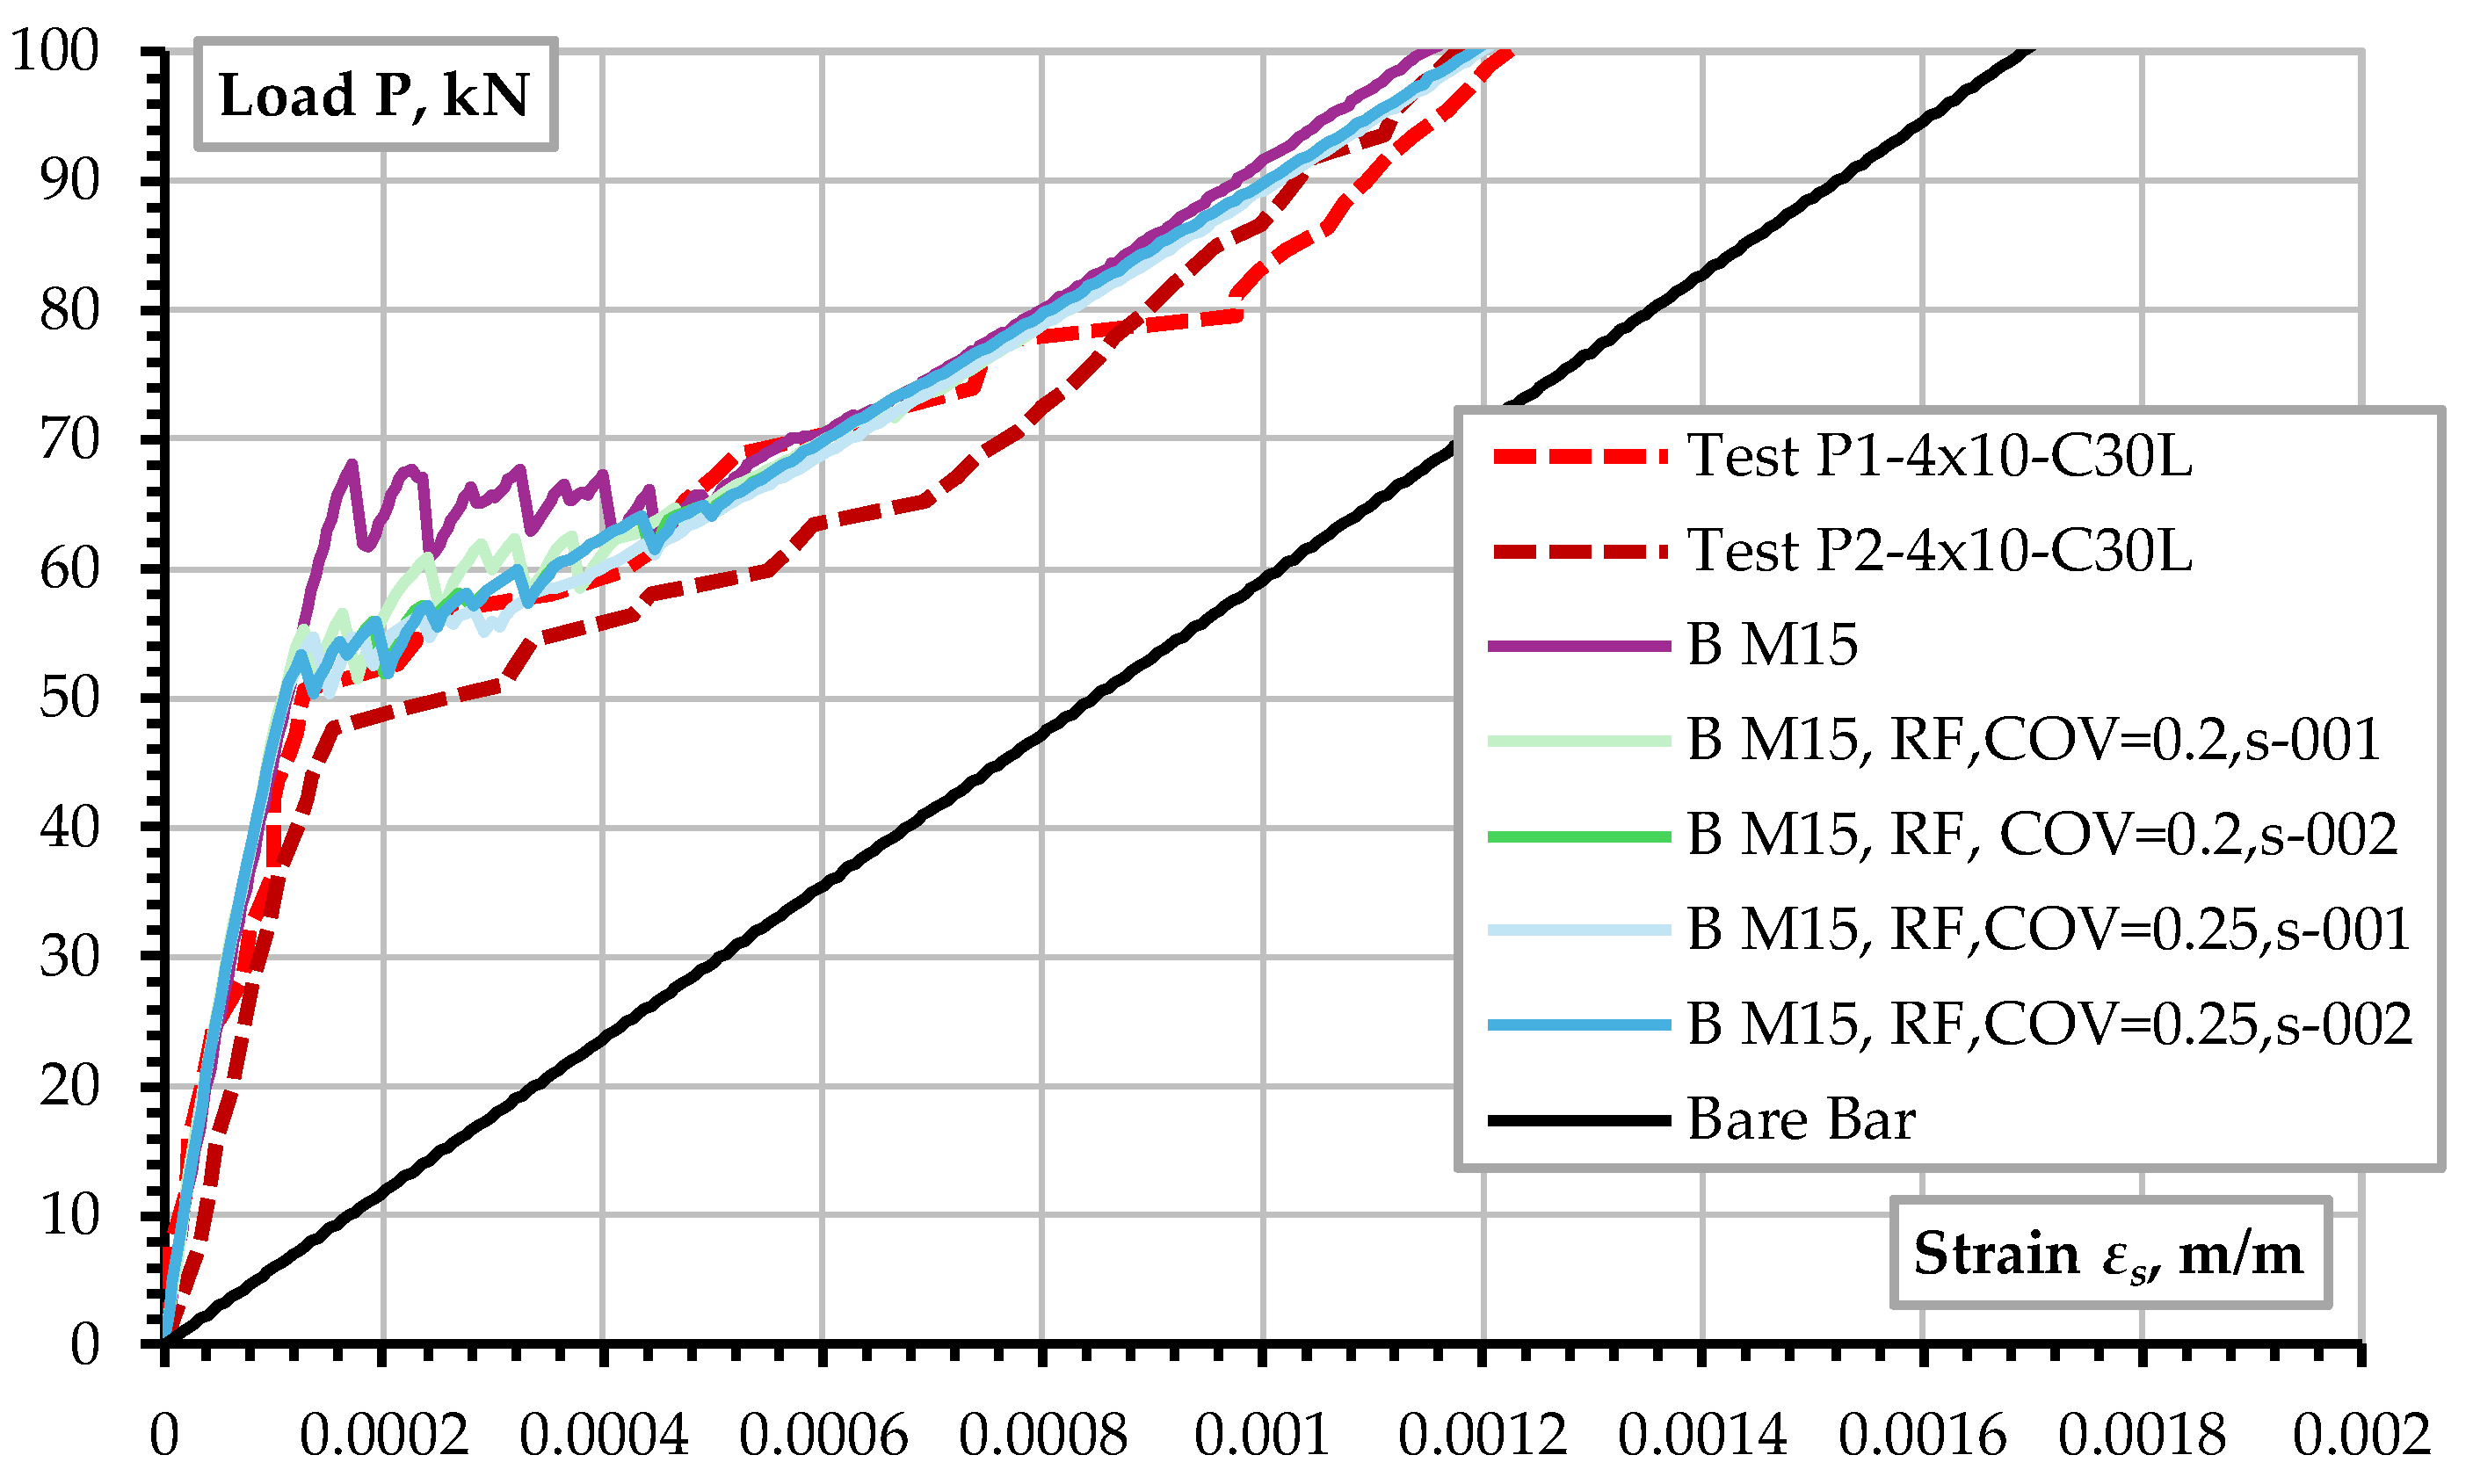
Figure 13.
Two examples of random fields for tensile strength ft and fracture energy GF considering the COV 0.25 and correlation length 20 mm (B M15, RF, COV=0.25).
Figure 13.
Two examples of random fields for tensile strength ft and fracture energy GF considering the COV 0.25 and correlation length 20 mm (B M15, RF, COV=0.25).
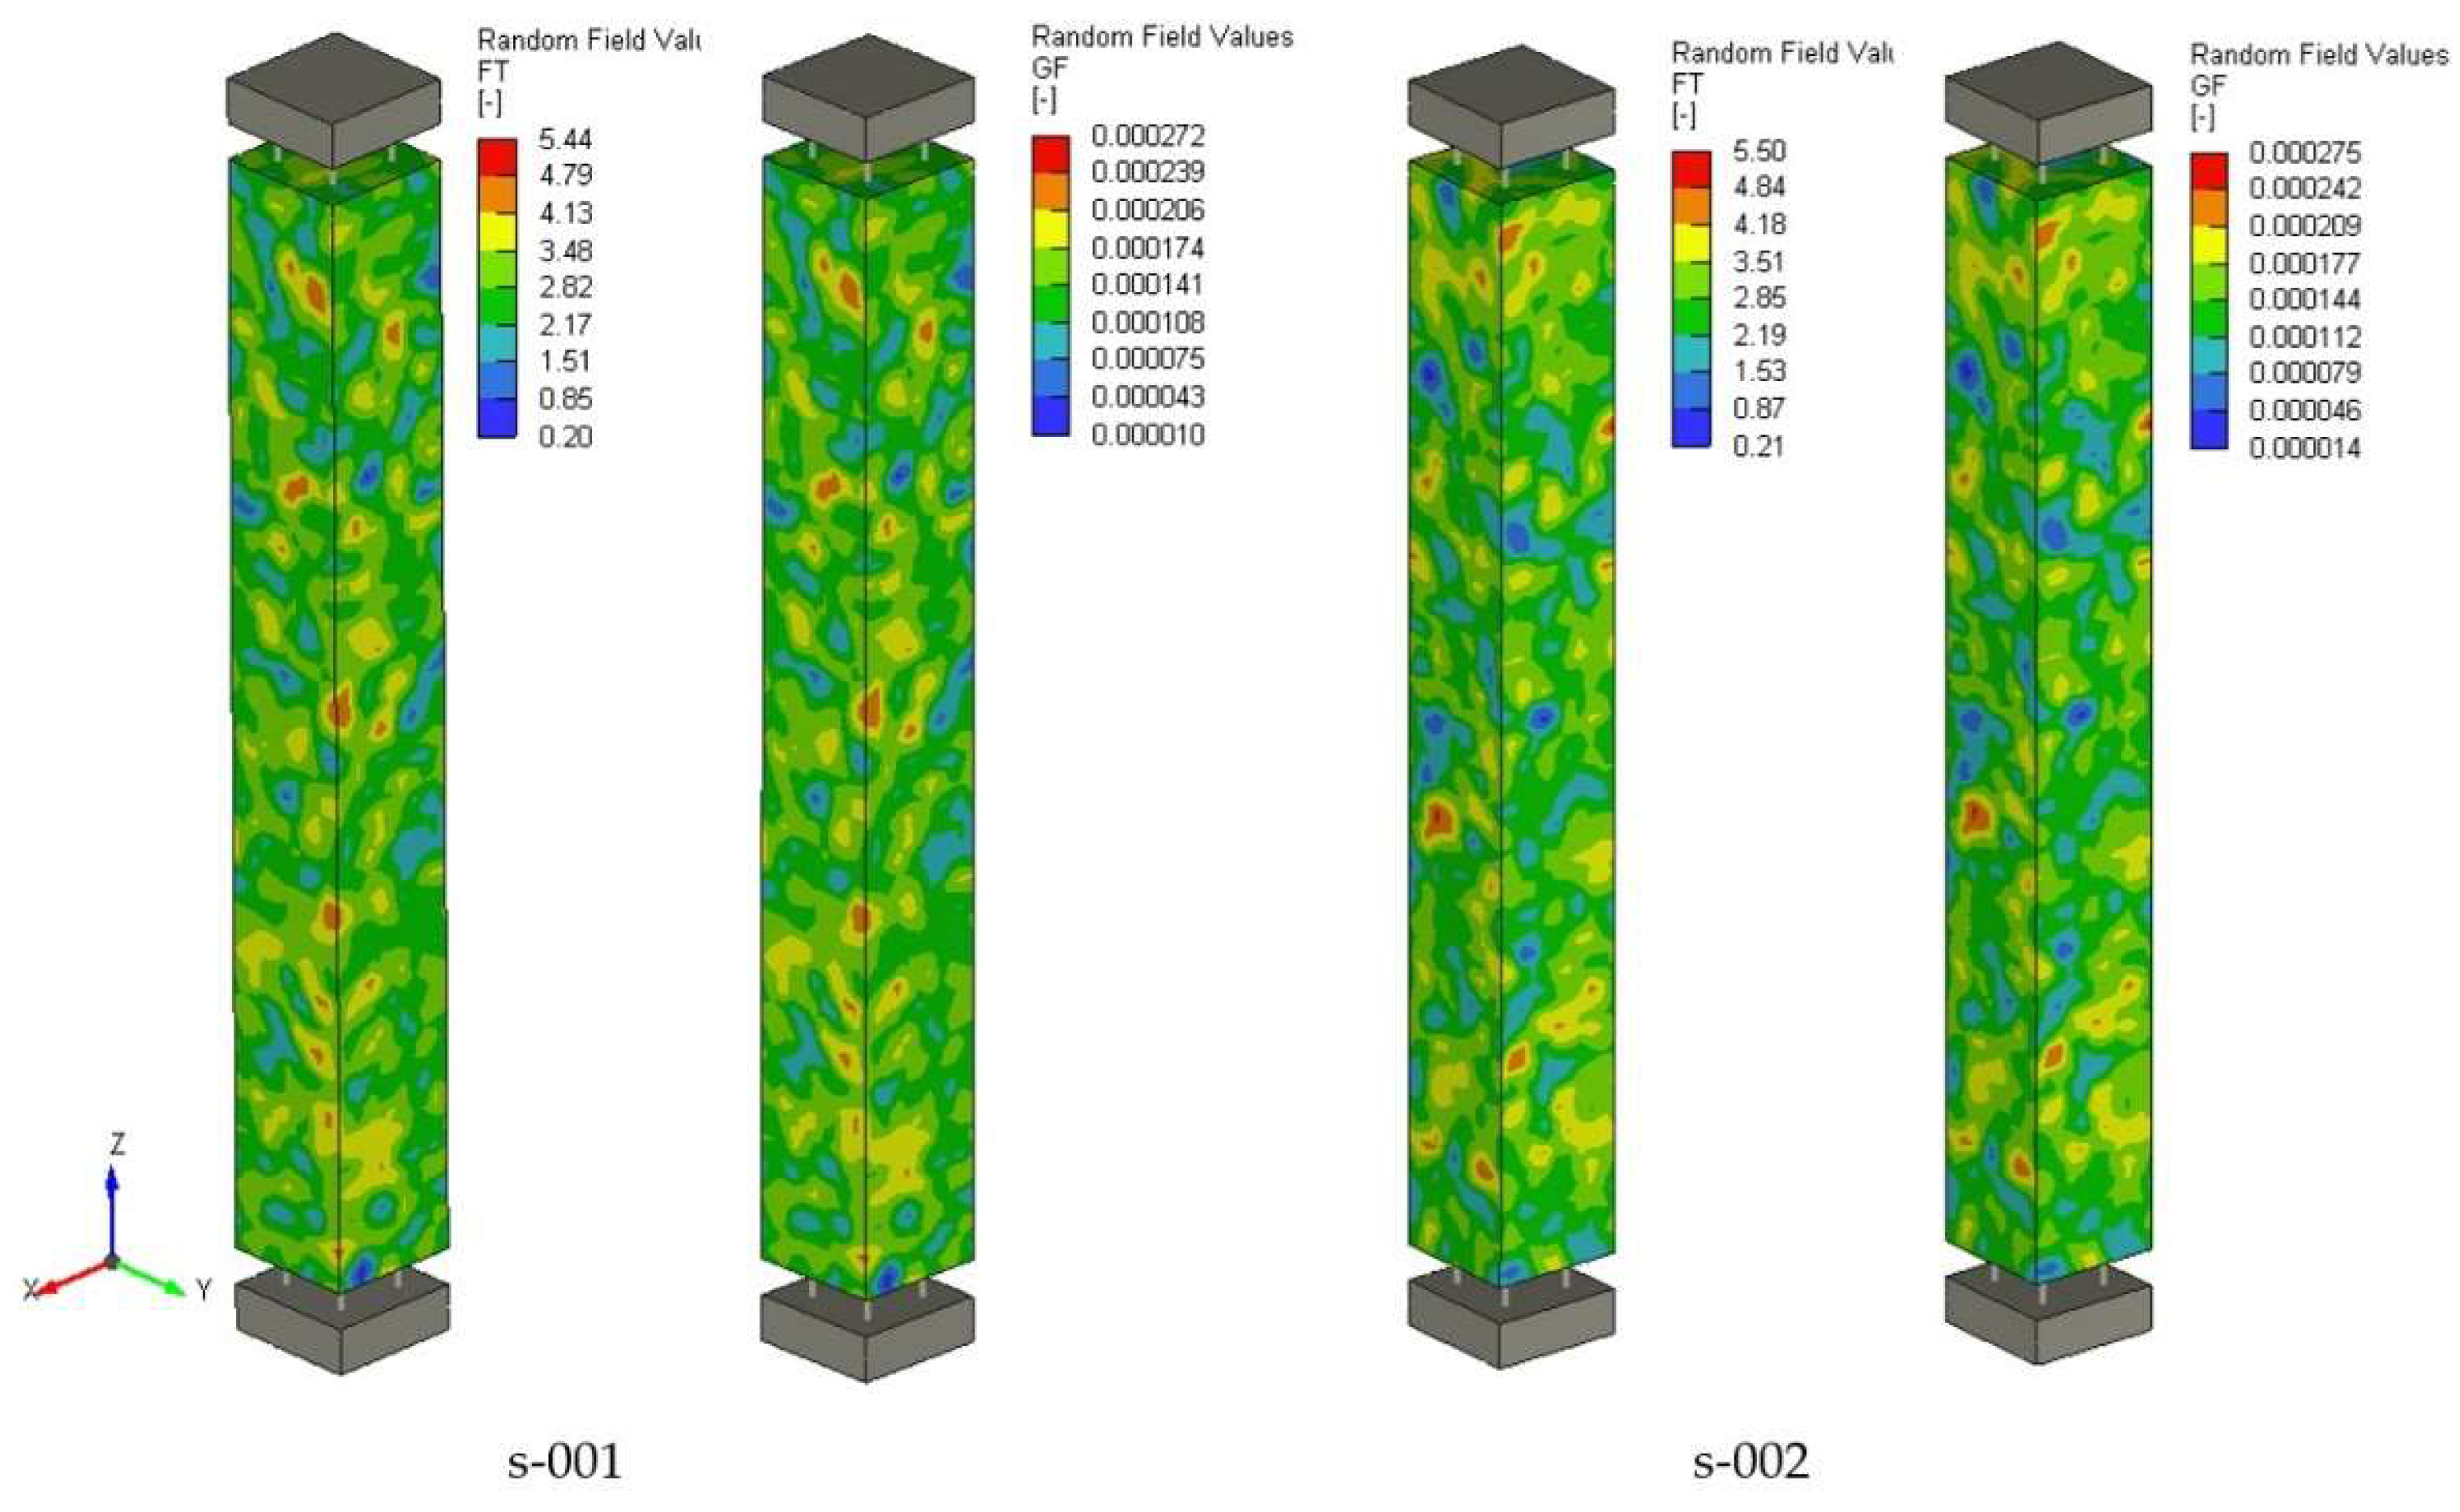
Figure 14.
The crack spacing predicted for coarse FE mesh.
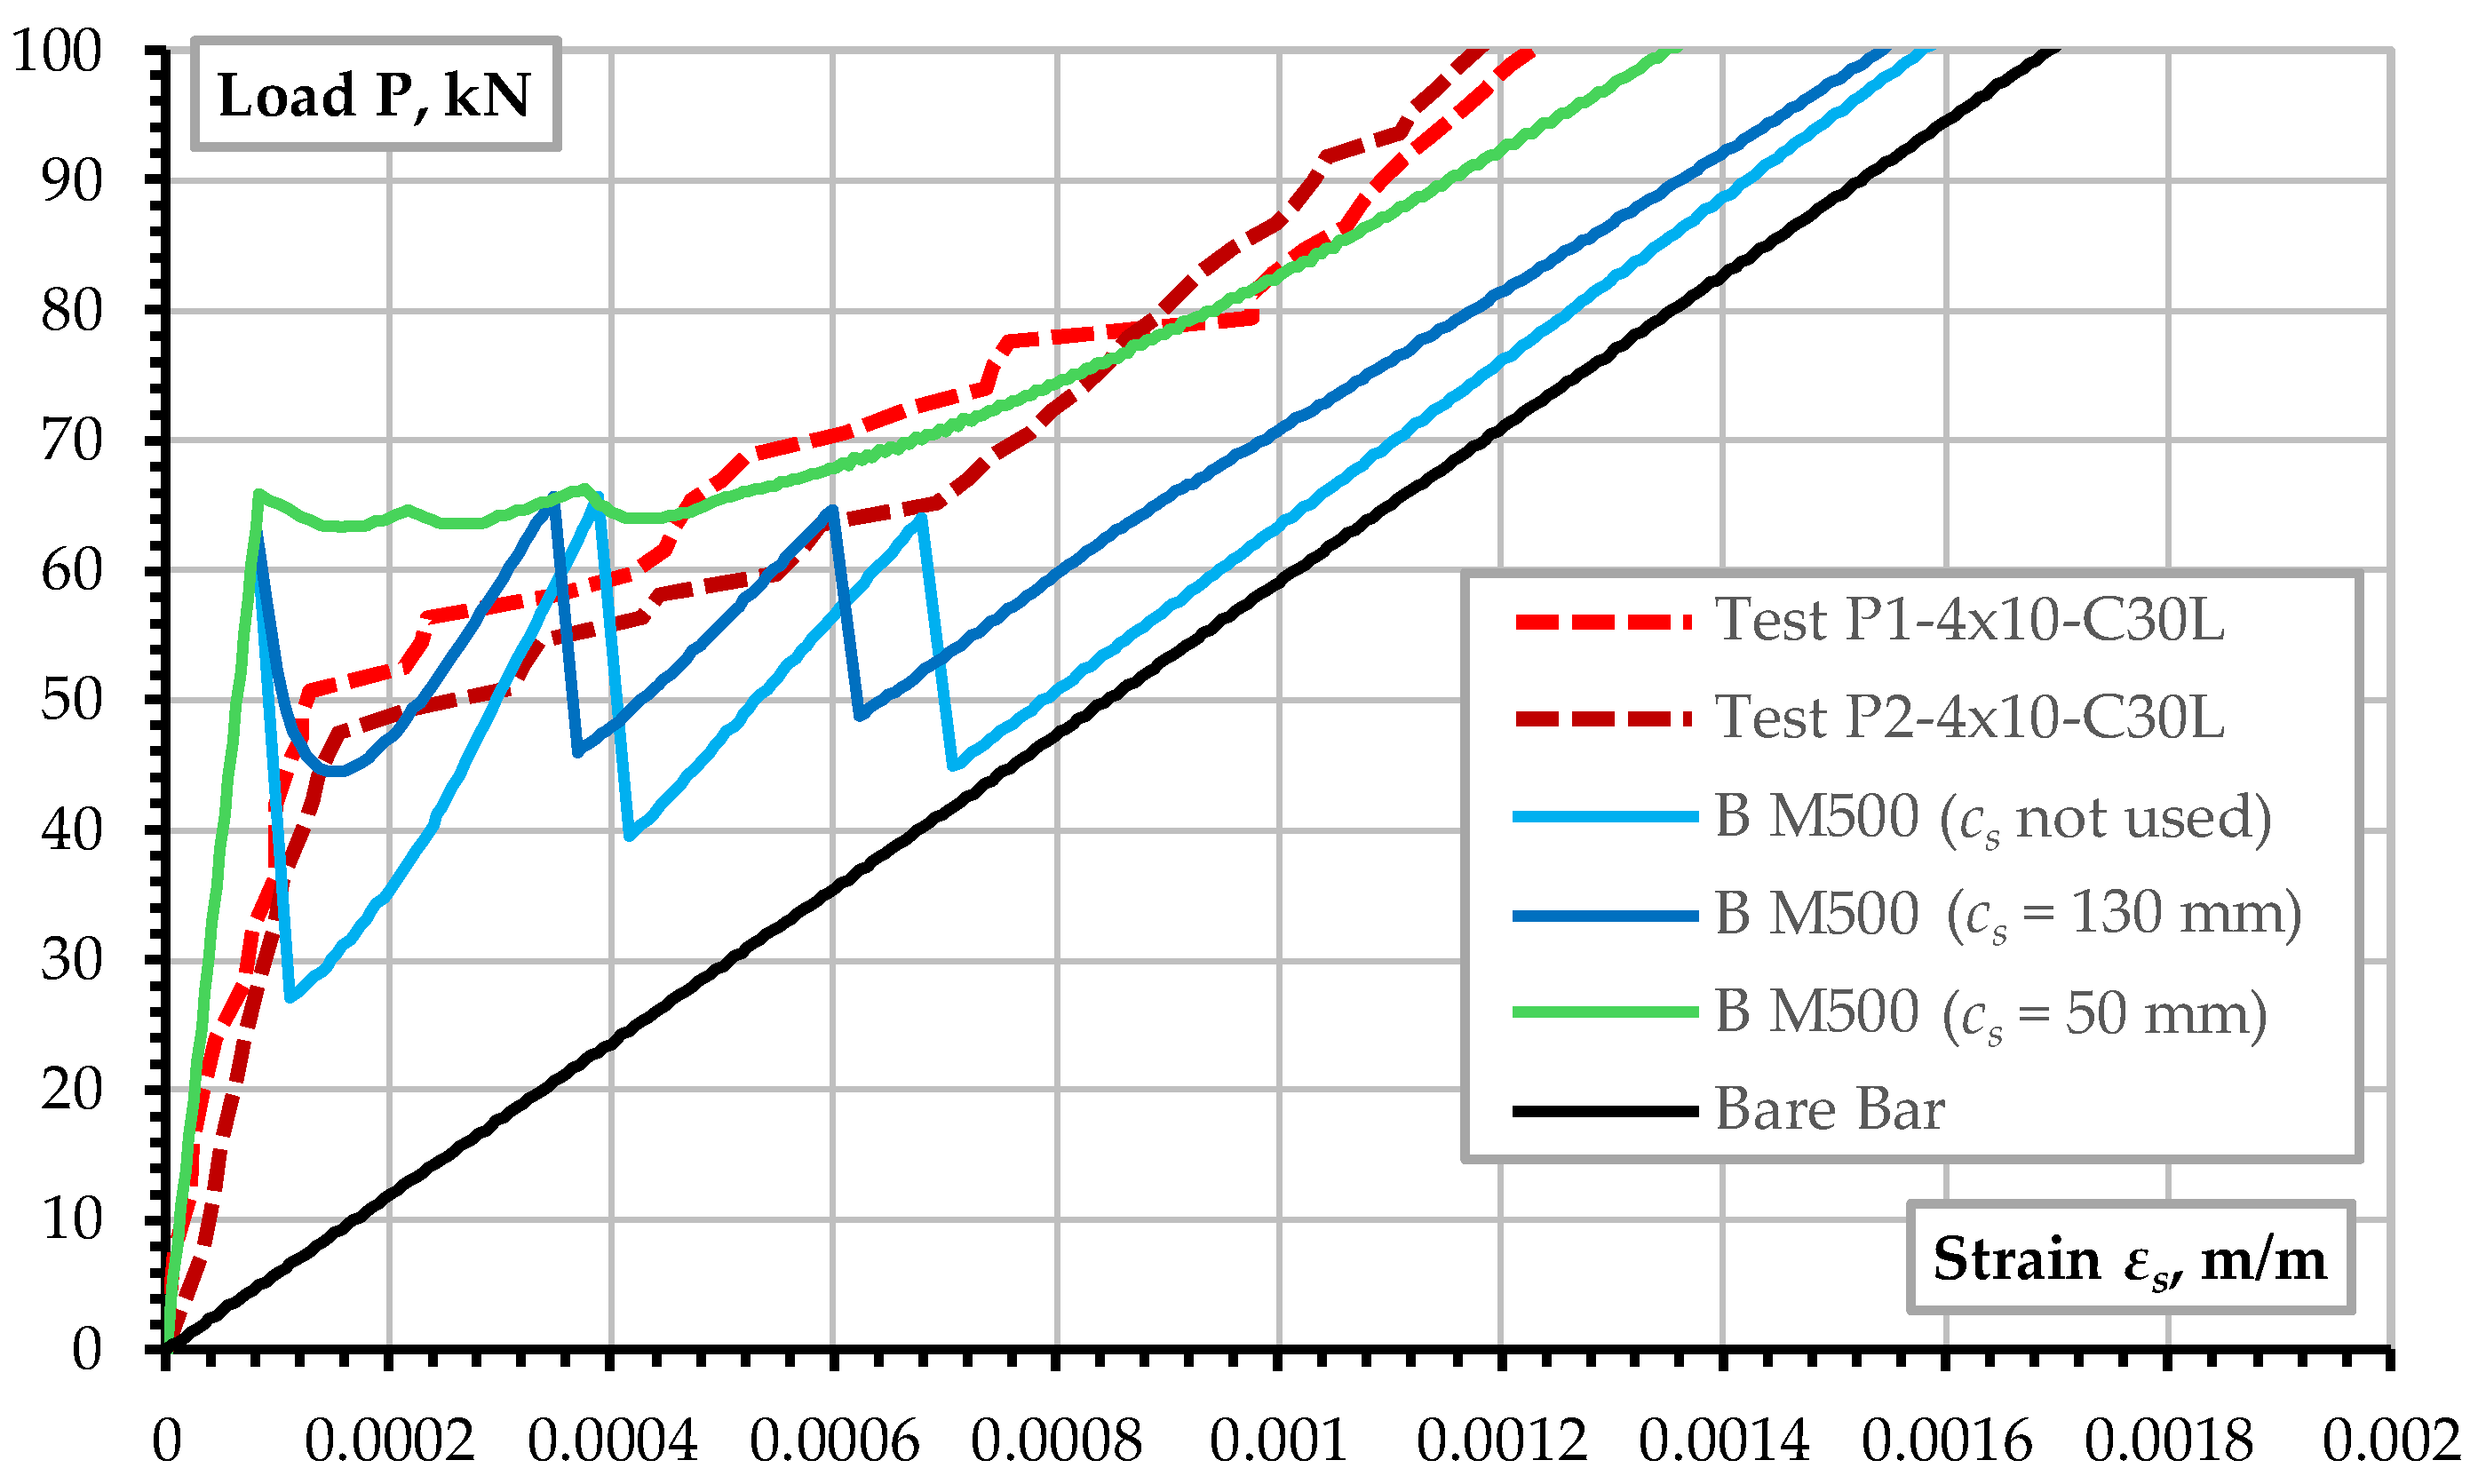
Figure 15.
The selected deformation prediction results up to the reinforcement yielding.
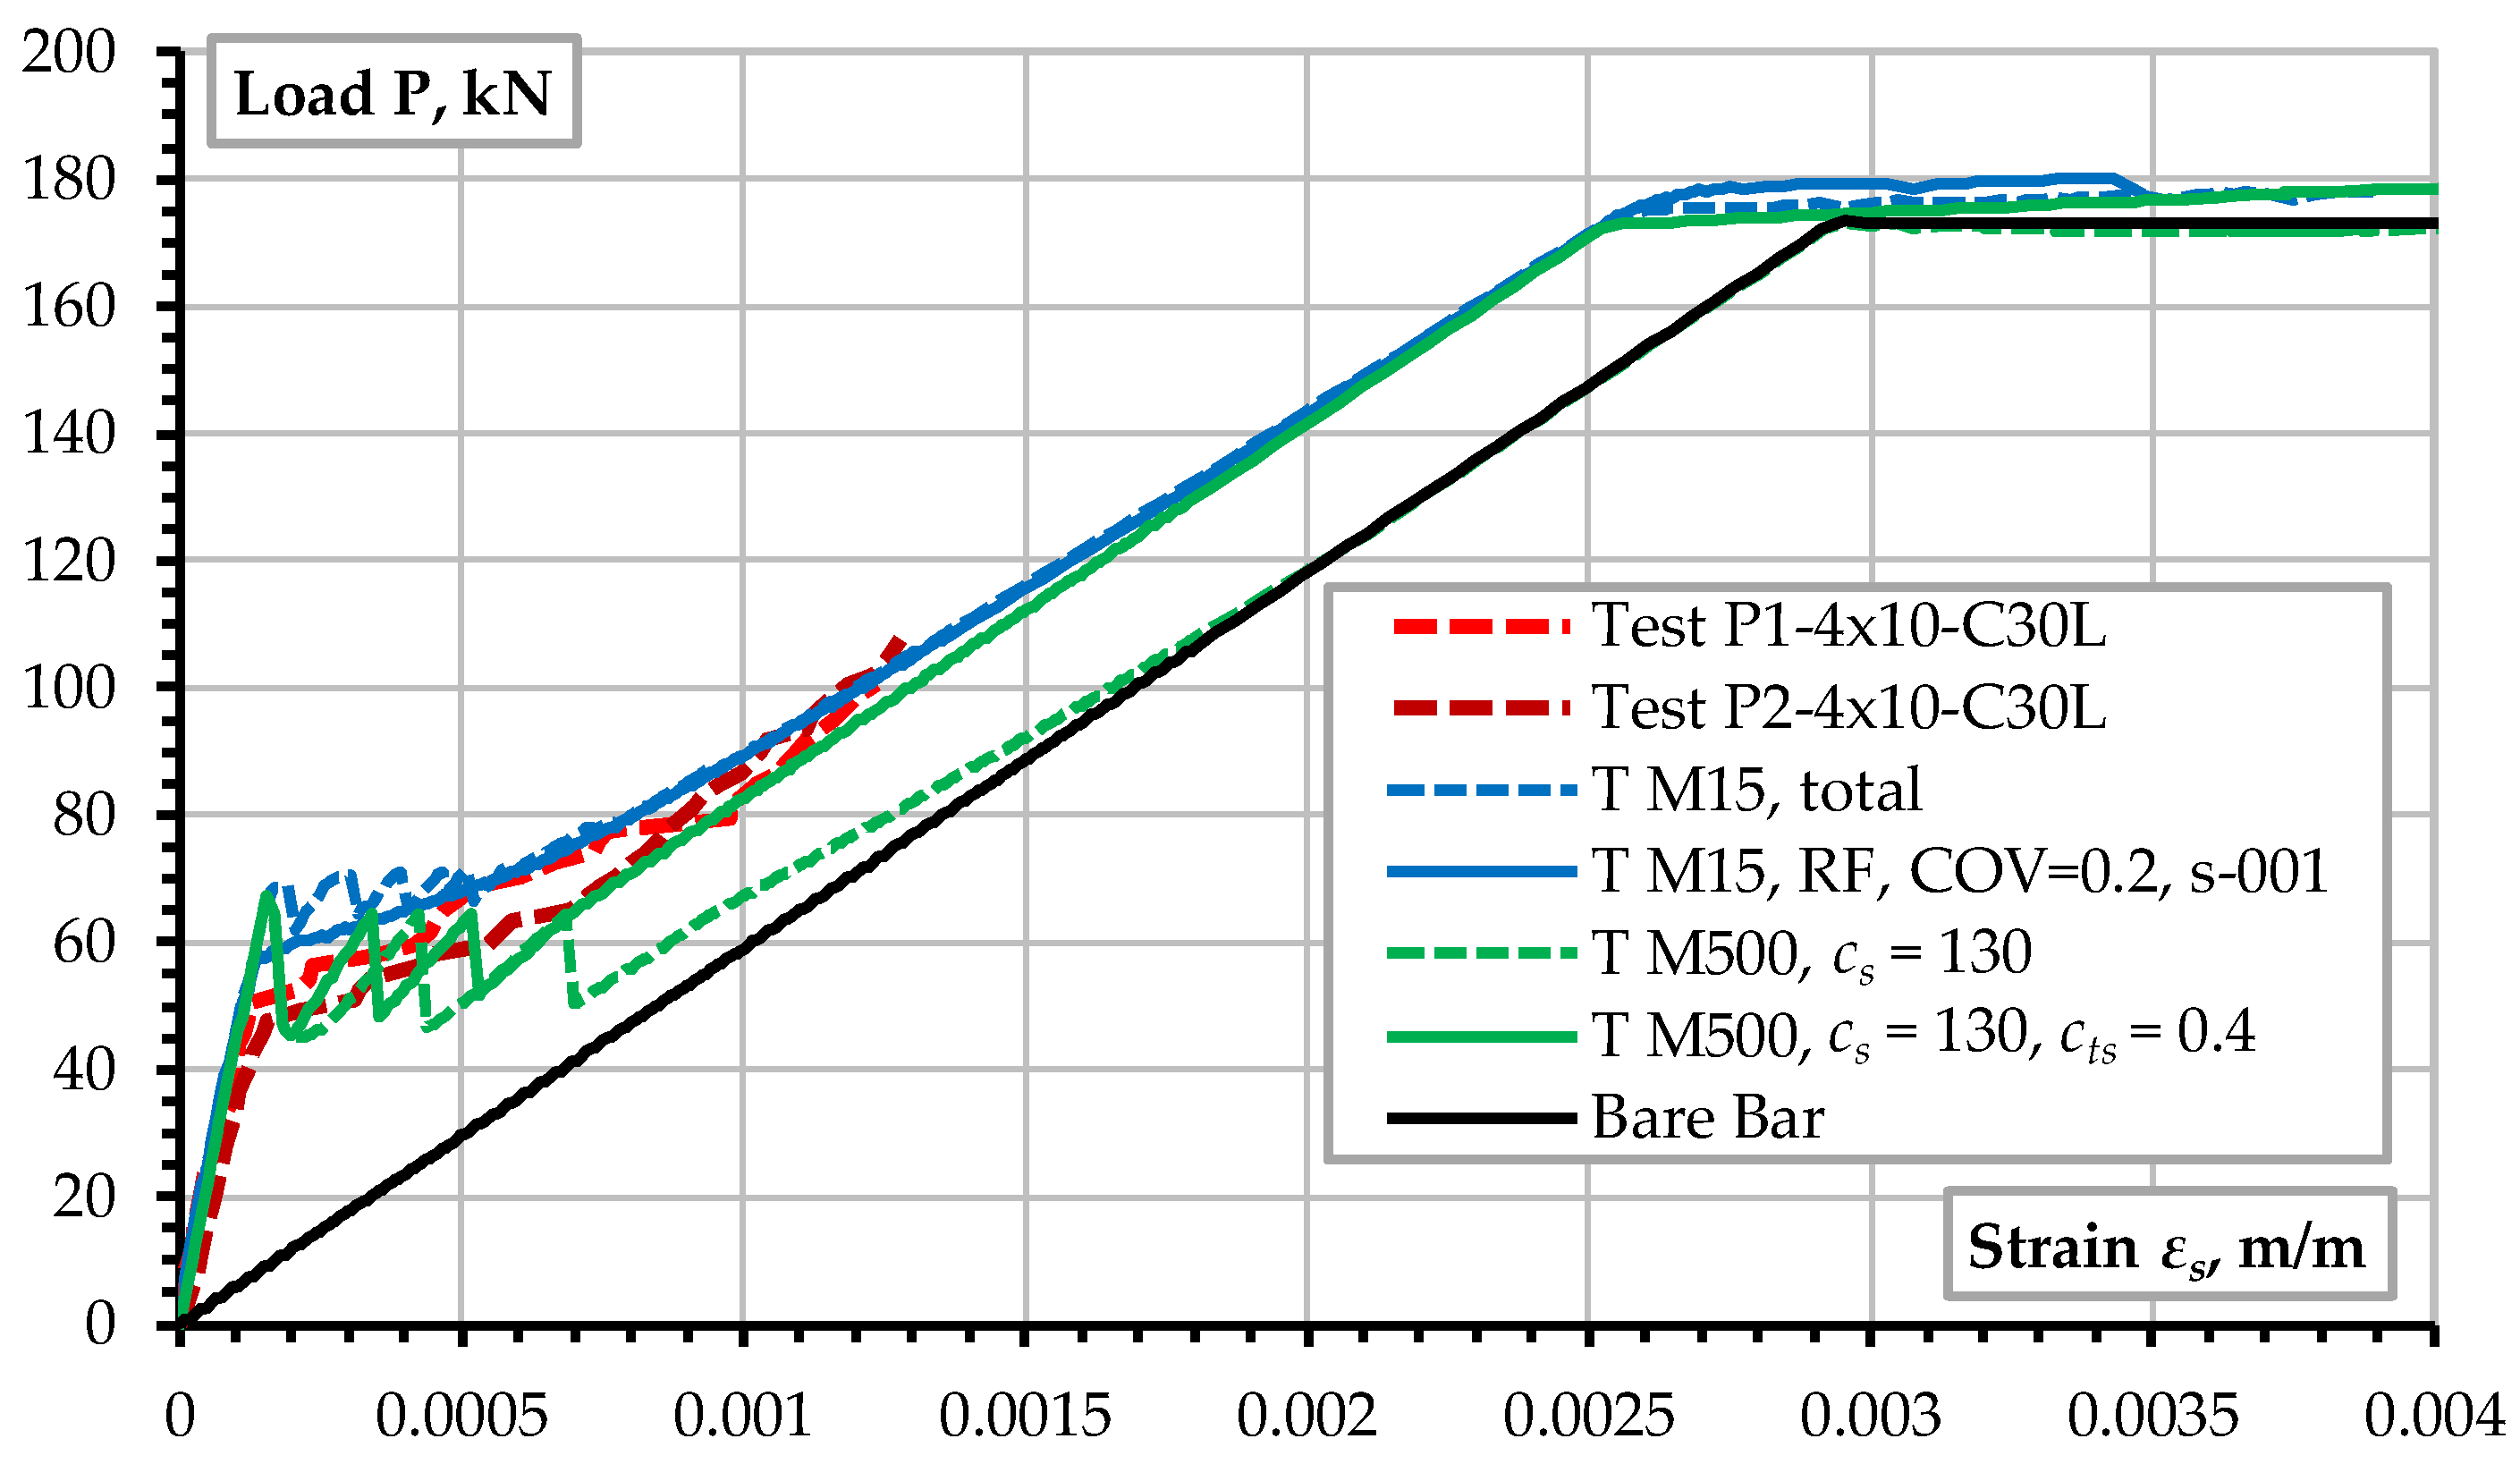
Figure 16.
The typical plot of surface and interior cracks from FE analysis at load P = 100 kN (model B M15): (a) surface cracks; (b) interior cracks with a detailed view near the top part of the specimen.
Figure 16.
The typical plot of surface and interior cracks from FE analysis at load P = 100 kN (model B M15): (a) surface cracks; (b) interior cracks with a detailed view near the top part of the specimen.
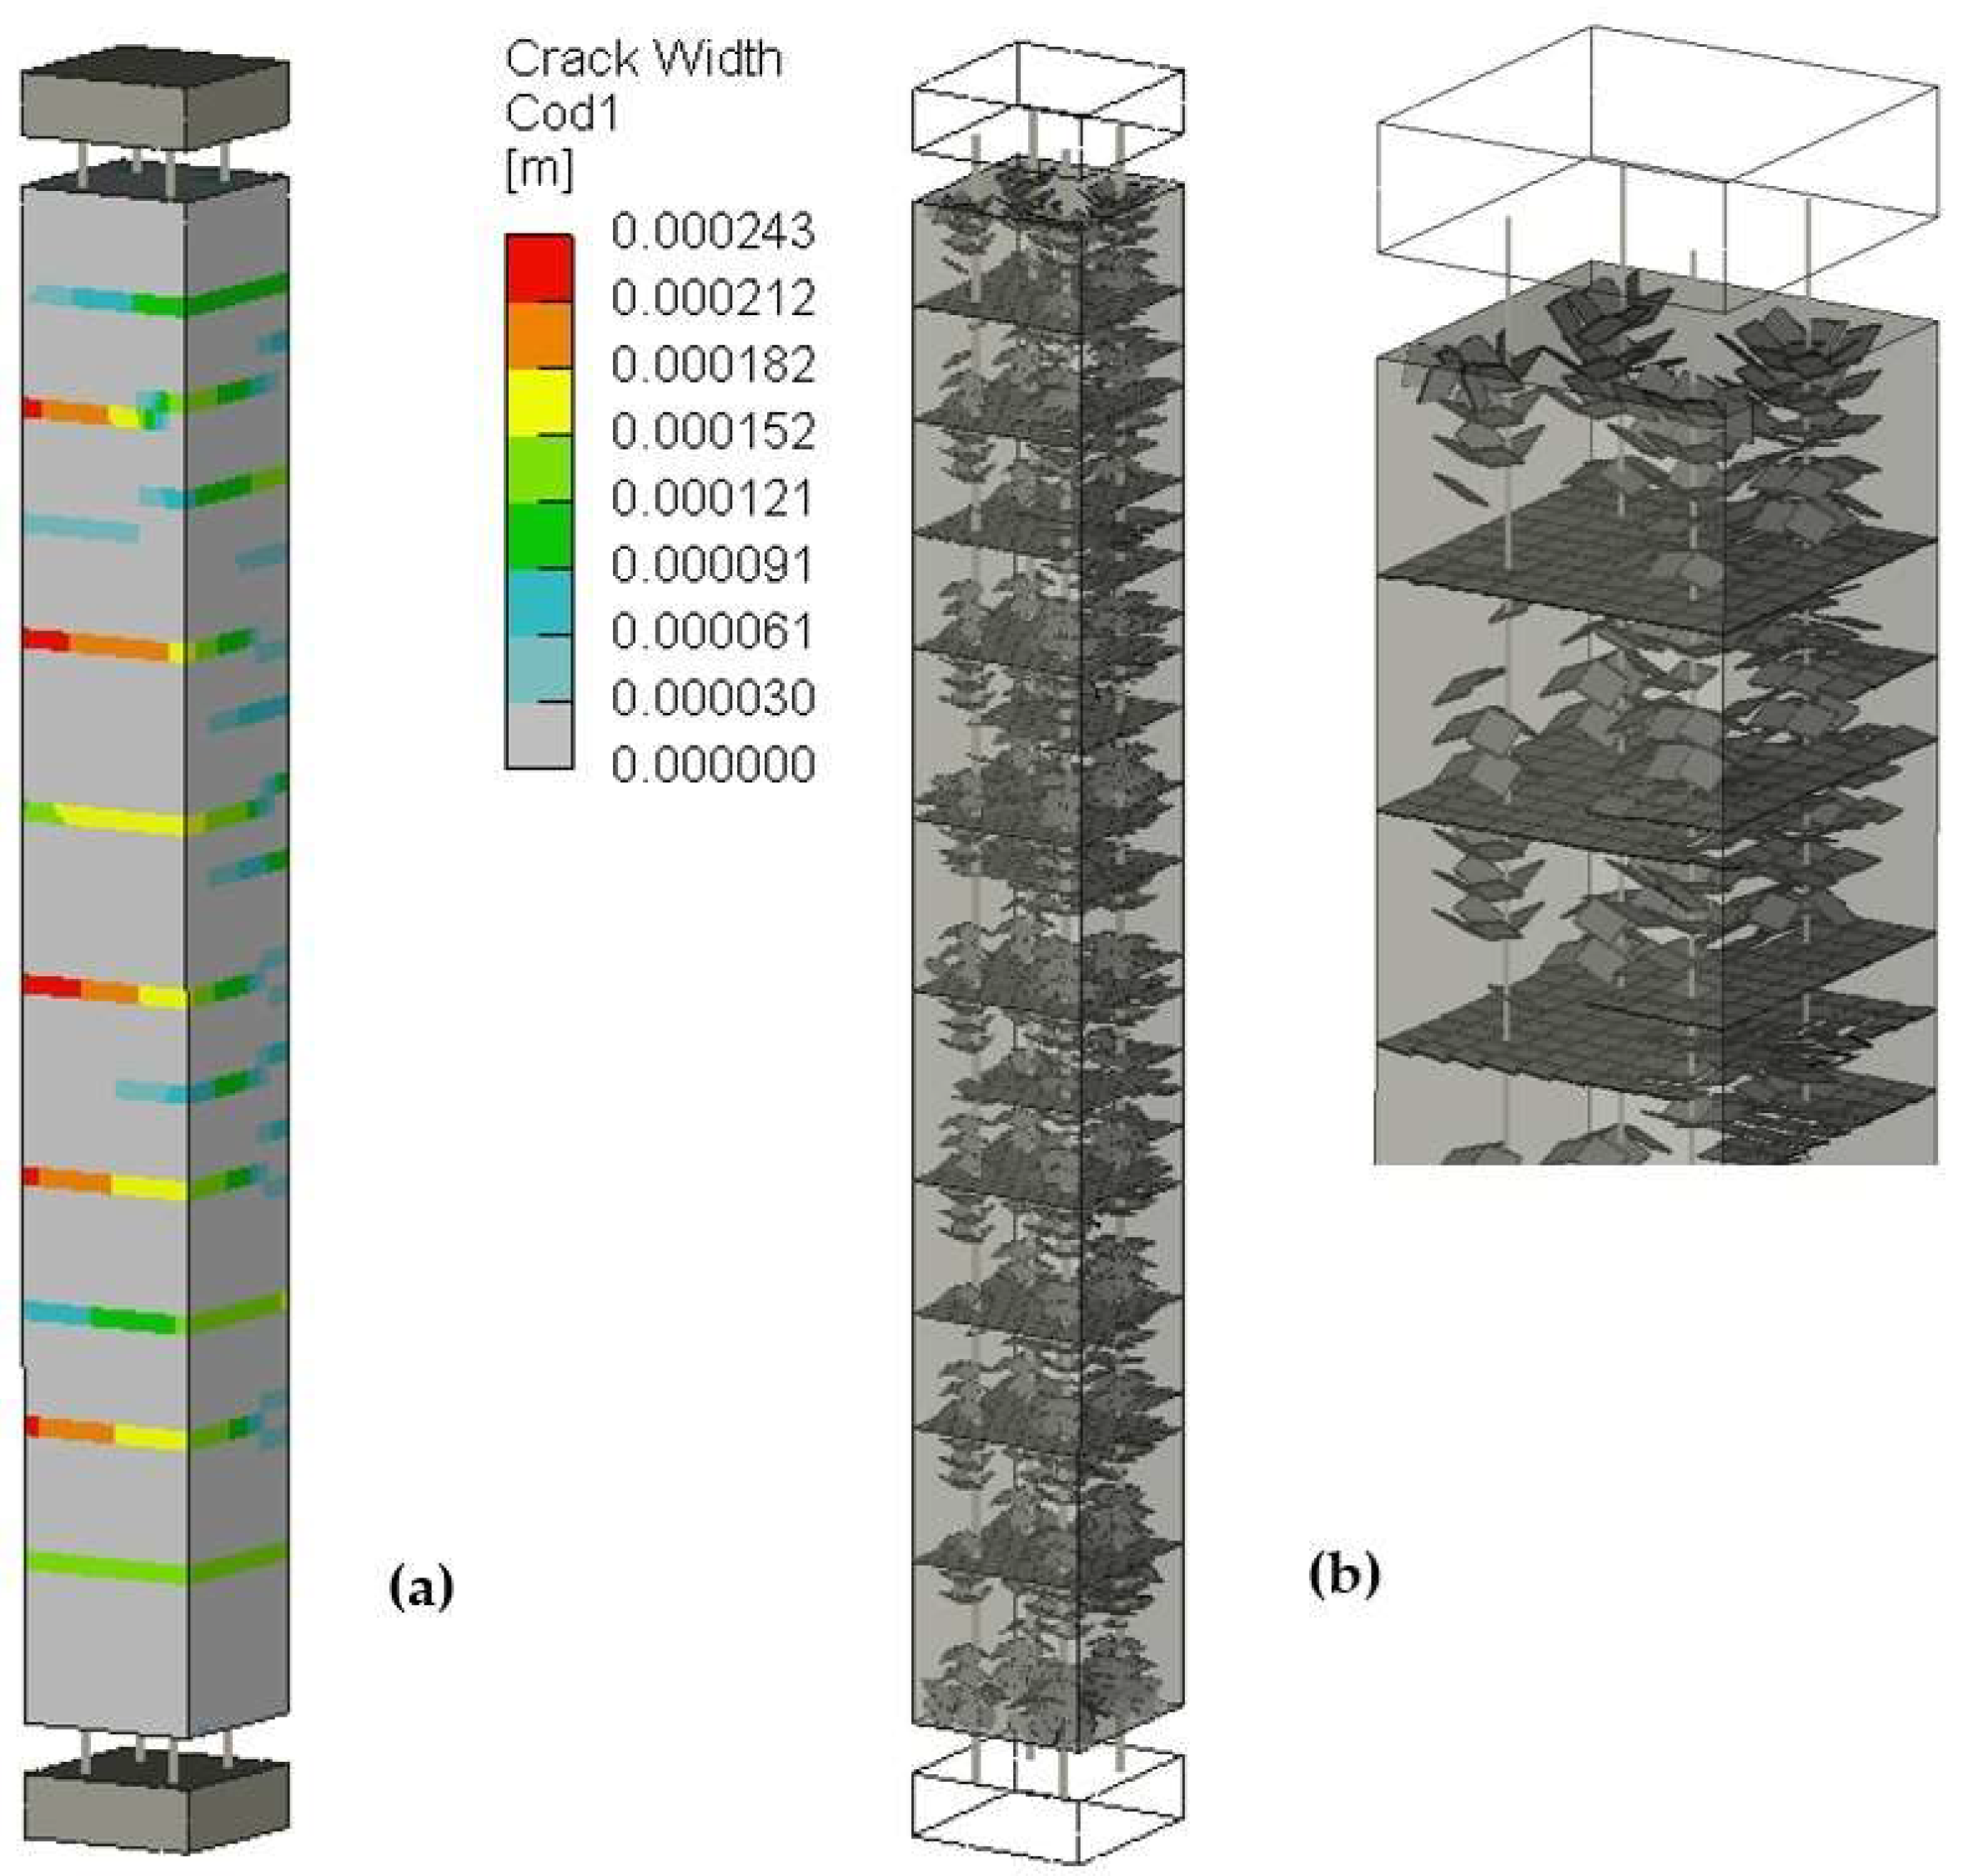
Figure 17.
Crack width and pattern for models with random fields corresponding to P = 100 kN.
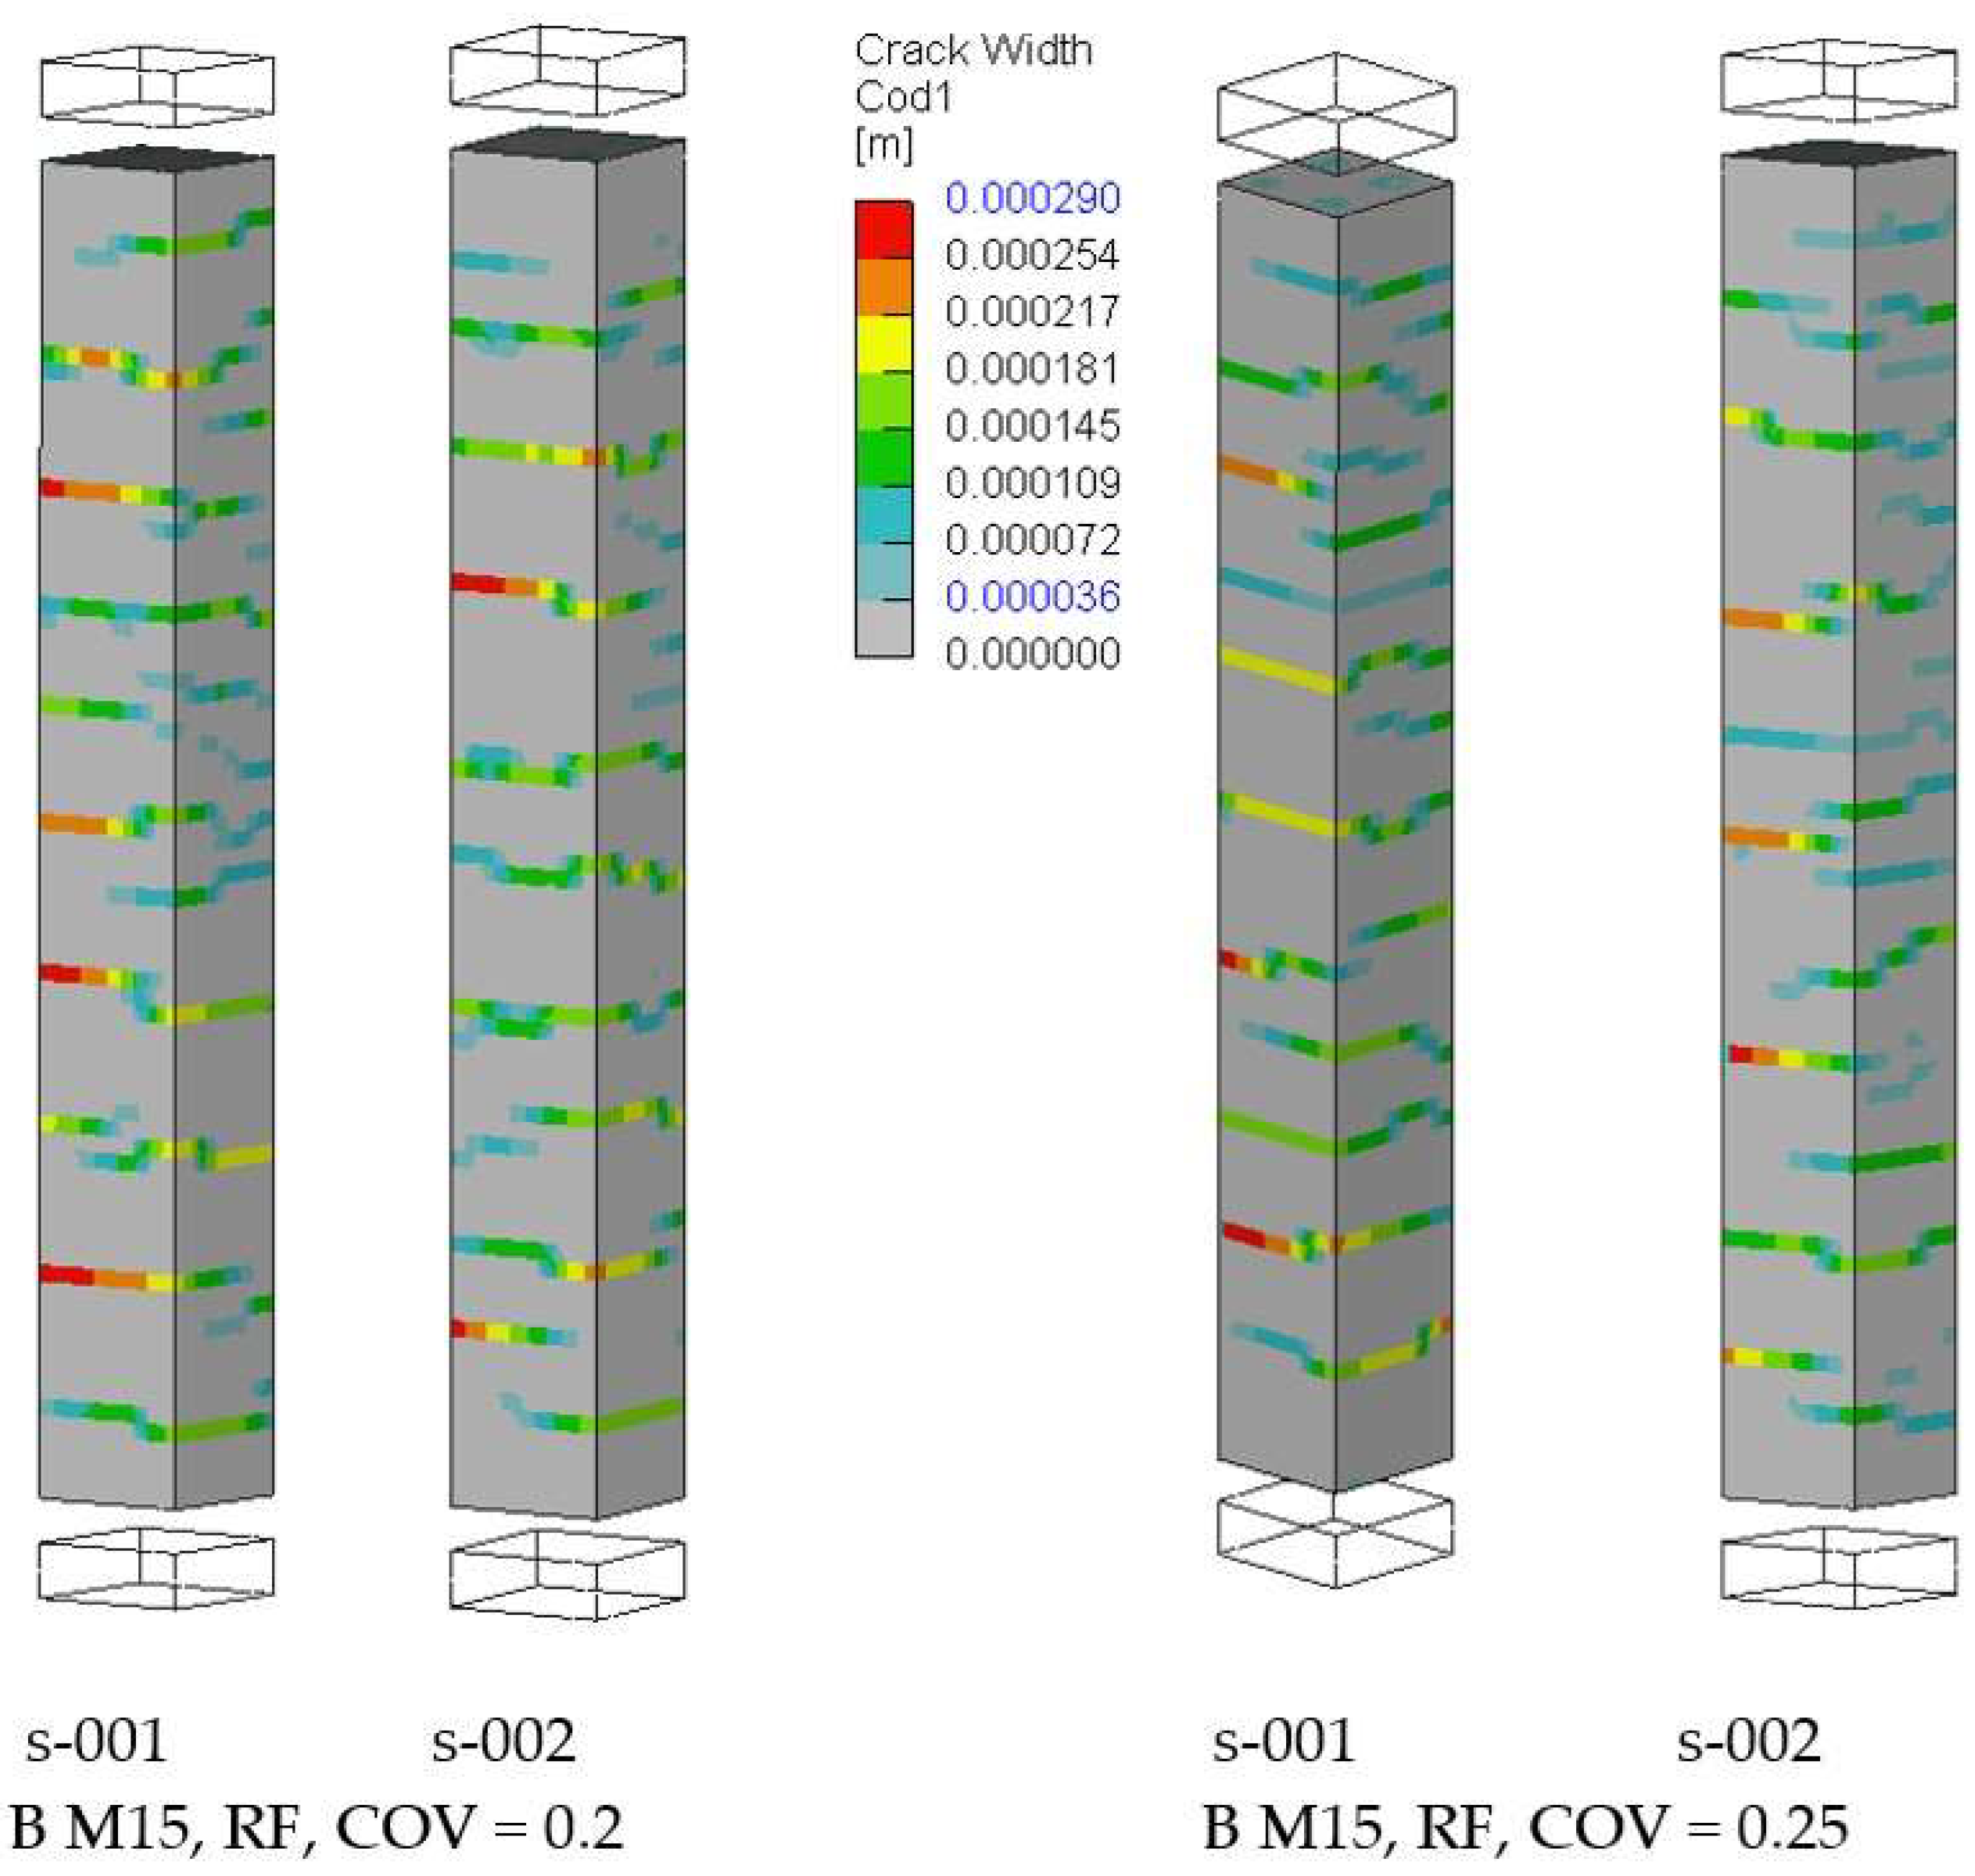
Figure 18.
Comparison of experiment crack width from two experiments (top) and the predicted crack pattern using coarse FE mesh M15 and random fields (middle, bottom). Figure always shows the cracks on all four surfaces of the reinforced concrete prism.
Figure 18.
Comparison of experiment crack width from two experiments (top) and the predicted crack pattern using coarse FE mesh M15 and random fields (middle, bottom). Figure always shows the cracks on all four surfaces of the reinforced concrete prism.
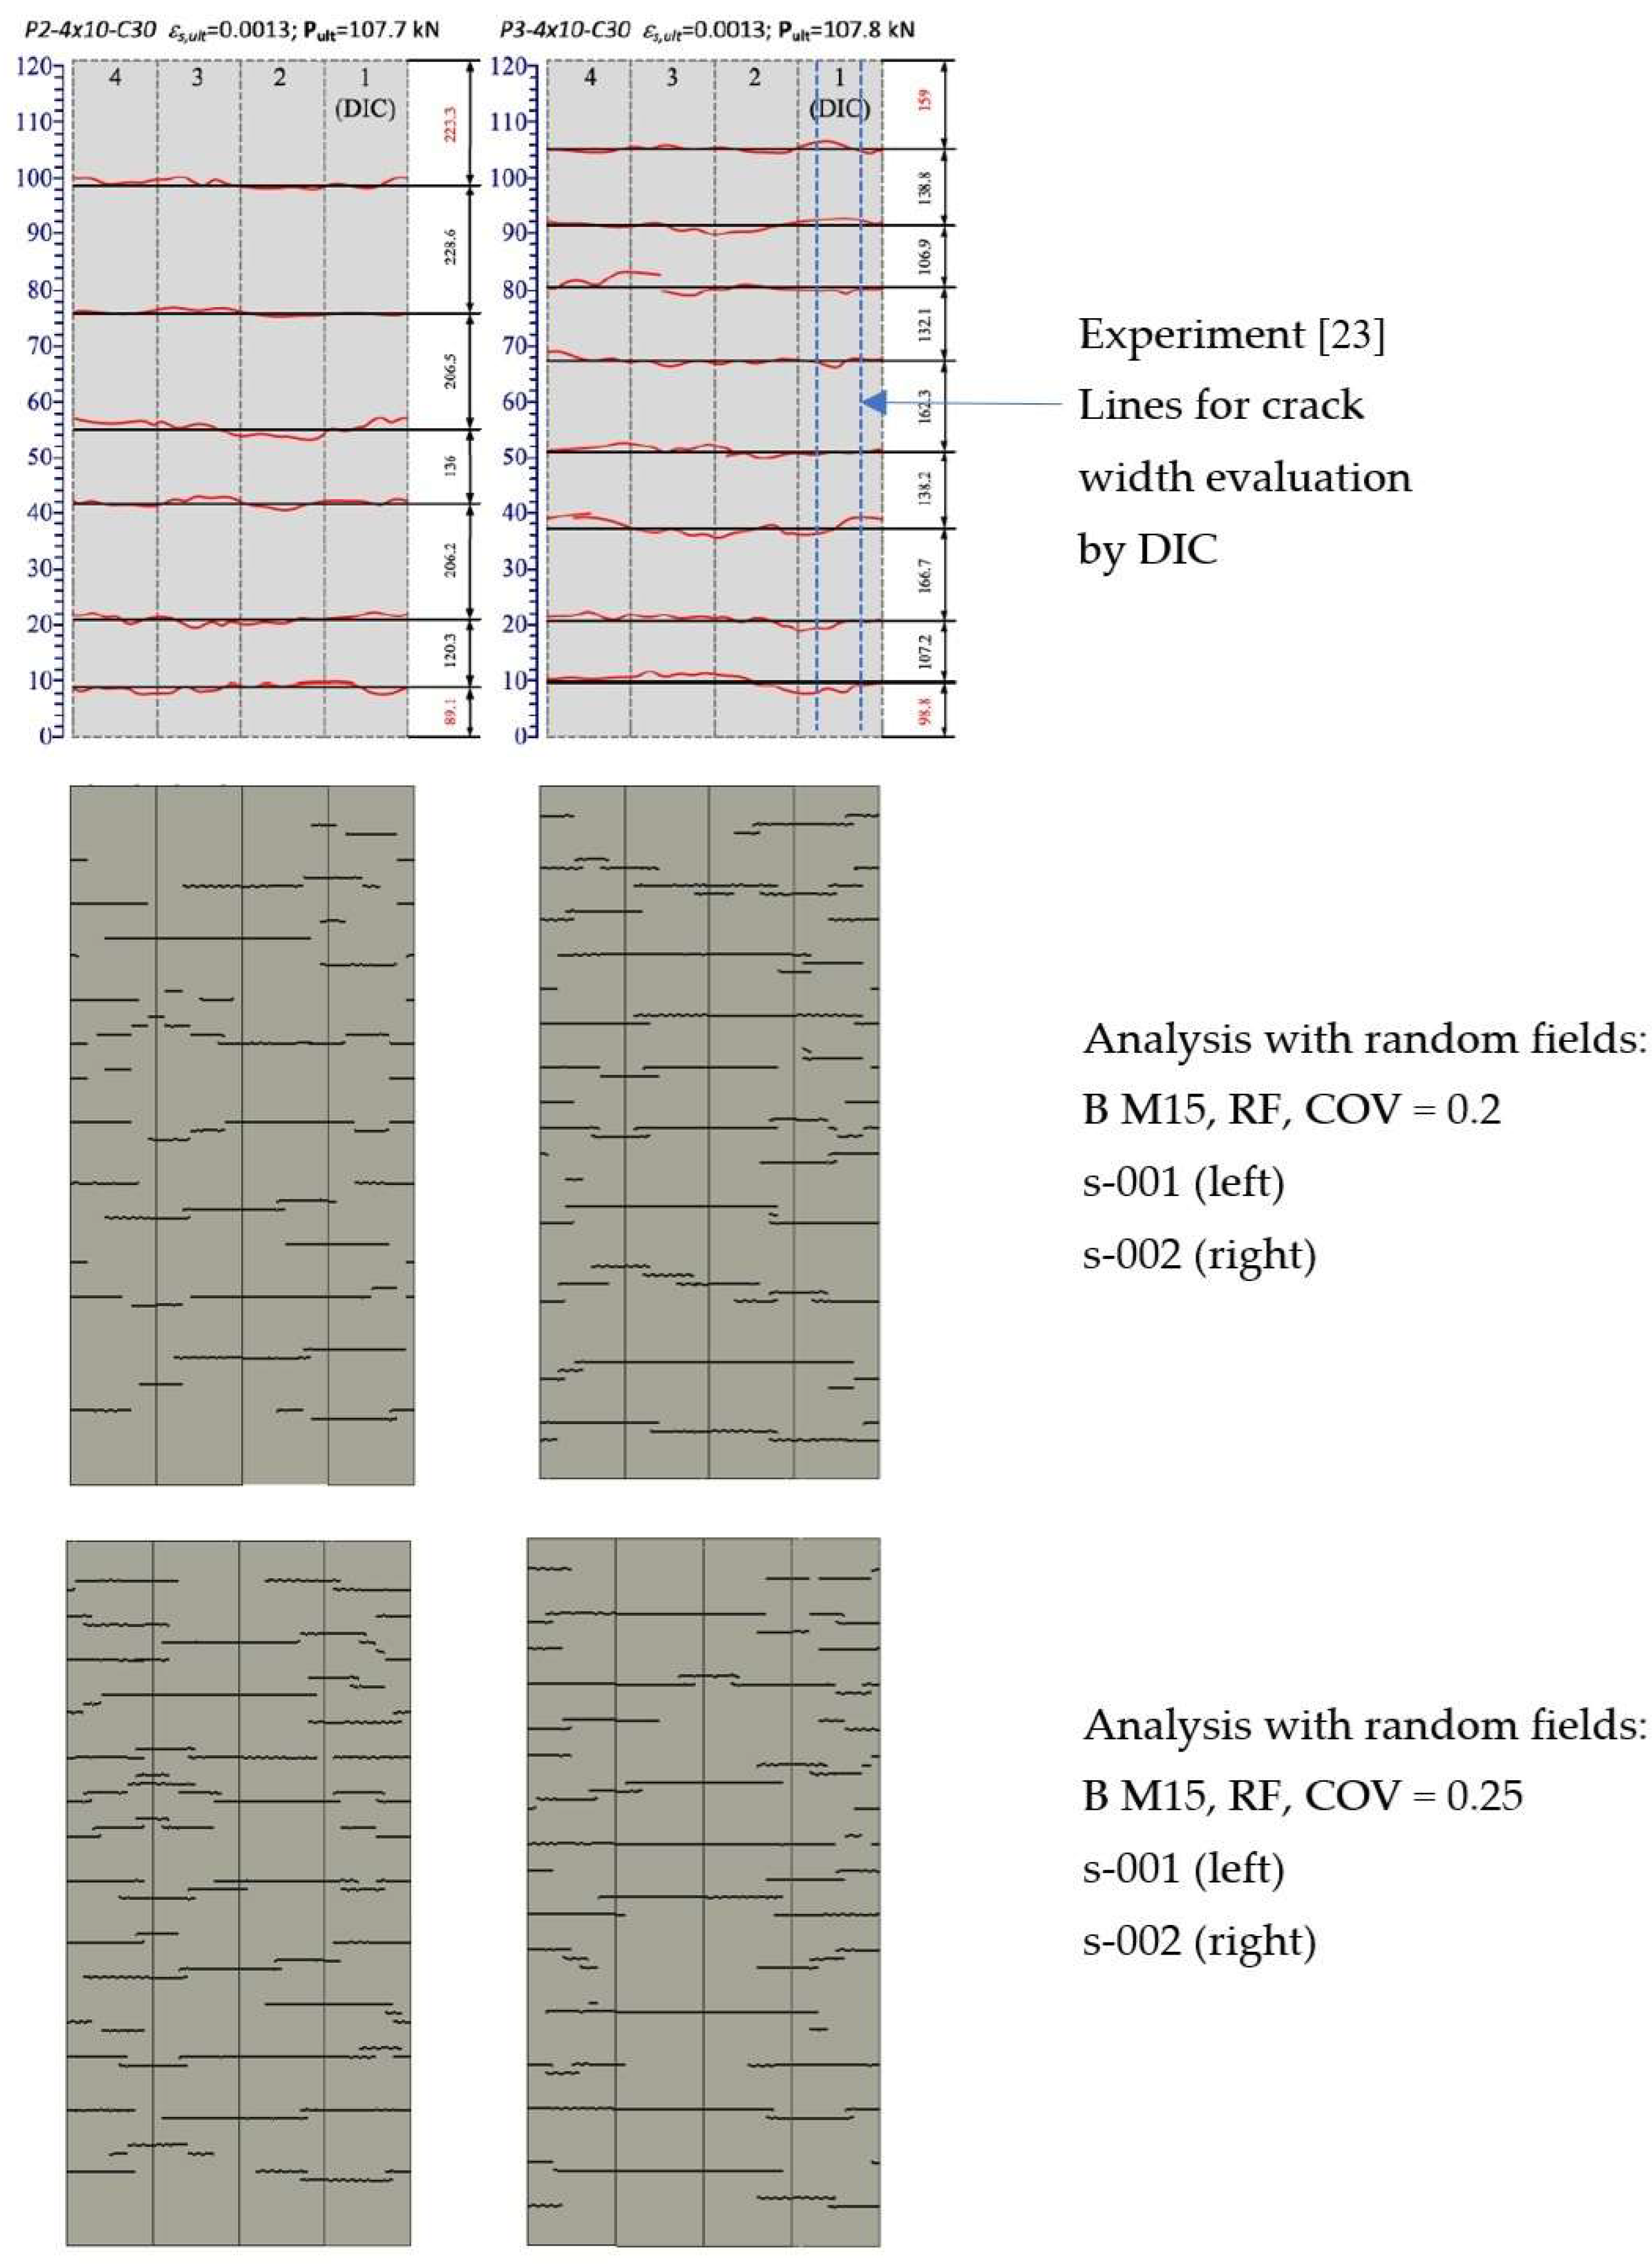
Figure 19.
Crack widths and visualization in the model for the coarse FE mesh M500: (a) the crack width iso-areas; (b) the crack widths integration points of finite elements; (c) crack location averaged at each finite element; (d) crack location at integration points.
Figure 19.
Crack widths and visualization in the model for the coarse FE mesh M500: (a) the crack width iso-areas; (b) the crack widths integration points of finite elements; (c) crack location averaged at each finite element; (d) crack location at integration points.
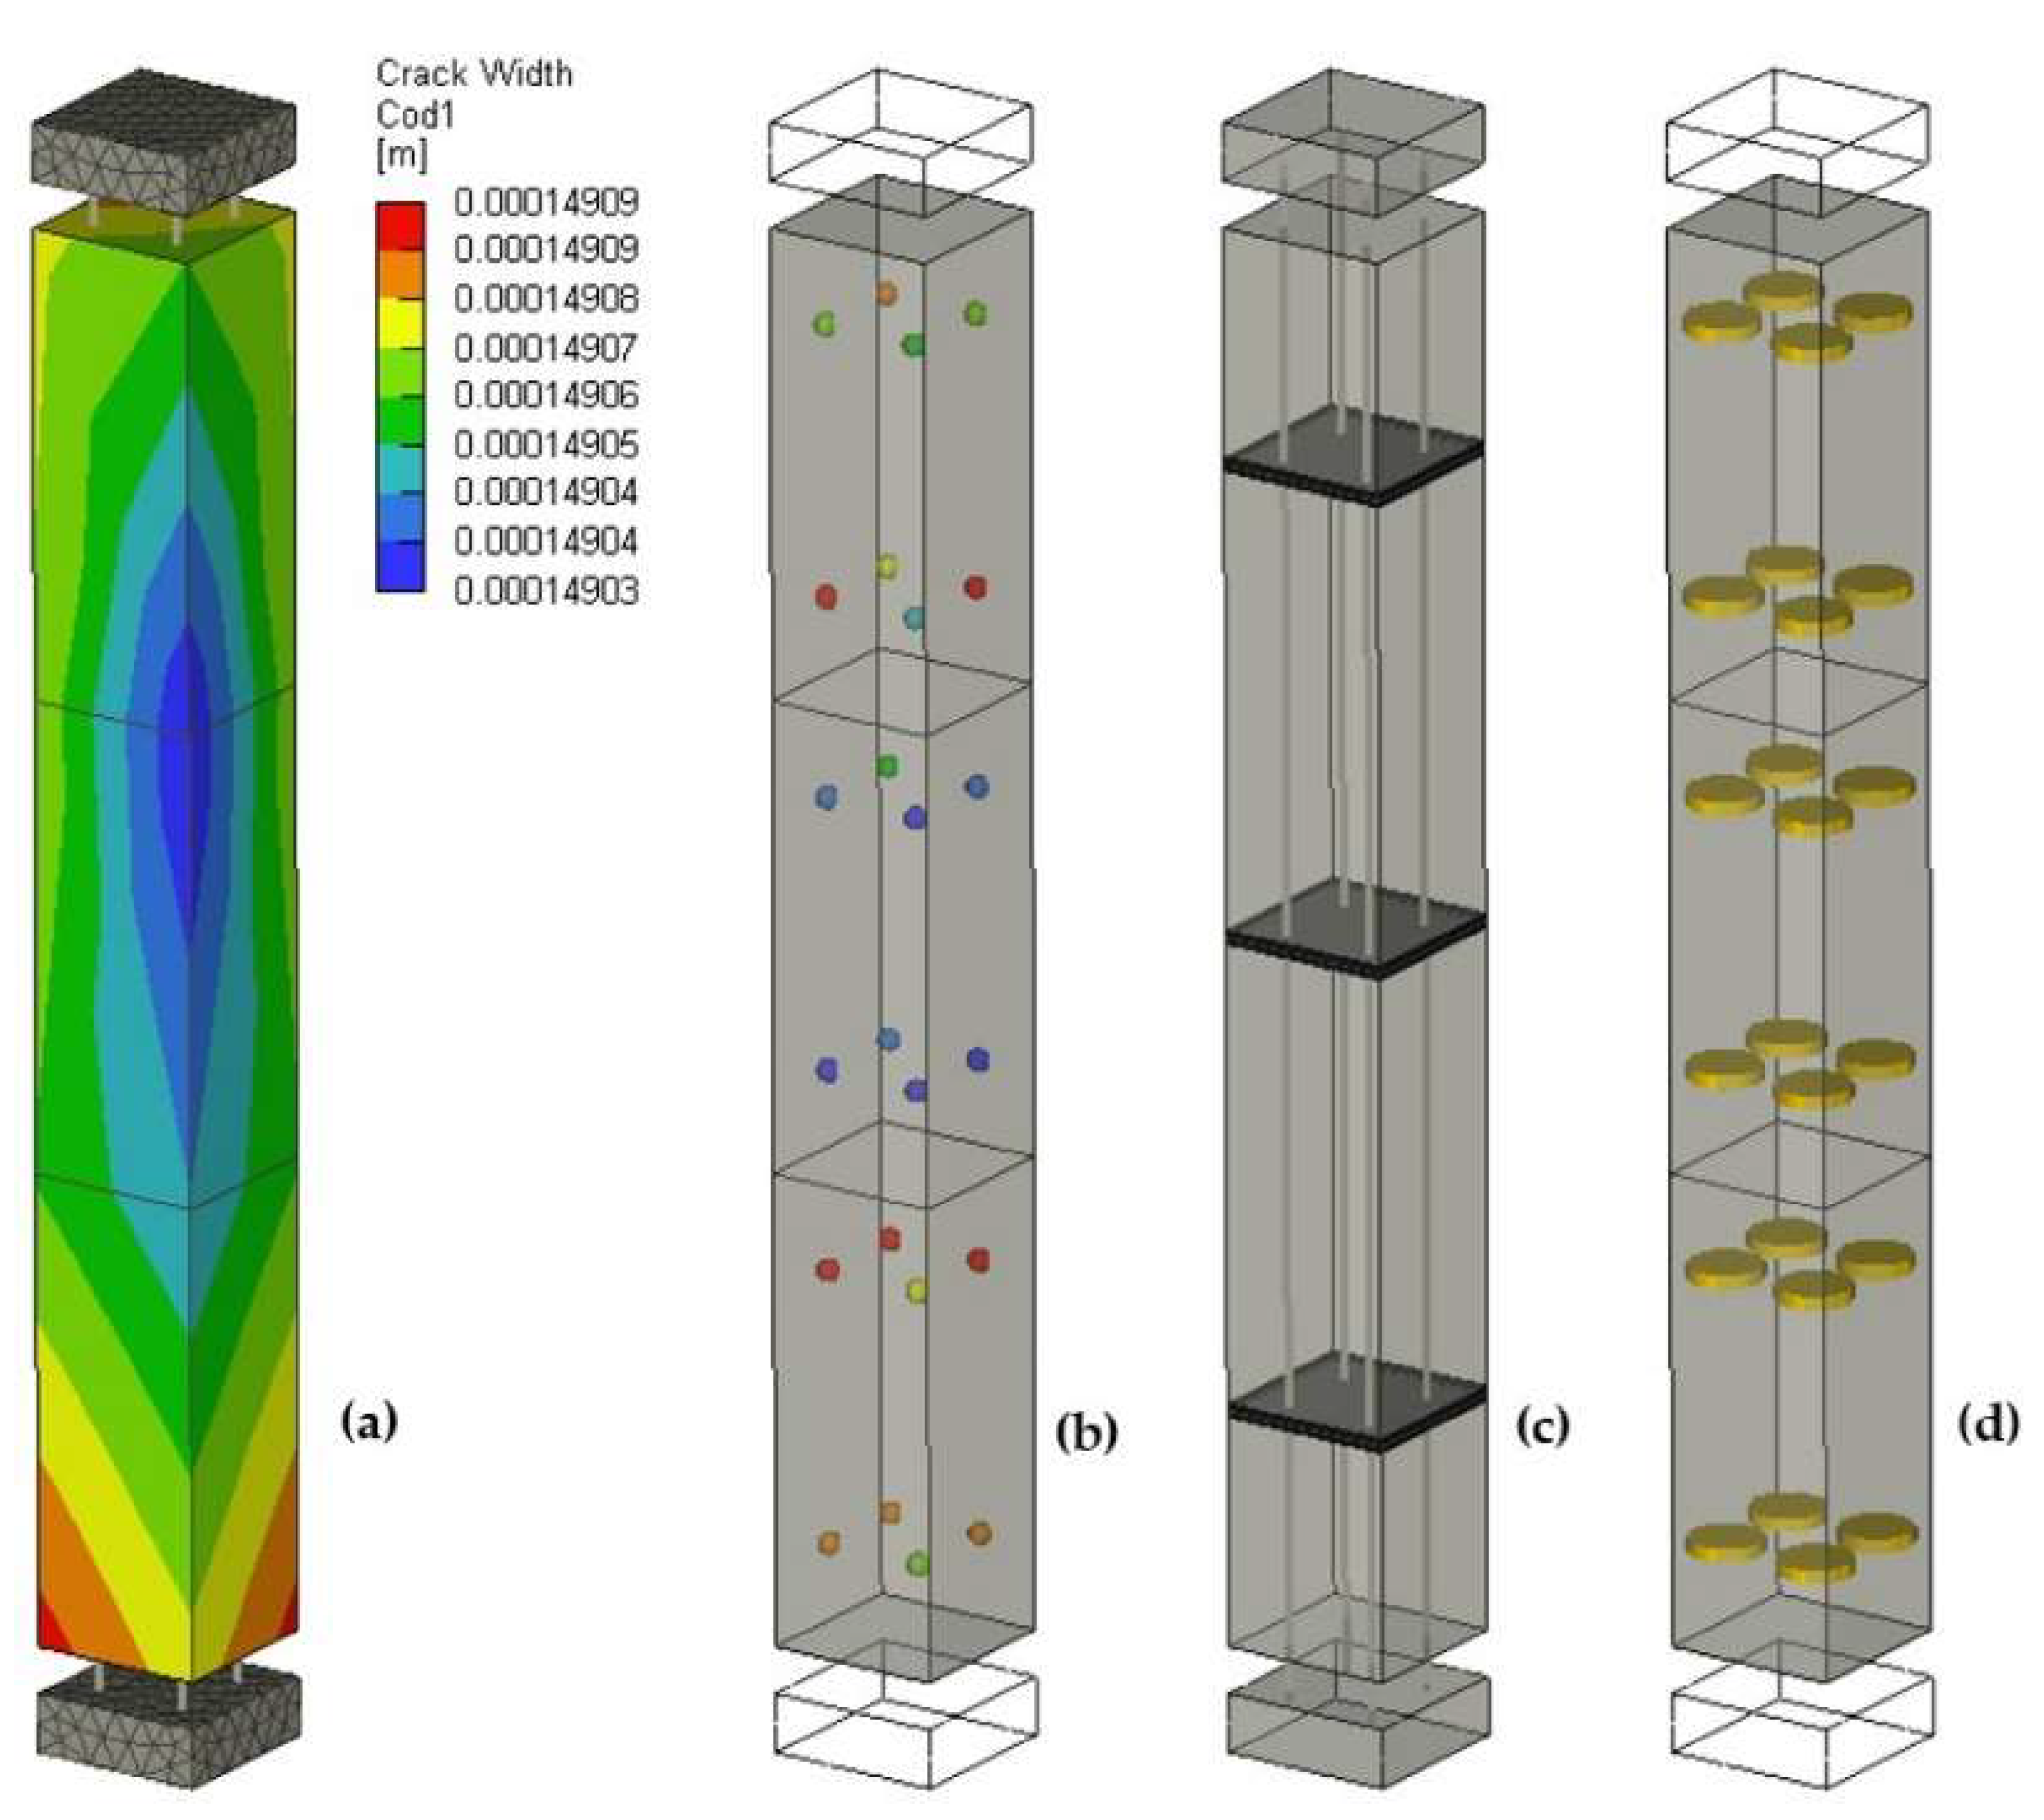
Figure 20.
The most adequate modeling approaches for refined and coarse FE meshes.
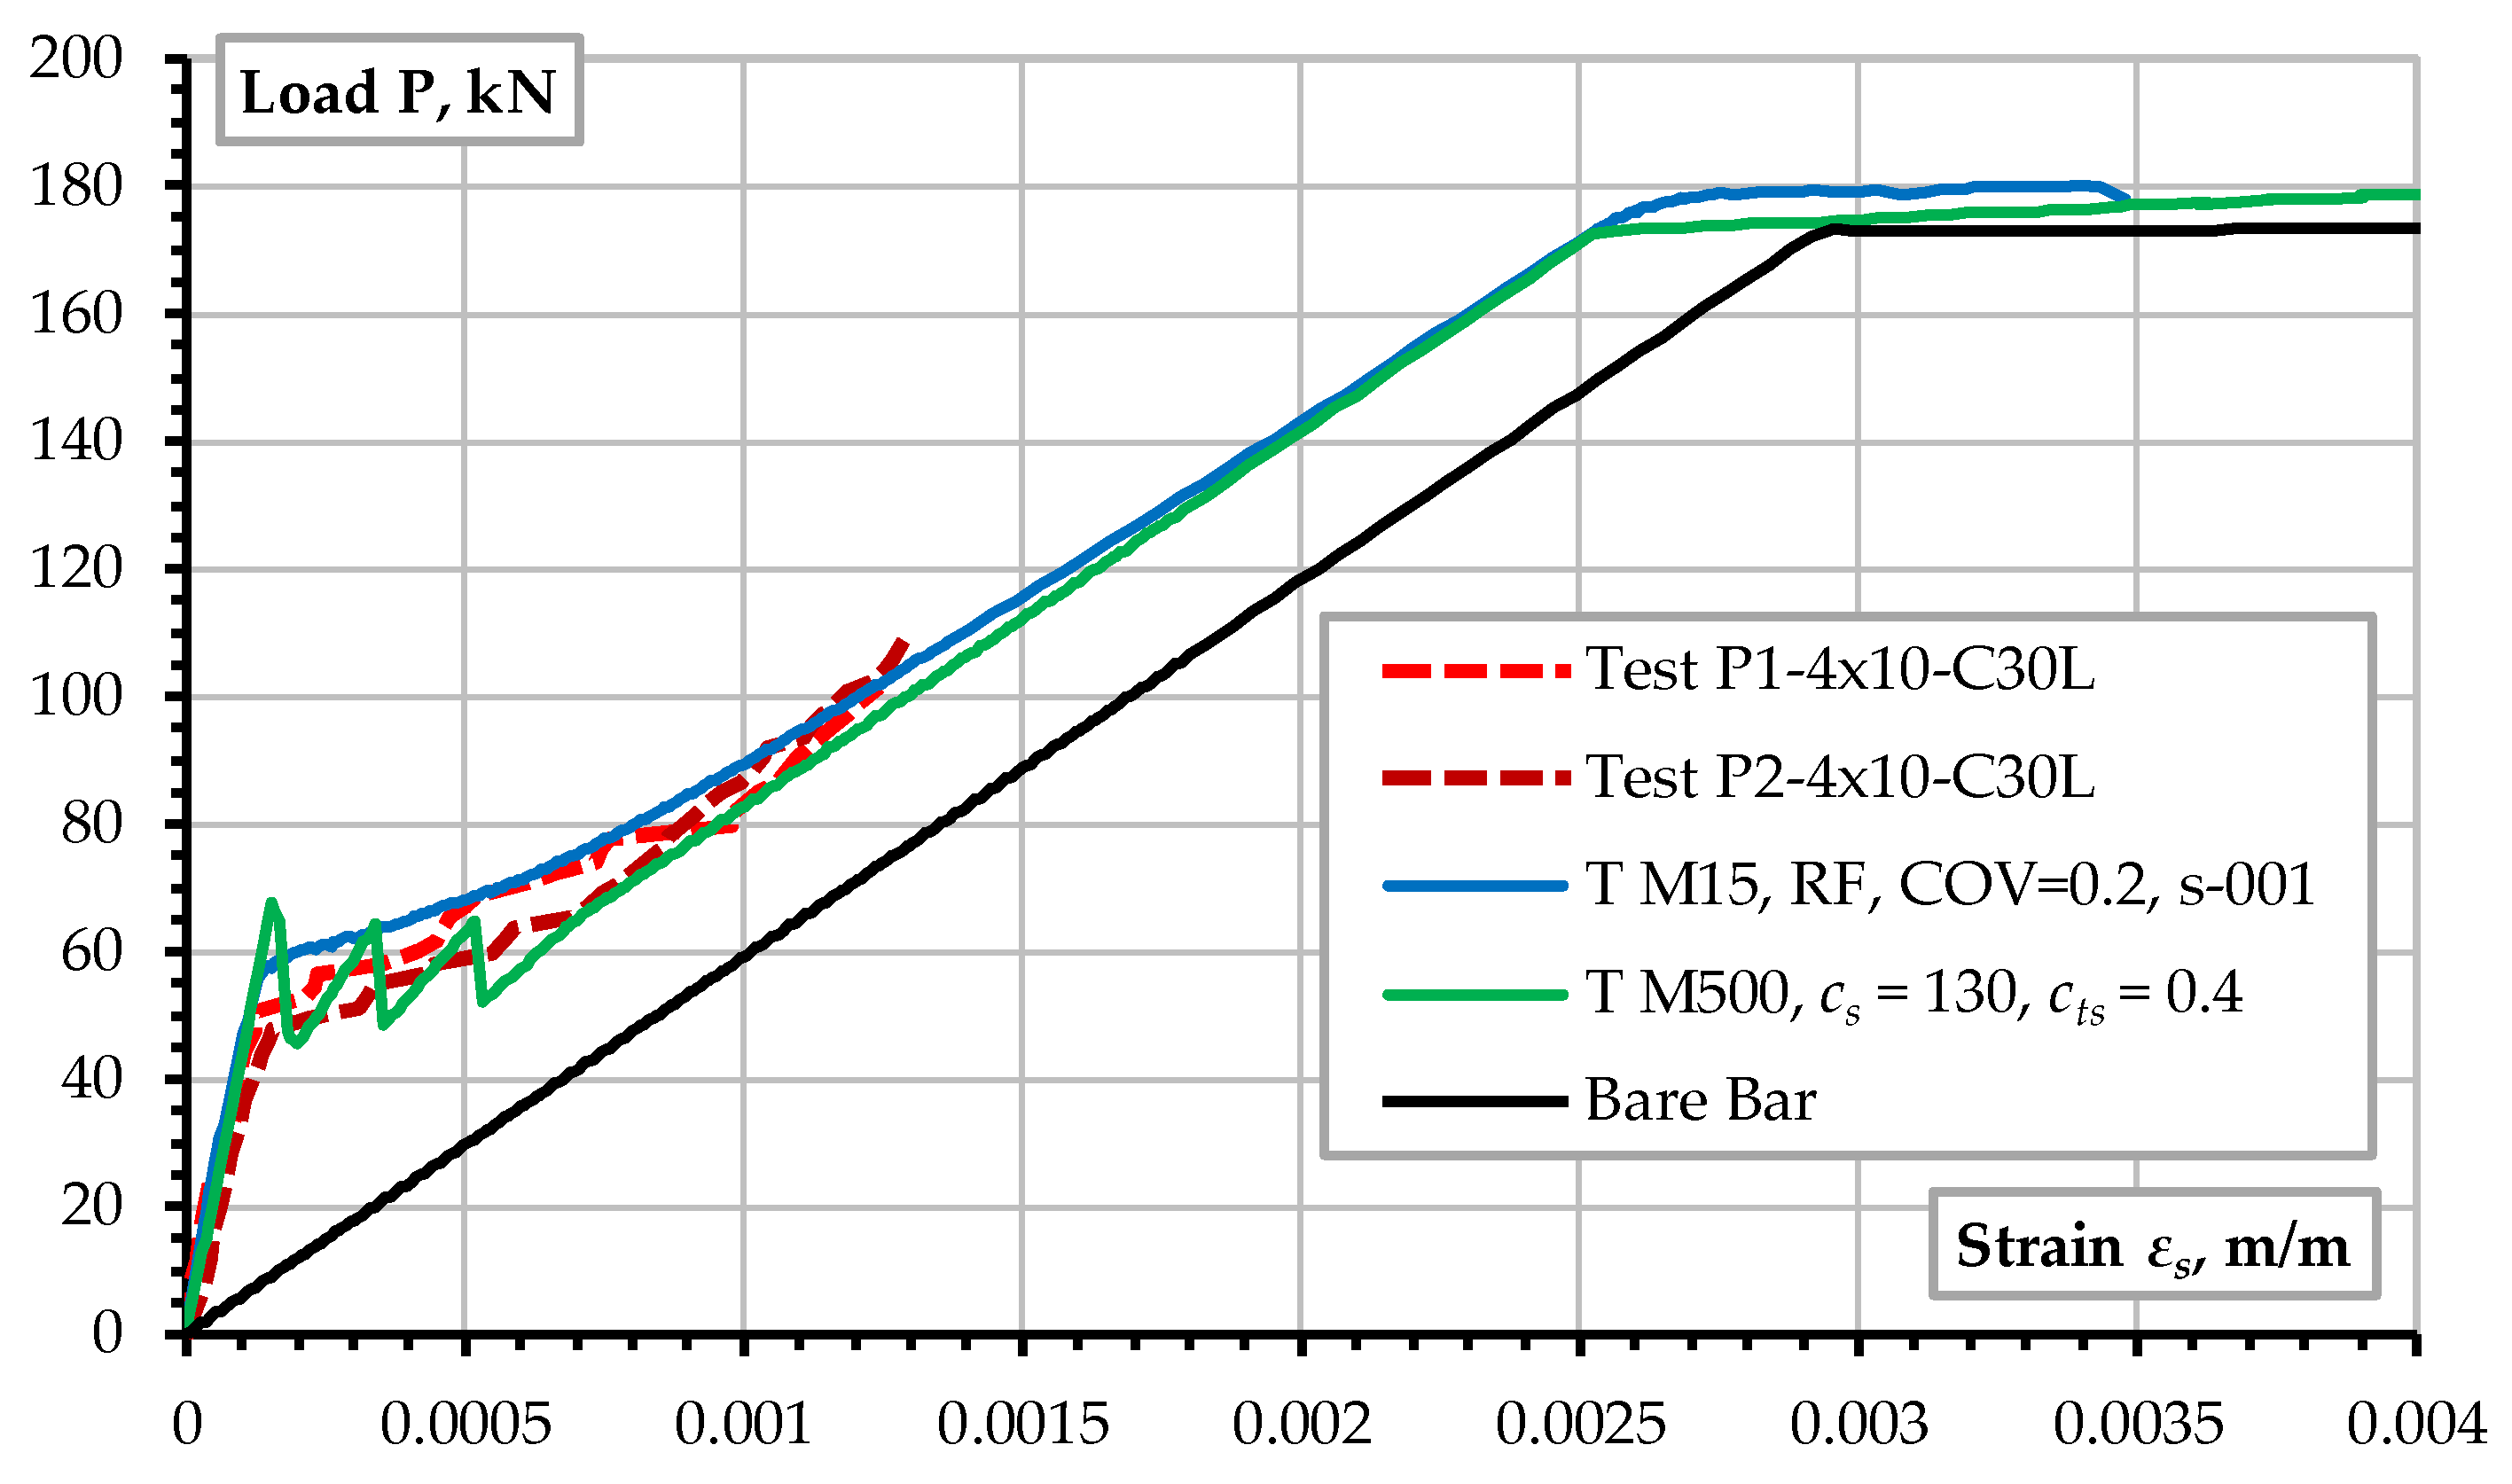
Table 1.
List of material parameters used in the numerical analysis (ref. to Figure 1).
Table 1.
List of material parameters used in the numerical analysis (ref. to Figure 1).
| Parameter | Value [unit] | Description |
|---|---|---|
| Concrete | ||
| Ec | 33.061 [GPa] | Modulus of elasticity |
| ν | 0.2 [-] | Poison’s ratio |
| ft | 2.79 [MPa] | Tensile strength |
| GF | 139 [N/m] | Fracture energy |
| fc | 36 [MPa] | Compressive strength |
| fc0 | 13 [MPa] | Onset of nonlinear behavior in compression |
| εcp | 0.0014 [MPa] | Plastic strain at fc |
| β | 0 [-] | Parameter controlling the return direction during the concrete crushing |
| wd | 0.5 [mm] | Critical displacement in compression |
| cfix | 0.7 [-] | Fixed crack coefficient controlling the switch from rotated to fixed crack model (Figure 1d) |
| da | 8 [mm] | Aggregate size |
| Reinforcement | ||
| Es | 200.0 [GPa] | Modulus of elasticity |
| fy | 550 [MPa] | Yield strength |
| fu | 594 [MPa] | Tensile strength |
| εu | 0.05 [-] | Rupture strain |
Table 2.
Description of FE models and their identification labels.
| Model label | Description |
|---|---|
| T M15 total | T = 1D truss used for reinforcement; M15 = mesh size 15 mm (Figure 5c); total = full 3D model (Figure 5a) |
| T M15 Q | T = 1D truss used for reinforcement; M15 = mesh size 15 mm; Q = a quarter 3D model (Figure 5b) |
| B M500 (cs not used) | B = 1D beam elements used for reinforcement; M500 = coarse mesh size 500 mm, full model; Crack spacing cs not applied |
| B M500 (cs = 130) | B = 1D beam elements used for reinforcement; M500 = coarse mesh size 500 mm, full model; Crack spacing applied with cs = 130 mm |
| B M500 (cs = 50) | B = 1D beam elements used for reinforcement; M500 = coarse mesh size 500 mm, full model; Crack spacing applied with cs = 50 mm |
| T M500 (cs = 50) | T = 1D truss elements used for reinforcement; M500 = coarse mesh size 500 mm, full model; Crack spacing applied with cs = 50 mm |
| T M500 (cs = 50, cts = 0.4) | T = 1D truss elements used for reinforcement; M500 = coarse mesh size 500 mm, full model; Crack spacing applied with cs = 50 mm; Tension stiffening applied, cts = 0.4 (Figure 8) |
| B M30 total | B = 1D beam elements used for reinforcement; M30 - mesh size 30 mm; total = full 3D model |
| B M15 total | B = 1D beam elements used for reinforcement; M15 = mesh size 15 mm; total = full 3D model |
| B M15, RF, COV, s | B = 1D beam elements used for reinforcement; M15 = mesh size 15 mm, full 3D model; RF = Random fields used for ft and GF; COV = describes the used coefficient of variation; s = identifies the sample (only two samples of random field distribution were used for each COV |
| T M15, RF, COV, s | T = 1D beam elements used for reinforcement; M15 = mesh size 15 mm, full 3D model; RF = Random fields used for ft and GF; COV = describes the used coefficient of variation; s = identifies the sample (up to two samples of random field distribution were used for each COV |
| Bare Bar | Model of four 10 mm bars without concrete |
Disclaimer/Publisher’s Note: The statements, opinions and data contained in all publications are solely those of the individual author(s) and contributor(s) and not of MDPI and/or the editor(s). MDPI and/or the editor(s) disclaim responsibility for any injury to people or property resulting from any ideas, methods, instructions or products referred to in the content. |
© 2025 by the authors. Licensee MDPI, Basel, Switzerland. This article is an open access article distributed under the terms and conditions of the Creative Commons Attribution (CC BY) license (http://creativecommons.org/licenses/by/4.0/).
Copyright: This open access article is published under a Creative Commons CC BY 4.0 license, which permit the free download, distribution, and reuse, provided that the author and preprint are cited in any reuse.


