
Submitted:
26 January 2025
Posted:
04 February 2025
Read the latest preprint version here
Abstract
This manuscript proposes a methodology to leverage digitalisation to efficiently generate an overview of required condition-based railway track interventions, possession windows, and expected costs for railway networks at the beginning of the intervention planning process. The consistent and efficient generation of such an overview not only helps track managers in their decision-making, but also facilitates the discussion among other decision-makers in later phases of the track intervention planning process, including line planners, capacity managers, and project managers. The methodology uses data of different levels of detail, discrete state modelling for uncertain deterioration of components, and component-level intervention strategies. It dynamically updates the condition estimates of components by capturing the interaction between deteriorating components using Bayesian filters. It also estimates the risks associated with different types of potential service losses that may occur due to sudden events using fault trees as a function of time and the condition of components. An implementation of the methodology is done for a 25 km regional railway network in Switzerland. The results suggest that the methodology has the potential to help track managers early in the intervention planning process. In addition, it is argued that the methodology will lead to improvements in the efficiency of the planning process, improvements in the scheduling of preventive interventions, and the reduction in corrective intervention costs upon the implementation in a digital environment.
Keywords:
1. Introduction
2. Literature Review
- estimating intervention requirements and the failure risk at the component level, since this is considered to establish an appropriate trade-off between the required effort to implement the methodology and provided level of detail.
- using non-homogeneous deterioration rates coupled with Bayesian filters to provide an improved modelling of the components’ deterioration, since the deterioration rate of the components changes over time due to both the imperfections in the execution of the maintenance intervention and the interaction between deteriorating components [15]. For example, a fresh ballast does not behave the same as a ballast that has been rehabilitated three times.
- incorporating the service loss in the estimation of intervention requirements in addition to the structural failure since the highest risks associated with railway tracks in a well-managed railway infrastructure is the service loss, and not total structural failure.

| Source | Theme | Detail Level |
|---|---|---|
| Adey and Hajdin[16] | Methodology for determination of financial needs of gradually deteriorating bridges with only structure level data | Asset |
| Allah Bukhsh et al.[17] | Multi-year maintenance planning framework using multi-attribute utility theory and genetic algorithms | Asset |
| Bressi et al.[18] | Optimization of maintenance strategies for railway track-bed considering probabilistic degradation models and different reliability levels | Element |
| Chiachío et al.[19] | A knowledge-based prognostics framework for railway track geometry degradation | Asset |
| Consilvio et al.[20] | A data-driven prioritisation framework to mitigate maintenance impact on passengers during metro line operation | Asset |
| Consilvio et al. | On Applying Machine Learning and Simulative Approaches to Railway Asset Management: The Earthworks and Track Circuits Case Studies | Asset |
| Fecarotti and Andrews[21] | A Petri net approach to assess the effects of railway maintenance on track availability | Component |
| Fecarotti and Andrews[12] | Producing effective maintenance strategies to control railway risk | Asset |
| Giunta et al.[3] | Life cycle cost assessment of bitumen stabilised ballast: A novel maintenance strategy for railway track-bed | Element |
| Hidirov and Guler[22] | Reliability, availability and maintainability analyses for railway infrastructure management | Component |
| Irfan et al.[23] | Framework for airfield pavements management—an approach based on cost-effectiveness analysis | Asset |
| Kaewunruen et al.[14] | Risk-Based Maintenance Planning for Rail Fastening Systems | Element |
| Kobayashi et al.[11] | A competing Markov model for cracking prediction on civil structures | Asset |
| Le et al.[24] | A Petri net model for railway bridge maintenance | Asset |
| Mehranfar et al.[13] | Automated early estimation of bridge interventions, possession windows and costs | Component |
| Papathanasiou and Adey[25] | Making comparable risk estimates for railway assets of different types | Asset |
| Prescott and Andrews[26] | Investigating railway track asset management using a Markov analysis | Asset |
| Prescott and Andrews[27] | A track ballast maintenance and inspection model for a rail network | Component |
| Rúa et al.[28] | A top-down approach for a multi-scale identification of risk areas in infrastructures: particularization in a case study on road safety | Asset |
| Sadeghi et al.[29] | Improvement of railway ballast maintenance approach, incorporating ballast geometry and fouling conditions | Element |
| Sancho et al.[30] | Optimizing Maintenance Decision in Rails: A Markov Decision Process Approach | Asset |
| Sasidharan et al.[31] | A whole life cycle approach under uncertainty for economically justifiable ballasted railway track maintenance | Asset |
| Sharma et al.[32] | Data-driven optimization of railway maintenance for track geometry | Asset |
| Soleimanmeigouni et al.[33] | Prediction of railway track geometry defects: a case study | Asset |
| Sresakoolchai and Kaewunruen[34] | Railway infrastructure maintenance efficiency improvement using deep reinforcement learning integrated with digital twin based on track geometry and component defects | Component |
| Usman et al.[35] | Railway track subgrade failure mechanisms using a fault chart approach | Element |
| Usman et al.[36] | Using Probabilistic Fault Tree Analysis and Monte Carlo Simulation to Examine the Likelihood of Risks Associated with Ballasted Railway Drainage Failure | Asset |
| Vale and Simos[37] | Prediction of Railway Track Condition for Preventive Maintenance by Using a Data-Driven Approach | Asset |
| Vandoorne and Gräbe[38] | Stochastic rail life cycle cost maintenance modelling using Monte Carlo simulation | Element |
| Wenfi et al.[39] | Optimization Model of Life Cycle Repair Decisions for Track Network | Asset |
| This manuscript | Improving the intervention planning of railway tracks considering the interaction of components and uncertain evolution of failure risks | Component |
| Deterioration Types | Failure Risks | |||||||||
|---|---|---|---|---|---|---|---|---|---|---|
| Source | Gradual | Sudden | Deterioration Modelling | Dynamic Deterioration Rates | Interaction Between Assets/Components | Structural | Service | Dynamic FR[1] Calculation | IS[1] determination/Utilization | Generating Future Interventions Overview |
| Adey and Hajdin[16] | Stochastic | × | × | × | × | × | ||||
| Allah Bukhsh et al.[17] | × | Mixed | × | × | × | × | ||||
| Bressi et al.[18] | × | Stochastic | × | × | × | × | × | × | ||
| Chiachío et al.[19] | Stochastic | × | × | × | × | × | ||||
| Consilvio et al.[20] | × | × | - | × | × | × | × | × | ||
| Consilvio et al. | × | Stochastic | × | × | × | × | ||||
| Fecarotti and Andrews[21] | Stochastic | × | × | × | × | × | ||||
| Fecarotti and Andrews[12] | Stochastic | × | × | × | × | × | ||||
| Giunta et al.[3] | × | Deterministic | × | × | × | × | × | × | ||
| Hidirov and Guler[22] | Stochastic | × | × | × | × | × | ||||
| Irfan et al.[23] | × | Deterministic | × | × | × | × | × | × | ||
| Kaewunruen et al.[14] | × | Stochastic | × | × | × | × | × | |||
| Kobayashi et al.[11] | × | Stochastic | × | × | × | × | × | |||
| Le et al.[24] | × | Stochastic | × | × | × | × | × | × | ||
| Mehranfar et al.[13] | Stochastic | × | × | |||||||
| Papathanasiou and Adey[25] | × | - | × | × | × | × | × | |||
| Prescott and Andrews[26] | × | Stochastic | × | × | × | × | × | × | ||
| Prescott and Andrews[27] | × | Stochastic | × | × | × | × | × | × | ||
| Rúa et al.[28] | × | - | × | × | × | × | × | × | ||
| Sadeghi et al.[29] | × | Deterministic | × | × | × | × | × | × | ||
| Sancho et al.[30] | × | Stochastic | × | × | × | × | × | × | ||
| Sasidharan et al.[31] | Stochastic | × | × | × | × | × | ||||
| Sharma et al.[32] | Stochastic | × | × | × | × | × | ||||
| Soleimanmeigouni et al.[33] | × | Deterministic | × | × | × | × | ||||
| Sresakoolchai and Kaewunruen[34] | × | AI | × | × | × | × | × | |||
| Usman et al.[35] | × | - | × | × | × | × | × | × | ||
| Usman et al.[36] | × | Stochastic | × | × | × | × | × | |||
| Vale and Simos[37] | × | Stochastic | × | × | × | × | × | × | ||
| Vandoorne and Gräbe[38] | Stochastic | × | × | × | × | × | ||||
| Wenfi et al.[39] | Stochastic | × | × | × | × | |||||
| This manuscript | Stochastic | |||||||||
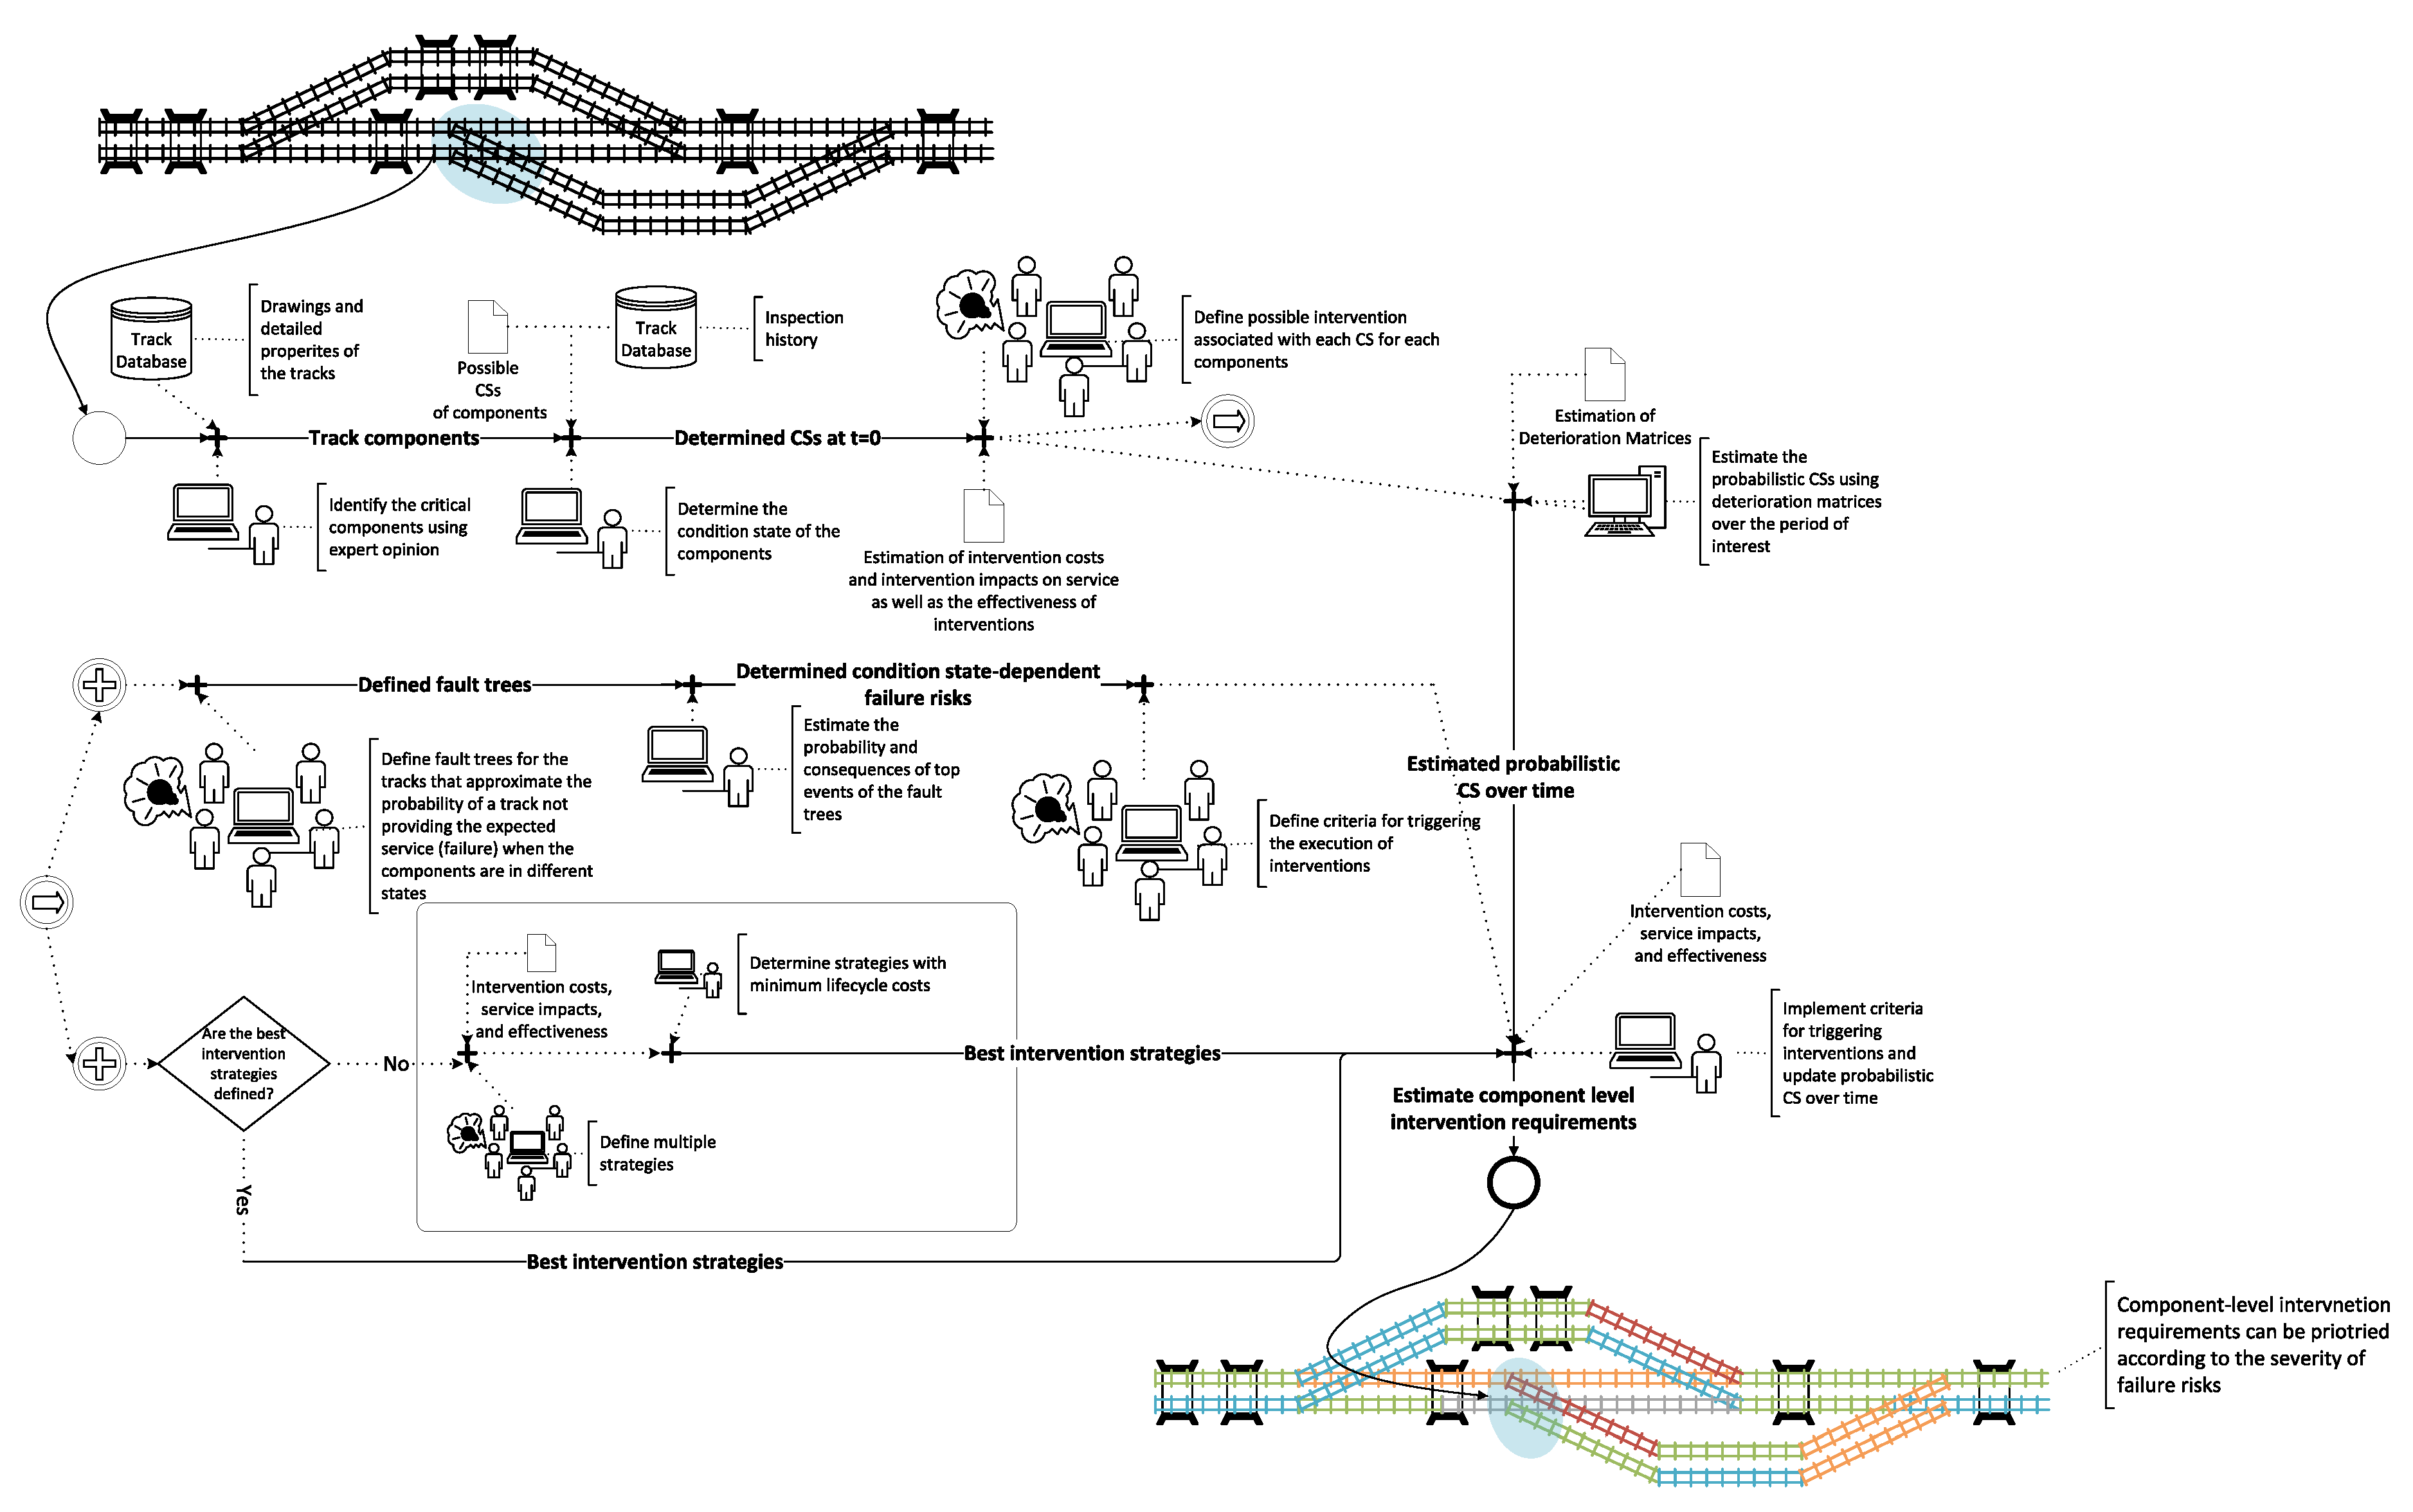
3. Methodology
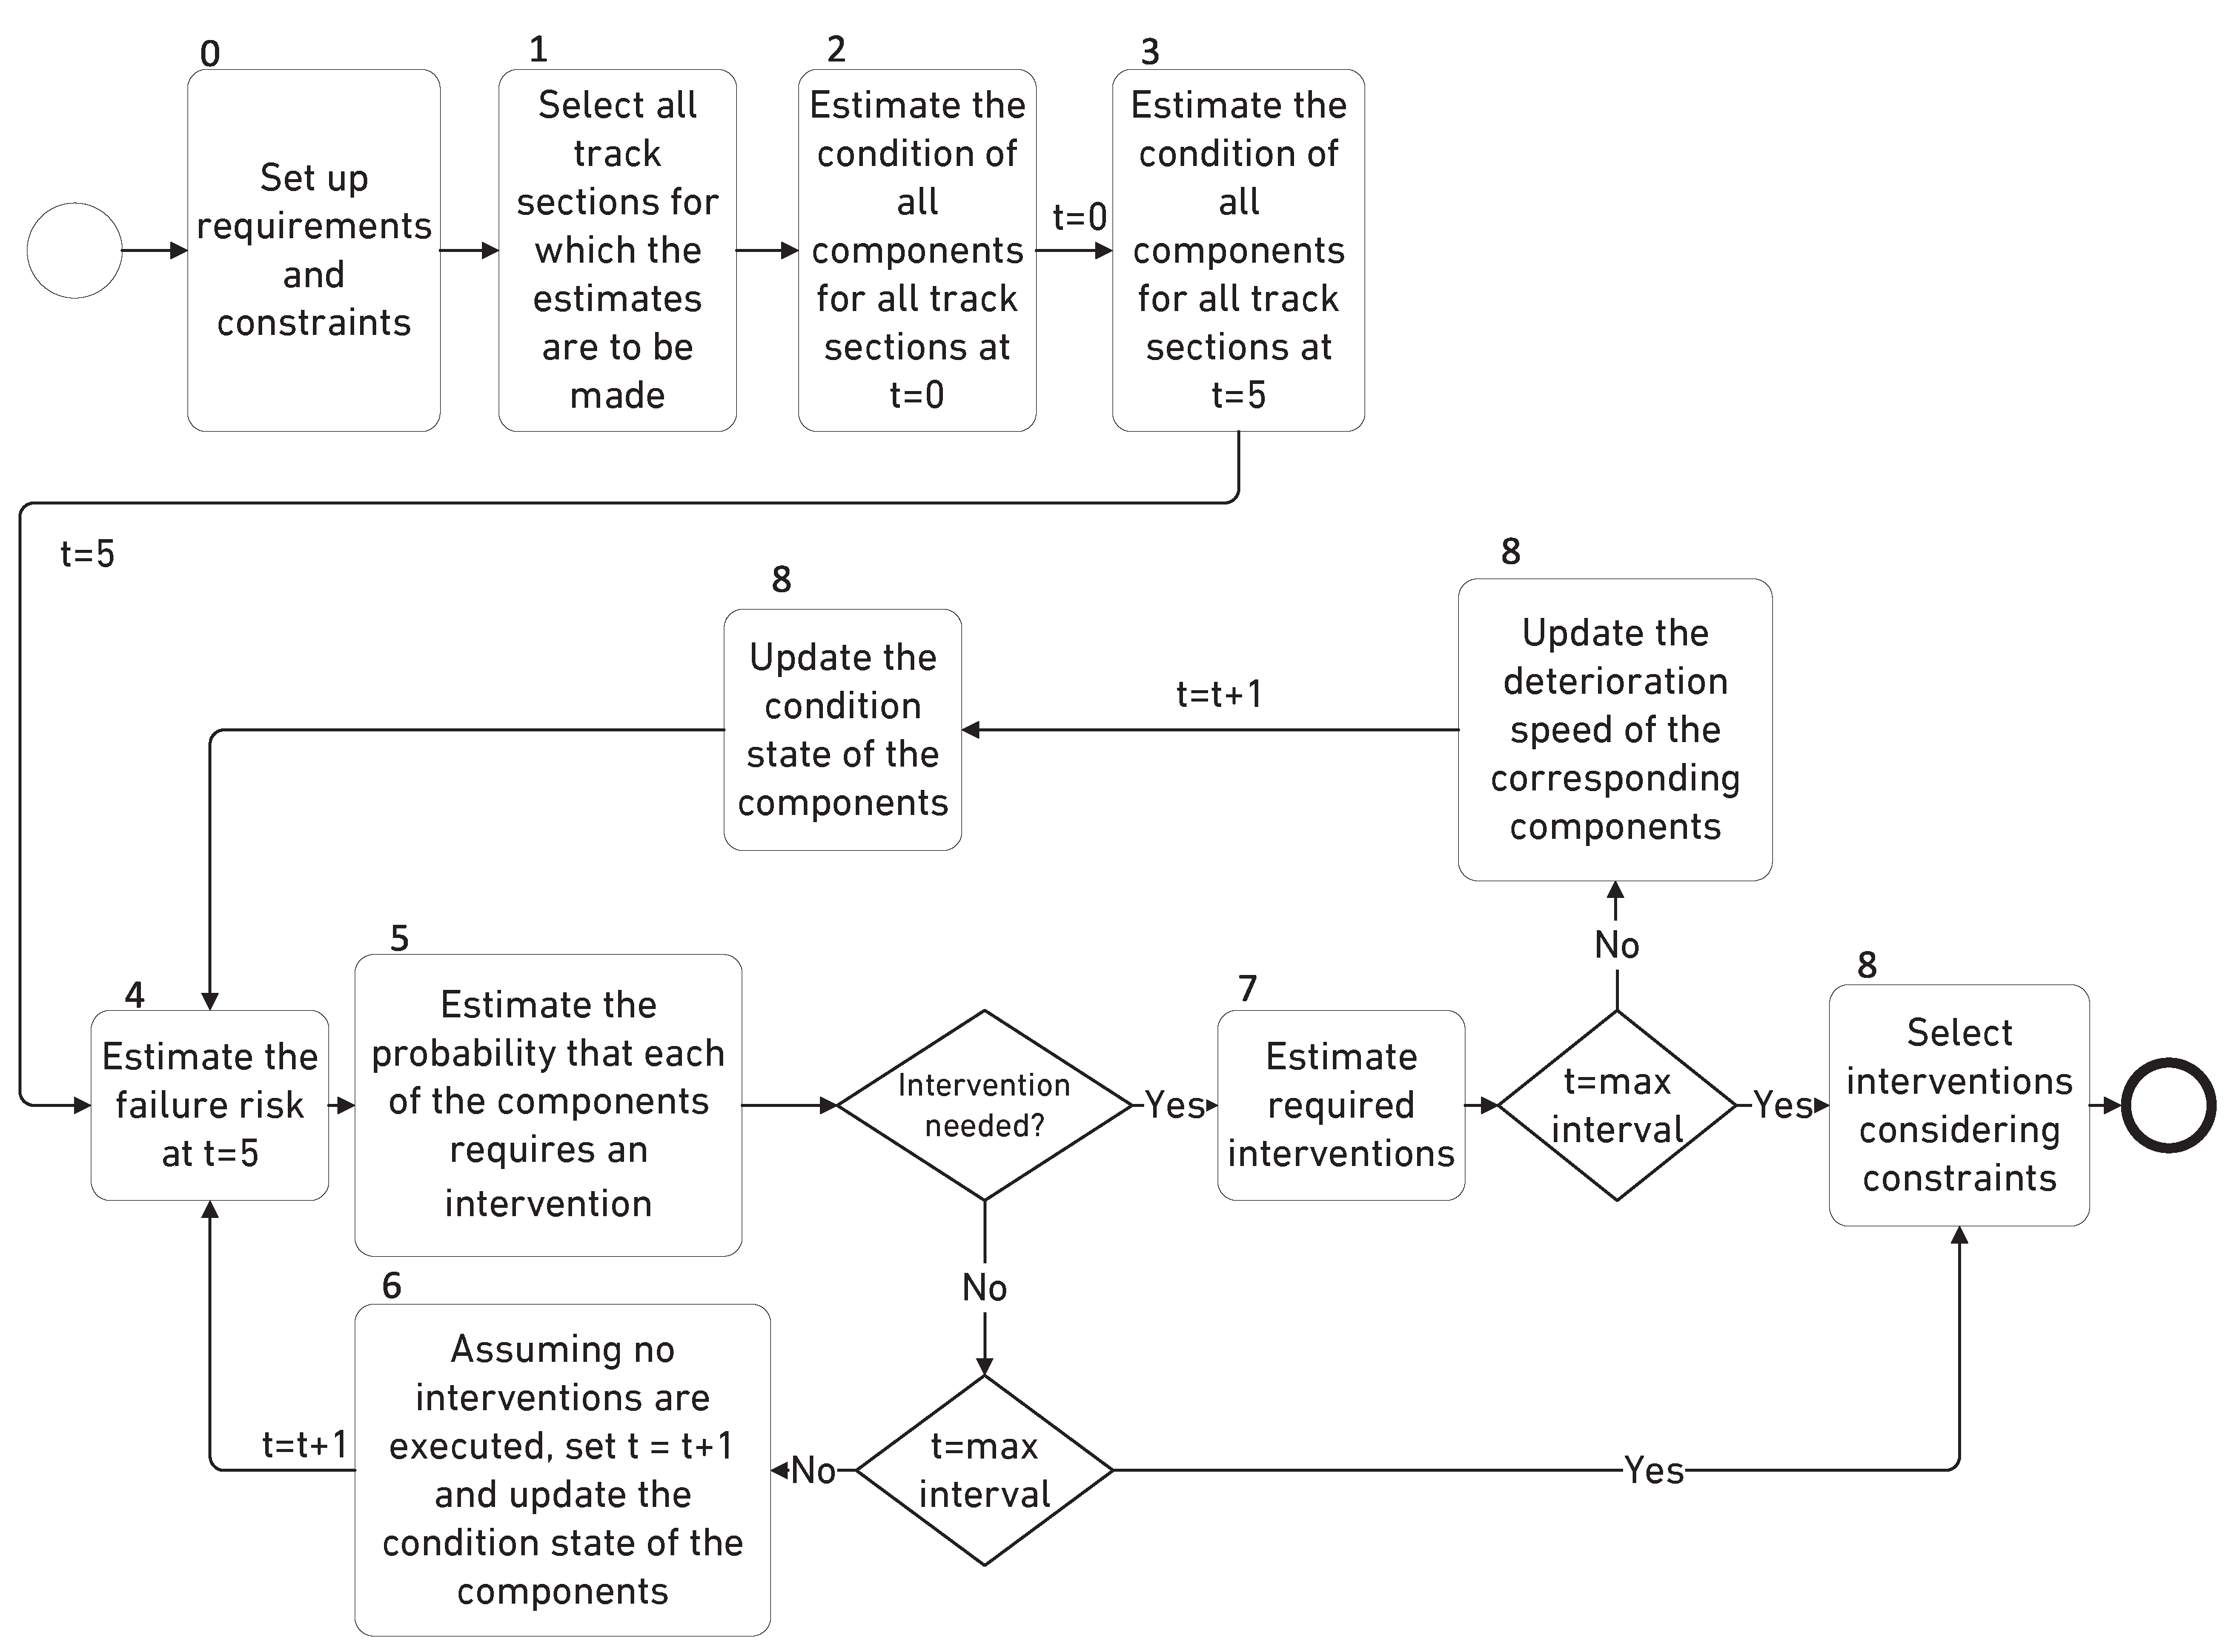
3.1. Steps
- 0.
- Set up the requirements and constraints: the requirements and constraints for initialising and using the algorithm must be set up first.
- 1.
- Select all track sections for which the estimates are to be made: the track sections that are planned to perform a detailed investigation by engineering firms must be excluded.
- 2.
- Estimate the condition of all components for all track sections at : the initial condition of all track components should be consistently estimated.
- 3.
- Estimate the condition of all components for all track sections at : based on the practice, the 15 years planning horizon is divided into the blocks of five years, wherein, all interventions between and have already been planned and almost no major changes can be made. Therefore, the beginning of the planning period is .
- 4.
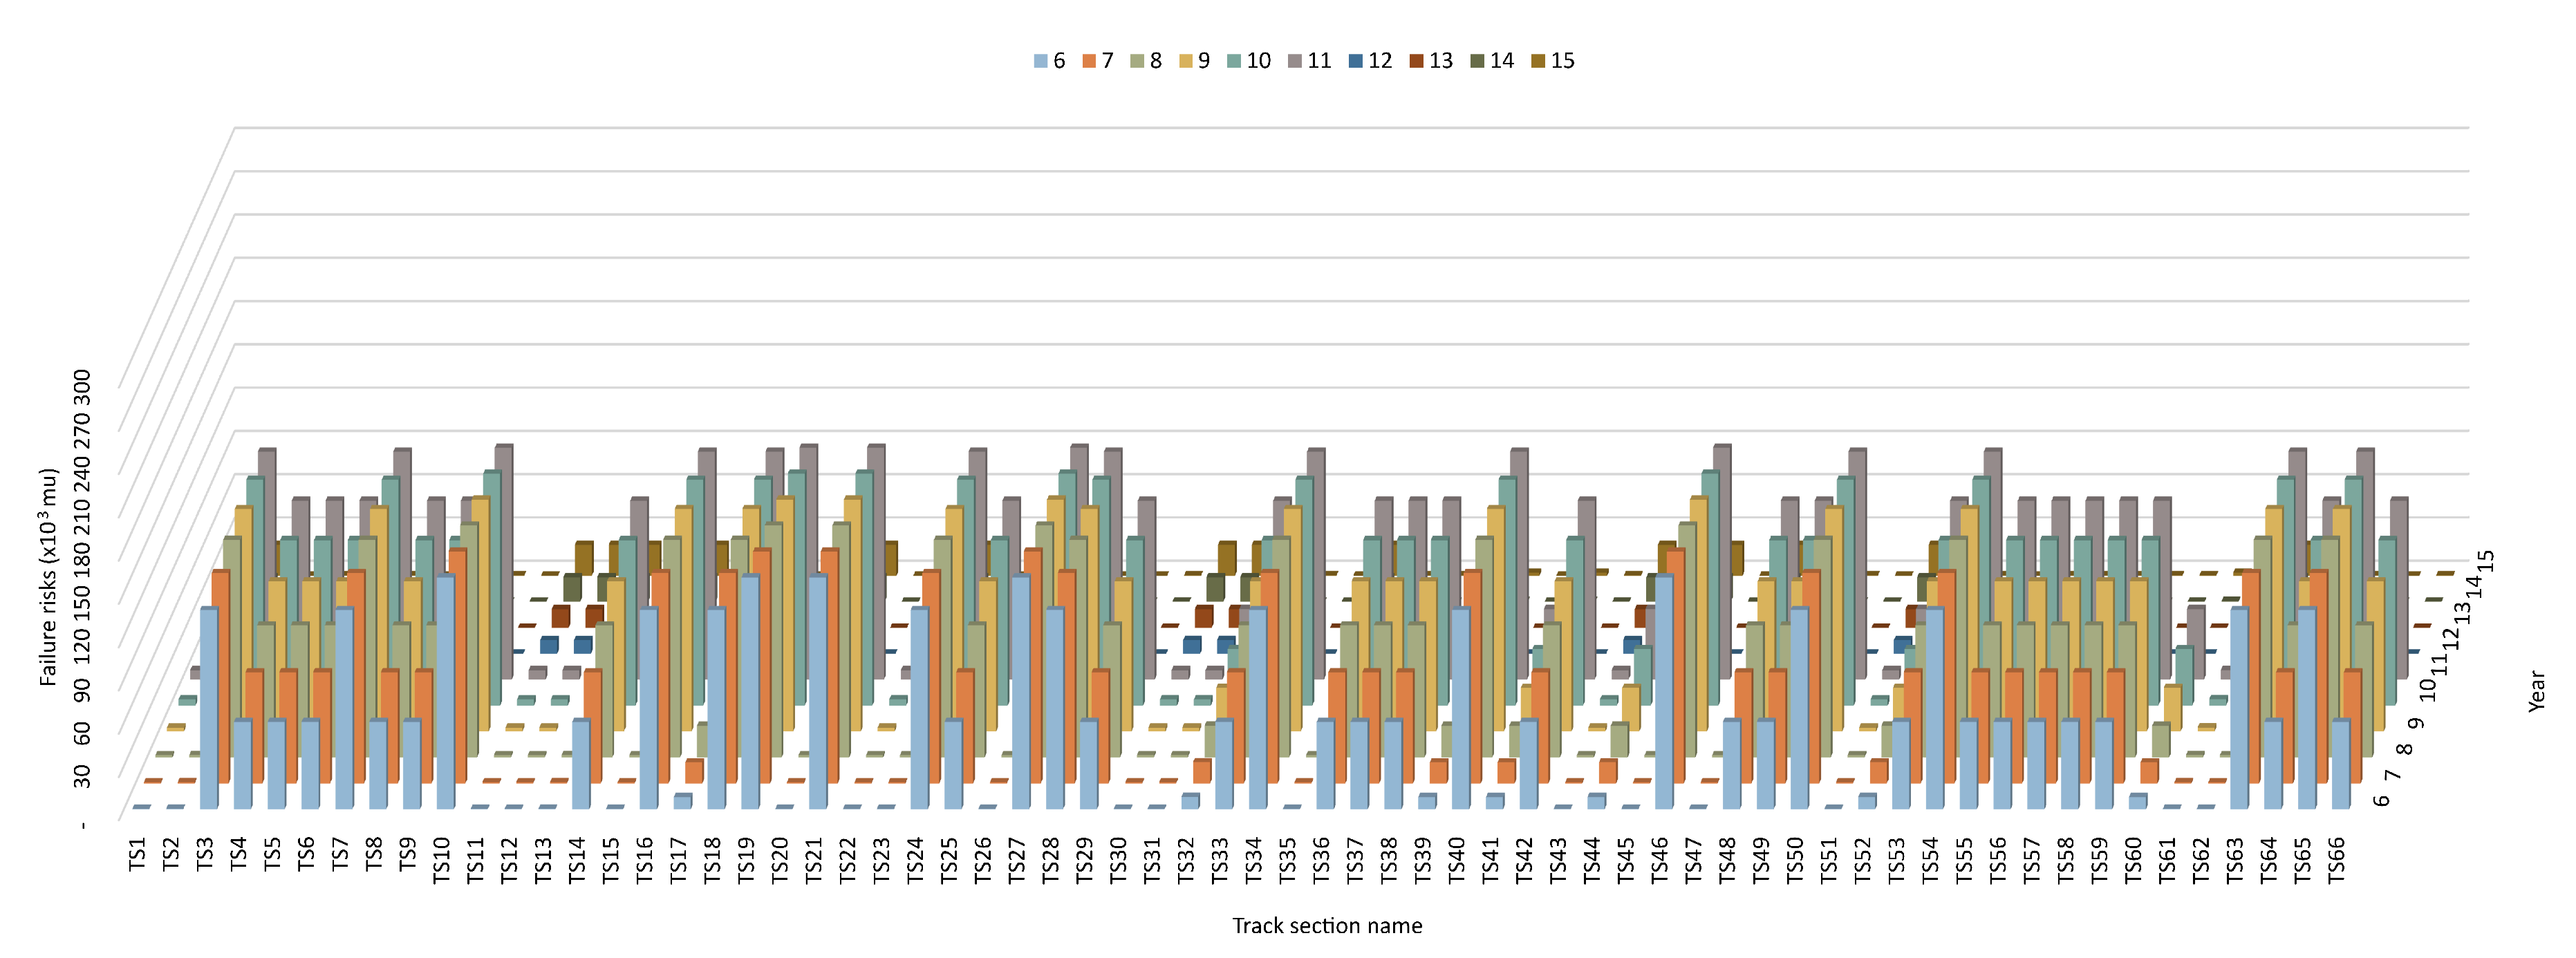
- Estimate the failure risk at : the risks associated with the occurrence of the different service loss types need to be estimated.
- 5.
- Estimate the probability that each component requires an intervention based on component-level intervention strategies: these estimates are done for the periods between and and between and .
- 6.
- If no intervention is needed, set and update the condition state of the components: repeat steps 3 to 6 until the probabilities of components requiring intervention and the failure risks have been estimated for each of the five years within each planning period.
- 7.
- Estimate the required interventions: an intervention on a track section in the upcoming planning period is required if either the probability of requiring intervention on any of its components or the failure risk in that planning period exceeds a certain threshold value. The possible and most likely types of interventions, required possession windows, and intervention costs are estimated as a function of the intervention type and service impacts.
- 8.
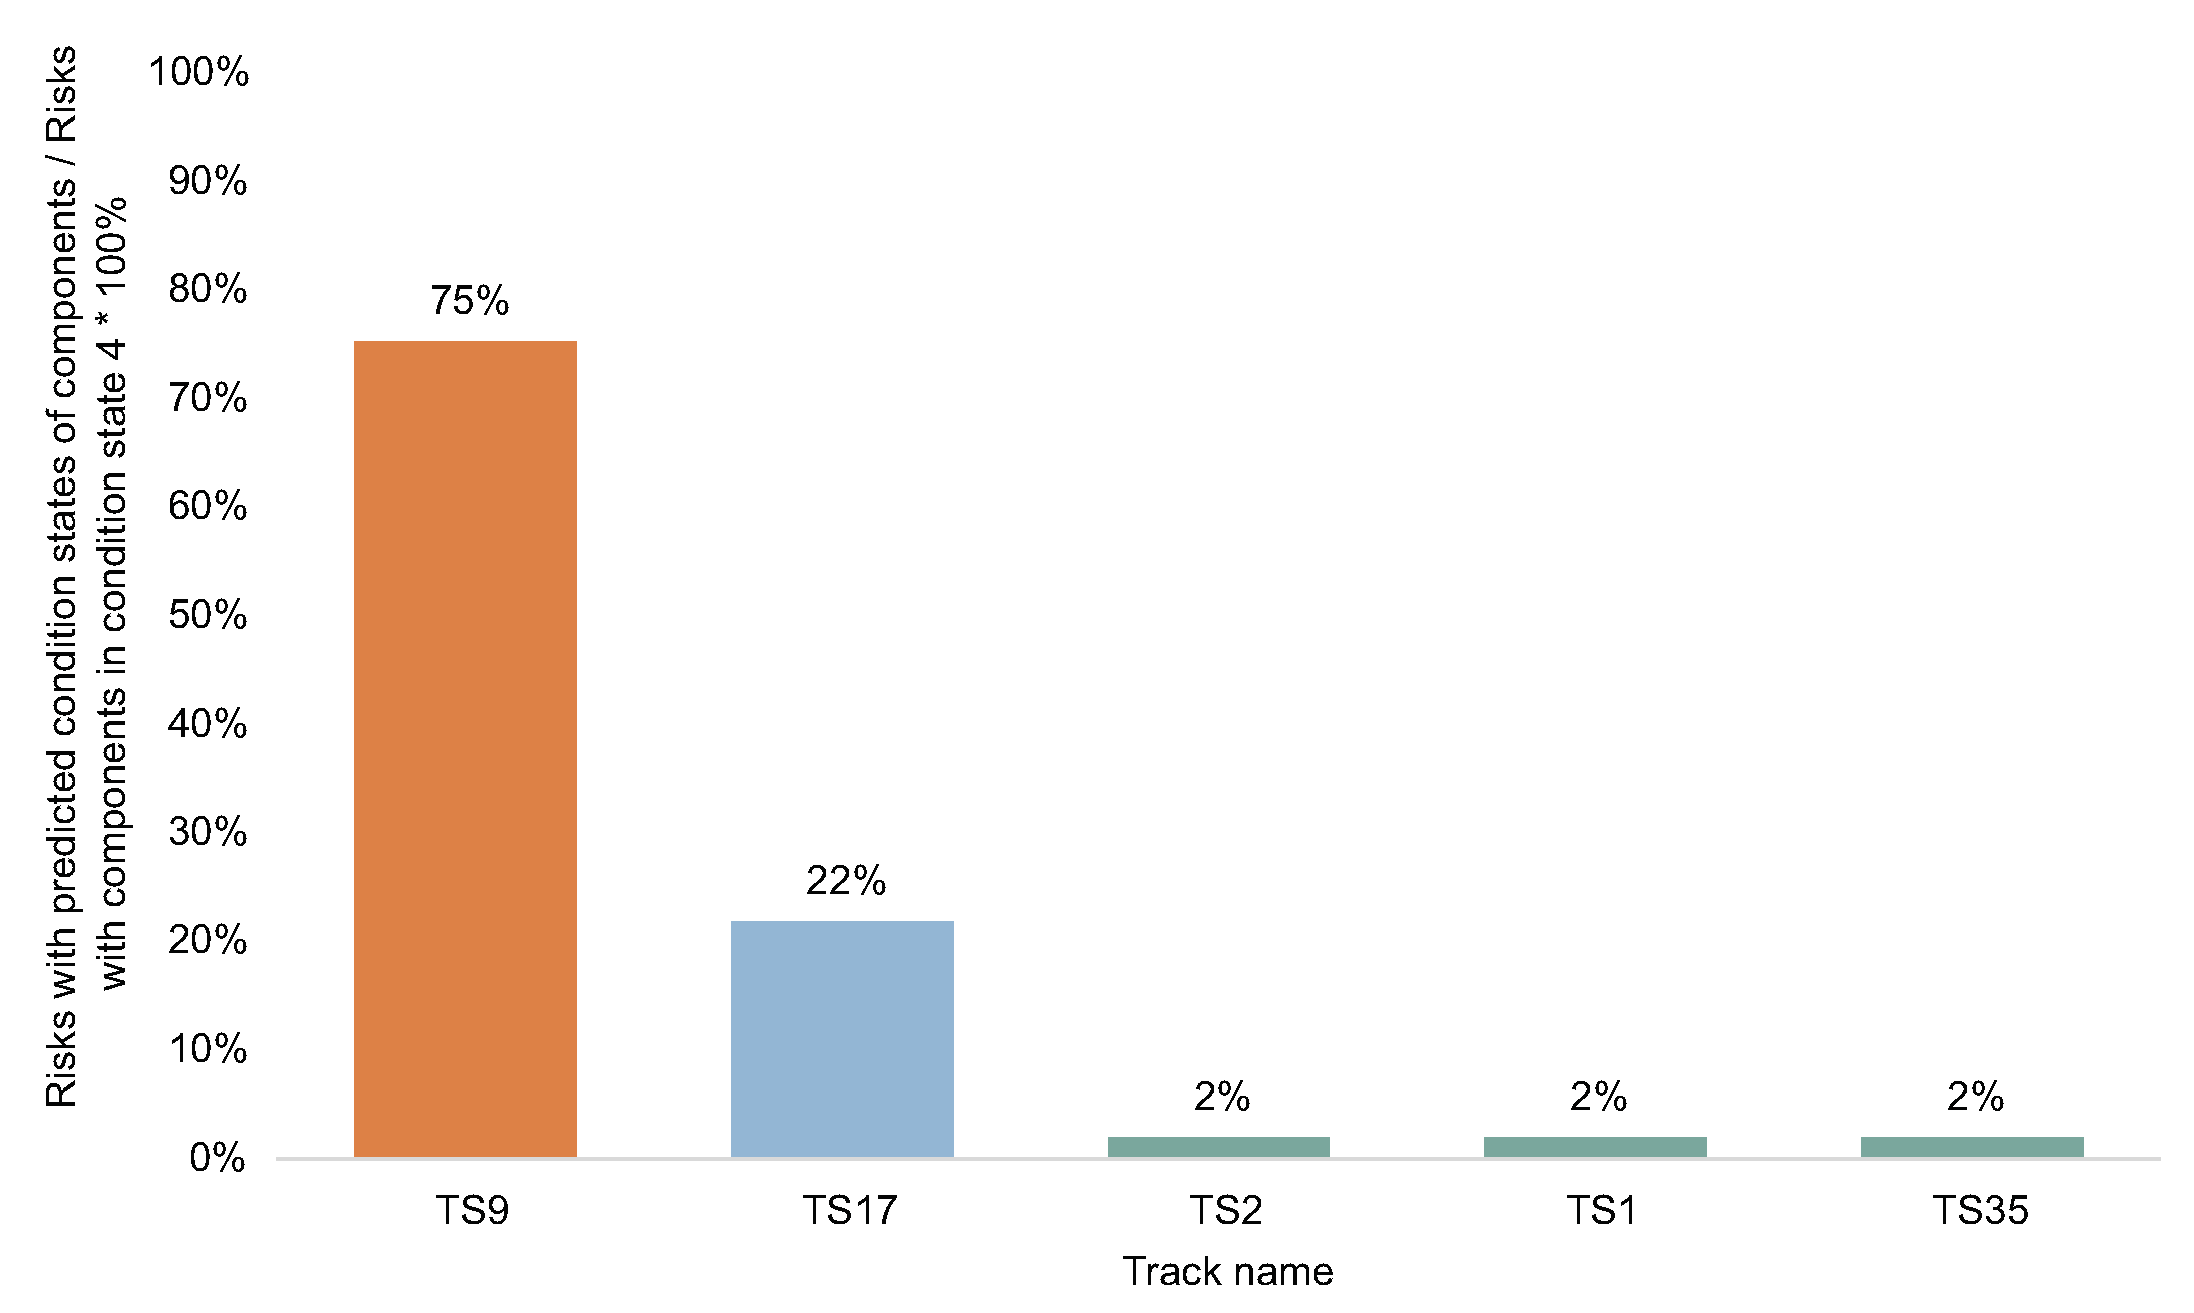
- Suggest intervention postponements: prioritize interventions based on the failure risk value if the execution of all of them is not possible within the planning period. Then, postpone the interventions associated with the lower-risk track sections until the constraints are met.
3.2. Requirements and Constraints
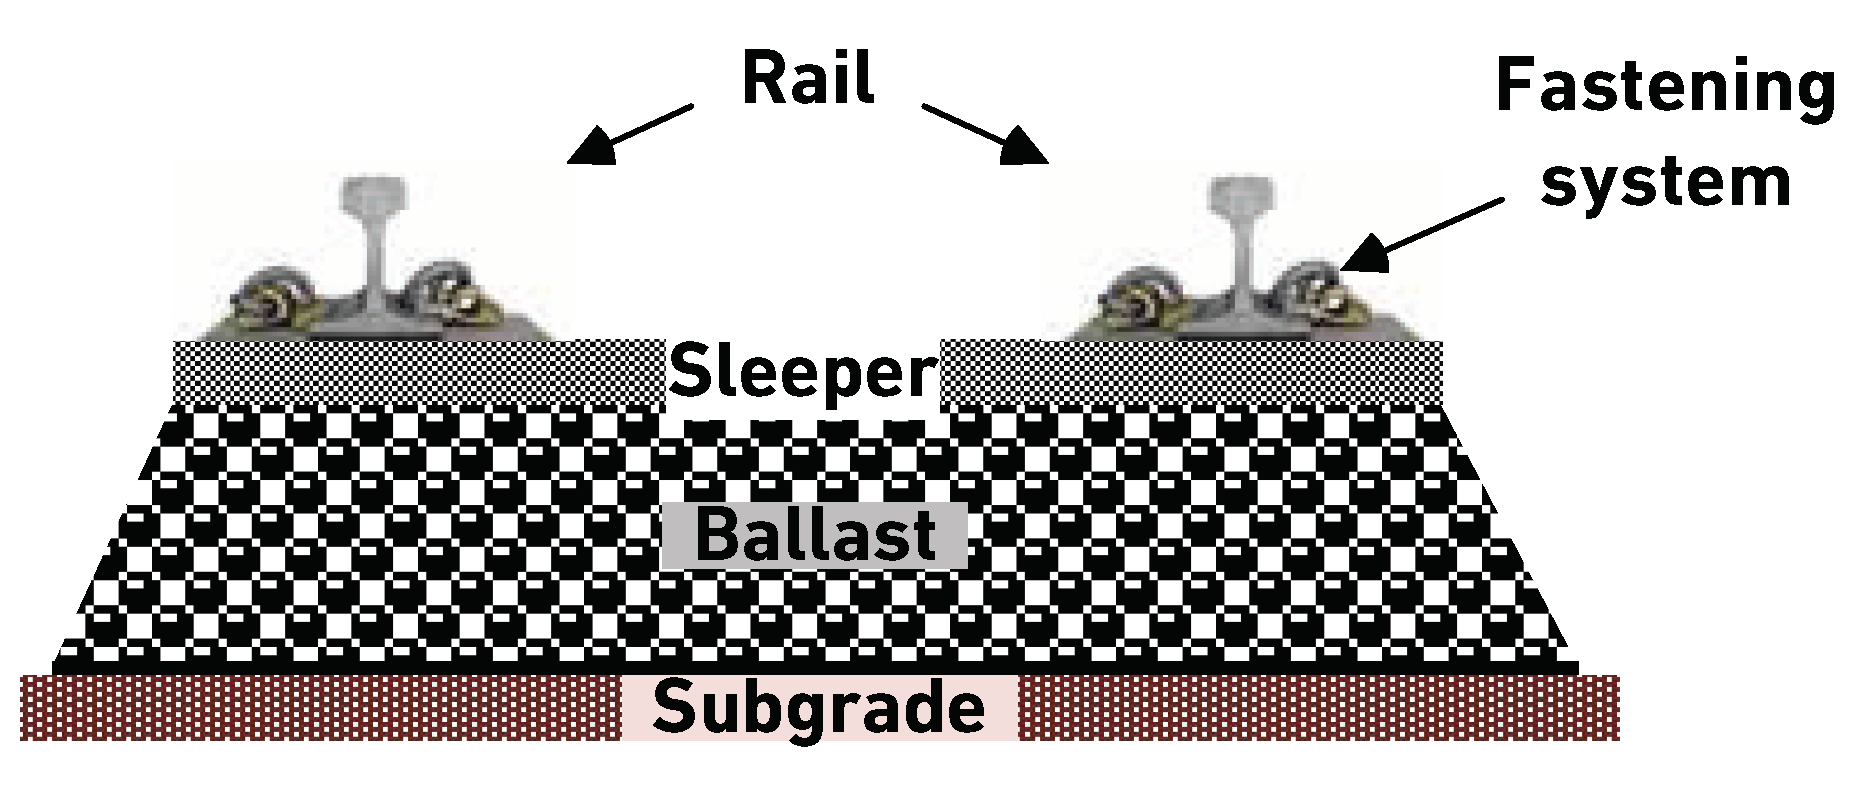
- Definition of track components: the main track components are discerned through examination of the track drawings. Subdividing the tracks into components helps provide more insight into the content of future intervention requirements. For example, knowing that the switches of a track section will require a rehabilitation intervention in 10 years and that this will require the closing of the associated track for eight hours is more useful than just knowing that the track section will require a rehabilitation intervention and being unsure if the intervention can be executed with or without closing the rail line. In addition, this allows early estimations of the costs and the possibility of executing multiple interventions simultaneously on different components of the track section. A more detailed analysis would subdivide the track sections into their elements. For example, each switch associated with a track section consists of the switching machine, toes, switch rails, fastenings, ballasts, sleepers, heels, check rail, wing rail, crossing nose, stock rail, through rail, and subgrade [40]. This is, however, not currently proposed for two reasons. First, it would increase the work required by track managers and inspectors to obtain the initial overview of the track sections, which is a major barrier to implementation. Second, it is unlikely that interventions would target single elements, and it is more likely that multiple elements of a single component would need intervention. For instance, it is more plausible for an intervention to be executed on all fastenings in a track section simultaneously, rather than targeting a single fastening element. Therefore, estimating the required interventions on the component level provides a suitable balance between the accuracy and the required time and effort in estimating the information to make estimates for all track sections in a network.
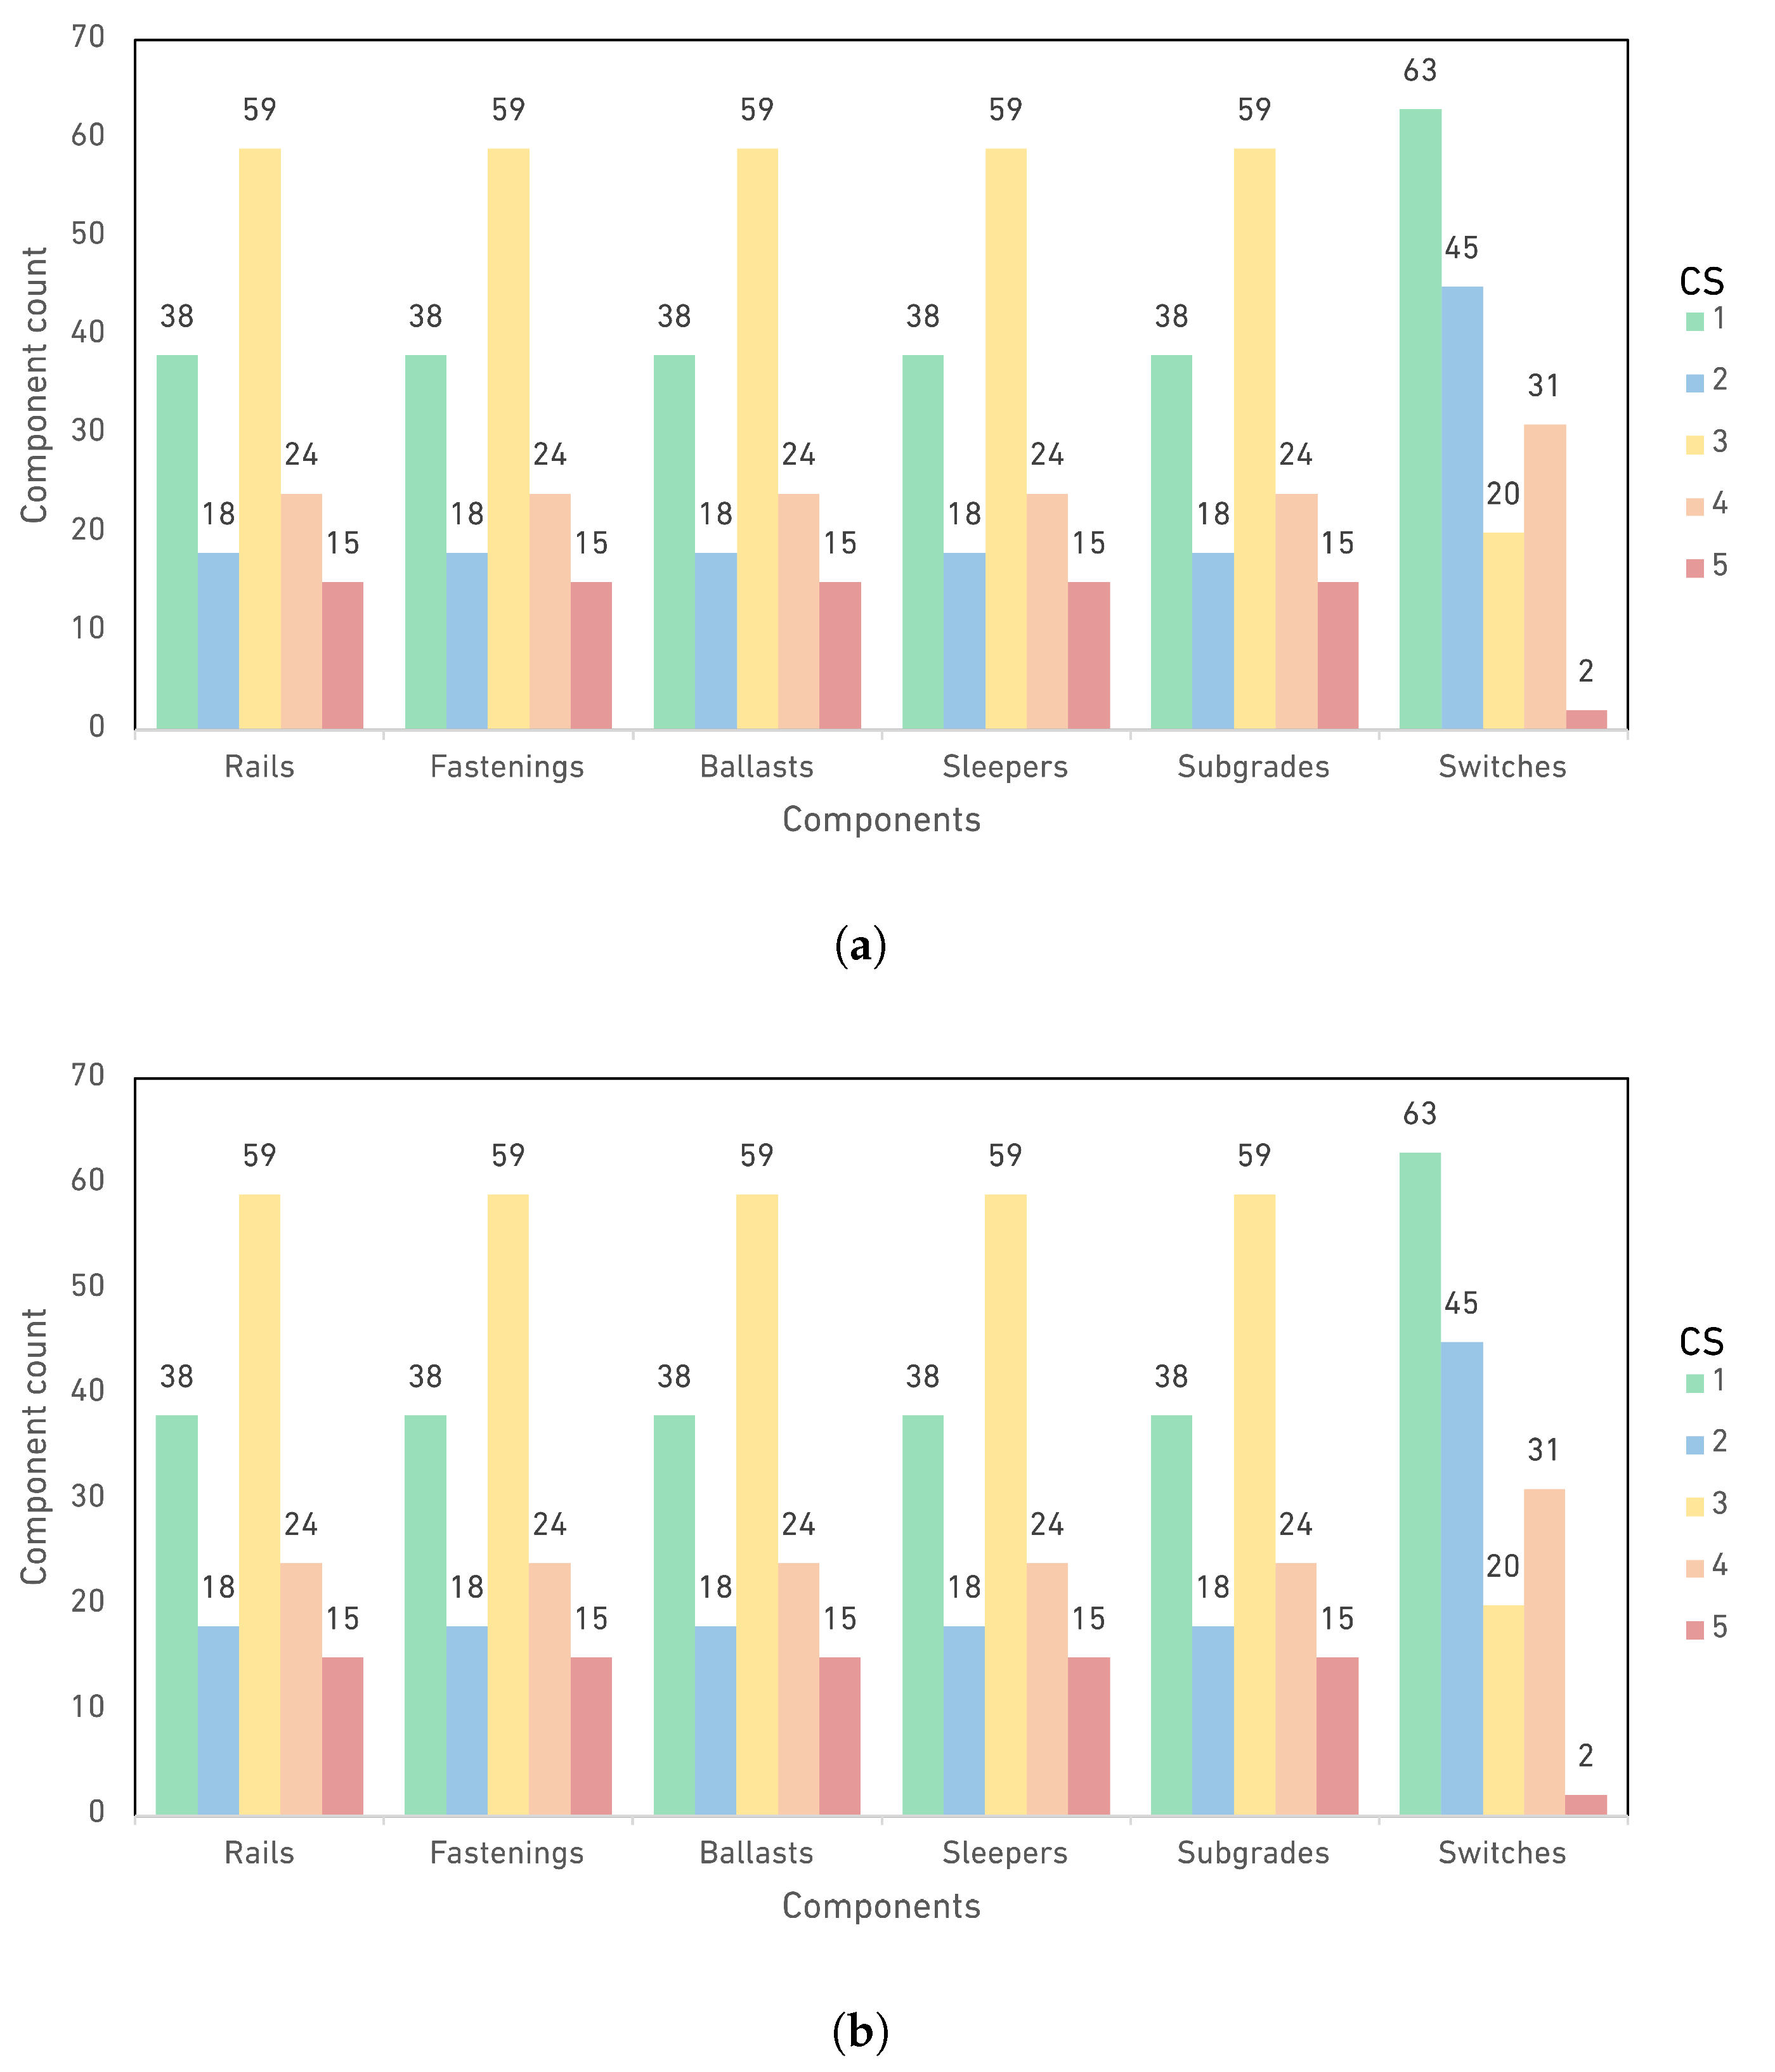
- Definition of possible condition states of track components: the condition states are defined to reflect the physical condition of the components. Different classification schemes can be used for this purpose, such as a discrete scale between 1 to 5 that is used in this manuscript to classify the condition of components. In this classification scheme, the best condition is represented by Condition State 1 (CS1) and the worst condition is represented by Condition State 5 (CS5). These definitions have to comply with the organization’s guidelines and preferences of track managers.
- Estimation of the current condition state of components: the current CS of components is estimated using existing data sources, e.g., proprietary asset condition database. If they are not explicitly estimated, the inspection reports can be used to determine the CS of the components by matching the damage indicators mentioned in the inspection reports with the definition of the CSs. In case the existing data is imperfect or if data on the condition of the components is not available, different methods such as Bayesian networks can be used to estimate the current condition of components [41].
- Estimation of the likelihood of changing states over time, i.e., transition probabilities: Estimating transition probabilities is necessary to predict the future state of components. In the absence of the condition monitoring data, these values can be estimated using expert opinion taking into account the interaction between deteriorating components and the impacts of the residual damages to the component due to imperfect execution of maintenance interventions. These values can be updated once enough information becomes available, for example, using data-driven approaches [42,43].
- Definition of possible interventions for each track component in each CS and estimation of their costs and impacts on service: the possible interventions associated with each CS for each component should include the activities to address the damage indicators mentioned in the definition of the CSs, along with the estimates of their costs and impacts on service. For example, a switch should be replaced if signs of plastic deformation are observed in the crossing nose of the switch, i.e., CS5. This intervention roughly costs 0.5 million Monetary Units (0.5Mum) and approximately takes 8 hours to complete. These interventions and estimates can be defined using expert opinion or using existing references, e.g., [44].
- Identification of the best component-level intervention strategies: these strategies provide a guideline as to the actions to be taken when a component is in a specific CS. For example, the intervention strategy for the switches could indicate that no intervention needs to be executed on the switches if they are in CS 1-4, and a replacement is needed if they are in CS5.
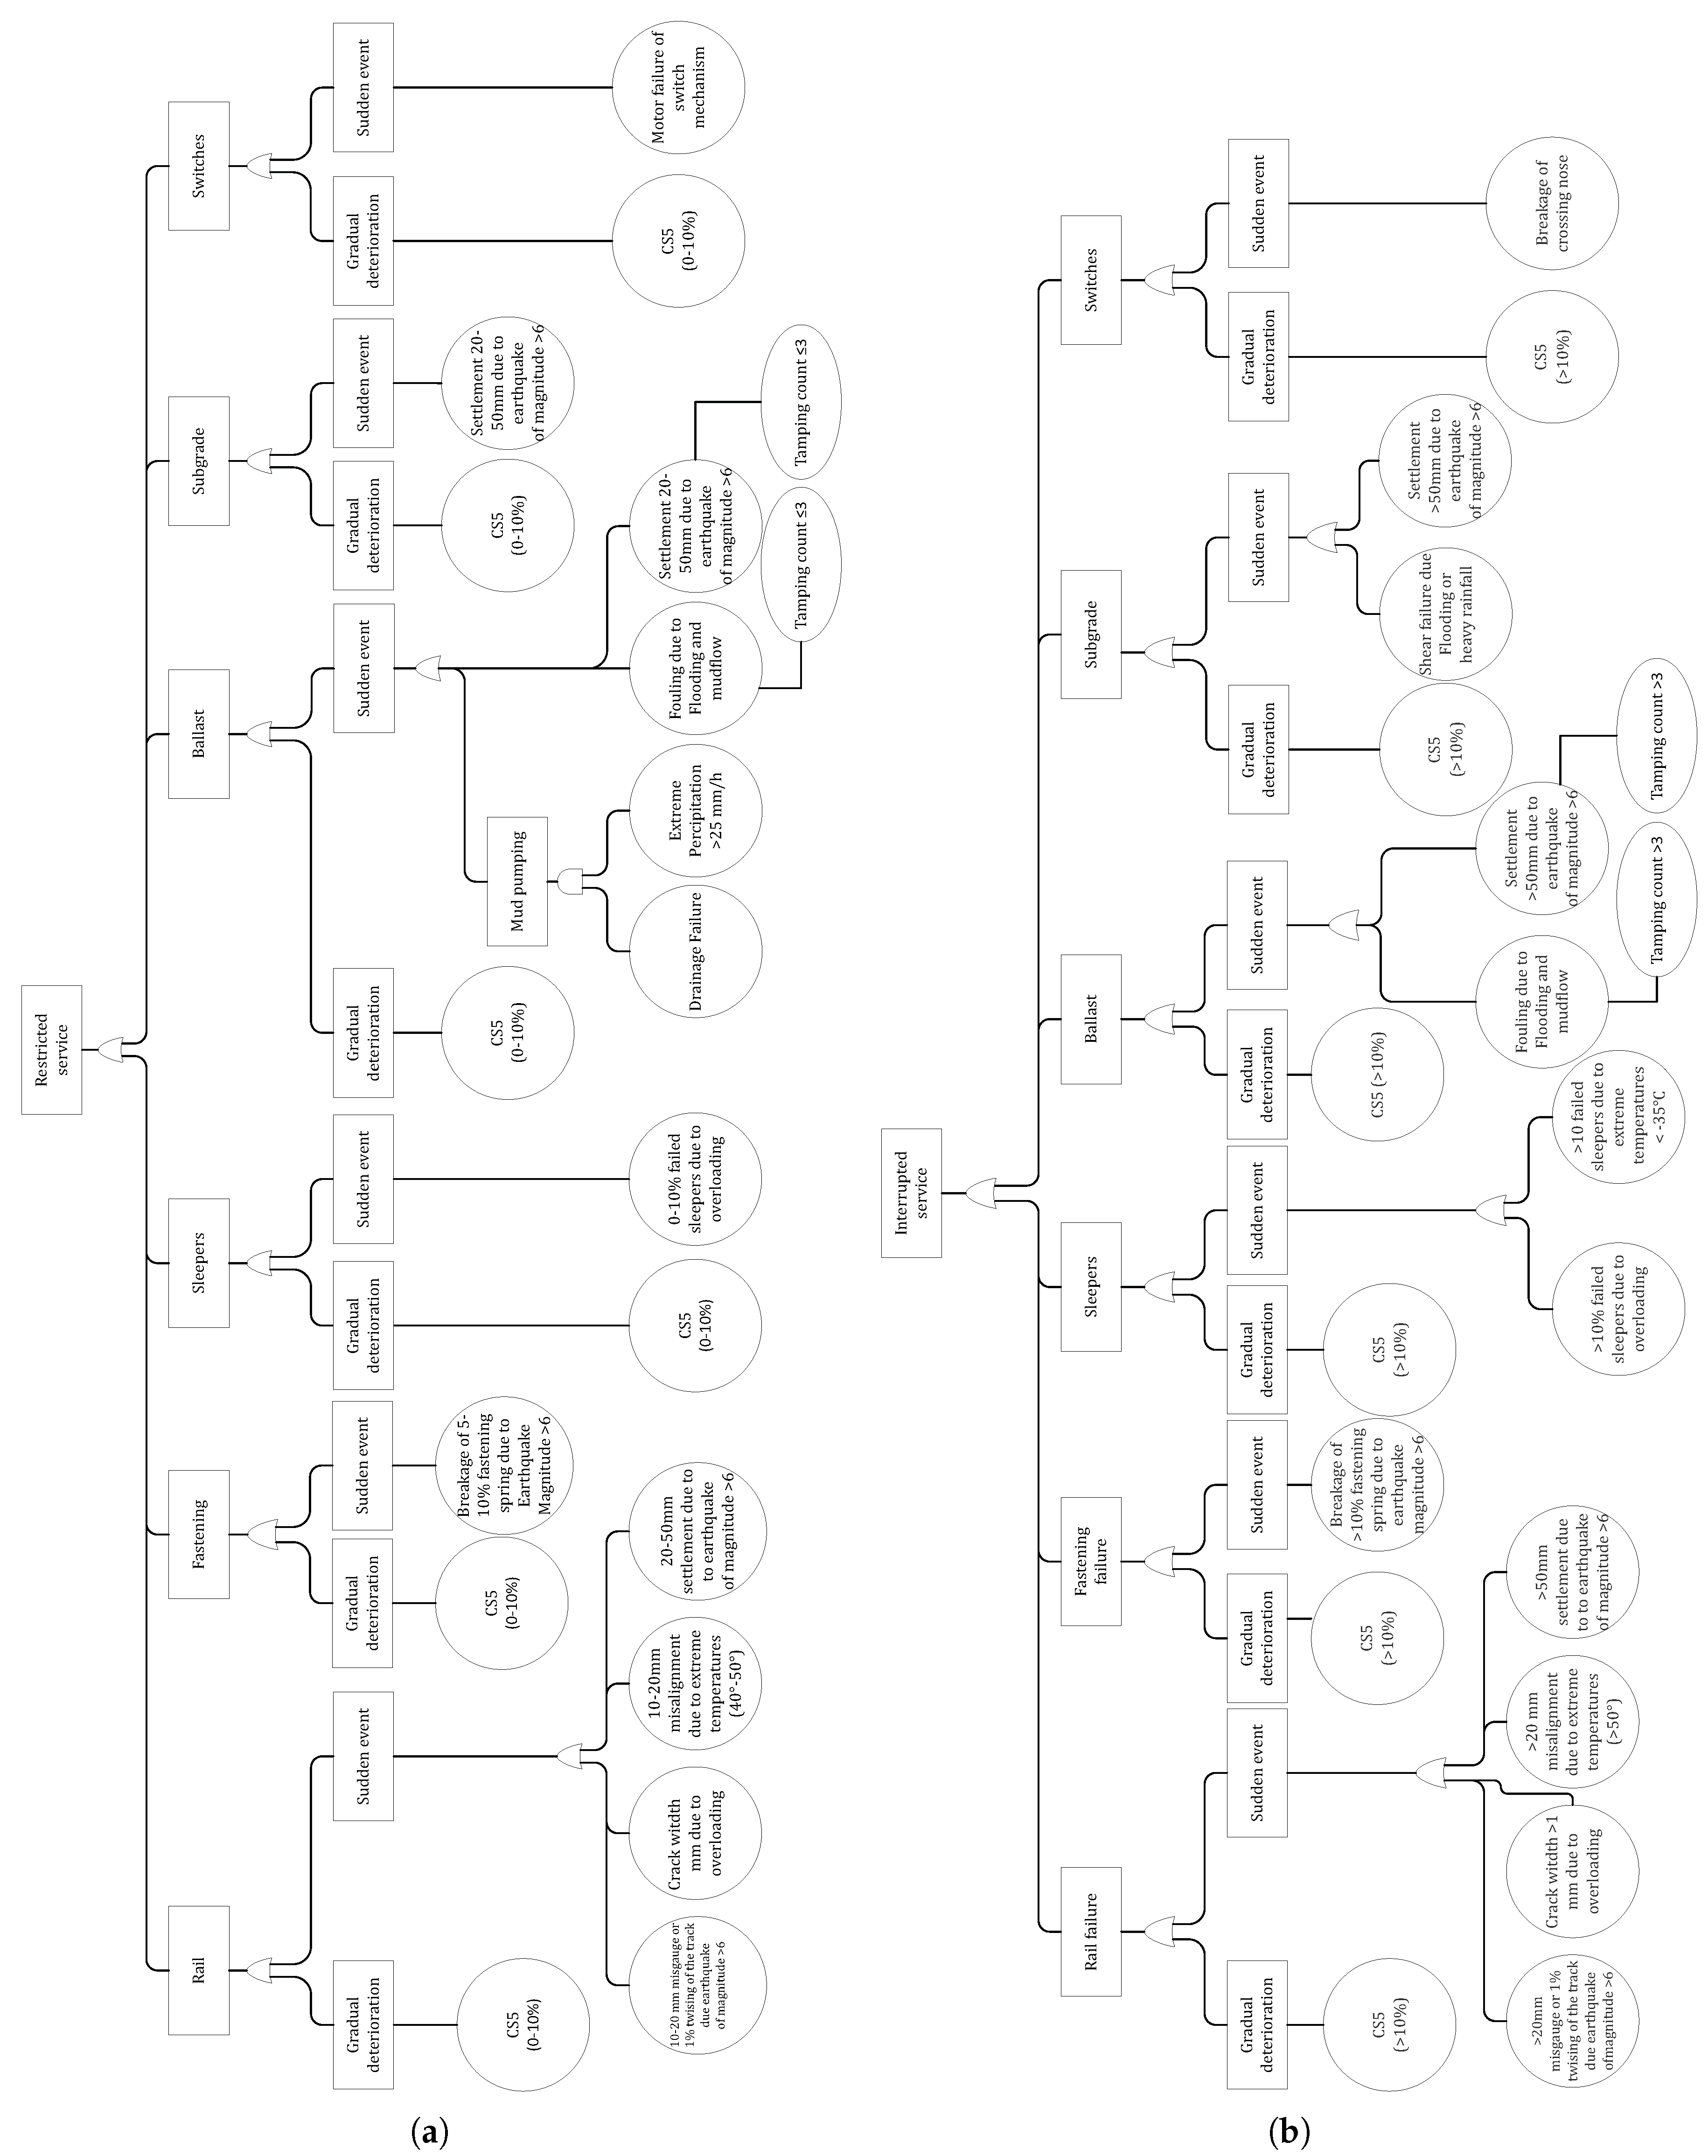
- Definition of fault trees for the track sections: fault trees can assess how each component functions individually and how they work together to ensure the provision of sufficient service on the track section. These are used to approximate the probability of a track section not providing the expected service (failure) when the components are in different CSs. These fault trees can be developed initially with an acceptable level of detail and then be updated with more sophisticated ones based on the requirements of track managers.
- Estimation of the occurrence probability of basic events: the probability of occurrence for a basic event should be correlated to the time and the evolution of components’ CS, which is likely to provide a realistic idea of how the failure risks evolve over time. For example, if a switch is in CS1, the failure probability of this switch due to the occurrence of a sever sudden event is very low (), whereas this probability is very high () if the switch is in CS5. These estimations can initially be made using expert opinion and then be updated in the future using more advanced approaches such as Finite Element Analysis done by [45,46].
- Estimation of the consequences of each failure type: the consequences related to the occurrence of each failure type, i.e., the top events, must be estimated to enable calculation of the failure risks that are dependent on the time and condition of components. For example, the estimation of consequences must encompass owner and user costs, which include expenses related to materials and equipment, traffic management, and increased travel time due to the service reduction or loss. These estimations can be made using a combination of expert opinion and construction price indices, e.g., Swiss construction pricing index [47].
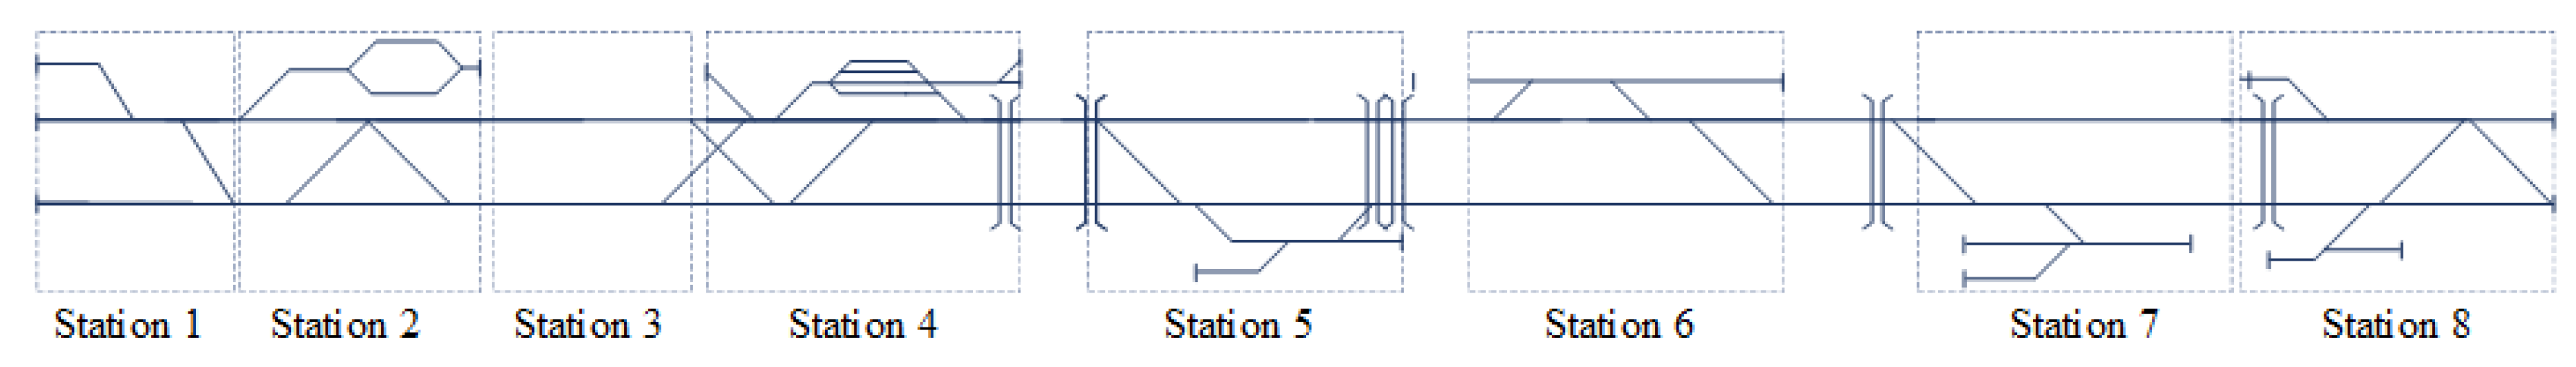
4. Case Study
4.1. Components
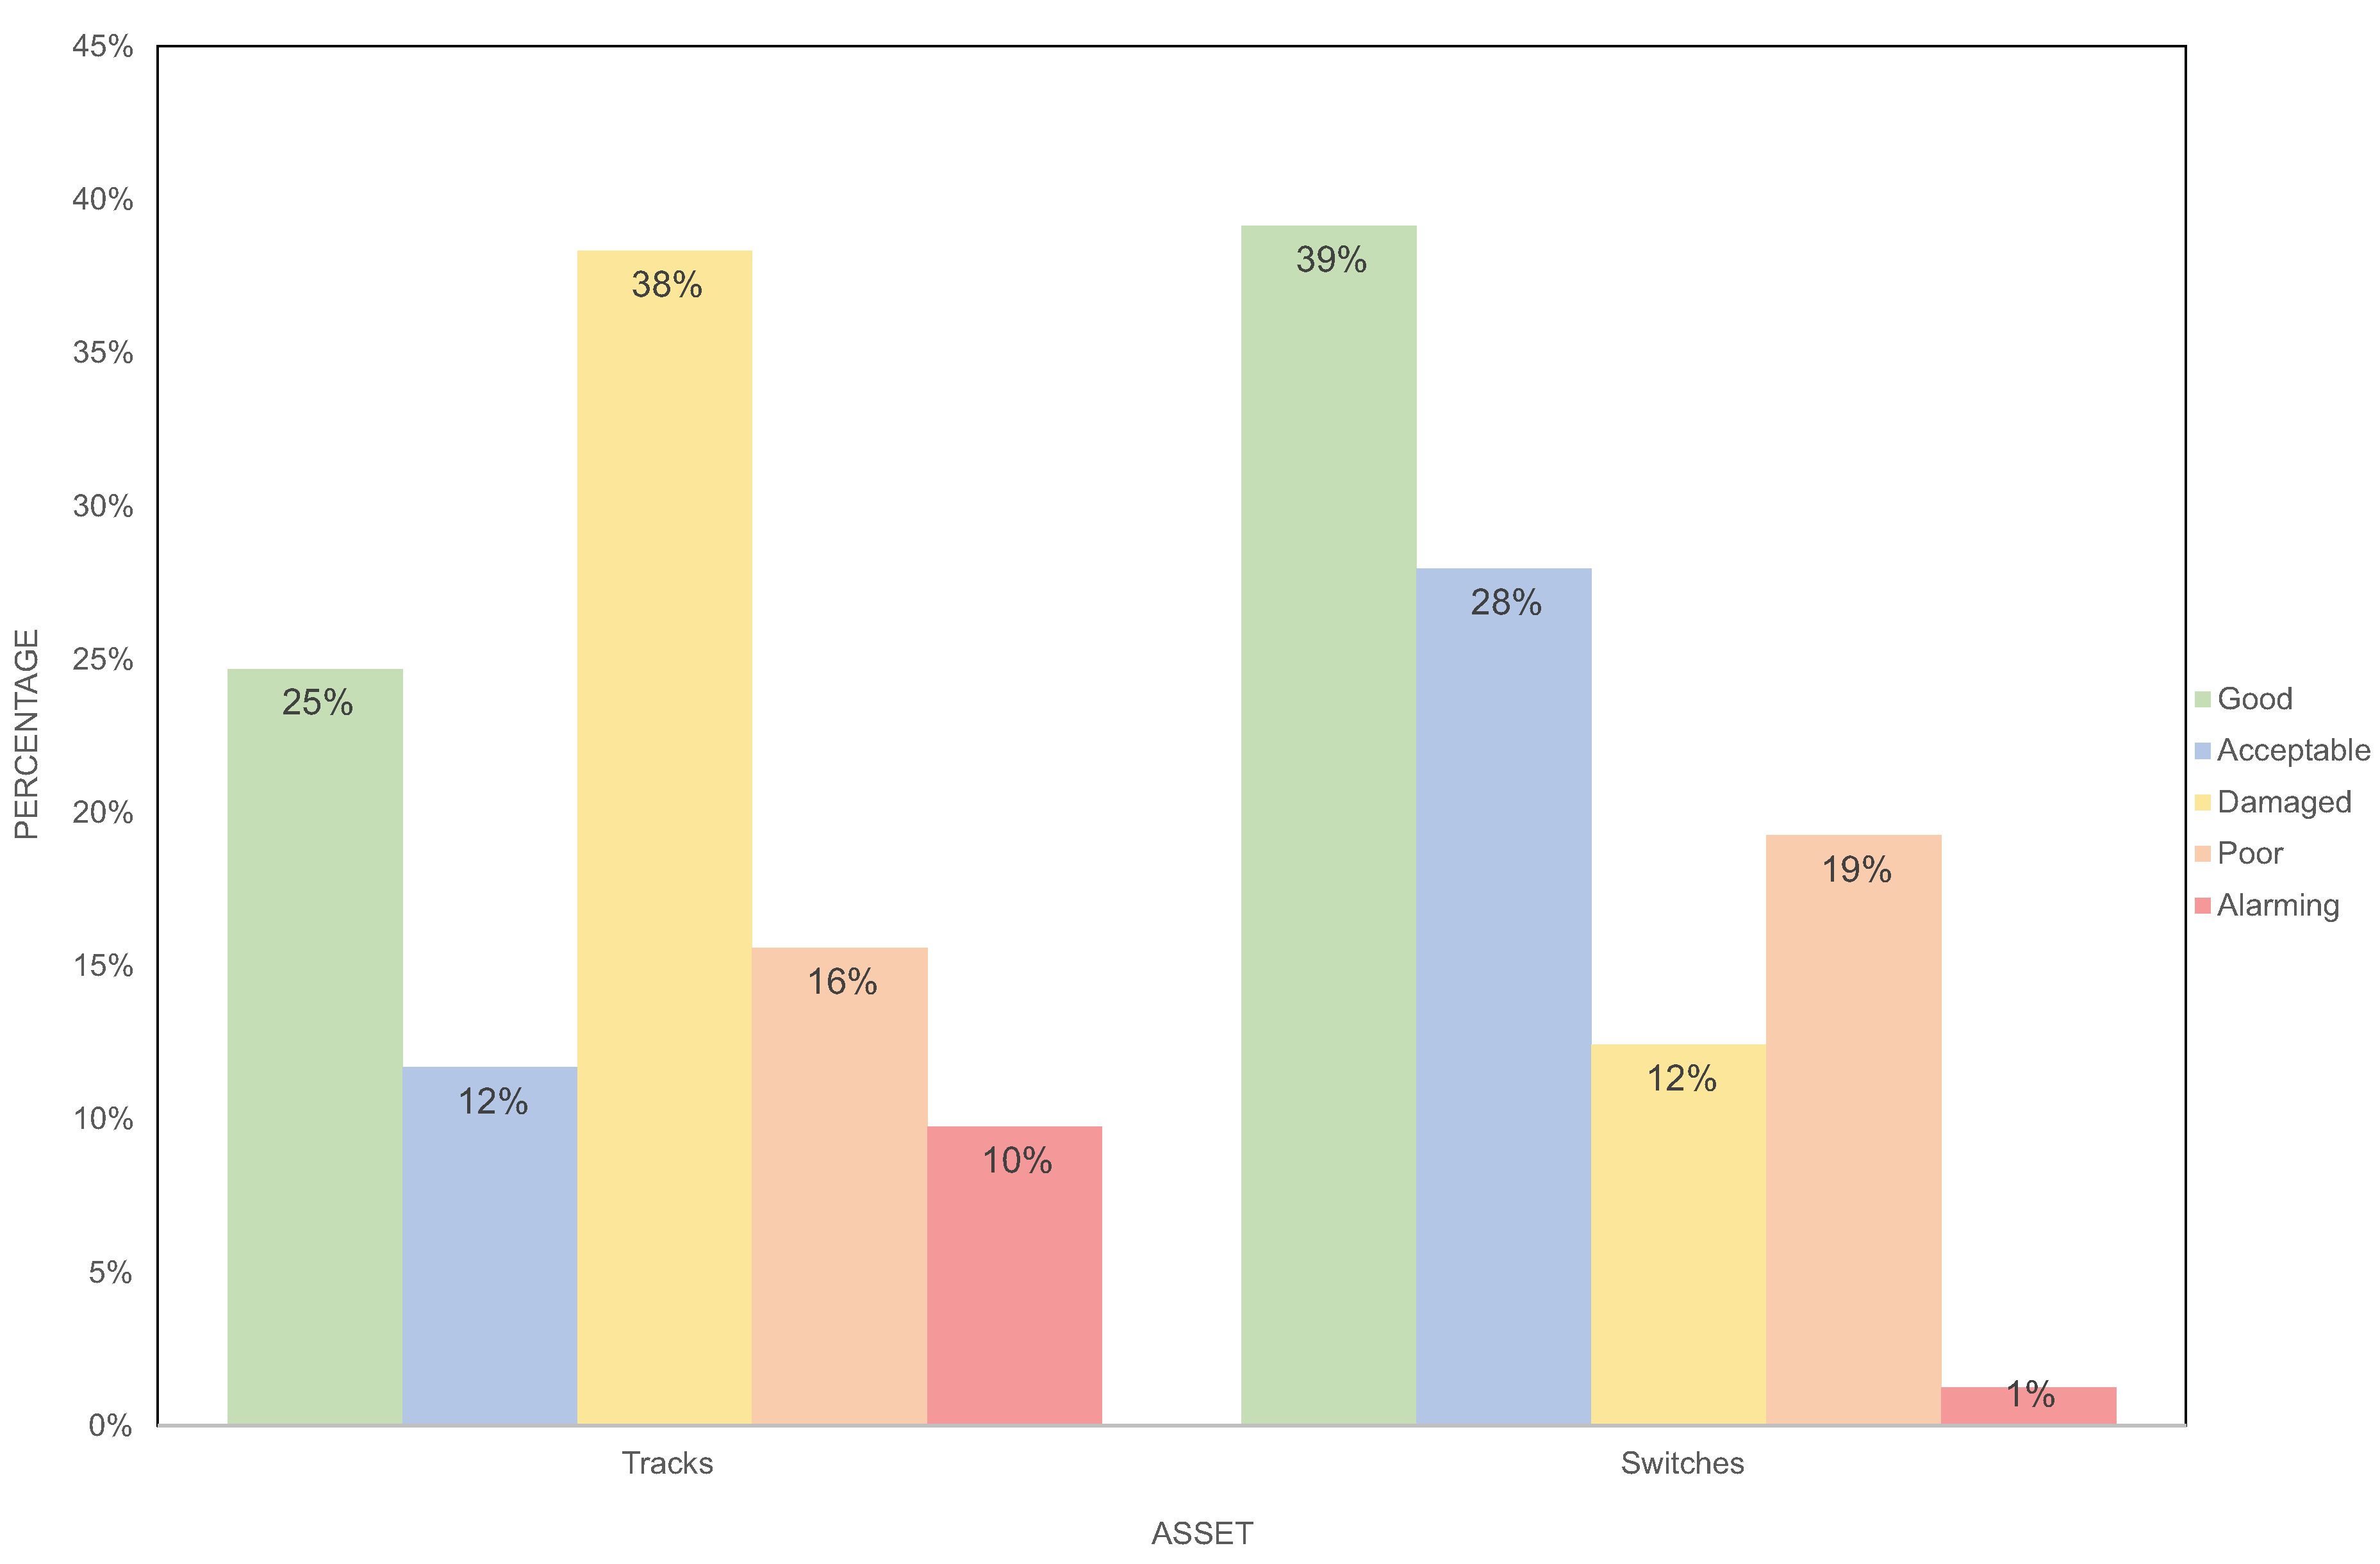
4.2. CS of the Components at and
4.3. Component-Level Interventions and Intervention Strategies
4.4. Evolution of Failure Risks
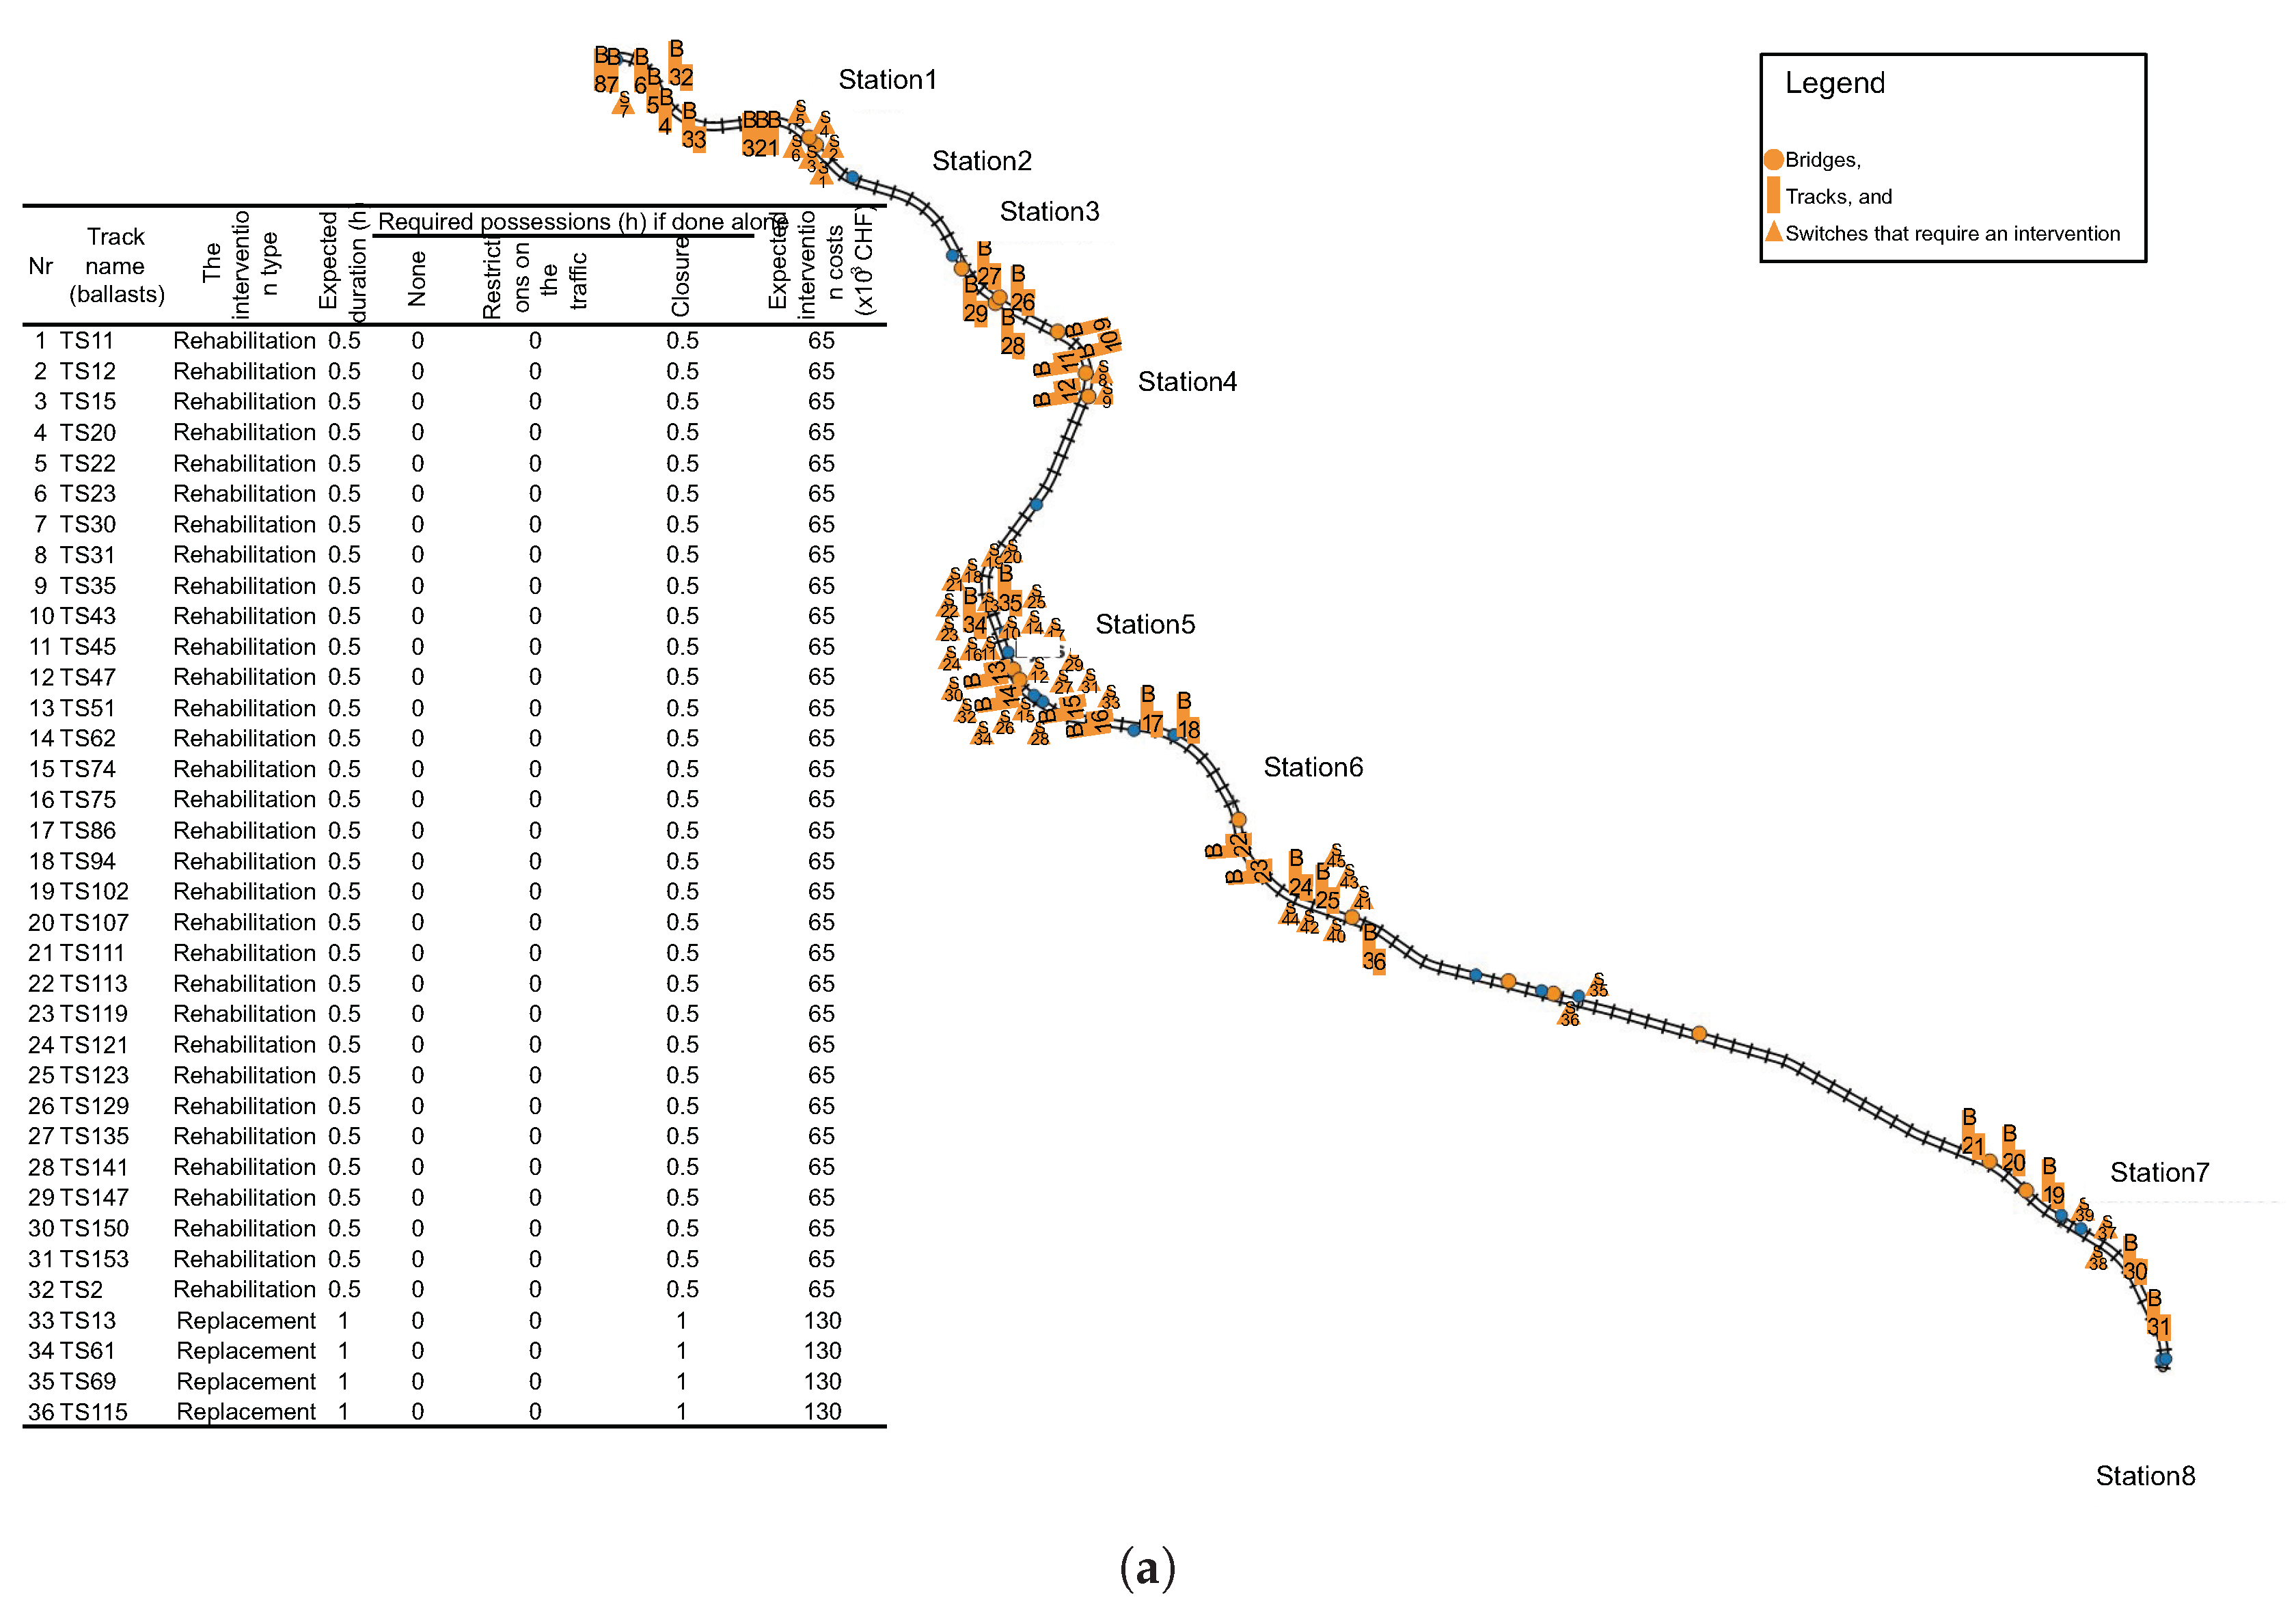
4.5. Overview of Component-Level Intervention Requirements
4.6. Prioritization of Interventions as a Function of the Failure Risk Estimates
5. Enabling the Use
6. Discussion
7. Conclusions
Author Contributions
Data Availability Statement
Acknowledgments
Conflicts of Interest
Appendix A. Bayesian Filters
References
- Adey, B.T. A road infrastructure asset management process: gains in efficiency and effectiveness. Infrastructure Asset Management 2018, 6, 2–14. [Google Scholar] [CrossRef]
- Burkhalter, M.; Adey, B.T. Required accuracy of information when determining optimal railway intervention programmes. Infrastructure Asset Management 2021, pp. 1–10. [CrossRef]
- Giunta, M.; Bressi, S.; D’Angelo, G. Life cycle cost assessment of bitumen stabilised ballast: A novel maintenance strategy for railway track-bed. Construction and Building Materials 2018, 172, 751–759. [Google Scholar] [CrossRef]
- O’Connor, K.; Wynd, B.; Cunningham, G.; MacPherson, D. Maintenance of early reinforced-concrete road bridges in Aberdeenshire, Scotland. Proceedings of the Institution of Civil Engineers: Bridge Engineering 2019, 172, 293–302. [Google Scholar] [CrossRef]
- Fecarotti, C.; Andrews, J. Optimising strategy selection for the management of railway assets. 2017.
- Fecarotti, C.; Andrews, J.D.; Pesenti, R. A mathematical programming model to select maintenance strategies in railway networks. Reliability Engineering & System Safety 2021, 216, 107940. [Google Scholar] [CrossRef]
- Calvert, G.; Neves, L.; Andrews, J.; Hamer, M. Modelling the interactions between defect mechanisms on metal bridges. Bridge Maintenance, Safety, Management, Life-Cycle Sustainability and Innovations - Proceedings of the 10th International Conference on Bridge Maintenance, Safety and Management, IABMAS 2020 2021, pp. 2743–2751. Publisher: CRC Press/Balkema ISBN: 9780429279119. [CrossRef]
- Mirzaei, Z.; Adey, B.T.; Klatter, L.; Thompson, P.D.; Klatter, L. Overview of existing Bridge Management Systems. In Proceedings of the (also presented the 7th International Conference on Bridge Maintenance, Safety and Management, IABMAS, Italy), Zurich, Switzerland, 2014. Issue: June 2014., Italy).
- Ricketts, N. Railway Bridge Maintenance, second edition ed.; ICE Publishing: London, 2017. [Google Scholar] [CrossRef]
- Lethanh, N.; Adey, B.T.; Fernando, D.N. Optimal intervention strategies for multiple objects affected by manifest and latent deterioration processes. Structure and Infrastructure Engineering 2015, 11, 389–401. [Google Scholar] [CrossRef]
- Kobayashi, K.; Kaito, K.; Lethanh, N. A competing Markov model for cracking prediction on civil structures. Transportation Research Part B: Methodological 2014, 68, 345–362. [Google Scholar] [CrossRef]
- Fecarotti, C.; Andrews, J.D. Producing effective maintenance strategies to control railway risk. Probabilistic Safety Assessment and Management PSAM 2018, 14. [Google Scholar]
- Mehranfar, H.; Adey, B.T.; Moghtadernejad, S.; Chuo, S. Automated early estimation of bridge interventions, possession windows and costs. Infrastructure Asset Management 2023, pp. 1–13. Publisher: ICE Publishing. [CrossRef]
- Kaewunruen, S.; Osman, M.H.; Hao Cheng Eric, W. Risk-Based Maintenance Planning for Rail Fastening Systems. ASCE-ASME Journal of Risk and Uncertainty in Engineering Systems, Part A: Civil Engineering 2019, 5, 04019007. [Google Scholar] [CrossRef]
- Mahmoud, H.; Zafar, A. Time-Dependent Reliability Analysis of Reinforced-Concrete Bridges Including Deterioration Effects. In Proceedings of the Geotechnical and Structural Engineering Congress 2016 - Proceedings of the Joint Geotechnical and Structural Engineering Congress 2016, Phoenix, Arizona, 2016. [CrossRef]
- Adey, B.T.; Hajdin, R. Methodology for determination of financial needs of gradually deteriorating bridges with only structure level data. Structure and Infrastructure Engineering 2011, 7, 645–660. [Google Scholar] [CrossRef]
- Allah Bukhsh, Z.; Stipanovic, I.; Doree, A.G. Multi-year maintenance planning framework using multi-attribute utility theory and genetic algorithms. European Transport Research Review 2020, 12, 3. [Google Scholar] [CrossRef]
- Bressi, S.; Santos, J.; Losa, M. Optimization of maintenance strategies for railway track-bed considering probabilistic degradation models and different reliability levels. Reliability Engineering & System Safety 2021, 207, 107359. [Google Scholar] [CrossRef]
- Chiachío, J.; Chiachío, M.; Prescott, D.; Andrews, J.D. A knowledge-based prognostics framework for railway track geometry degradation. Reliability Engineering & System Safety 2019, 181, 127–141. [Google Scholar] [CrossRef]
- Consilvio, A.; Vignola, G.; López Arévalo, P.; Gallo, F.; Borinato, M.; Crovetto, C. A data-driven prioritisation framework to mitigate maintenance impact on passengers during metro line operation. European Transport Research Review 2024, 16, 6. [Google Scholar] [CrossRef]
- Fecarotti, C.; Andrews, J. A Petri net approach to assess the effects of railway maintenance on track availability. Infrastructure Asset Management 2020, 7, 201–220. [Google Scholar] [CrossRef]
- Hidirov, S.; Guler, H. Reliability, availability and maintainability analyses for railway infrastructure management. Structure and Infrastructure Engineering 2019, 15, 1221–1233. [Google Scholar] [CrossRef]
- Irfan, M.; Khurshid, M.B.; Iqbal, S.; Khan, A. Framework for airfield pavements management—an approach based on cost-effectiveness analysis. European Transport Research Review 2015, 7, 1–14. [Google Scholar] [CrossRef]
- Le, B.; Andrews, J.D.; Fecarotti, C. A Petri net model for railway bridge maintenance:. http://dx.doi.org/10.1177/1748006X17701667 2017, 231, 306–323. Publisher: SAGE PublicationsSage UK: London, England. [CrossRef]
- Papathanasiou, N.; Adey, B.T. Making Comparable Risk Estimates for Railway Assets of Different Types. Infrastructure Asset Management 2020, (accepted).
- Prescott, D.; Andrews, J. Investigating railway track asset management using a Markov analysis. Proceedings of the Institution of Mechanical Engineers, Part F: Journal of Rail and Rapid Transit 2015, 229, 402–416. [Google Scholar] [CrossRef]
- Prescott, D.; Andrews, J. A track ballast maintenance and inspection model for a rail network. Proceedings of the Institution of Mechanical Engineers, Part O: Journal of Risk and Reliability 2013, 227, 251–266. [Google Scholar] [CrossRef]
- Rúa, E.; Comesaña-Cebral, L.; Arias, P.; Martínez-Sánchez, J. A top-down approach for a multi-scale identification of risk areas in infrastructures: particularization in a case study on road safety. European Transport Research Review 2022, 14, 39. [Google Scholar] [CrossRef]
- Sadeghi, J.; Motieyan-Najar, M.E.; Zakeri, J.A.; Yousefi, B.; Mollazadeh, M. Improvement of railway ballast maintenance approach, incorporating ballast geometry and fouling conditions. Journal of Applied Geophysics 2018, 151, 263–273. [Google Scholar] [CrossRef]
- Sancho, L.C.B.; Braga, J.A.P.; Andrade, A.R. Optimizing Maintenance Decision in Rails: A Markov Decision Process Approach. ASCE-ASME Journal of Risk and Uncertainty in Engineering Systems, Part A: Civil Engineering 2021, 7, 04020051. [Google Scholar] [CrossRef]
- Sasidharan, M.; Burrow, M.P.; Ghataora, G.S. A whole life cycle approach under uncertainty for economically justifiable ballasted railway track maintenance. Research in Transportation Economics 2020, 80, 100815. [Google Scholar] [CrossRef]
- Sharma, S.; Cui, Y.; He, Q.; Mohammadi, R.; Li, Z. Data-driven optimization of railway maintenance for track geometry. Transportation Research Part C: Emerging Technologies 2018, 90, 34–58. [Google Scholar] [CrossRef]
- Soleimanmeigouni, I.; Ahmadi, A.; Nissen, A.; Xiao, X. Prediction of railway track geometry defects: a case study. Structure and Infrastructure Engineering 2020, 16, 987–1001. [Google Scholar] [CrossRef]
- Sresakoolchai, J.; Kaewunruen, S. Railway infrastructure maintenance efficiency improvement using deep reinforcement learning integrated with digital twin based on track geometry and component defects. Scientific Reports 2023 13:1 2023, 13, 1–16. [Google Scholar] [CrossRef]
- Usman, K.; Burrow, M.; Ghataora, G. Railway track subgrade failure mechanisms using a fault chart approach. Procedia Engineering 2015, 125, 547–555. [Google Scholar] [CrossRef]
- Usman, K.; Burrow, M.P.N.; Ghataora, G.S.; Sasidharan, M. Using Probabilistic Fault Tree Analysis and Monte Carlo Simulation to Examine the Likelihood of Risks Associated with Ballasted Railway Drainage Failure:. https://doi.org/10.1177/0361198120982310 2021, 2675, 70–89. Publisher: SAGE PublicationsSage CA: Los Angeles, CA. [CrossRef]
- Vale, C.; Simões, M.L. Prediction of Railway Track Condition for Preventive Maintenance by Using a Data-Driven Approach. Infrastructures 2022, 7, 34. [Google Scholar] [CrossRef]
- Vandoorne, R.; Gräbe, P.J. Stochastic modelling for the maintenance of life cycle cost of rails using Monte Carlo simulation. Proceedings of the Institution of Mechanical Engineers, Part F: Journal of Rail and Rapid Transit 2018, 232, 1240–1251. [Google Scholar] [CrossRef]
- Wenfei, B.; Yun, W.; Rengkui, L. Optimization Model of Life Cycle Repair Decisions for Track Network. Journal of Transportation Engineering, Part A: Systems 2022, 148. [Google Scholar] [CrossRef]
- Jalili Hassankiadeh, S. Failure analysis of railway switches and crossings for the purpose of preventive maintenance. 2011.
- Chuo, S.; Moghtadernejad, S.; Adey, B.T.; Mehranfar, H. Estimation of bridge component condition states with varying data availability. In Proceedings of the Life-Cycle of Structures and Infrastructure Systems, Milan, Italy; 2023. [Google Scholar]
- Moghtadernejad, S.; Huber, G.; Hackl, J.; Adey, B.T. Data-driven estimation of deterioration curves: a railway supporting structures case study. https://doi.org/10.1680/jinam.21.00006 2021, pp. 1–15. Publisher: Thomas Telford Ltd. [CrossRef]
- Mizutani, D.; Lethanh, N.; Adey, B.T.; Kaito, K. Improving the estimation of markov transition probabilities using mechanistic-empirical models. Frontiers in Built Environment 2017, 3, 58. [Google Scholar] [CrossRef]
- Tzanakakis, K. Tzanakakis, K. The Railway Track and Its Long Term Behaviour 2013. 2. Publisher: Springer Berlin Heidelberg Place: Berlin, Heidelberg ISBN: 978-3-642-36050-3. [CrossRef]
- Kosič, M.; Anžlin, A.; Bau’, V. Flood vulnerability assessment: an effective tool to evaluate the lifecycle risk analysis of bridges. ce/papers 2023, 6, 817–823. [Google Scholar] [CrossRef]
- Sathya, S.U.; Mahmoodian, M.; Bandara, C.S.; Naderpajouh, N.; Dissanayake, P.B.R. Fragility Prediction for Earthquake-Induced Embankment Failures Through Empirical Methods. In Proceedings of the ICSBE 2022; Dissanayake, R.; Mendis, P.; Weerasekera, K.; De Silva, S.; Fernando, S.; Konthesingha, C.; Gajanayake, P., Eds., Singapore, 2023; Lecture Notes in Civil Engineering; pp. 519–535. [Google Scholar] [CrossRef]
- Federal Statistical Office. Baupreisindex - Durchschnittliche Einheitspreise in der Schweiz und in den Grossregione. Technical report, 2021.
- Asmussen, B. Overview of Methods for Measurement of Track Irregularities Important for Ground-Borne Vibration Deliverable D2.5 2013.
- Kim, H. Trackside measurement of critical zones in railway tracks. PhD thesis, 2016.
- SBB Infrastruktur. Network Status Report 2020. Technical report, VöV, Bern, Switzerland, 2020. Issue: März.
- Engineering Track Maintenance Field Handbook. Technical report, Union Pacific, 2022.
- Mosayebi Omshi, E.; Grall, A. Replacement and imperfect repair of deteriorating system: Study of a CBM policy and impact of repair efficiency. Reliability Engineering and System Safety 2021, 215, 107905. [Google Scholar] [CrossRef]
- Chen, J.; Ren, L.; Li, J. Research on imperfect condition-based maintenance strategy based on accelerated degradation process. Measurement and Control 0, 0, 00202940231207709, [https://doi.org/10.1177/00202940231207709]. [CrossRef]
- Peng, J.; Liu, B.; Liu, Y.; Xu, X. Condition-Based Maintenance Policy for Systems With a Non-Homogeneous Degradation Process. IEEE Access 2020, 8, 81800–81811. [Google Scholar] [CrossRef]
- Li, M.; Jia, G. Age, state, and environment dependent non-homogeneous stochastic model for improved bridge deterioration prediction. In Proceedings of the Bridge Maintenance, Safety, Management, Life-Cycle Sustainability and Innovations. CRC Press, 2021. Num Pages: 8. [Google Scholar]
- Wellalage, N.K.W.; Zhang, T.; Dwight, R. Calibrating Markov Chain–Based Deterioration Models for Predicting Future Conditions of Railway Bridge Elements. Journal of Bridge Engineering 2015, 20, 04014060. [Google Scholar] [CrossRef]
- Shen, Y.; Goodall, J.L.; Chase, S.B. Condition State–Based Civil Infrastructure Deterioration Model on a Structure System Level. Journal of Infrastructure Systems 2019, 25, 04018042. [Google Scholar] [CrossRef]
- Mehranfar, H.; Moghtadernejad, S.; Adey, B.T.; Fecarotti, C. Improving the planning of future track interventions using digital tools. In Proceedings of the TRA Dublin 2024 Conference Proceedings Transport Research Arena (TRA Dublin 2024), Dublin; 2024. [Google Scholar]
- Ozbek, M.E.; de la Garza, J.M.; Triantis, K. Efficiency Measurement of Bridge Maintenance Using Data Envelopment Analysis. Journal of Infrastructure Systems 2010, 16, 31–39. [Google Scholar] [CrossRef]
- Zhang, Z.; Agbelie, B.R.; Labi, S. Efficiency Measurement of Bridge Management with Data Envelopment Analysis. Transportation Research Record 2015, 2481, 1–9. [Google Scholar] [CrossRef]
- R Core Team. R: A Language and Environment for Statistical Computing; R Foundation for Statistical Computing: Vienna, Austria, 2024. [Google Scholar]
- Kim, S.; Ge, B.; Frangopol, D.M. Probabilistic Optimum Bridge System Maintenance Management Considering Correlations of Deteriorating Components and Service Life Extensions. ASCE-ASME Journal of Risk and Uncertainty in Engineering Systems, Part A: Civil Engineering 2022, 8. [Google Scholar] [CrossRef]
| 1 | FR: Failure Risks,IS: Intervention Strategies |
| 1 |
I is anidentity matrix. |
| 0 | Note: The bests witch intervention strategy is highlighted inviolet. |
| 1 | Potential activities: Tightening of the fastenings, Tamping or ballast cleaning, lubrication of the switch blades, adjustment of switch settings. |
| 2 | Potential activities: Restoration of the rail surface by welding, manual grinding. |
| 3 | Potential activities: Replacing the damaged parts of the switch. |
| 0 | Note:The values associated with the most likely interventions are indicated in bold. |
| 1 | The chance of the intervention being rehabilitation /renewal /replacement (%) |
| 2 | Building Information Modelling |
| 3 | Geographic Information System |
| 4 | Dynamic Bayesian Network |
| CS | Condition Description | Damage Description | Damage Indicator |
|---|---|---|---|
| 1 | New | None/insignificant | No significant damages, no sign of settlement. |
| 2 | Good | Minor | Slight wear on the mechanism, a slight sign of debris accumulation, a slight sign of settlement. |
| 3 | Sufficient | Significant | Insignificant signs of wear on the switchblade, Insignificant sign of wear on the crossing nose, small areas with slight corrosion, insignificant accumulation of debris, the amount of settlement reaches the alarm threshold. |
| 4 | Poor | Extensive | The frog shows some damage, switchblades damaged, switch actuator/motor can fail, significant accumulation of debris, the amount of settlement reaches the intervention threshold. |
| 5 | Insufficient | Safety is endangered | Plastic deformation of the crossing nose, loss of stability due to severe corrosion of the frog, extreme accumulation of debris actuator/motor have a high failure probability, the amount of settlement reaches the maximum tolerable threshold. |
| 1st Maintenance | 2nd Maintenance | |||||||||
|---|---|---|---|---|---|---|---|---|---|---|
| CS | 1 | 2 | 3 | 4 | 5 | 1 | 2 | 3 | 4 | 5 |
| 1 | 0.84 | 0.16 | - | - | - | 0.82 | 0.18 | - | - | |
| 2 | - | 0.72 | 0.28 | - | 0.70 | 0.30 | - | - | - | |
| 3 | - | - | 0.56 | 0.44 | - | - | 0.54 | 0.46 | - | |
| 4 | - | - | - | 0.32 | 0.68 | - | - | 0.30 | 0.70 | |
| 5 | - | - | - | - | - | - | - | - | - | |
| Intervention Type | Service Disturbance Duration | |||
|---|---|---|---|---|
| Rehabilitation | 3’110 | 4 | 260’496 | 263’606 |
| Renewal | 3’930 | 4 | 260’496 | 264’426 |
| Replacement | 14’110 | 8 | 520’992 | 535’102 |
| Intervention Type | CS1 | CS2 | CS3 | CS4 | CS5 | |
|---|---|---|---|---|---|---|
| CS3 | Rehabilitation[1] | 0.85 | 0.15 | - | - | - |
| Renewal | 0.95 | 0.05 | - | - | - | |
| Replacement | 1.00 | - | - | - | - | |
| CS4 | Rehabilitation | 0.65 | 0.35 | - | - | - |
| Renewal[2] | 0.90 | 0.10 | - | - | - | |
| Replacement | 1.00 | - | - | - | - | |
| CS5 | Rehabilitation | 0.50 | 0.50 | - | - | - |
| Renewal | 0.85 | 0.15 | - | - | - | |
| Replacement[3] | 1.00 | - | - | - | - |
| Expected Required | |||||||
|---|---|---|---|---|---|---|---|
| Possessions (h) If Done Alone | |||||||
| Switch Name | Chance of an Intervention(%) | Details[1] | Expected Duration (h) | None | Traffic Restrictions | Closure | Expected Intervention Costs (mu) |
| S1 | 34 | 27/6/1 | 6/7/11 | 1/1/1 | 1/2/2 | 4/4/8 | 263/264/535 |
| S2 | 100 | -/47/53 | 6/7/11 | 1/1/1 | 1/2/2 | 4/4/8 | 263/264/535 |
Disclaimer/Publisher’s Note: The statements, opinions and data contained in all publications are solely those of the individual author(s) and contributor(s) and not of MDPI and/or the editor(s). MDPI and/or the editor(s) disclaim responsibility for any injury to people or property resulting from any ideas, methods, instructions or products referred to in the content. |
© 2025 by the authors. Licensee MDPI, Basel, Switzerland. This article is an open access article distributed under the terms and conditions of the Creative Commons Attribution (CC BY) license (http://creativecommons.org/licenses/by/4.0/).


