Submitted:
03 March 2025
Posted:
04 March 2025
Read the latest preprint version here
Abstract
The meridian astrometry in the XVIII century was performed both in Rome on the Clementine Gnomon (1702, Francesco Bianchini) and in Bologna at the Heliometer in S. Petronio Basilica (1655, Giovan Domenico Cassini). These two pinhole-meridian lines are cornerstones in the his-tory of the solar astrometry. The “solar theory” is the celestial mechanics of the Earth’s orbit combined with the multiperiodical motions of the Earth’s axis; it must include the atmospheric refraction, from 20° to 67° of altitude, the lowest and the highest meridian altitude of the Sun in Bologna, which Cassini published in 1656. Dedicated observations realized at the Clementine gnomon between 2018 and 2025, in various meteorological conditions, contribute to the debate on the solar diameter during and after the Maunder minimum, recently based on the analysis of data collected by Eustachio Manfredi (1736) on the Cassini's meridian line since 1655. The stellar meridian transits, once observed in S. Maria degli Angeli, were ancillary data to the solar transits. Two decades before the discovery of stellar aberration in 1727, Francesco Bianchini measured its effect on the Polaris. A comparison between the meridian diameters measured by Bianchini in the winter solstices of 1701-2 and the ones of the present observational campaign 2018-25 is made to detect differences in the solar diameter from the end of Maunder minimum to the present maximum of solar cycle XXV. The first repetition of the stellar transits at the meridian line is presented.
Keywords:
Pinhole Meridian Line
; Francesco Bianchini (1662-1729)
; Giovan Domenico Cassini (1625-1712)
; Stellar Aberration
; Solar Diameter
; Maunder mimum
1. Structure and Focus of the Article
After an historical introduction, necessary to understand the pinhole astronomy (1.) made with the Sun in seicento and settecento for measuring its position and its diameter, we present the complete re-calibration (2.) of the Clementine Gnomon (Rome, 1702) used for the modern observations of the Sun (2018-2025) and of the Stars (2025). The measures of time (3.) are affected by the local seeing, as well as the measures of the meridian length of the solar image; the ones made in Bologna are quoted in (4.). The modern measures realized in Rome (5.) of the transit time (5.1) and on the meridian length (5.2) are discussed in order to understand better the measures in Settecento. In (5.3) we consider the absolute timing used in 1700, while in (5.4) various meteorological conditions are examined to understand the observative uncertainties encountered also in Seicento and Settecento, also with different reflecting properties of the marbles near the meridian line. The chapter (6.) is dedicated to the stellar aberration: a relativistic effect acting on the position of the (6.1) culmination of the Polaris on 1-8 January 1701, when the latitude of the pinhole was accurately measured, and (6.2.1) on the transit times of Sirius in 1703, used to determine the ecliptic longitude of the Sun, and then equinoxes and solstices. Paragraph (6.2.2) deals with the projected positions of Sirius, measured in 1702-3, modified by the aberration in latitude. The modern observations of two stellar transits (7.) at the Clementine Gnomon help to understand the operating conditions in Settecento, for such measures. Chapter (8.) introduces the problem of the secular variation of the solar diameter and its detectability in the averages of the data of Bologna (1655-1736) and of Rome (1701-1702). Real data and simulations (9.) with observational errorbars are compared. The distribution of the differences between two clusters of data (Maunder minimum and after it) is simulated. In (10.) the conclusions on the comparison beween the measures made in 1701-2 by Bianchini near the winter solstices, where the relative error on the meridian diameter is minimal, and the corresponding measures made by Sigismondi in 2018-2024 are presented. The relativistic effect of the stellar aberration has been disentagled from the systematic errors of the meridian line, with a millimeter accuracy: the same used to recover the solar diameter’s secular variations from 1701-2 to 2025, from the end of the Maunder minimum to the maximum of the XXV solar cycle of activity.
2. Historical Introduction
The Clementine Gnomon is also known as Meridian Line of St. Maria degli Angeli.
It has been built between 1700 and 1702 under the direction of the astronomer Mons. Francesco Bianchini (1662-1729), financed by the Cardinal Gianfrancesco Albani who was elected pope on 23 november 1700, taking the name of Clement XI (1700-1721).
This instrument is a gigantic pinhole camera realized to recover to an unprecedented accuracy the daily position of the Sun, in order to measure the length of the tropical year, and the secular variations of the obliquity of the ecliptic.1 The horizontal pinhole of 25 mm2 of diameter illuminates nowadays the meridian line.
The previous instruments dedicated to these measurements were in the Cathedral of Florence (Toscanelli, 1475) and in the Basilica of S. Petronio (Danti, 1577 and Cassini, 1655). Francesco Bianchini (1703) created an instrument with a pinhole much more stable than the previous ones, stable for the centuries to come, and allowing also the observations of the stellar transits, even in daytime.
Francesco Bianchini with the Clementine Gnomon realized the most advanced instrument of his times, for assessing the bases of the Calendar’s Reformation of Gregory XIII (1582): the Celestial Mechanics of the Sun and of the Moon.
Bianchini was already connected with all the scientists of his time, and Newton invited him to join the Royal Society of London as a foreign fellow.
The Clementine Gnomon remained, after Bianchini, a reference instrument studied also by Celsius (1734) and Boscovich (1750). Ximenes in 1761 re-calibrated the Florentine gnomon in St. Maria del Fiore finding daily and seasonally motions of the dome. With the meridian line created by De Cesaris (1782) in the Duomo of Milan the accuracy of the meridian’s azimuth reached 6”, but the astrometric purposes were no more in the scope of its construction. Also the meridian in the Cathedral of Palermo (Piazzi, 1803) was devoted to the local noon’s determination for the Angelus’ prayer, and for public timing, without any more astrometric scopes. The local noon gradually ceased to be relevant for public life, beyond religion, as the world time zones and their mean time become in official use after the conference of Washington of 1884. The function of civil time keeping of the Clementine Gnomon ceased in 1846, when the Collegio Romano Observatory took this service. A big ball left falling along a tube, as in Flamsteed’s house in Greenwich, was the visual signal for shooting the cannon on top of Castel S. Angelo.
2. The Present Observational Campaign (2018-2025) at the Clementine Gnomon (Rome)
The discovery of relativistic effects influencing the ancient measurements (Sigismondi, 2005, 2006 and 2018, with observations since 1999) led to an extensive astrometric observational campaign started in 2018 (Sigismondi, 2022) called IGEA, Informatized Geometric Ephemerides for Astrometry calibration campaign with ZIA Zenithal Imaging Analysis in order to obtain accurate local references along the meridian line. The daily passage of the Sun on the meridian line has been compared with the ephemerides to disentangle systematic effects of the 50-m sized instrument from the Earth’ axis secular motions.
As a result the ΔUT1 is now detectable with one or few solar meridian transit timings in every position of the meridian line (Sigismondi and Pietroni, 2022). The nutation and the obliquity variations are measurable all the days of the year (Sullivan, 2016), with a particularly high accuracy around the winter solstice, with a 1.77”/mm scaling at the meridian transit. Several sunspots of the XXV solar cycle have been recorded on the meridian marbles, especially in the winter’s season, when the solar image is as large as hundred times the pinhole’s size. The “cylinder effect” reducing the effective meridian pinhole to about 10 mm in winter (Sigismondi, 2021) and moving its center of a few mm during the year, allowed to see clearly the main sunspots of the cycle XXV, by reaching the higher space resolution for such lensless telescope (Sigismondi, 2002). The solar limb darkening convoluted with the pinhole aperture and the diffraction produces a red rim of the solar image, of 5 mm or 10” width at the winter solstice.
The meridian measure of the solar diameter has been paralleled with meteorological data (pressure, temperature and moisture) and sky aspect (cloud, veils, clear) to disentangle their contributions to the extension of the observed diameter.
This study has been extended to extra-meridian measures in 2024-2025 to verify the observing conditions with solar altitudes down to 20°, as it was in Bologna during winters.
3. The Timing and the Image’s Length During Daily Meridian Transits
The position of the image of the Sun, its dimension and the duration of its transit were the object of the astronomers’ interest in Seicento and Settecento.
The seasonal variation of the solar diameter and of the transit’s duration (Fugure 1) is dependent on the orbital shape (circular ex-centric or elliptical) and it was measured with a meridian line illuminated by a pinhole or by a lens with appropriate focal length (Heilbron, 1999).
The total duration of a meridian transit, from the first contact of the solar image with the meridian line to the last one depends on the angular solar diameter and on the pinhole’s diameter. In an ideal point-like pinhole the transit time of the whole solar diameter is TD*=1920/15·cos(δ) s, where 1920” is the mean angular diameter3 at 1AU and 15·cos(δ)”/s is the seasonal angular velocity of the Sun, being δ the declination.
4. The Observations Made in Bologna at the Cassini’s Meridian Line
Cassini and his collaborators monitored since 1655 the solar diameter. Manfredi (1736) reported their and his observations. They encompass also the period of the solar Maunder minimum (1645-1715). Manfredi reduced all the data for the “penumbra” (the pinhole size), and refraction effects. Tovar et al. (2021) analyzed these data concluding that the data of 1655-1715 in the grand sunspot minimum, and the ones of 1715-1736 immediately after, are compatible with the same solar diameter, within 0.6”. The study made with the Clementine Gnomon in Rome aims to reproduce the conditions of the solar observations in 1700, in order to understand better the sources of errors and their consequences on the measured solar diameter and their statistics.
5. Observations in Rome: Past and Present
More than 500 extra-meridian observations, made to reproduce the winter solstice conditions in Bologna, strengthen the statistics in addition to the IGEA-ZIA campaign started on the Clementine Gnomon. Also 500 meridian transits complete the dataset accumulated in these years, including meteorological data of pressure, temperature and humidity beyond the clouds/clearness.The duration of the transit TD is to be compared with the theoretical one TD*, and the length of the meridian image with the ephemerides. Both have been considered in the IGEA-ZIA campaign, started in 2018 and extended to extra-meridian measures in 2024.
5.1. Angular Diameters and Theoretical Transit Times
The transit time of the solar diameter TD is the time between the western (preceding) limb touching the meridian line and the eastern (following) limb leaving it.
The maximum angular solar diameter tabulated (Fugure 1) for the Cardinal Francesco Saverio De Zelada (1717-1801) is 5” larger than the ephemerides of the Sun in 1798 perihelion (Espenak, 2025), and the corresponding transit times are longer than an ideal TD*=1920/15·cos(δ), as from a dimensionless pinhole.
Because of the finite pinhole’s dimension D, the real transit time TD≥ TD*. The theoretical TD* is calculated by adding to the ideal transit time TD, the time for crossing the transversal pinhole’s diameter.
TD*=1920/15·cos(δ)+D/v
The images’ tangential velocity is v=h[mm]·(1+tan2(90°-α))1/2·15·cos(δ)/201265 mm/s, and for the Clementine Gnomon
v=1.517·(1+tan2(90°-α))1/2·cos(δ) mm/s
With α the solar altitude above the horizon.
In St. Maria degli Angeli the gigantic dimension up to 50 m of focal length, maximizes the signal to noise ratio for the solar image. As an example on 20 February 2025 at 12:24:30 CET the observed4 TD=135.5 s with naked eyes; the effective5 transversal diameter was D=14.4 mm, and v=2.46 mm/s, D/v≈5.9 s; TD**=1920/[15·cos(δ)]+D/v≈136.1 s.
There is a good agreement (-4.7‰) between the measured time and the theoretical formula, and in term of mean angular solar diameter 1920”, it corresponds to -9”.6
The time accuracy in 1700 could have been 0.25 s, or 1/4 oscillation of the one-second pendulum, in practice limited by the strong local air turbulence outside the pinhole. Single time measurements by naked eye with a single reference line cannot be more accurate than 0.5 s.
Twenty parallel transits have been averaged (Sigismondi and Pietroni, 2022) to find the “quantum limit” of 0.3 s, determined by 5” of local air turbulence, just outside of the pinhole (in the first meters). By timing twenty solar transits we detected clearly the ΔUT1 accumulated on a yearly basis, due to the slowing down of the Earth’s spin in 2008-2013, and since then its constancy until present (2025) within ±0.3 s, the “quantum” confusion limit due to local atmospheric seeing.
5.2. Measuring the Solar Meridian Diameter in St. Maria degli Angeli
The solar diameter can be measured in two ways: by timing the transit and by measuring the length between the two meridian limbs North and South; in both cases the dimensions of the image are reduced with respect to the maximum theoretical light extension because of
- Signal to noise reduced by ambient light
- Solar limb darkening
- Cylinder effect, due to the pinhole vertical thickness.
The meridian diameter is much more precise than the one obtained from timing, and it is systematically 7.5 mm less than the ephemerides near the winter solstices (2018-2024) and it becomes 3.5 mm less at middle meridian line. Once verified this systematic difference, a meteorological fluctuation of ±1.5 mm corresponds to a relative uncertainty of ± 1.4‰ for the largest solar diameters of 1100 mm near the winter solstice.
All the solar diameter published by Bianchini (1702, 1703) and Manfredi (1736) have been measured always only as meridian diameters.
Moreover the motion of the image perpendicularly to the meridian line allows to detect precisely the limbs, and a few pencil’s signs near the meridian of the North and South limbs may be used to draw a fitting line with more precise determination of the actual transiting limbs (Sigismondi and Ricciardi, 2023), even below 0.5 mm each.6
The perception of the solar limb is depending on the ambient light where the meridian line is located and on the clearness of the sky.
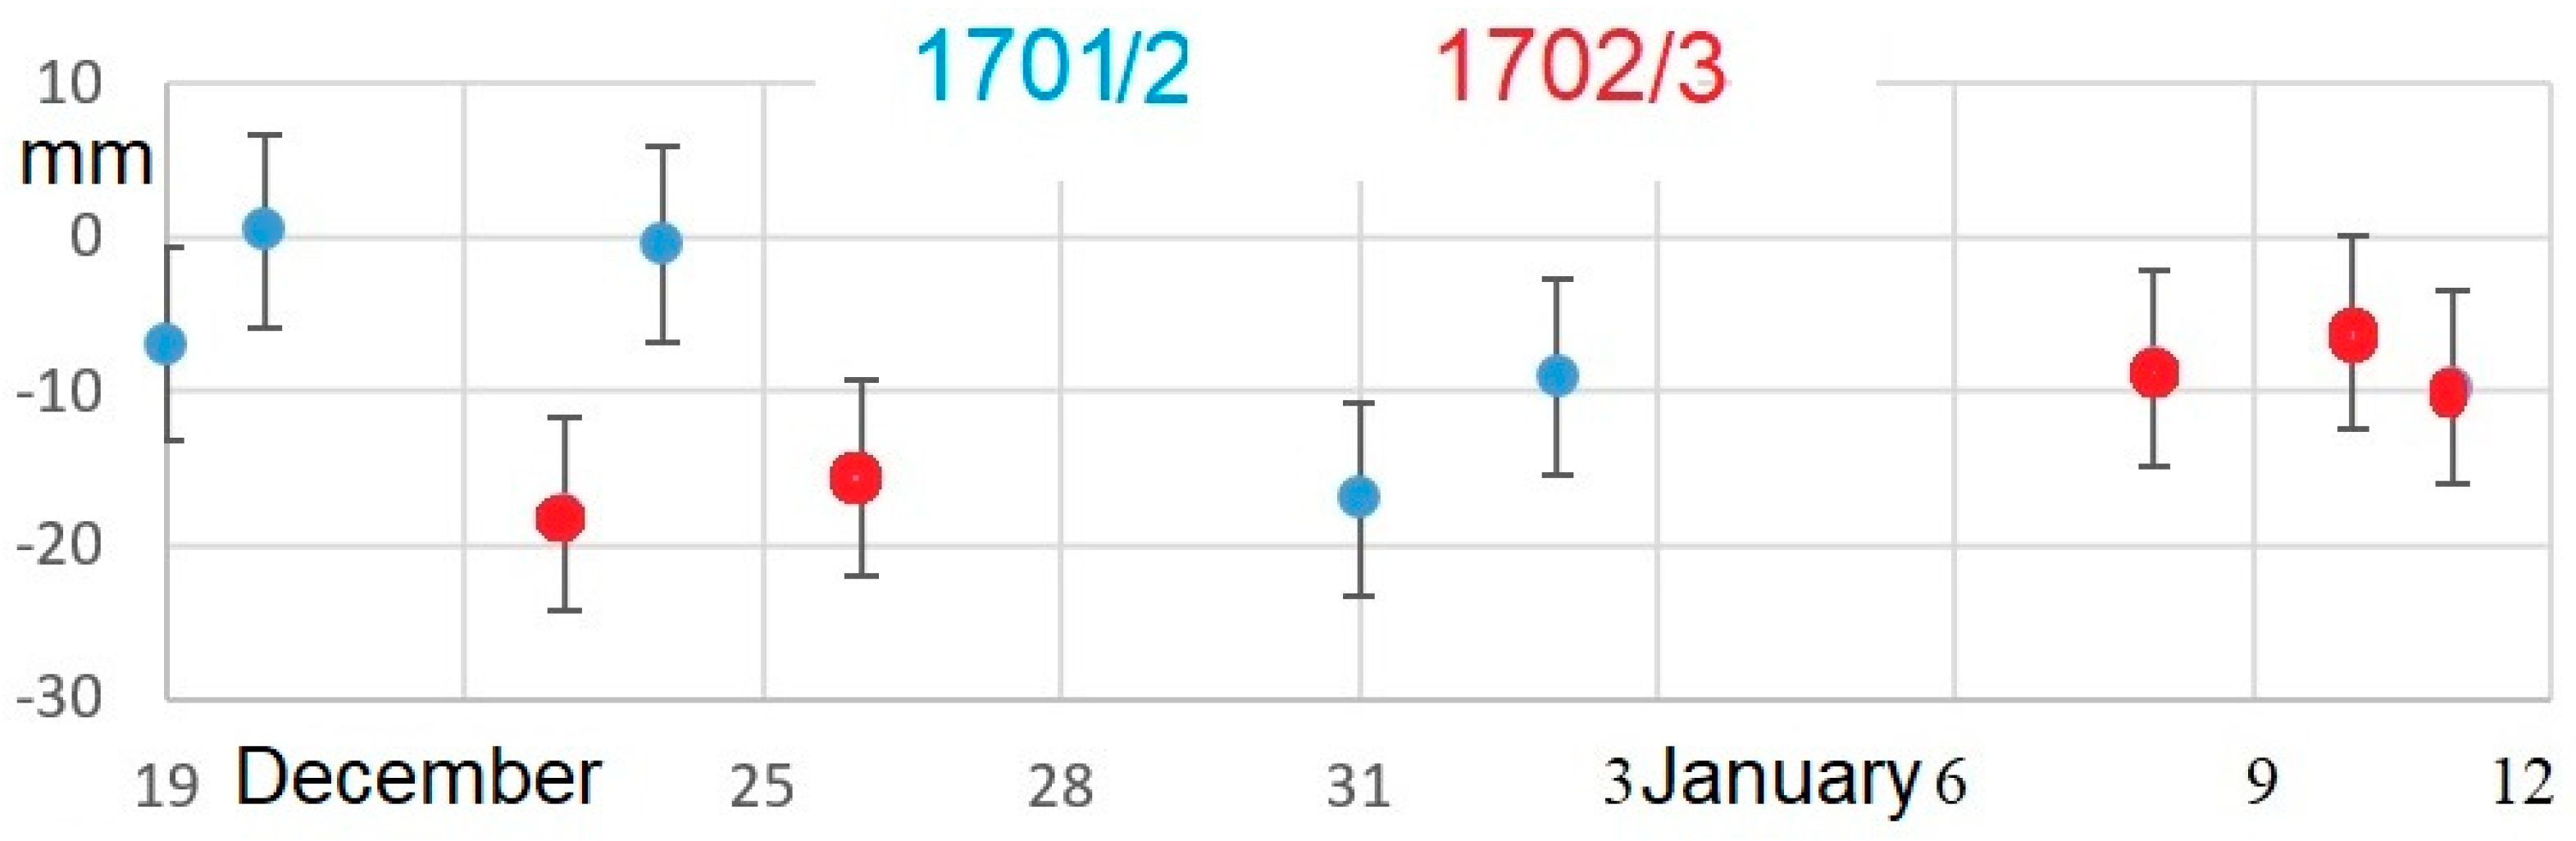
The ambient light was eliminated by obscuring the Basilica of S. Maria degli Angeli with external tents. In presence of tiny clouds’ veils we measured that the luminosity drops up to 1/10 of the full Sun situation. The measured length of the solar diameter along the meridian line is from 3.5 mm to 9 mm shorter than the ephemerides, in all the cases examined: with meridian lengths from 50 to 110 cm with the highest relative accuracy. Using 10 data of Francesco Bianchini around 1701-1702 winter solstices the mean value of the difference between Observed and Calculated diameter (with the present value of 1920” solar angular diameter at 1AU) is O-C=-9 mm (Fugure 2). The average obtained over 500 measures made in similar geometrical conditions in 2024/25 (Fugure 4 and 5), always at S. Maria degli Angeli’s Gnomon, is O-C=-12 mm (Fugure 13).
The winter solstice’s data taken near the maximum of the XXV solar cycle (2023-2024) are compared with ten winter solstice’s data of Francesco Bianchini (1701-1702) represented in Fugure (2).
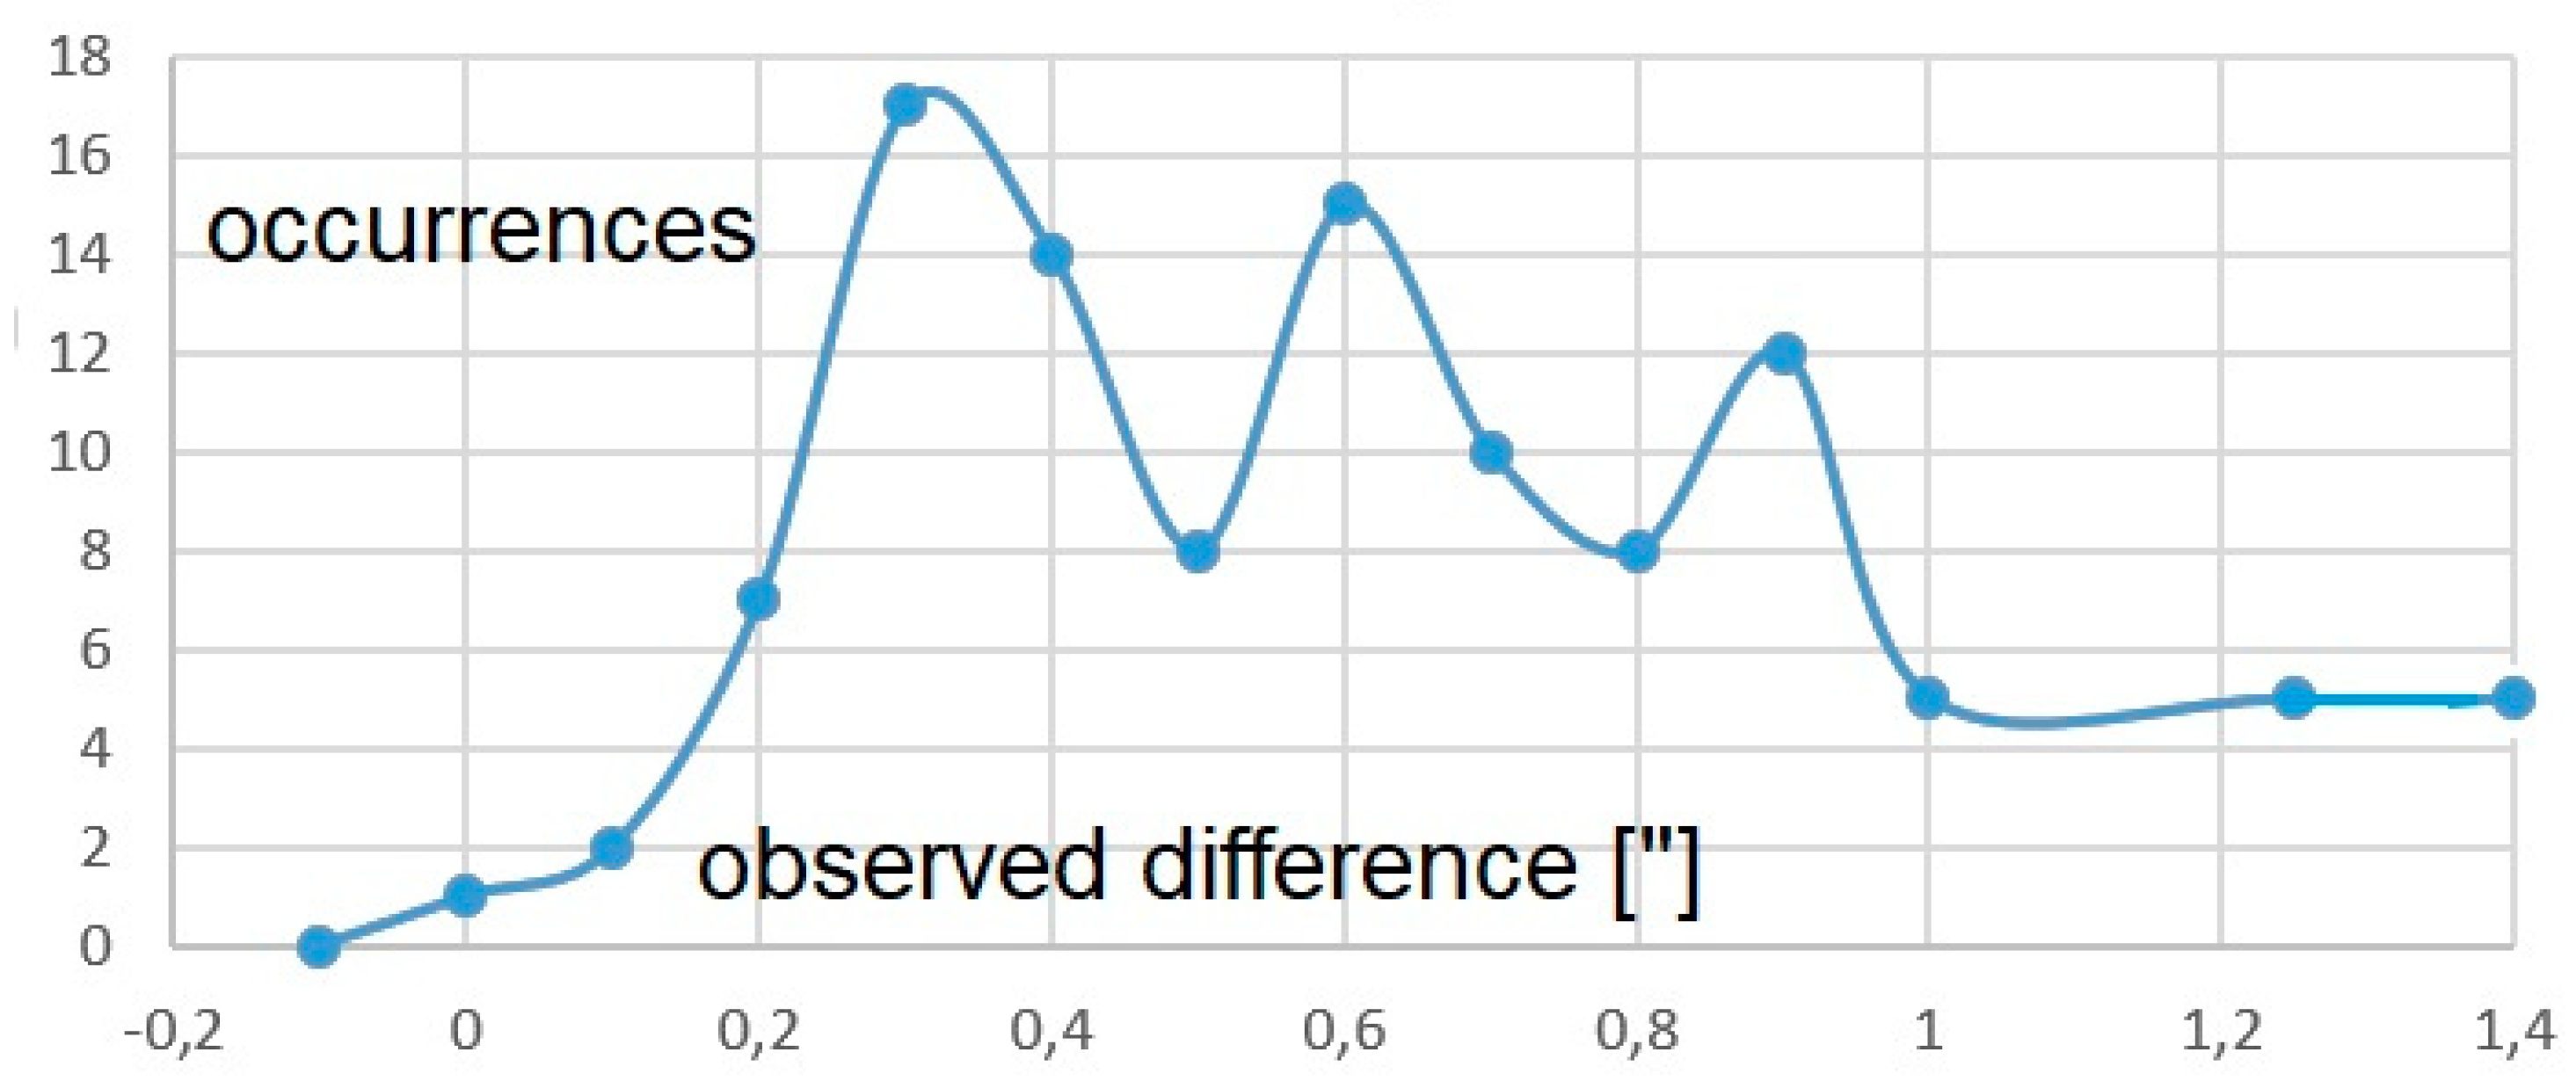
Figure 2.
Ten observations of the solar diameter measured by Bianchini near the winter solstices of 1701 and 1702. The solar diameters are -9±6 mm smaller than the ones calculated with the ephemerides (Espenak, 2025). The standard deviation σ≈6 mm has been assumed as the accuracy of a single measurement and the average m=-9 mm is the systematic difference with respect to the ephemerides for 1701/2. Both the average -9 mm and the standard deviation 6 mm are similar to the measures made in 2018-2025.
5.3. Absolute Timing Used by Bianchini in 1700
Since the solar transit is subject to the equation of time, the absolute timing in 1700 at the Clementine Gnomon was obtained by measuring the time difference between the solar transit and the transit of Sirius. Bianchini observed the transits of Sirius, measuring also its projections’ positions variating of a few millimeters during the year 1703 on the meridian line (Bianchini, 1703).Bianchini observed Sirius with a small telescope on the meridian line, through the meridian line prolonged on a window open above the pinhole. The accuracy of the timing was 0.25 s, by reading a one-second pendulum of Thuret (Paris7) in one of its four oscillation’s phases. The same accuracy was obtained in timing the first and second contact of the solar limbs with the meridian lines. A collaborator looking at the pendulum’s oscillating phases during the transit, when Bianchini claimed the limbs hitting the line, memorized the phase and collected the time. Nowadays we use the atomic reference time, overcoming the problem arising from the light aberration of the stars.8
5.4. The Meteorological Conditions and the Image’s Contrast on the Floor
The first part of the IGEA-ZIA IGEA Informatized Geometric Ephemerides for Astrometry calibration campaign (2018-2021) with ZIA Zenithal Imaging Analysis (2022) was dedicated to the study of the refraction’s effects on the position of the solar center, and to the possibility to find the corrections of Laplace to the Cassini refraction. The refraction in general, with respect to the zenithal angle z is given by z’=z-60”tan(z)-0.067”tan3(z) (Meftah, et al. 2021). The Laplace term was unobservable at the Clementine Gnomon, being at maximum 0.7” or 0.4 mm at tan(z)=2.2 (winter solstice southern limb).
The secular variation of the obliquity and the annual contribution of the nutation were easily visible at the millimeter resolution, especially by fitting several positions of the limbs before and after the meridian (near N=10). The single uncertainty of about 3 mm is reduced by the average’s standard deviation theorem 1/√N below ≤ ±1 mm. Very often the differences between the observed position O and the calculated one C has been found O-C≤0.4 mm, which corresponds at the winter solstice to 0.7’’.
The measures of the meridian diameters, after data reduction, are considered more reliable if the shifts of the meridian limbs are symmetrical, given the general accuracy achieved in their determination.
The study under different cloud coverages (Fugure 3) and different floor reflections (Fugure 4 and Fugure 5) has been conducted in order to understand what could have been the source errors in XVII and XVIII centuries observations in Bologna and in Rome. Bianchini did choose the white marble Imetto for the right and left space, both of width 456 mm around the meridian line. They have an optimal reflectance, superior to the rose marble in Bologna, much similar to some of the marbles found in the floor of the Basilica, realized for the Jubilee of 1750 by Luigi Vanvitelli upon the will of the pope Benedict XIV. The selection of the marble made by Bianchini was one of the significant improvements with respect to the Cassini meridian line of Bologna; the others were the observability of the stars through the meridian, contemporarily to the Sun, and the great stability of the pinhole, carved in the Diocletian’s walls, very well stable after 1400 years. Bianchini darkened the Basilica with tents applied to the windows from outside. This was not possible in St. Petronio Basilica in Bologna.
Bianchini observed under optimal signal-to-noise conditions,9 so he could observe both perpendicularly to the limbs (ZIA conditions) and along the inclined line of sight to get the maximum luminosity of the image (incidence angle = reflected angle of the rays) exploiting the reflection’s law. In both cases, the observations were prepared some hours before the meridian transit, a time necessary for the total obscuration of the Basilica.
Figure 3.
Photometry of the solar transit of 4 February 2025.10 The contrast of the image changes slightly during the transit, determining uncertainties on limbs’ positions under tiny clouds (unvisible to our eyes before/after the transit) or full sunlight.
Figure 3.
Photometry of the solar transit of 4 February 2025.10 The contrast of the image changes slightly during the transit, determining uncertainties on limbs’ positions under tiny clouds (unvisible to our eyes before/after the transit) or full sunlight.
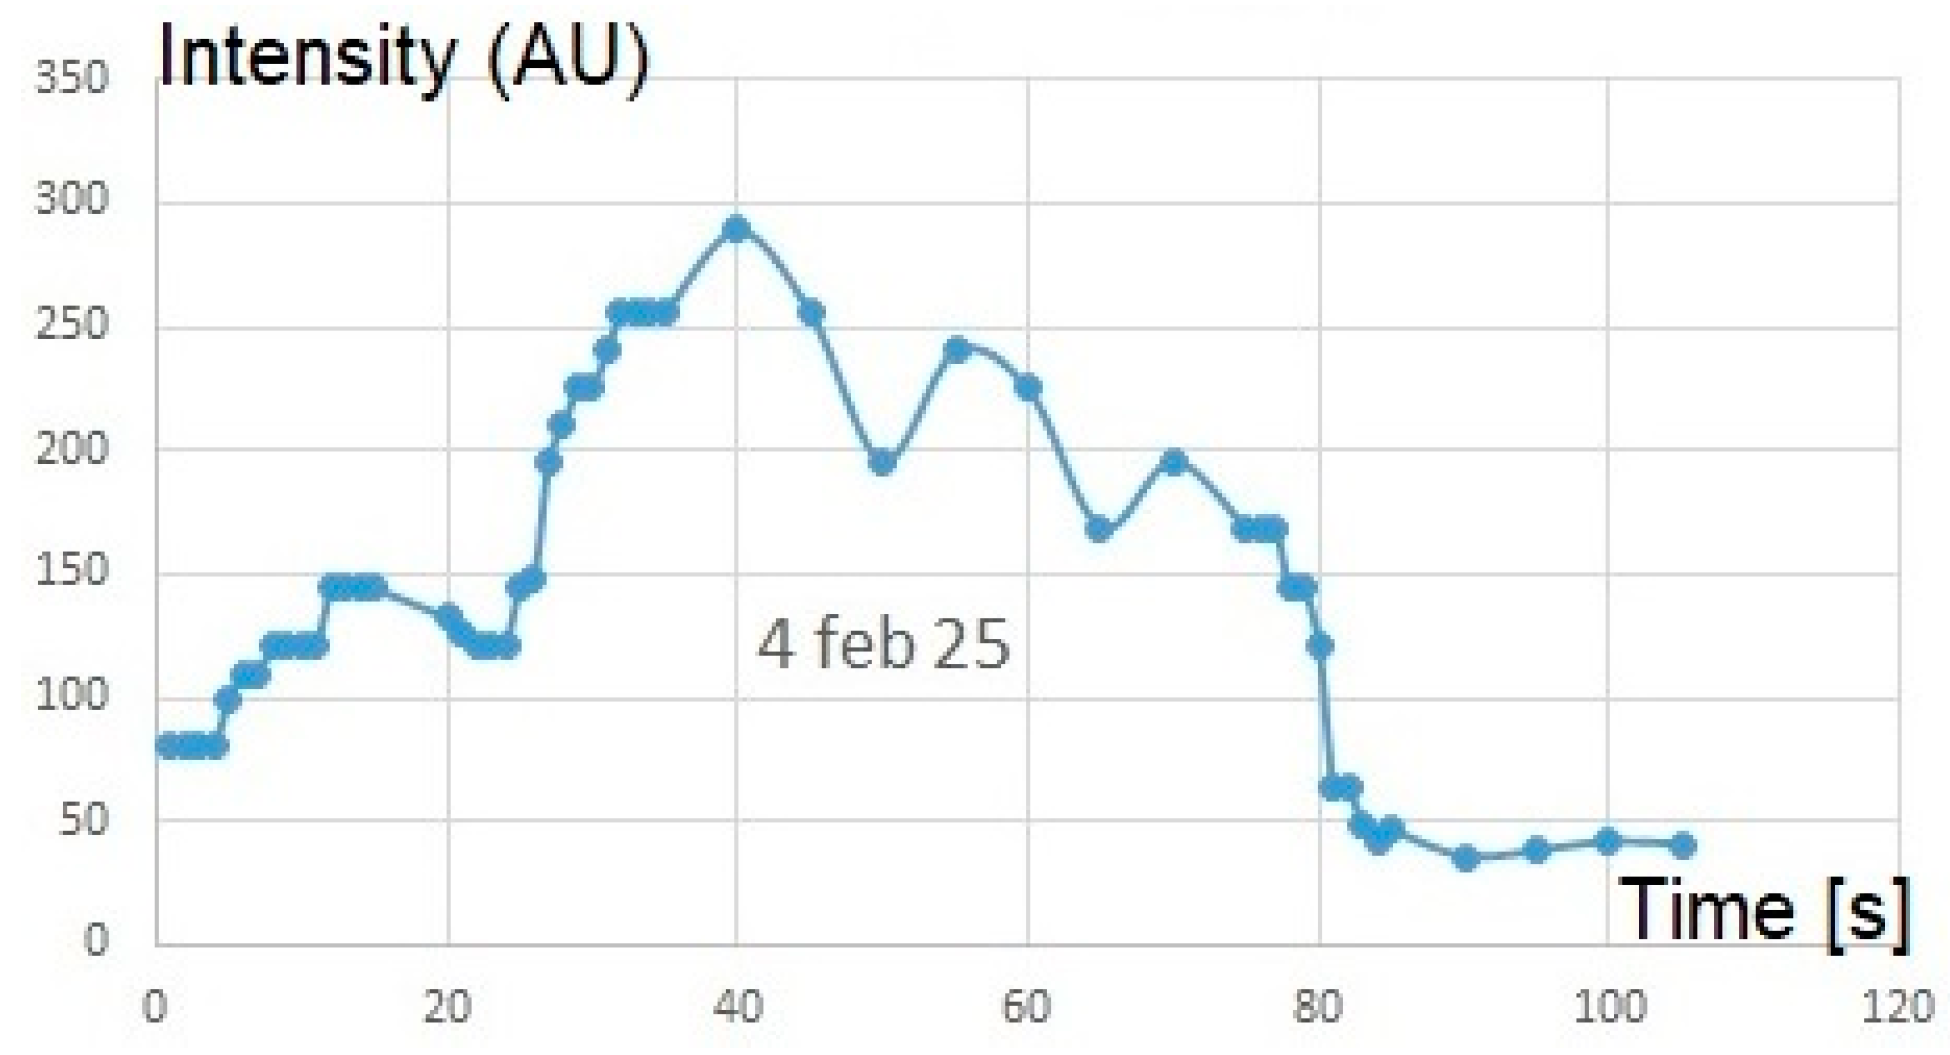
Figure 4.
Measured diameters (Observed-Calculated) in different meteorological conditions and on different reflecting marbles in S. Maria degli Angeli (26 February 2025, video).
Figure 4.
Measured diameters (Observed-Calculated) in different meteorological conditions and on different reflecting marbles in S. Maria degli Angeli (26 February 2025, video).
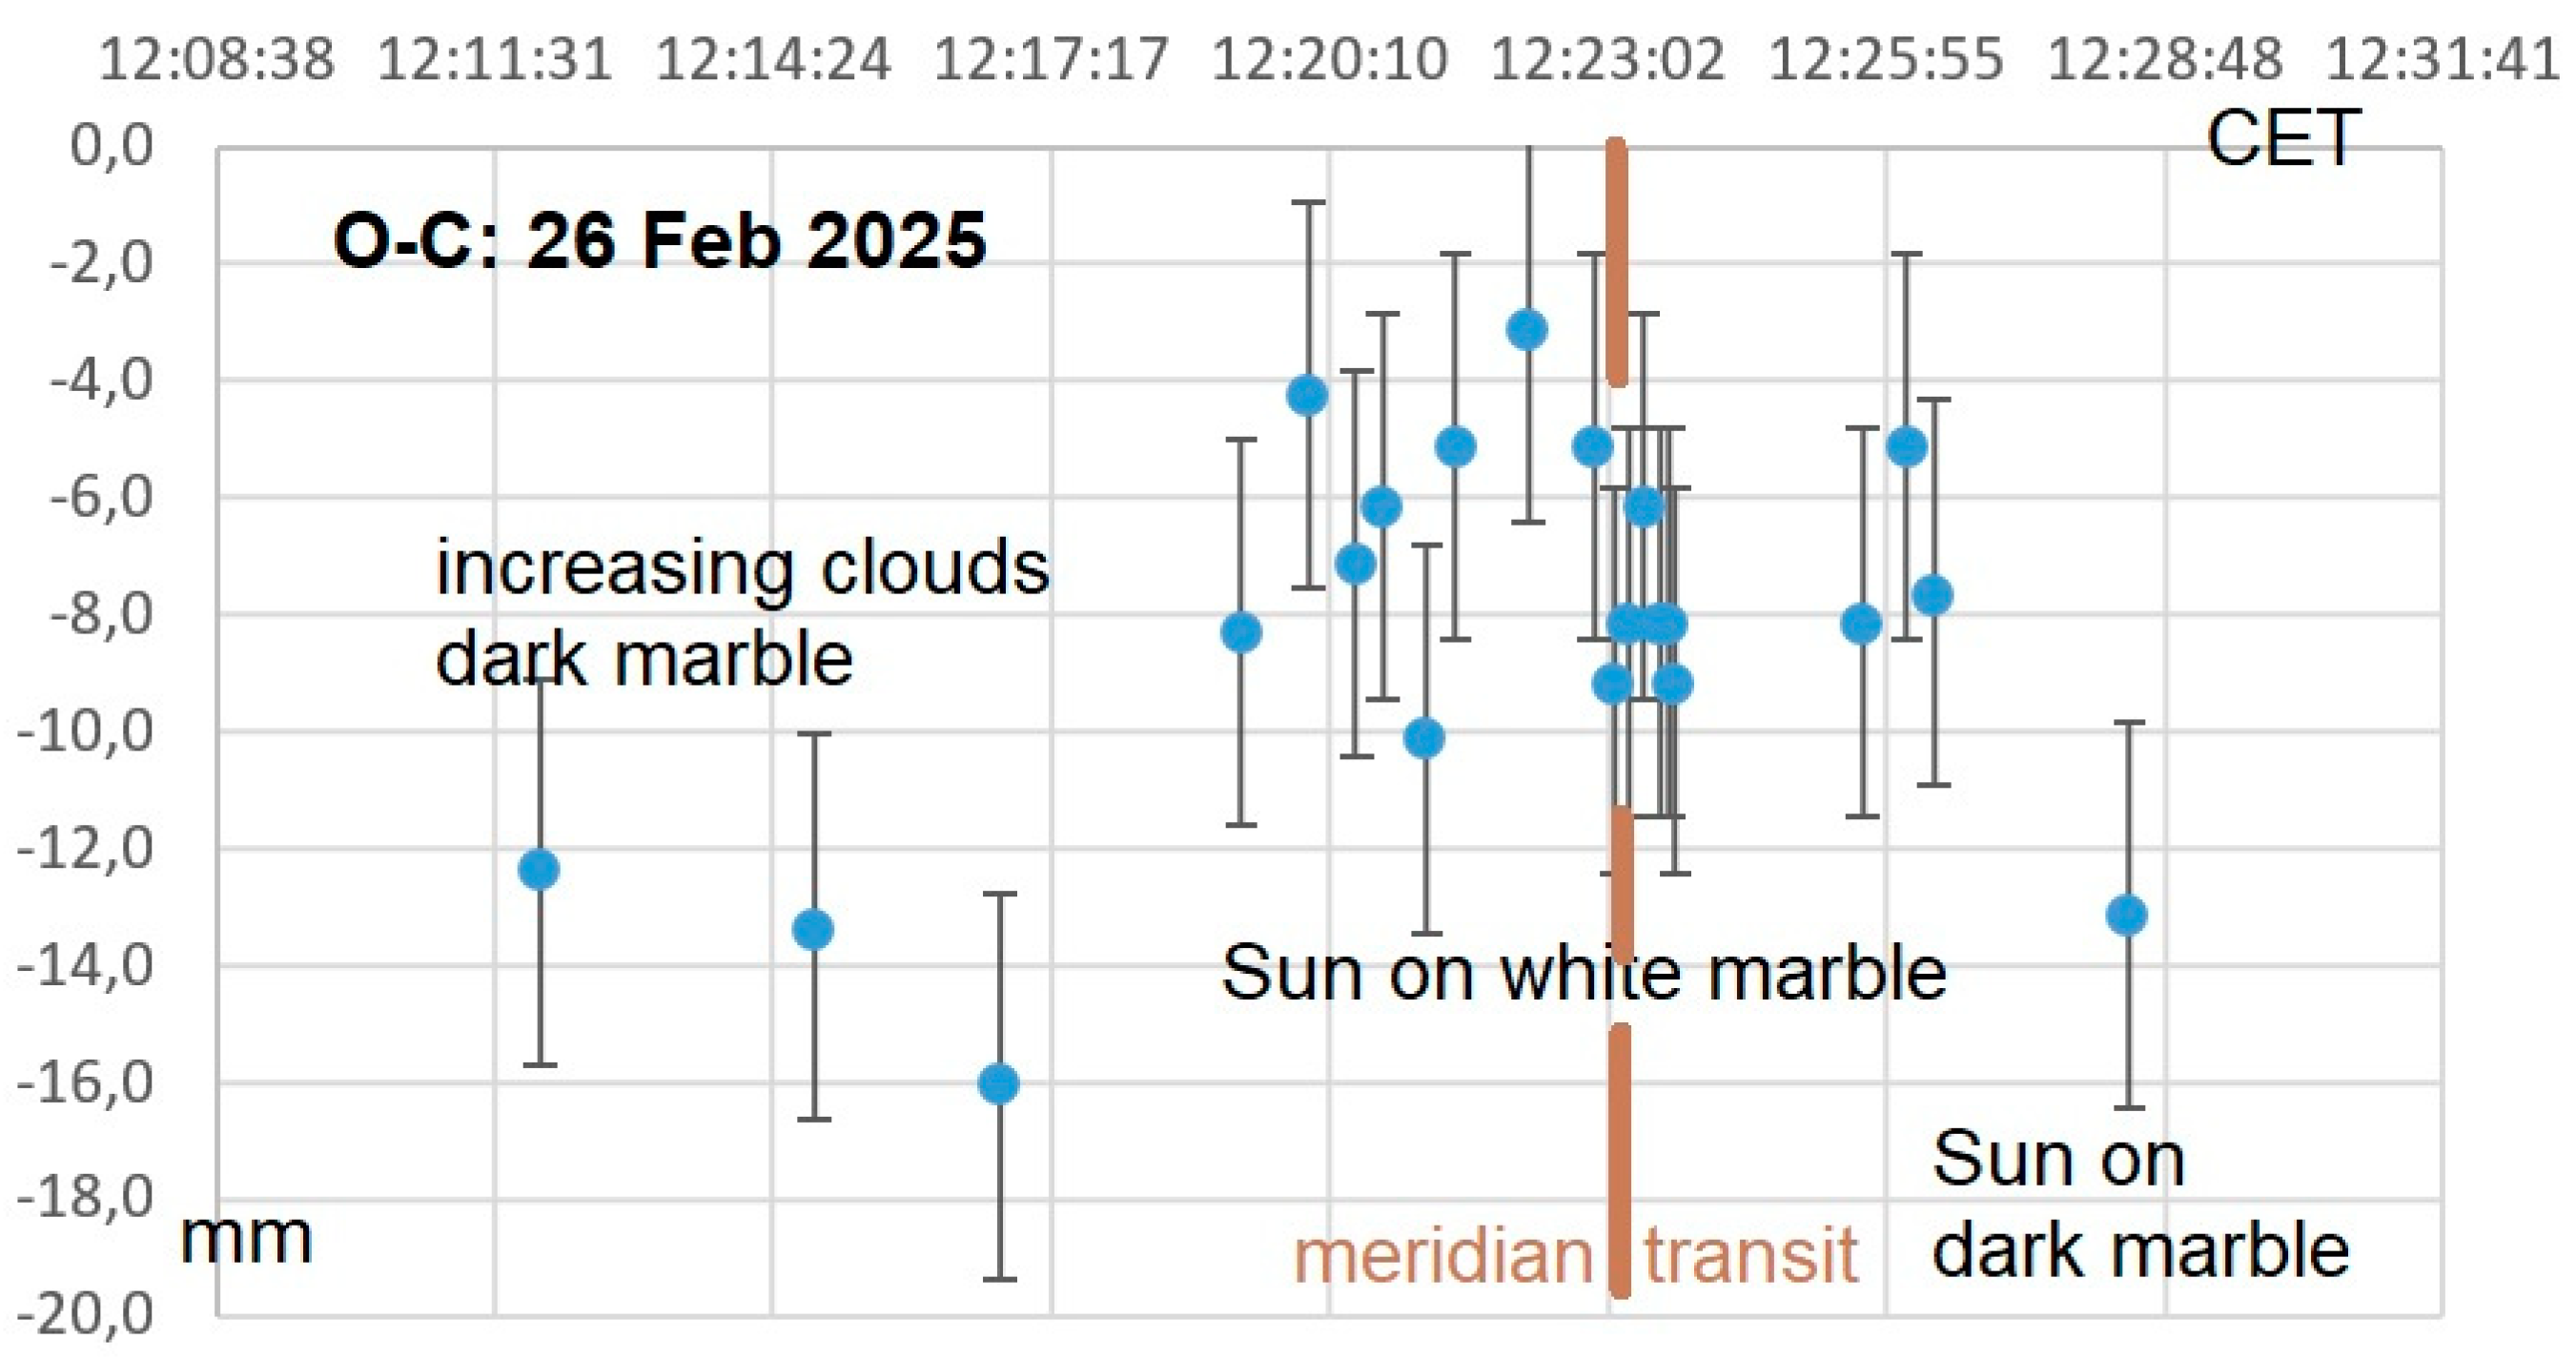
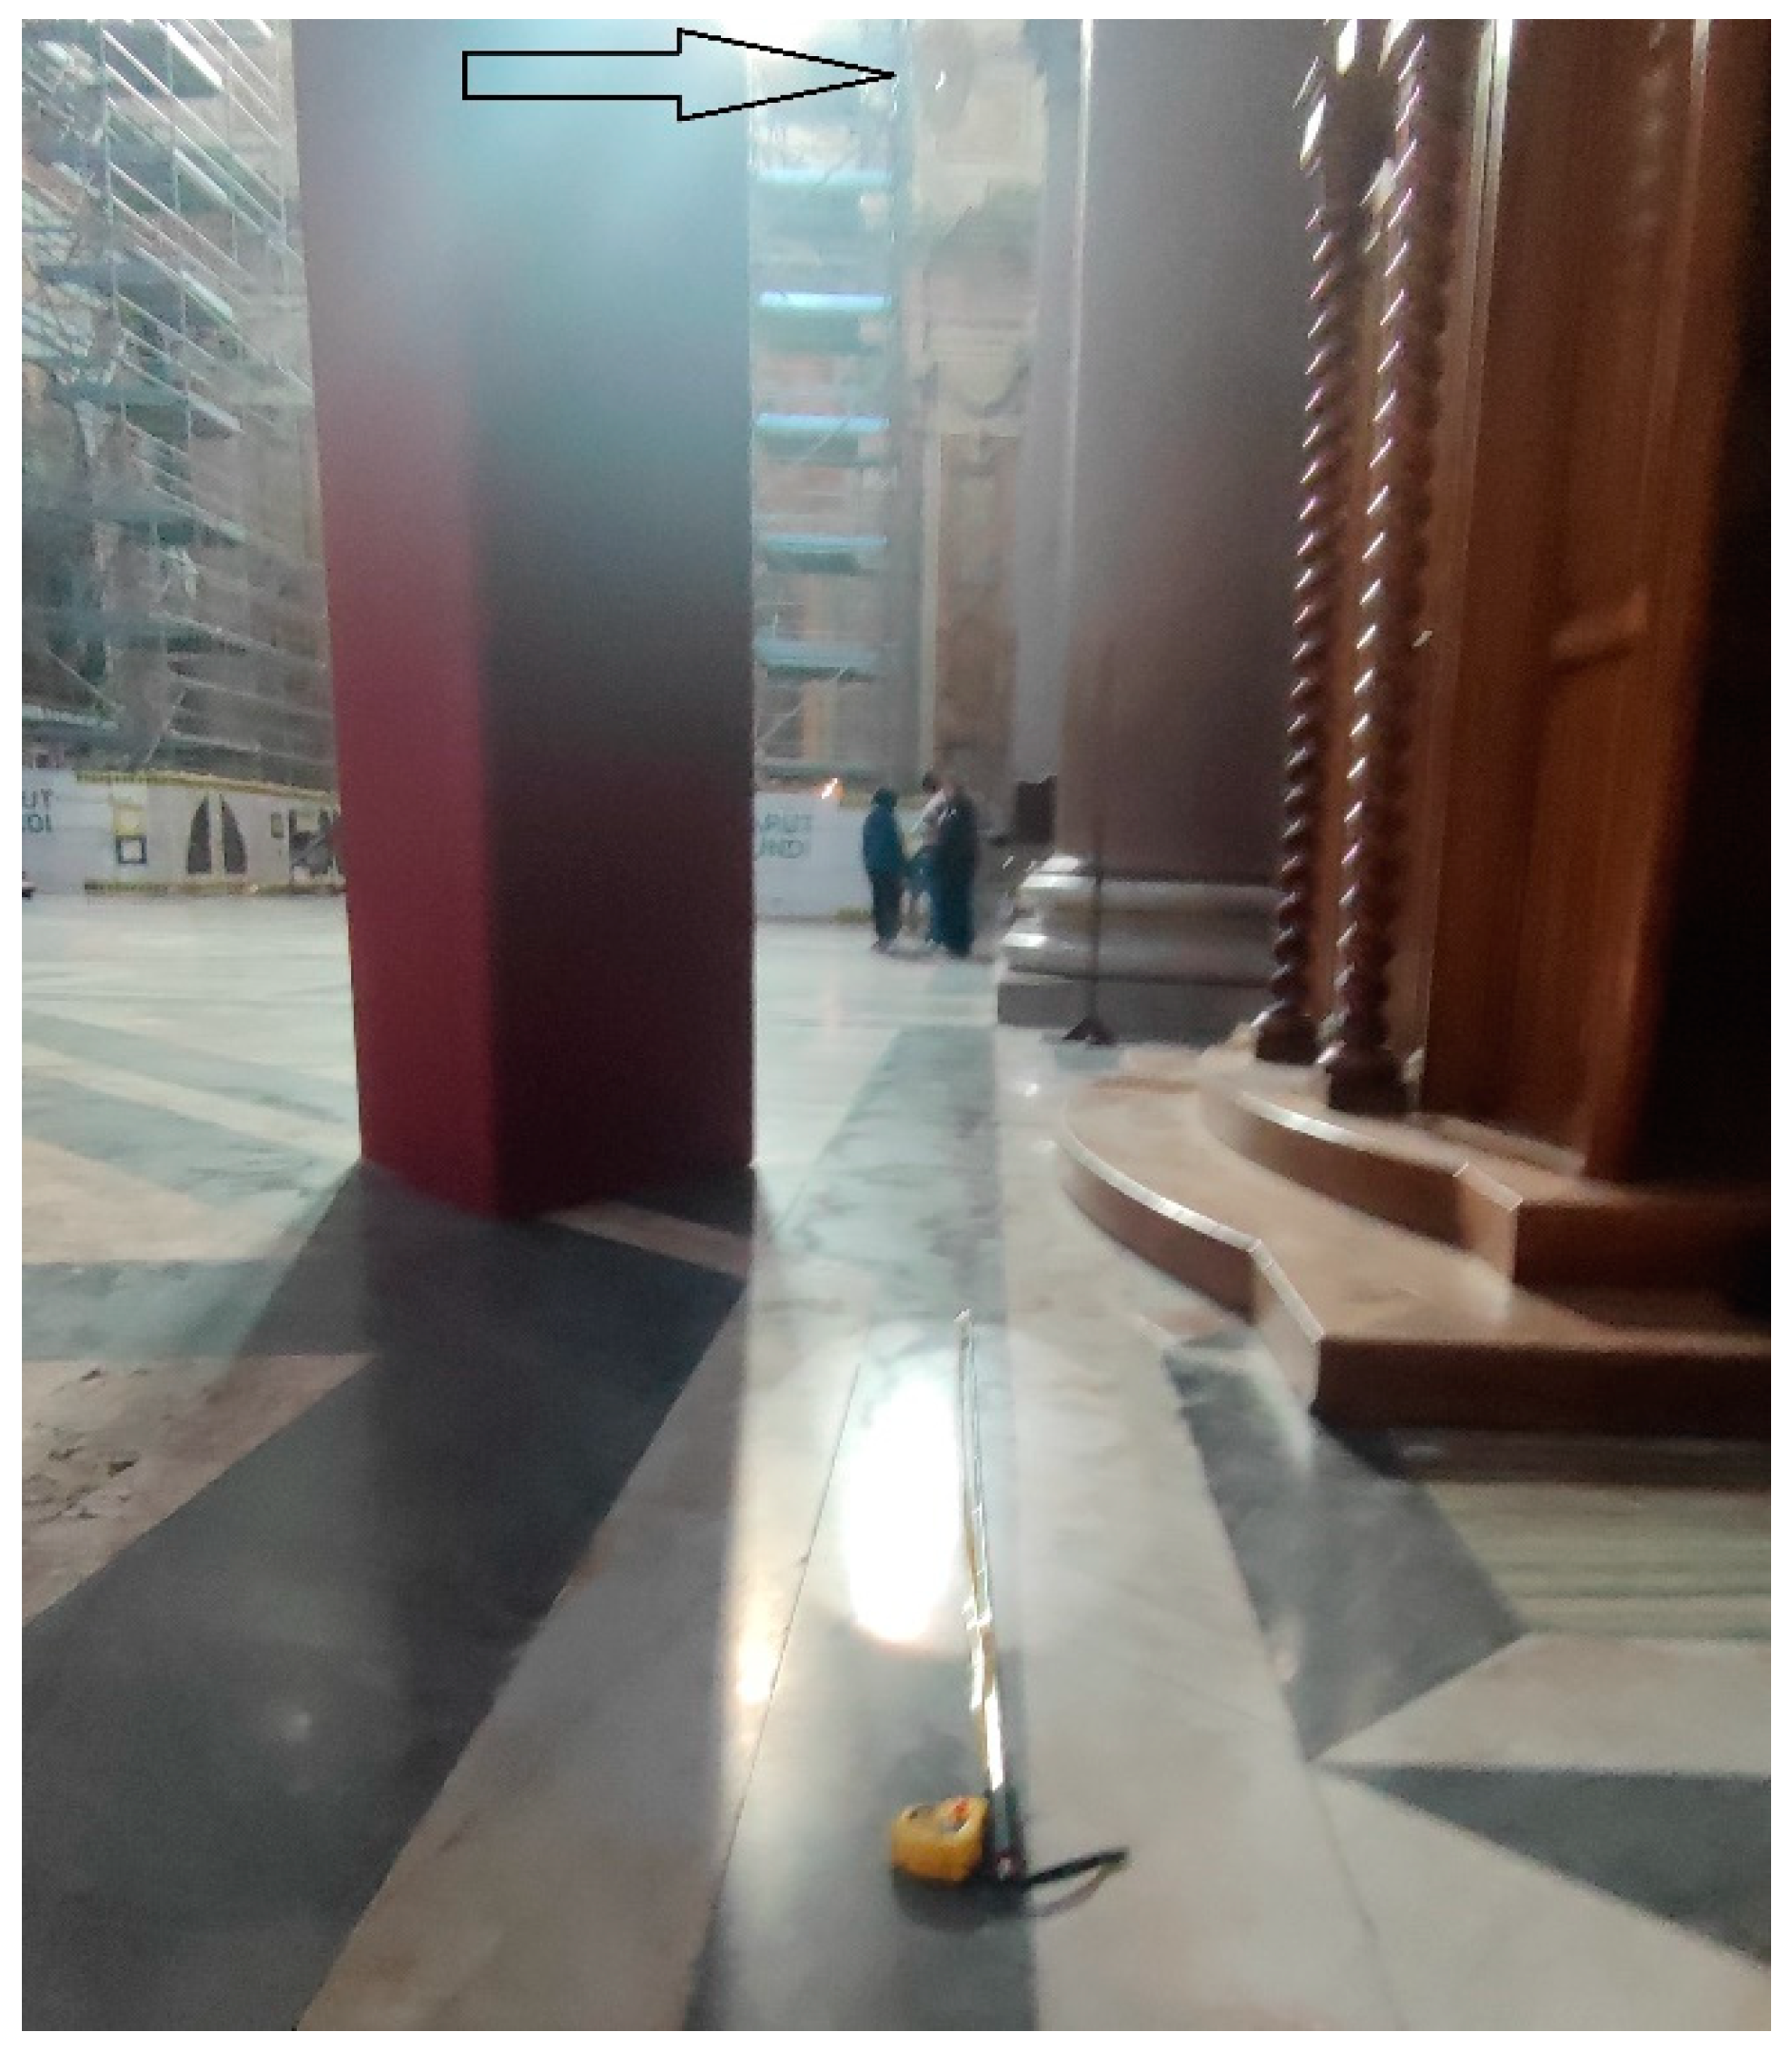
Figure 5.
The red-ringed image of the Sun at 9:43:56 of 11 February 2025. Its length is 1248 mm. We measured solar images with the Sun as low as 20° as in Bologna’s winter solstices, and up to 1.6 m long. The black arrow on the movable screen shows the pinhole.
Figure 5.
The red-ringed image of the Sun at 9:43:56 of 11 February 2025. Its length is 1248 mm. We measured solar images with the Sun as low as 20° as in Bologna’s winter solstices, and up to 1.6 m long. The black arrow on the movable screen shows the pinhole.
6. Stellar Aberration in Bianchini’s Observations
The first star observed to set up the meridian line in the Basilica of St. Maria degli Angeli was the Polaris (Fugure 8), in order to measure the latitude of the pinhole.
The stellar transits of Sirius (Fugure 7) were used to fix a time reference for the solar transits. It was observed, even in daytime, with a small telescope on the meridian line.11
Figure 6.
The “Anni Cardines” of 1703, i.e. the two solstices and the two equinoxes. This marble inscription is located in the presbytherium of the Basilica, it is 140 x 60 cm.
Figure 6.
The “Anni Cardines” of 1703, i.e. the two solstices and the two equinoxes. This marble inscription is located in the presbytherium of the Basilica, it is 140 x 60 cm.
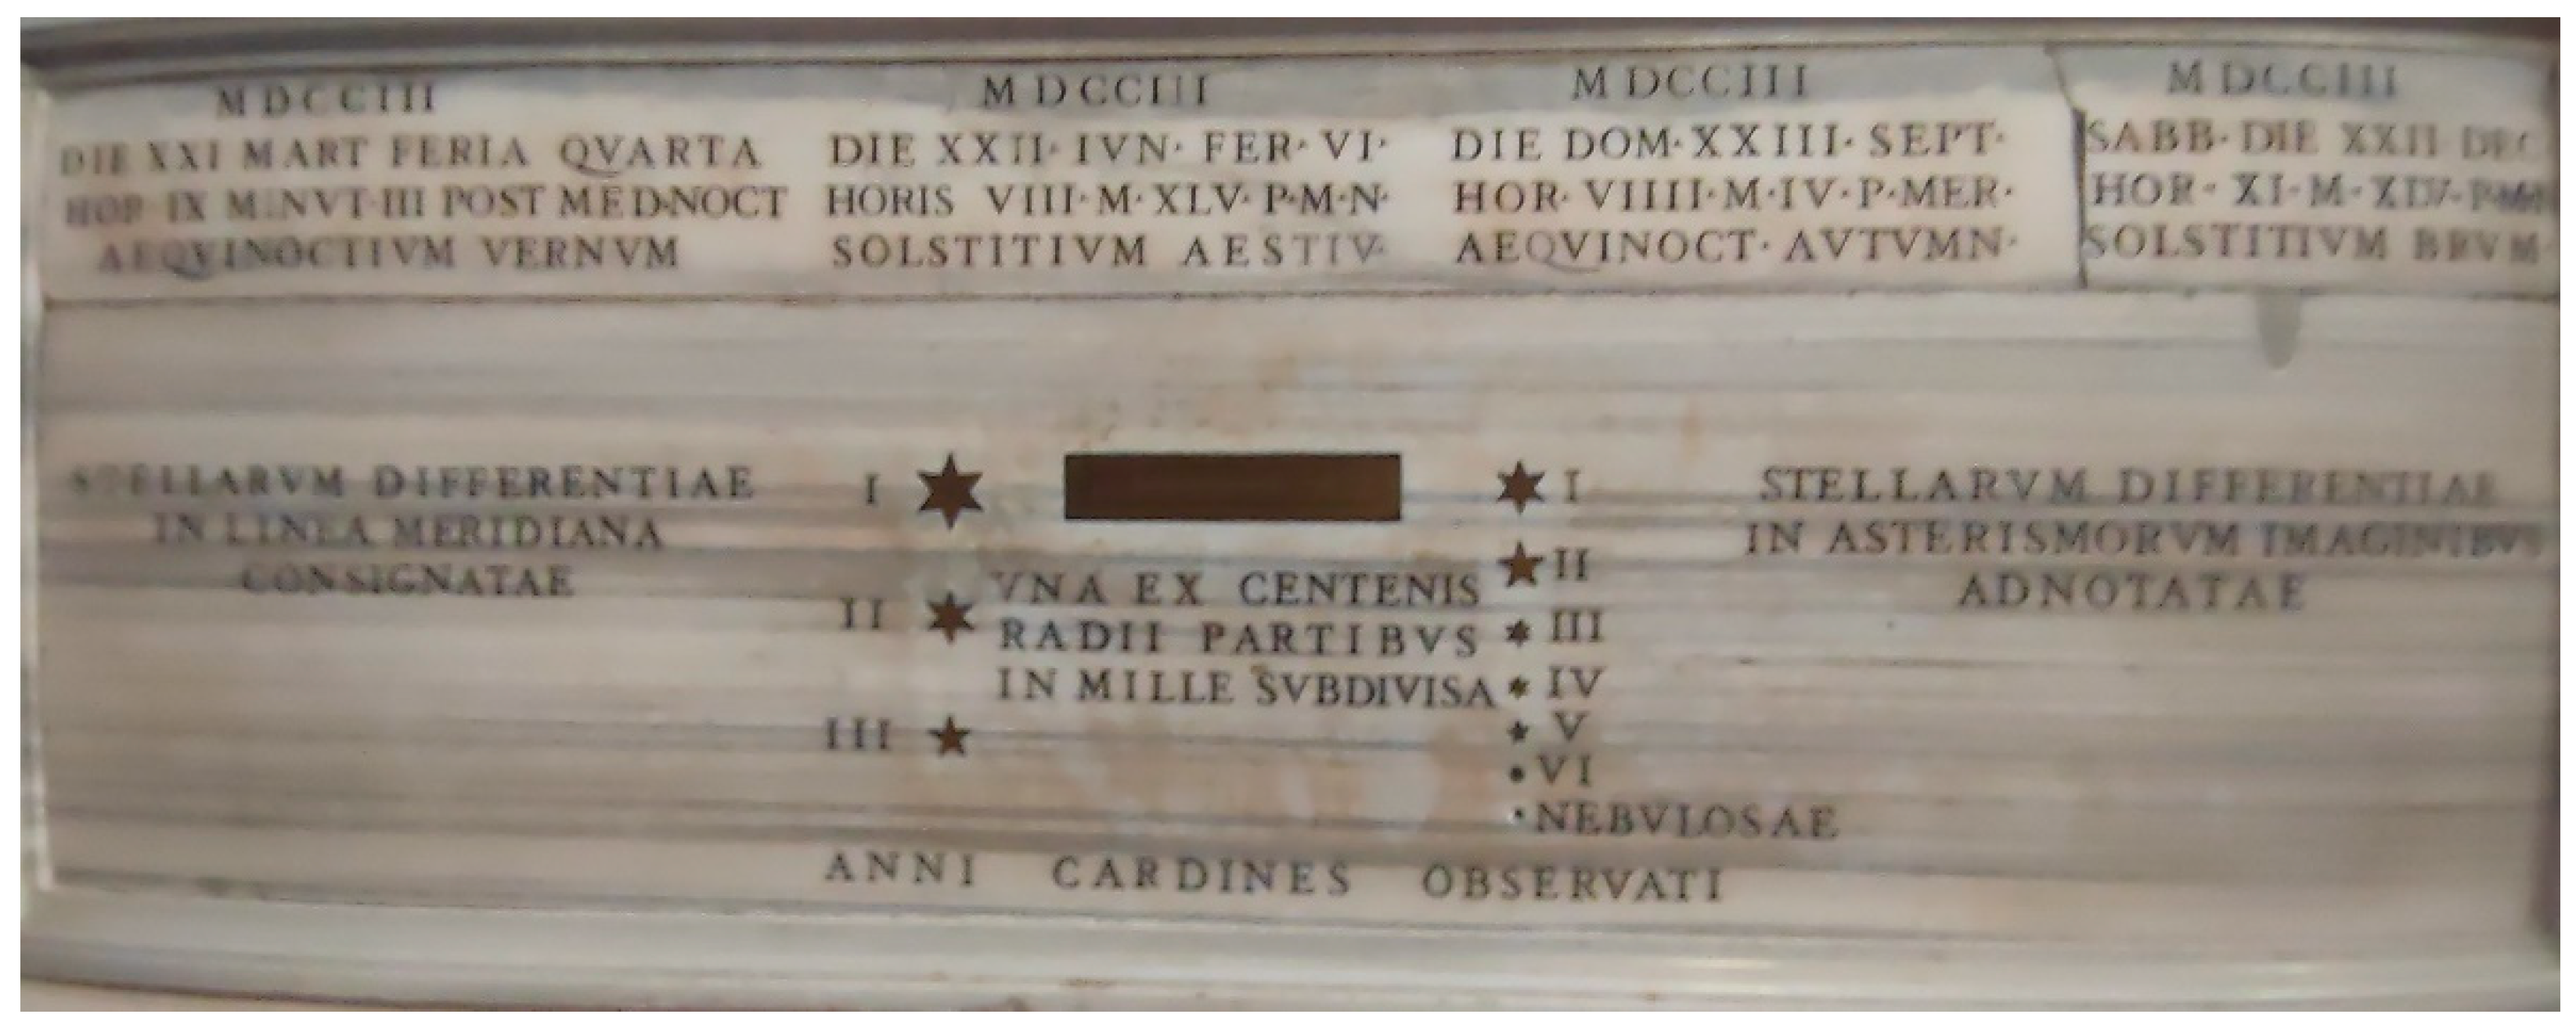
Figure 7.
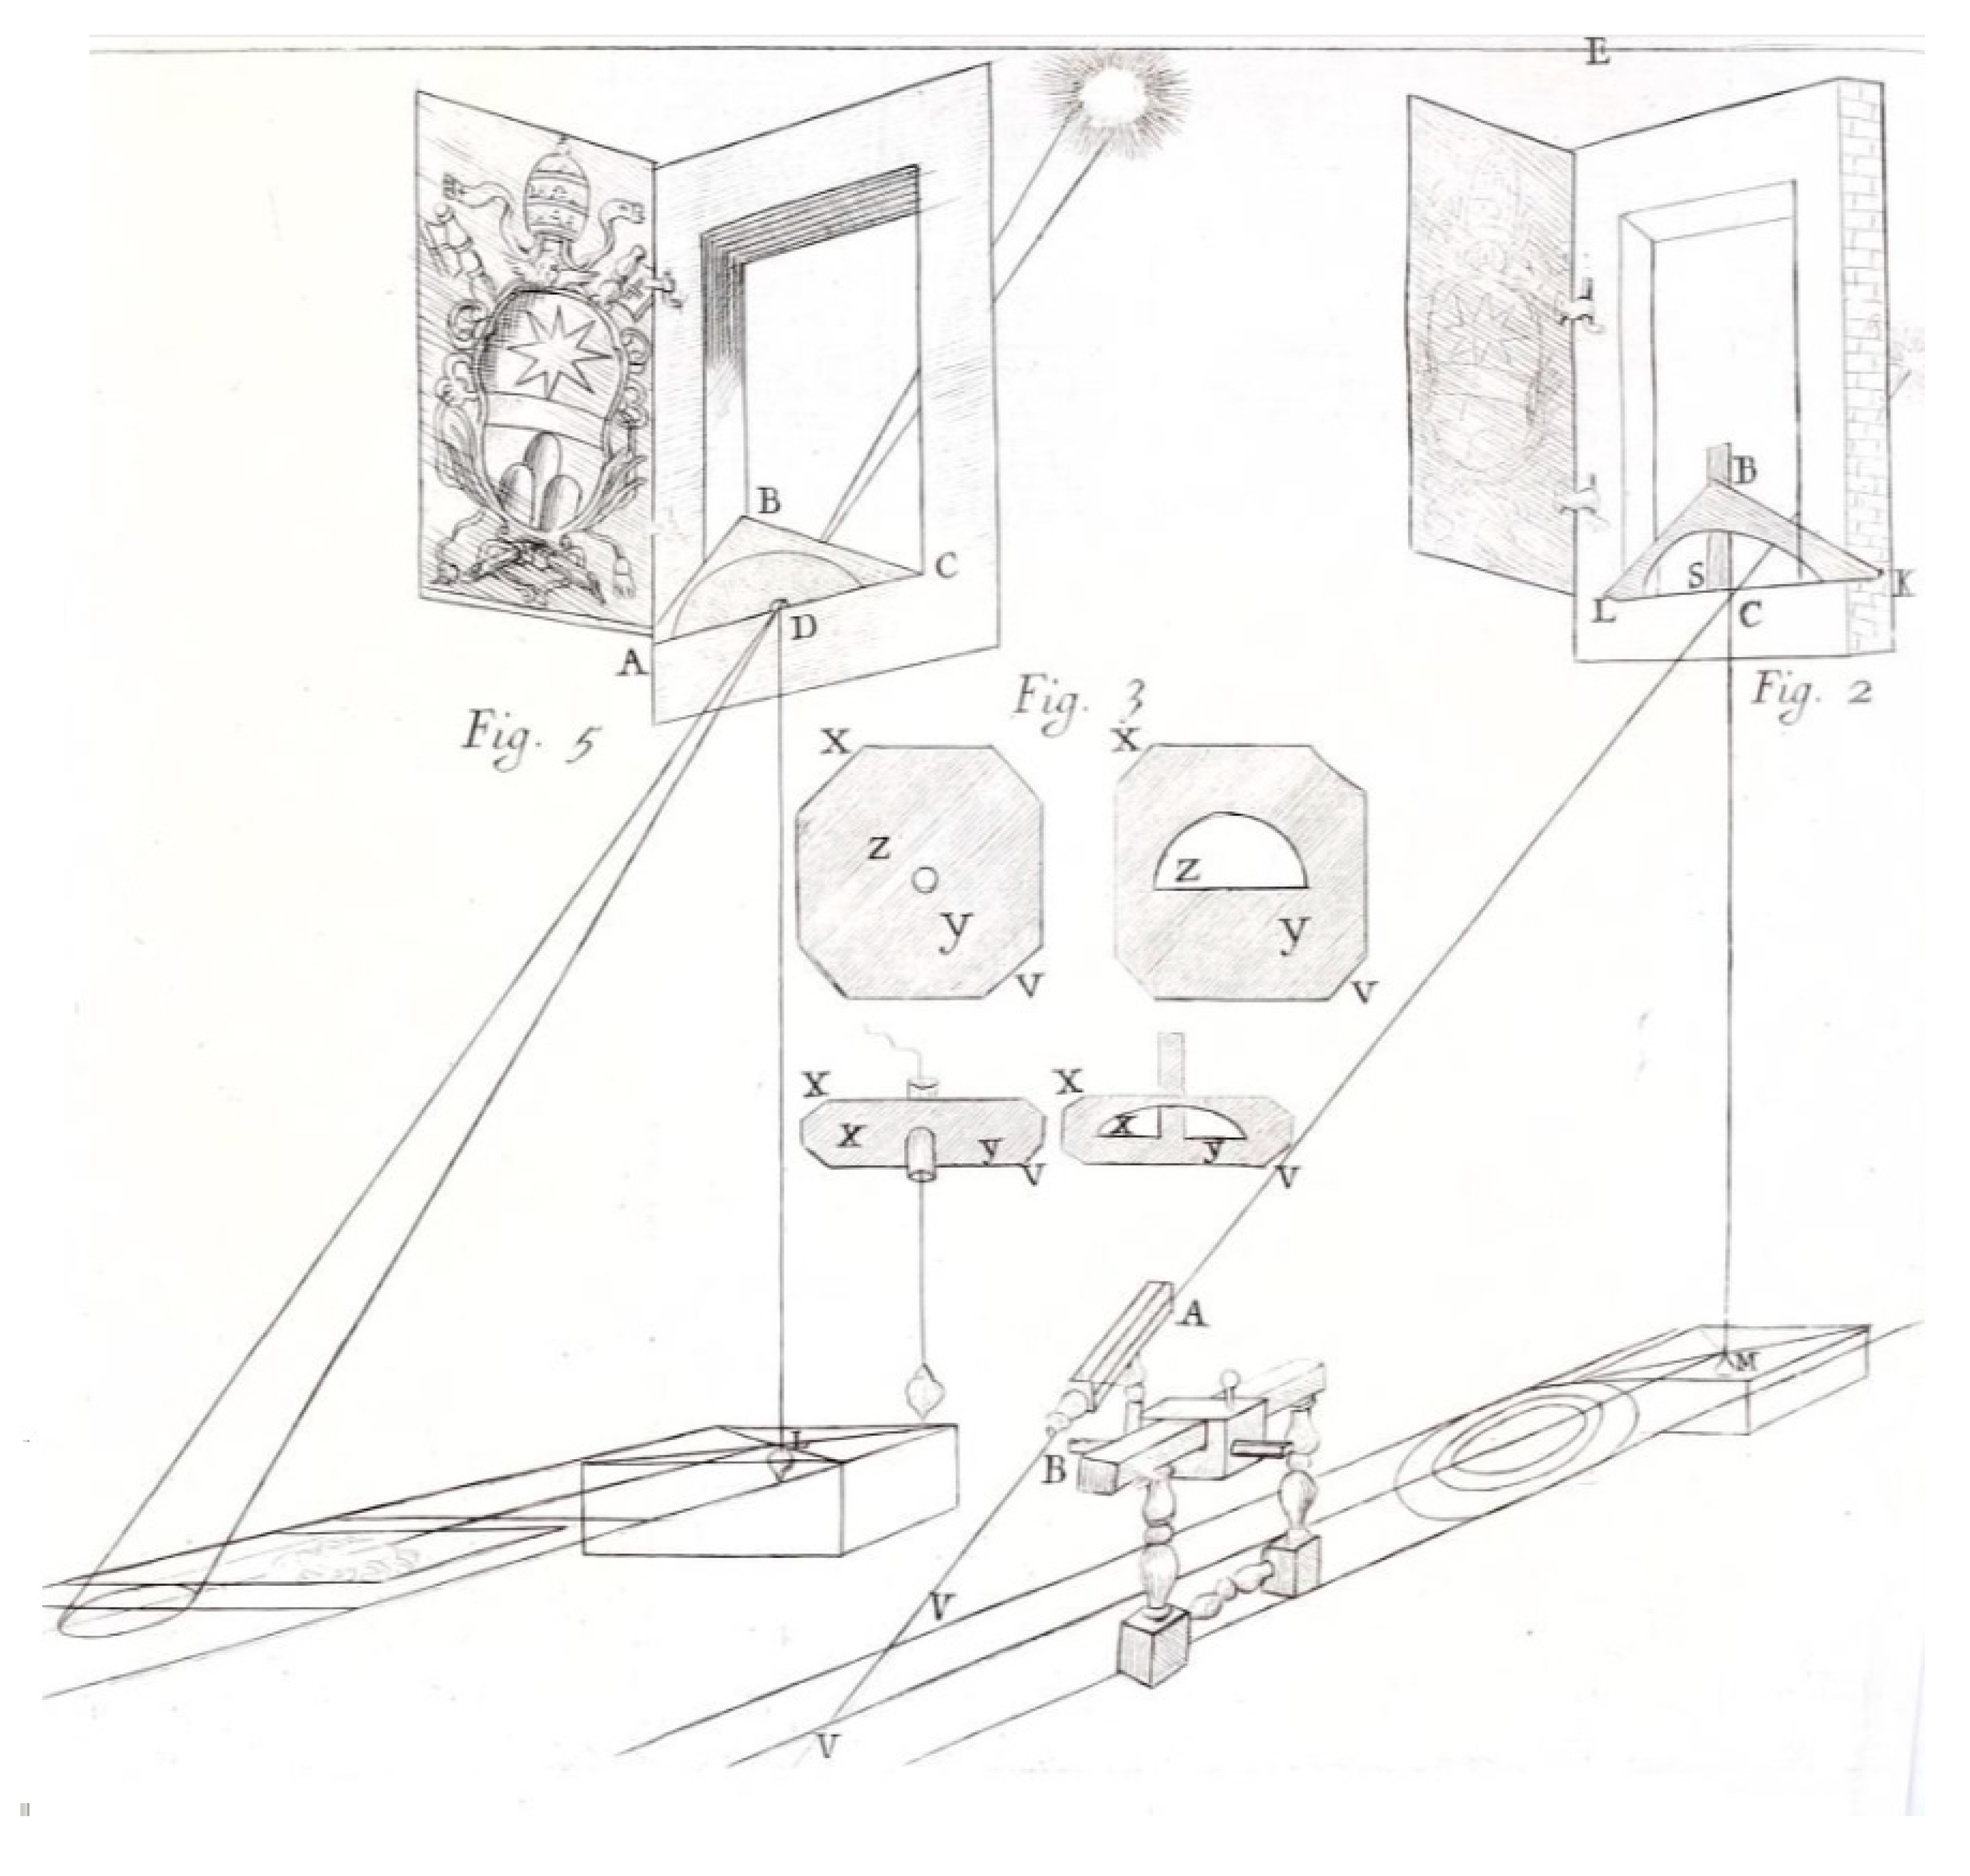
The small telescope BA used by Bianchini (1703) to see Sirius’ meridian transits and project them on the meridian line. The window ADC cannot be open nowadays, but a similar method has been used to observe through the pinhole α Tauri and β Orionis.
Figure 7.
The small telescope BA used by Bianchini (1703) to see Sirius’ meridian transits and project them on the meridian line. The window ADC cannot be open nowadays, but a similar method has been used to observe through the pinhole α Tauri and β Orionis.
6.1. Polaris
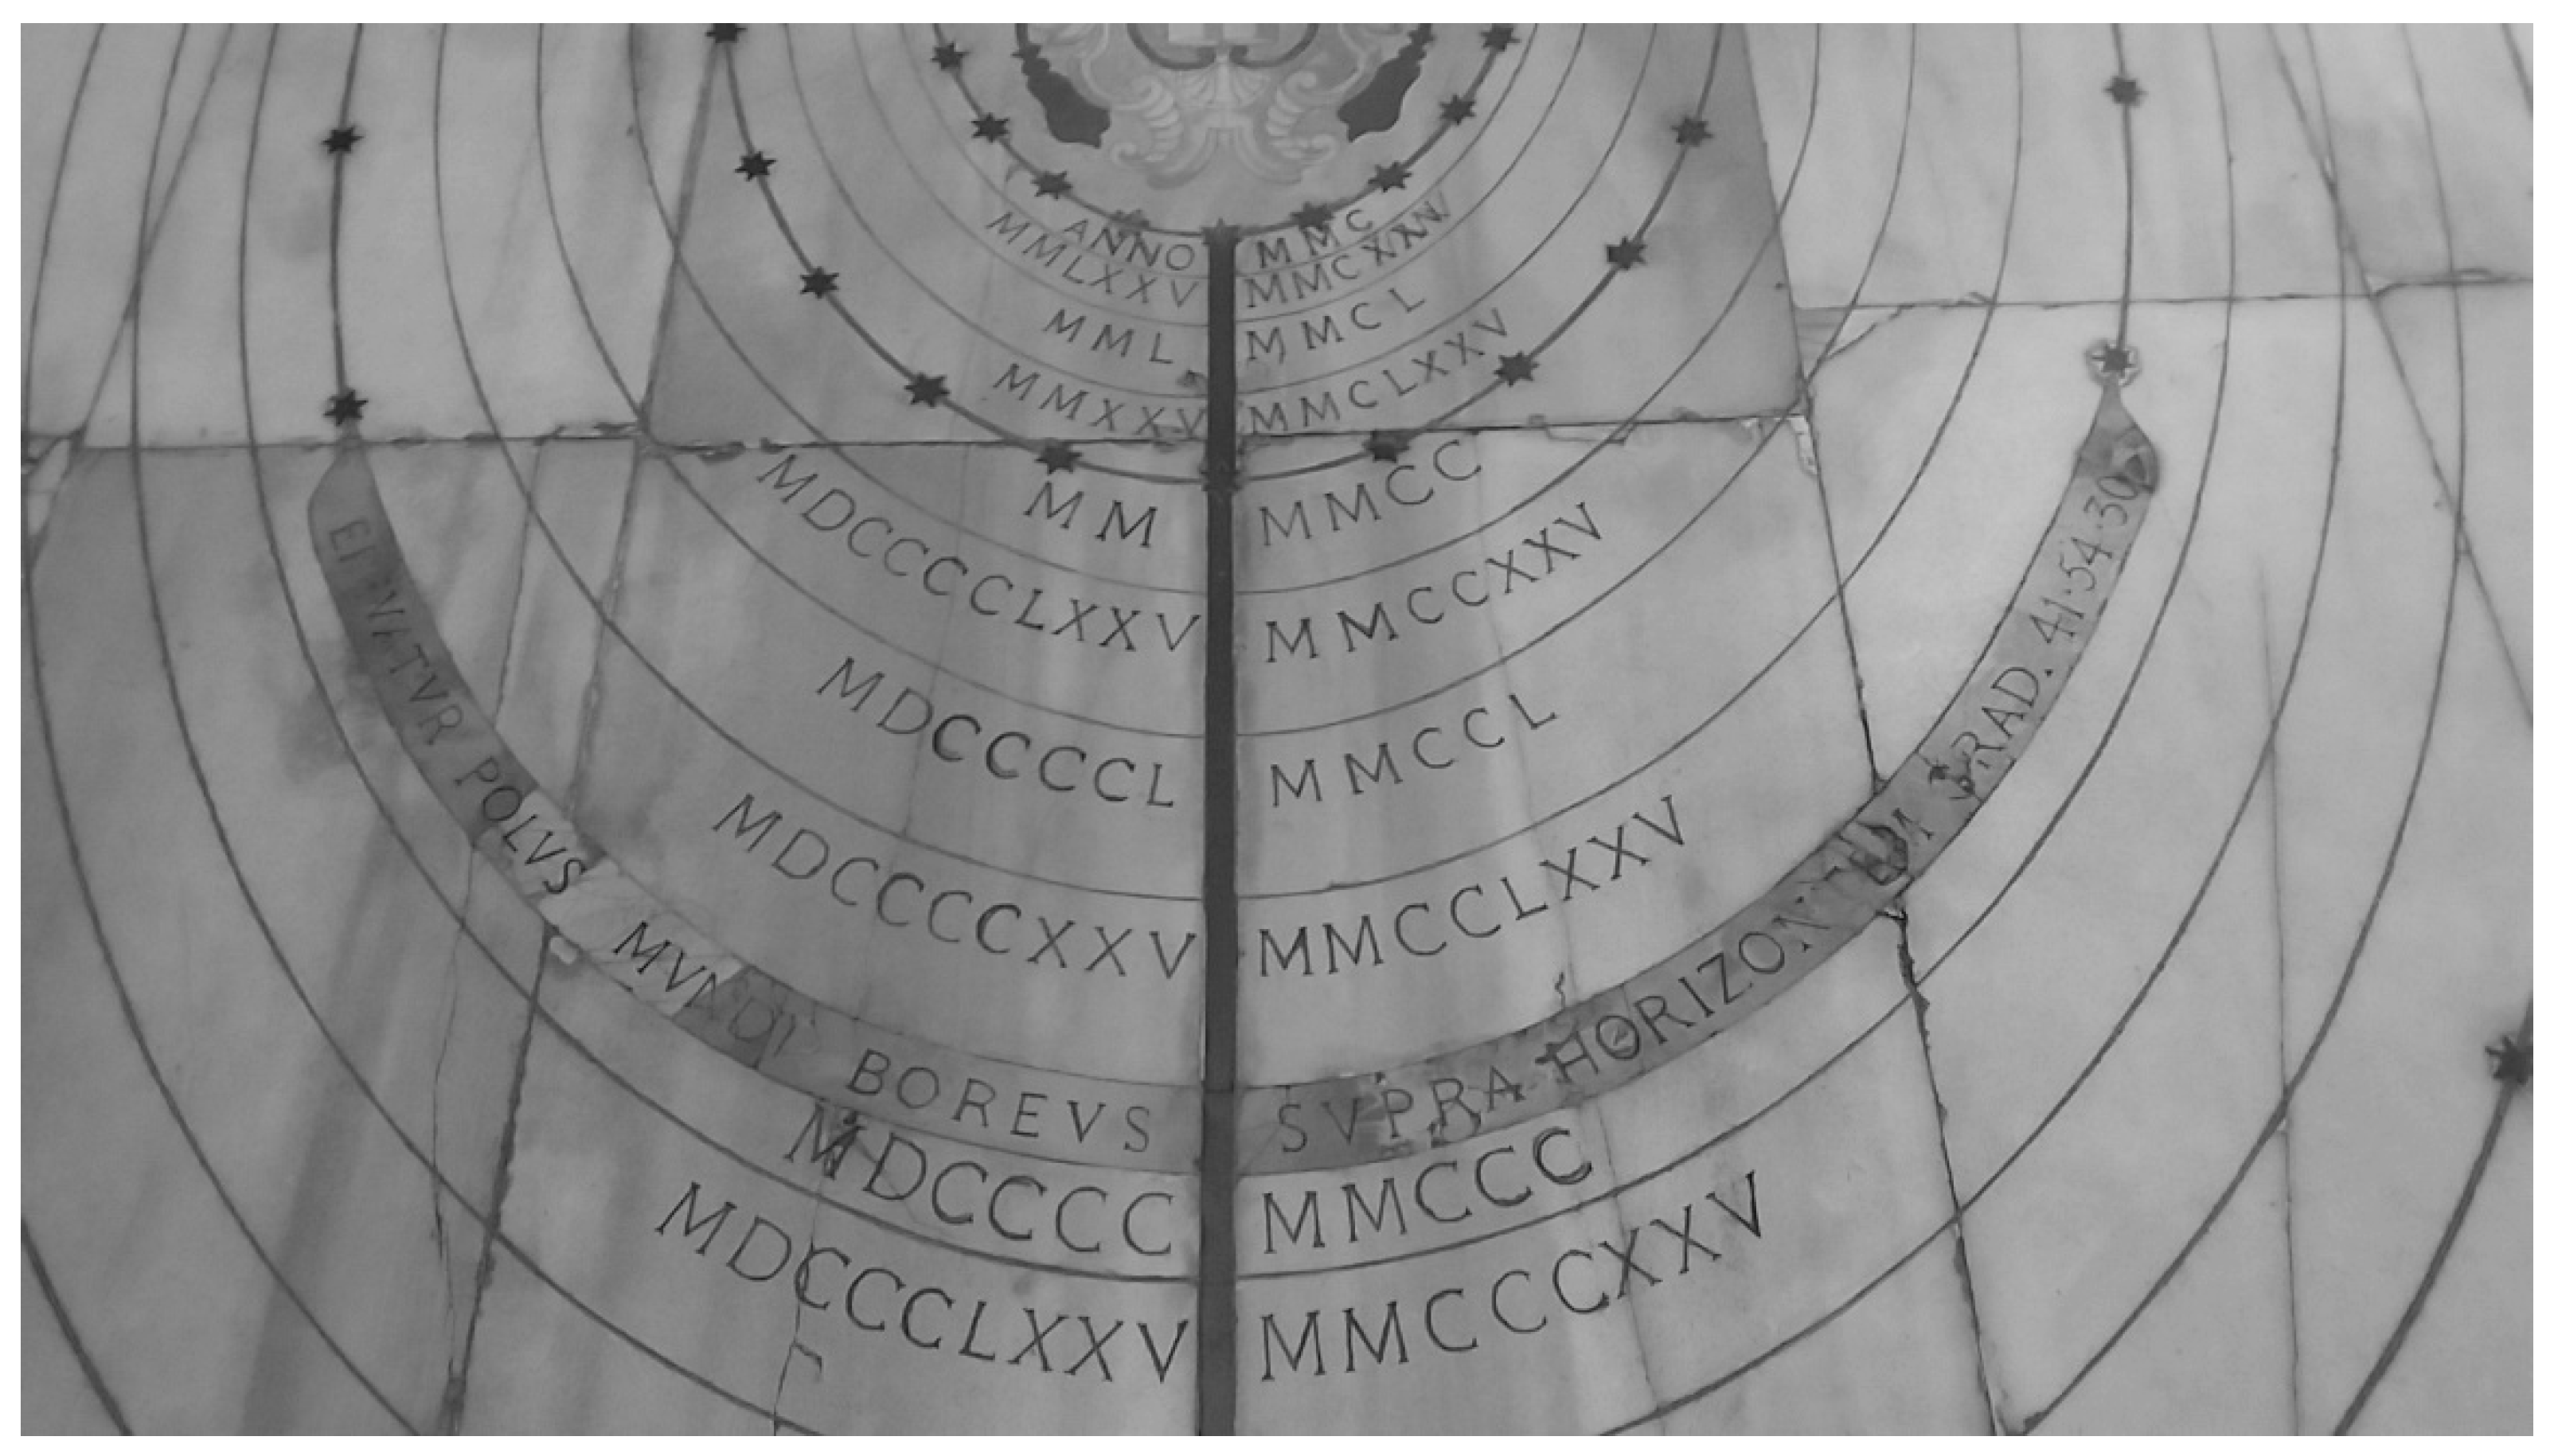
The operations to measure the latitude of the pinhole with the uppermost precision were made from 1 to 8 January 1701. Bianchini created for this purpose the Northern or Boreal Gnomon (Fugure 8). On 1st January 1701 the star encompassed both upper (18:01) and lower (6:00) transits during the night. The Sun was respectively near sunset and sunrise positions, at about 90° from the stellar line of sight. The Sun is always a 90° from the direction of the Earth’s orbit velocity. The stellar aberration in such cases was about +16” for the Polaris (Sigismondi, 2008), and it is the same for the upper and the lower transit because the Sun-Earth-Star angle is the same, and the direction of the stellar aberration is the same of a vector composition between starlight and Earth’s orbital velocity.12 The measure published by Bianchini for the pinhole latitude was 41°54’27” – 16” yields 41°54’11” of the correct value with GPS techniques. On the marbles of the Jubilees’ ellipses of Polaris, from 1700 to 2500, Bianchini rounded this number to 41°54’30” (Fugure 9).
Figure 8.
The observation of the Polaris on the Northern Gnomon, Bianchini scheme (1703).
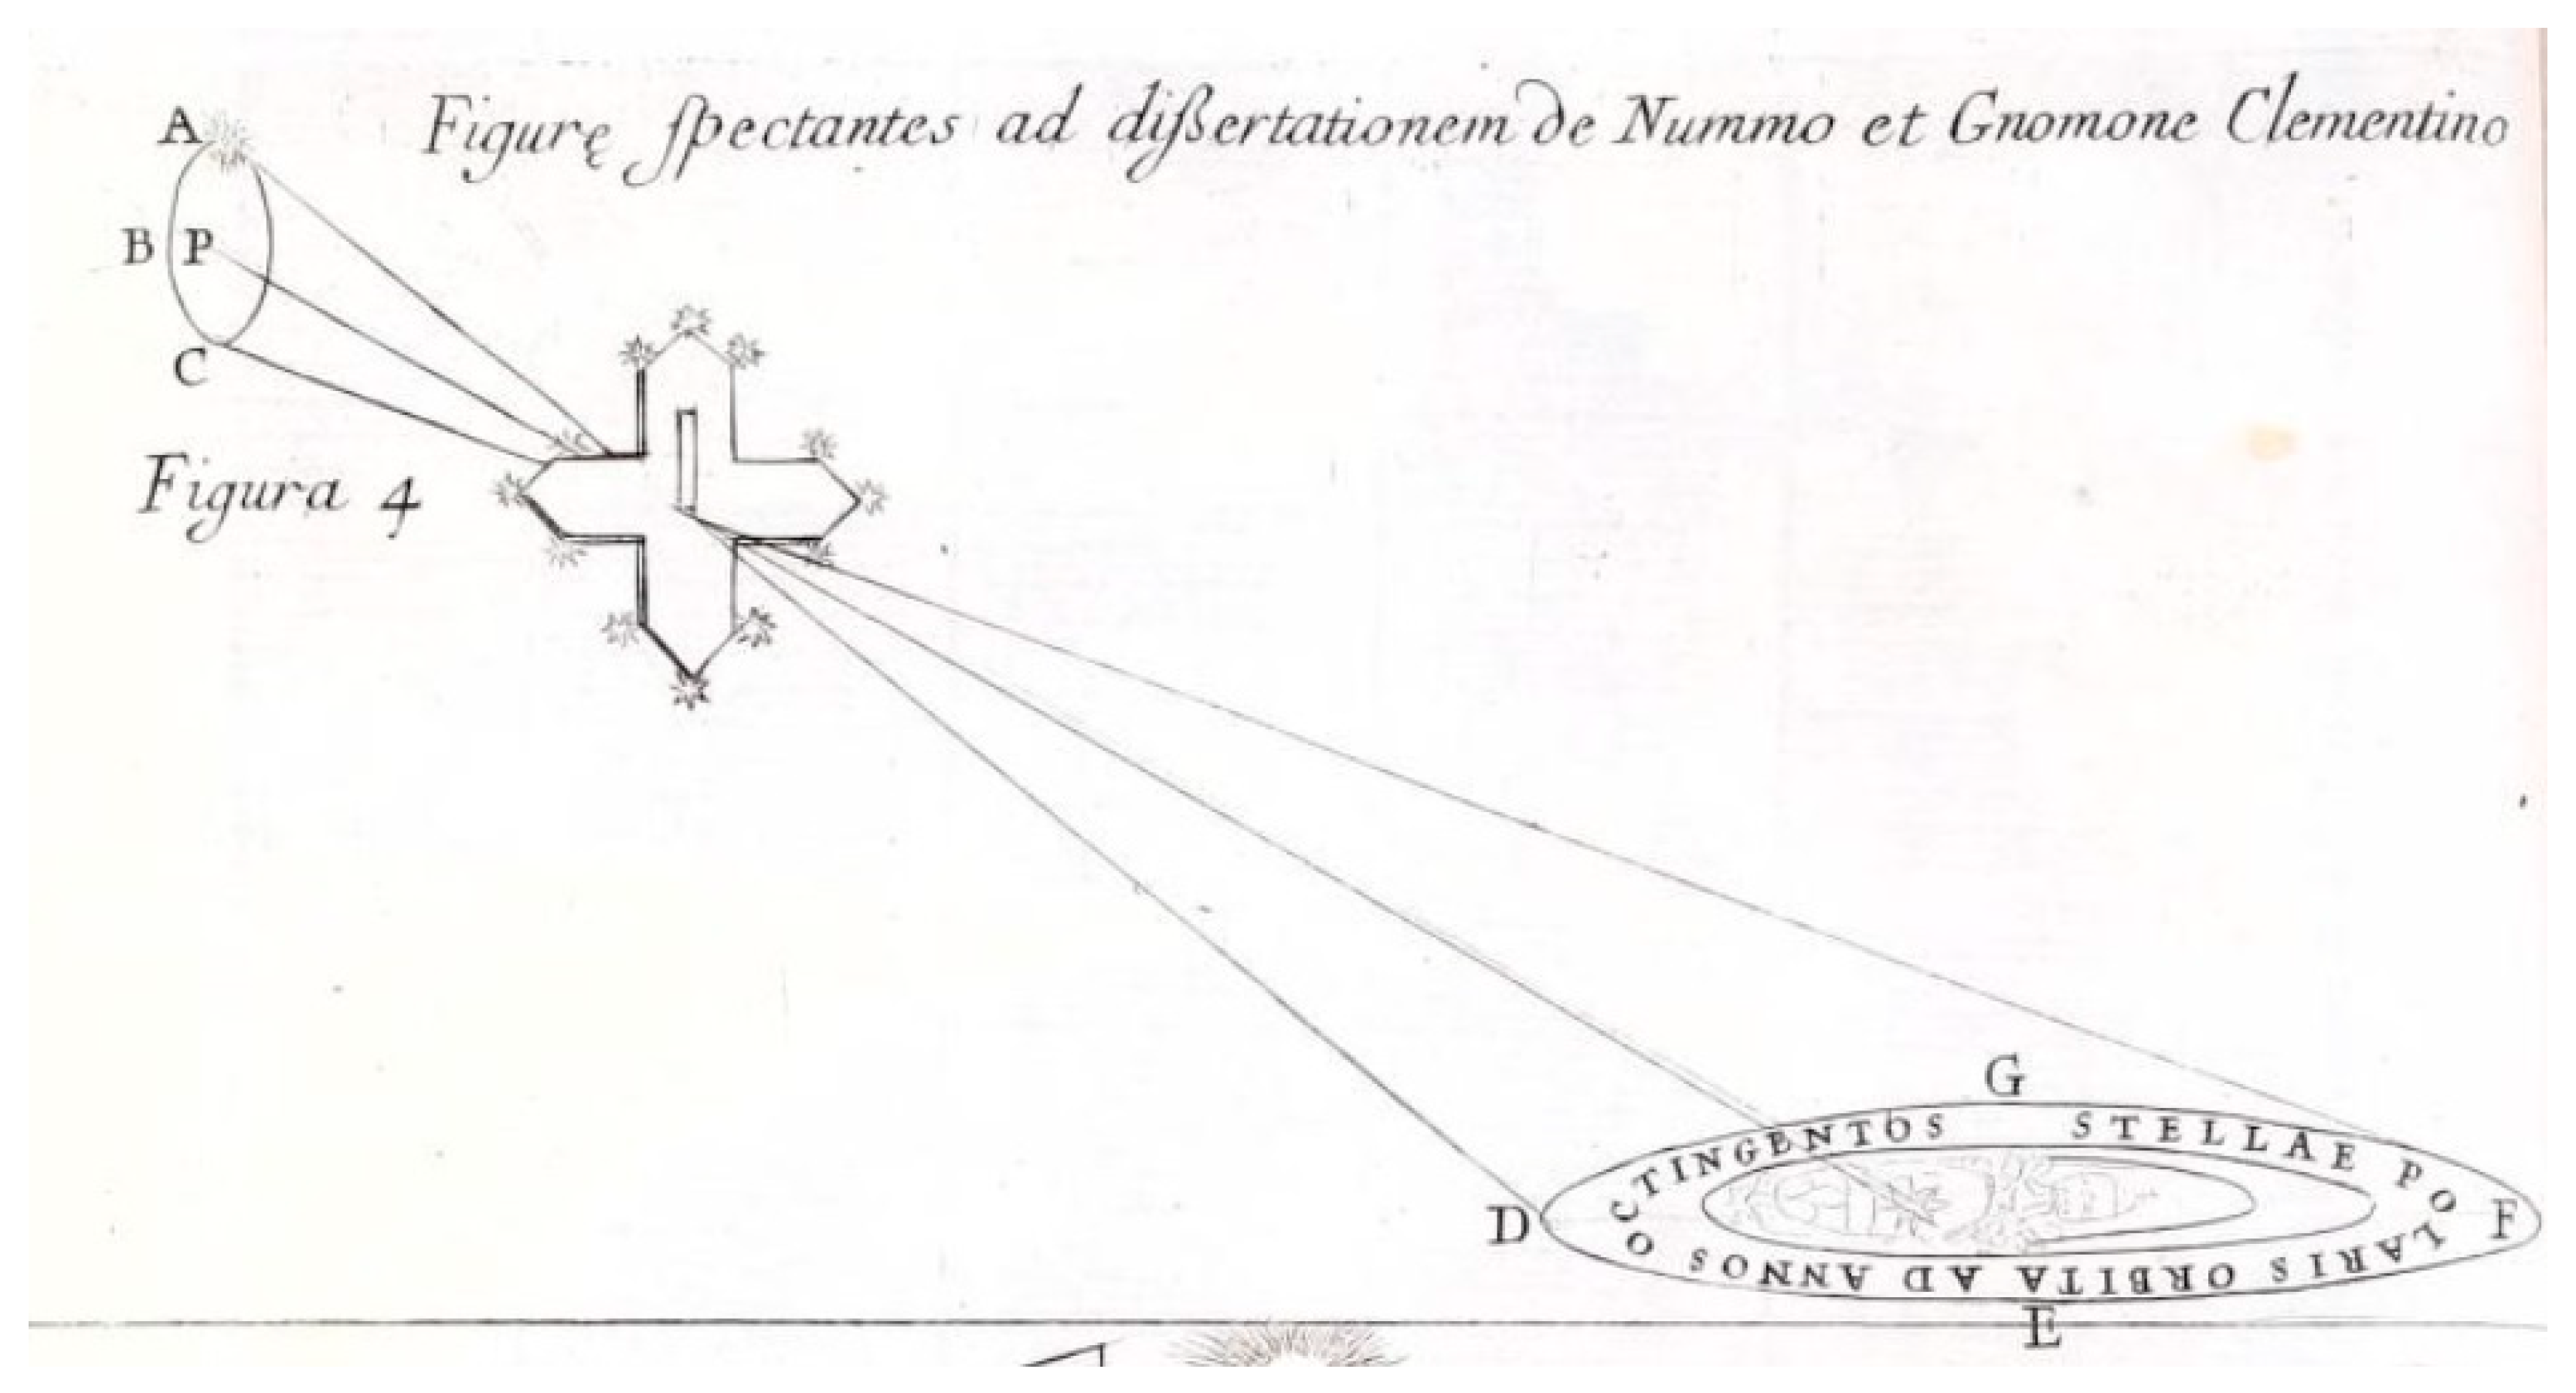
Figure 9.
Part of the ellipses of the Polaris on the Northern meridian line of St. Maria degli Angeli. Elevatur polus Mundi boreus supra horizontem grad. 41·54·30. The elevation of the celestial North pole is deg. 41·54·30. The uppermost ellipse corresponds to the year MMC (2100 in Roman numbers) when the Polaris will be closer to the North celestial pole.
6.2.1. Sirius: Used as a Reference Fixed Star for “Anni Cardines”
Solstices and equinoxes instants of 1703, published by Bianchini on De Nummo et Gnomone Clementino, as well as on a marble inscription framed in the wall of the presbyterium of the Basilica, are affected by the aberration of Sirius. Sirius’ light has an aberration either positive, zero and negative along the year, while the solar one is always positive +20.56”. The influence of Sirius’ aberration in the time difference with the Sun is maximum in winter when it is opposite to the Sun, zero in summer when they are in conjunction and intermediate at the equinoxes while the Earth’s orbit occurs along the line of sight with Sirius without its aberration.
The stellar aberration is, technically, a relativistic effect. James Bradley firstly reported it in 1727. The dates of the “anni cardines” (Fugure 6) , the solstices and the equinoxes, measured in St. Maria degli Angeli for 1703 differ of several minutes with respect to the ephemerides calculated instants (Sigismondi, 2023).
The effect of the stellar aberration in St. Maria degli Angeli is entangled with the global and the local deviation of the meridian line. Ruggero G. Boscovich in 1750 was able to find both deviations of the line, and today we know precisely their values: the overall deviation of the meridian line is 5’11” East and an extra East offset of +2.5 s (in solar transit time) is present near the equinoxes; Boscovich called it “sinus”.
The IGEA campaign was dedicated to find the exact position of this “sinus”, which was necessary to understand completely the nature of the error of 50 minutes in the 1703 summer solstice timing (Fugure 6 compared with the ephemerides, once retrieved the reference mean solar time used in 1700). The “sinus” of 5 mm Eastward has been found near the equinoxes. Presently13 the deviation of the Clementine Gnomon gives a delay for the solar transit with respect to the true meridian of 10 s (Summer) to 23 s (Winter),14 while Sirius is always 18 s in delay. The aberration’ ellipse is 40” wide: less than 3 seconds in transit times differences from Summer (solar conjunction of Sirius) to Winter (solar opposition). These three seconds of time, as the star was considered as fixed, become a shift in the solstices instants. The solar motion among the stars is nearly 1°/day, on the meridian line the angular velocity is nearly 15”/s, thus 3 s correspond to 45” of celestial angle.The ratio 45”:3600”=x: 1 day (=1440 min) gives the delay x=45·1440/3600= 18 minutes. This is the maximum contribution of the aberration. The contribution of the meridian’s deviation is larger: since the time difference between solar and Sirius transits is the Right Ascension difference, there is an error up to 8 s (=18-10 s) at the Summer solstice, corresponding to 8/86400·360°≈ 120” on the ecliptic. The Sun at about 1°/day covers the 120” angle in 48 minutes (Sigismondi, 2023). The presence of the “sinus” at the equinoxes completes the explanation of the differences between the marble inscription of Fugure 5 and modern ephemerides.The systematic errors of the great meridian line, existent since the beginning of the construction of this instrument, and the stellar aberration of Sirius, influenced the calculated dates for the anni cardines of 1703. They have been obtained with the timing of the solar transits compared with the Sirius’ ones in the hypothesis of a perfectly fixed star (no aberration) and a perfectly North-South meridian line.
6.2.2. Sirius as Seasonally Moving Star
Another confirmation of the detection of such tiny effect on Sirius was obtained with the projected positions technique, adopted also for the Polaris’ measurements. As in figure 6 Sirius’ direction was prolonged backwards to the meridian line VV.Bianchini could observe the stars through the line BC of figure 6, and this line was realized in the window above the pinhole C. Even if there is no detailed description of these observations, the possibility to open the window was exploited indeed to observe the star slightly before and after the meridian transit in order to recover precisely its projection on the meridian line, and the transit time as well.
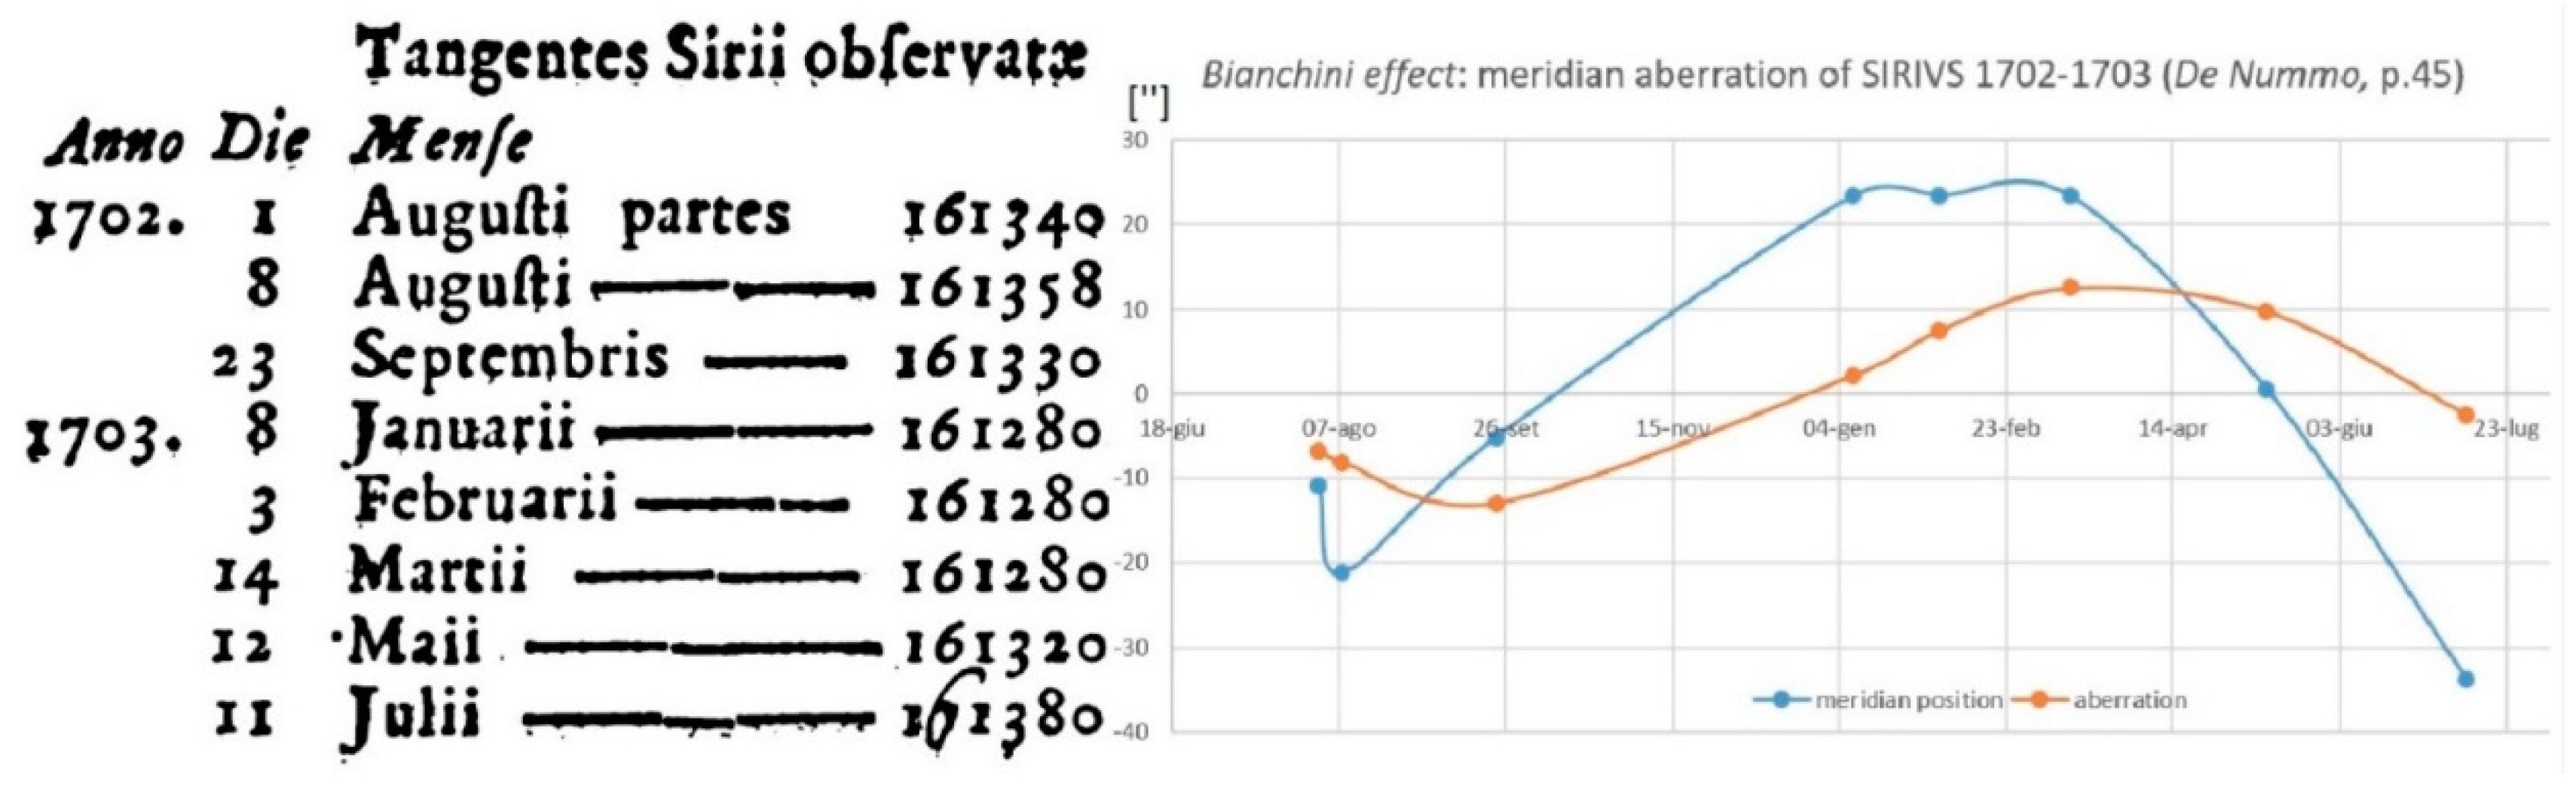
The positions of Sirius were taken each month, and a motion appeared along the year. Bianchini attributed it to the seasonal variations of the refraction, but Sigismondi (2021) first demonstrated that it was the aberration’s ellipse acting on the starlight. The largest difference in declination was from February/March to July with an amplitude of 0.1 centesimal parts i.e. 20.3 mm. Bianchini detected changes as small as 3.7 mm from 1 to 8 August 1702. The precision of the measurements on the meridian line was made always at the limit of the atmospheric disturbances (Fugure 10).
Figure 10.
The position of Sirius on the meridian line, as observed by Bianchini in 1702-3. From Sigismondi (2021) with permission. The differences between red and blue lines are probably seasonal: the temperature in noon Summer / midnight Winter changes the refracting index of the atmosphere. The calibration of the meridian measures of the Sun showed a correlation of 5°C/mm and 10 hPa/mm. To explain -30” or -10 mm in Summer hot noon the temperature can act for -5 mm, but the pressure cannot do more than -1 mm, while for cold Winter +20”, or +7 mm, the temperature act for +4 mm and the higher pressure +3 mm. The Bianchini 1703 Summer data of Sirius, in daytime, have been measured with particular care from 21 June to 11 July 1703. .
7. Aldebaran and Rigel at the Clementine Gnomon
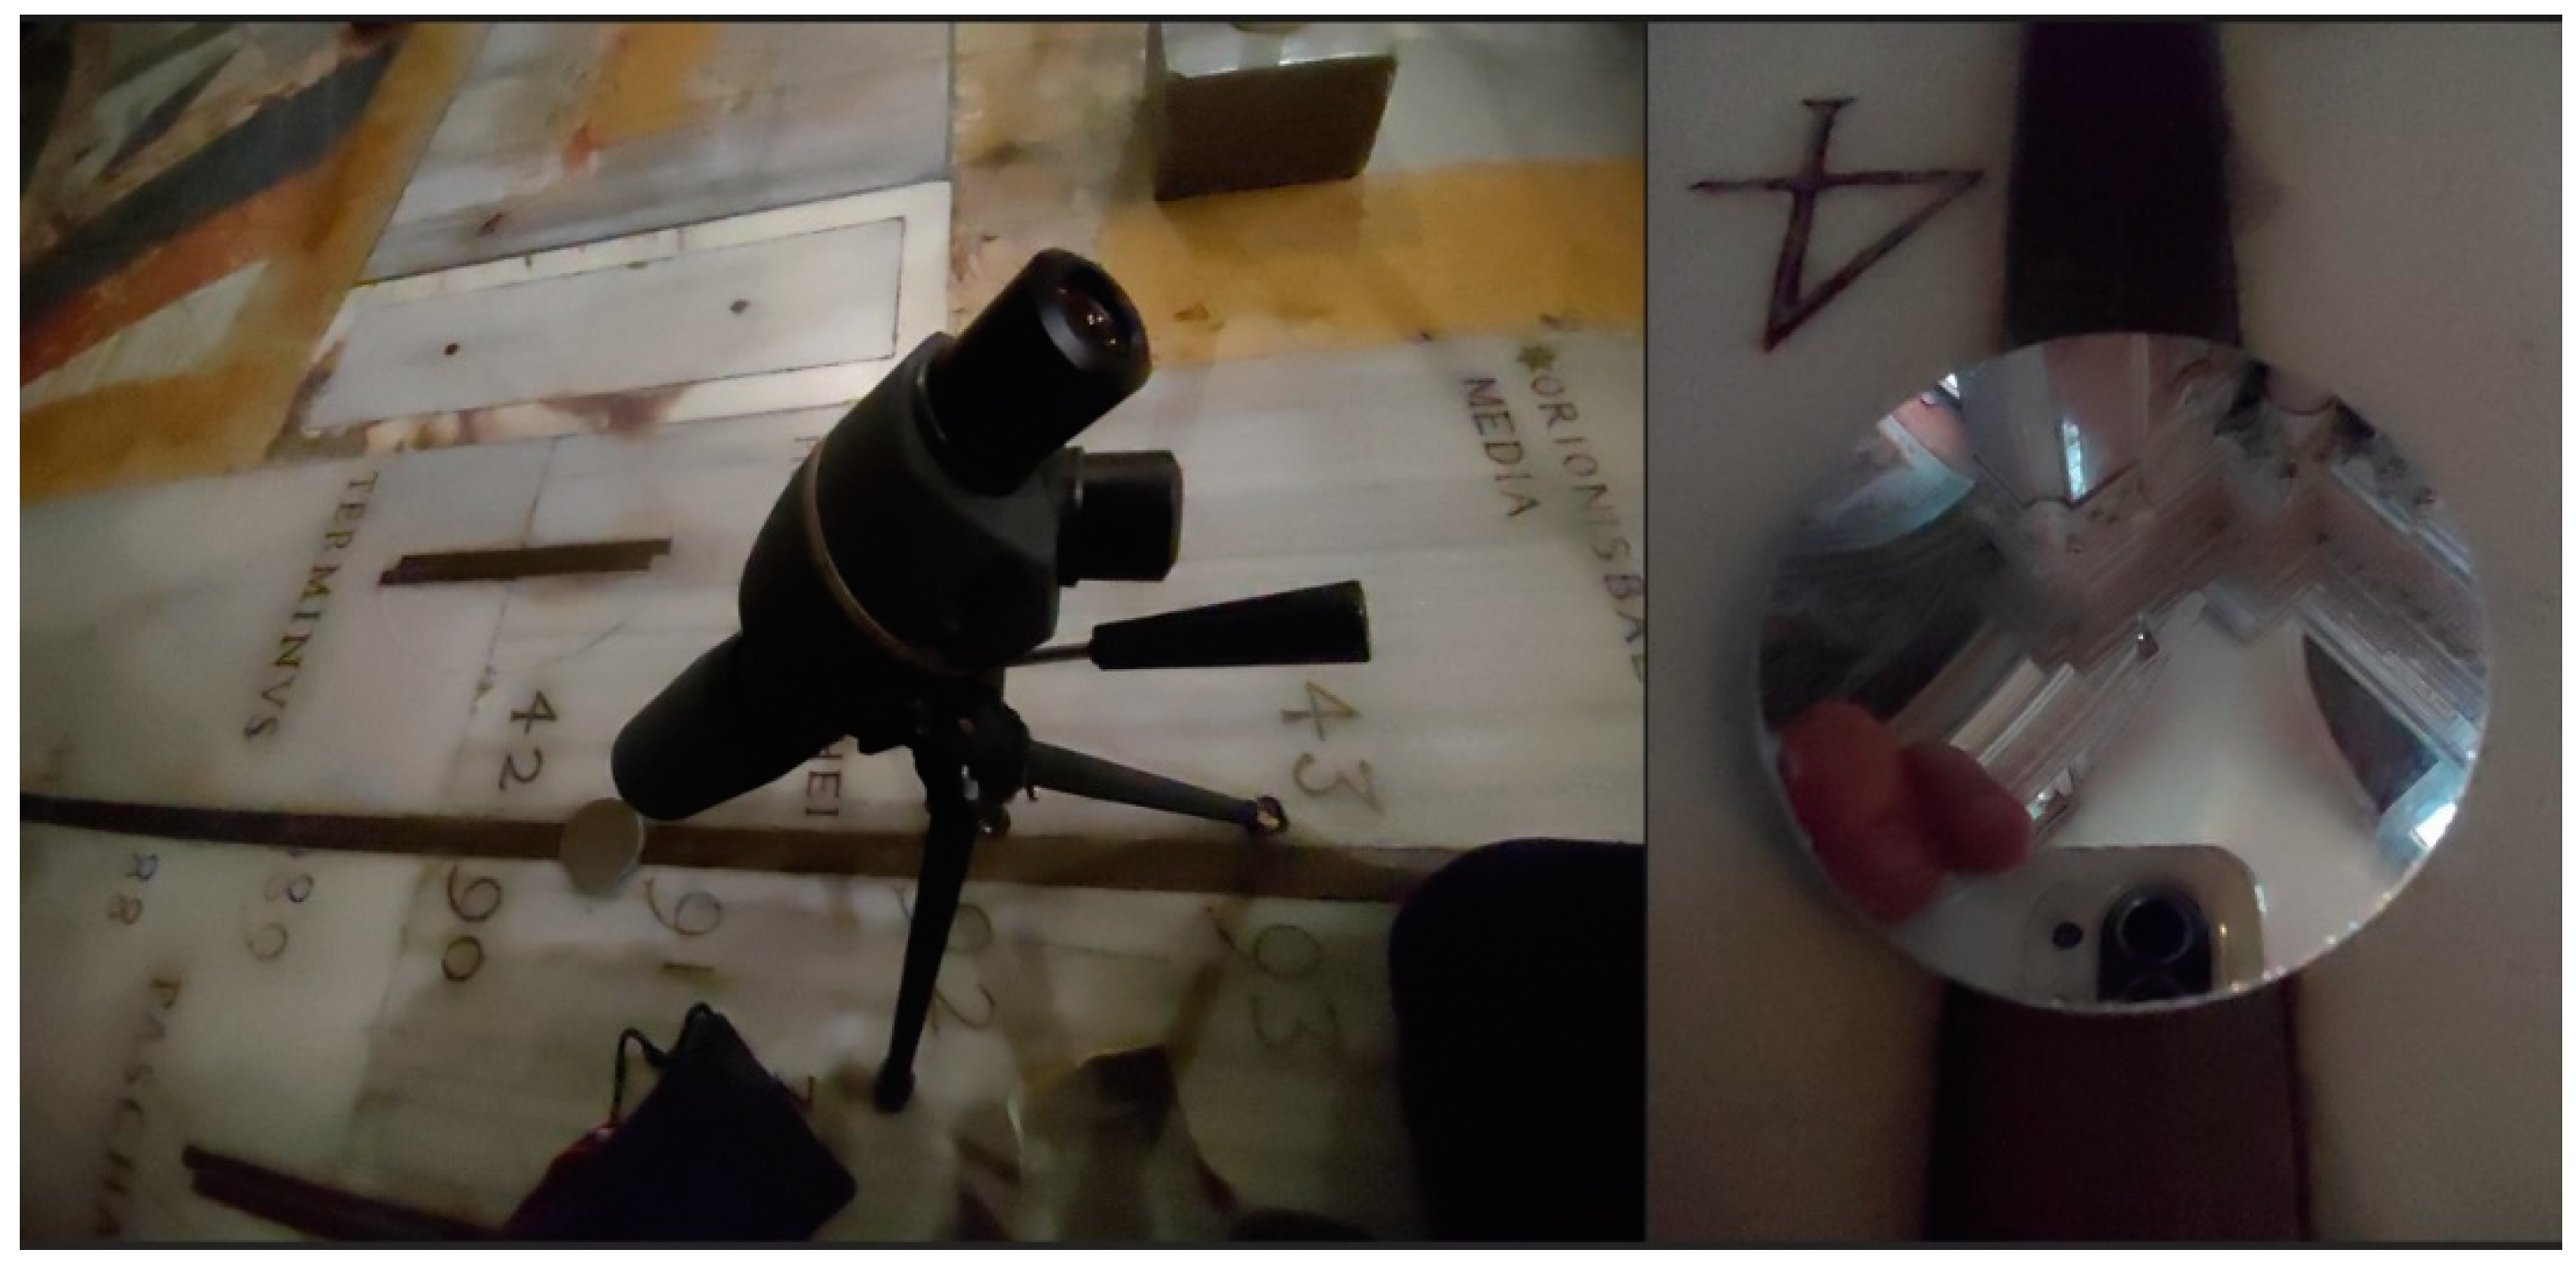
After Bianchini (1703) no other observations of stars at the Clementine Gnomon have been reported. Aldebaran and Rigel are the first stars observed at the Clementine Gnomon after three centuries: on 23 February 2025. C. Sigismondi used a 60 mm refracting telescope with the axis’ projection aligned to the calculated projection of the stars. The observations made near the sunset, minimized the stellar aberration, being the Sun at nearly 90°. The window over the pinhole, used by Bianchini to observe the transits, is no more operating, probably since his times. C. Sigismondi and Michele Bianda observed Jupiter with naked eye from the meridian line on 16 February 2025 at 19 PM, through the full 25 mm pinhole, thanks to its luminosity mv=-2.3 and altitude of 69.85°. Costantino Sigismondi observed the disk of Jupiter and the satellite Io at 2.2’ on 22 February 2025 at 18:42 PM with the aforementioned telescope. In the same night at 19:15 PM Sigismondi spotted Rigel by eyes from the meridian line, in the Church smoothly illuminated. On March 2nd 2025 Sigismondi repeated the observation of Jupiter using a reflecting mirror placed on the meridian line and observing the pinhole reflected. At 19:23 PM the transit of Betelgeuse was clearly observed. The mirror on the meridian line (Fugure 11) intercepted the stellar rays 10 mm over the meridian line, introducing an offset in the tiny field of view (33 s of transit instead of 50 s).15
The accuracy of the pointing is crucial for these observations, since the field of view through the pinhole is ranging from 2.6’ as seen from the meridian line for Rigel to 3.8’ for Aldebaran. The observed transits through the pinhole lasted 34 s for Rigel and 47 s for Aldebaran (Table 1.) and it is compatible with the crossing time at the velocities calculated by eq. (2) for the combined apertures of 60 mm of the telescope + 24/23.9 mm of the effective horizontal pinhole.

Table 1.
Stellar transits observed at the Clementine Gnomon on 23 Feb 2025. The visual magnitudes in parentheses are corrected for the atmospheric extinction. Betelgeuse is variable and at 0.46 is the 9th, Aldebaran is the 14th among the brightest stars, while Rigel is the 7th,16 but among the ones visible from the Clementine meridian line the ranking is respectively 3rd, 5th and 7th, because Vega (86°54’) and Capella (85°52’) transit too high for their light enter in the pinhole. There are also Sirius, Arcturus, Procyon, Altair, Spica, Pollux, Castor, Regulus and Bellatrix that can be observed, as well as the three stars of the Orion’s Belt, reported by Bianchini on the meridian line, since the limiting magnitude with the telescope is more than 5, through the pinhole. The expected values for Sirius are also plotted: a transit of 30.2 s is expected for a perfect pointing.
| Observed Star | Aldebaran mv=0.85 (0.99) | Rigel mv=0.13 (0.35) | Betelgeuse mv=0.46 (0.62) |
| Central duration Expected - Observed |
51.5 s - 47.5 s | 34.9 s - 34 s | 49.3 s - 33 s |
| Transit time CET Expected - Obs.- Δ |
23 Feb ‘25 1030 hPa 12° C 18:31:56.5 – 18:32:05 +8.5 s |
23 Feb ‘25 1030 hPa 12° C 19:10:13 – 19:10:27 +14 s |
2 Mar ‘25 1022 hPa 13°C 19:23:28.5 – 19:23:20 +8.5 s |
| Expected local delay (observed delay) |
+11.6 s (-3.1 s) | +16.3 s (-2.3 s) | +12.0 s (-3.5 s) |
| Solar elongation and Stellar aberration (Δλ) |
97° -0,15” (unmeasurable) |
100° -0,31” (unmeasurable) |
106° -0,79” (unmeasurable) |
| Cause of shifts: | Star & telescope mm offset | Star & telescope centered | Mirror thickenss offset |
Figure 11.
The telescope and the flat mirror reflecting the pinhole, on the meridian line.
8. Detecting Solar Diameter Changes form Averages of Clusters of Data
The minimal changes in the solar diameter, which can be attributed to the Sun and not to instrumental or experimental methods, can be estimated of the order of ≤ 1”/century basing our affirmation on the most recent experimental data (Meftah, et al. 2013, Quaglia et al. 2021, Lamy et al. 2015) compared with the standard value (Auwers, 1891).
We realized simulations with a gradual change of 1” in solar diameter along the years (1655-1736) when the Maunder minimum occurred. We added a realistic Gaussian noise to each data of average 0 and ±4” of standard deviation (±2 mm at the ground at winter solstice). The same timespan is covered by the 4000 observations made in Bologna and considered in Tovar et al. (2021).
The simulations (Fugure 12) with a realistic errorbar of 2 mm (4”) have shown that the clustered averages (1655-1715 and 1716-1736) are different by Δ=0.55”±0.22”, being the data without noise with Δ=0.55”. If the errorbars of each observation are as large as 4 mm (8”) this difference is more noisy, Δ=0.5”±0.3”, with the number of (supposedly uniform) available data.
Figure 12.
The solar diameter changing from 1920” to 1921” from t=[0,1], observed with a 4” random Gaussian uncertainty. The two clusters are 1-3600 and 3601-4000 and represent the years 1655-1715 and 1715-1736. They have different averages, separated by about Δ≈0.5”±0.3” instead of the simulated Δ=1”, and similar standard deviation σ=4”.
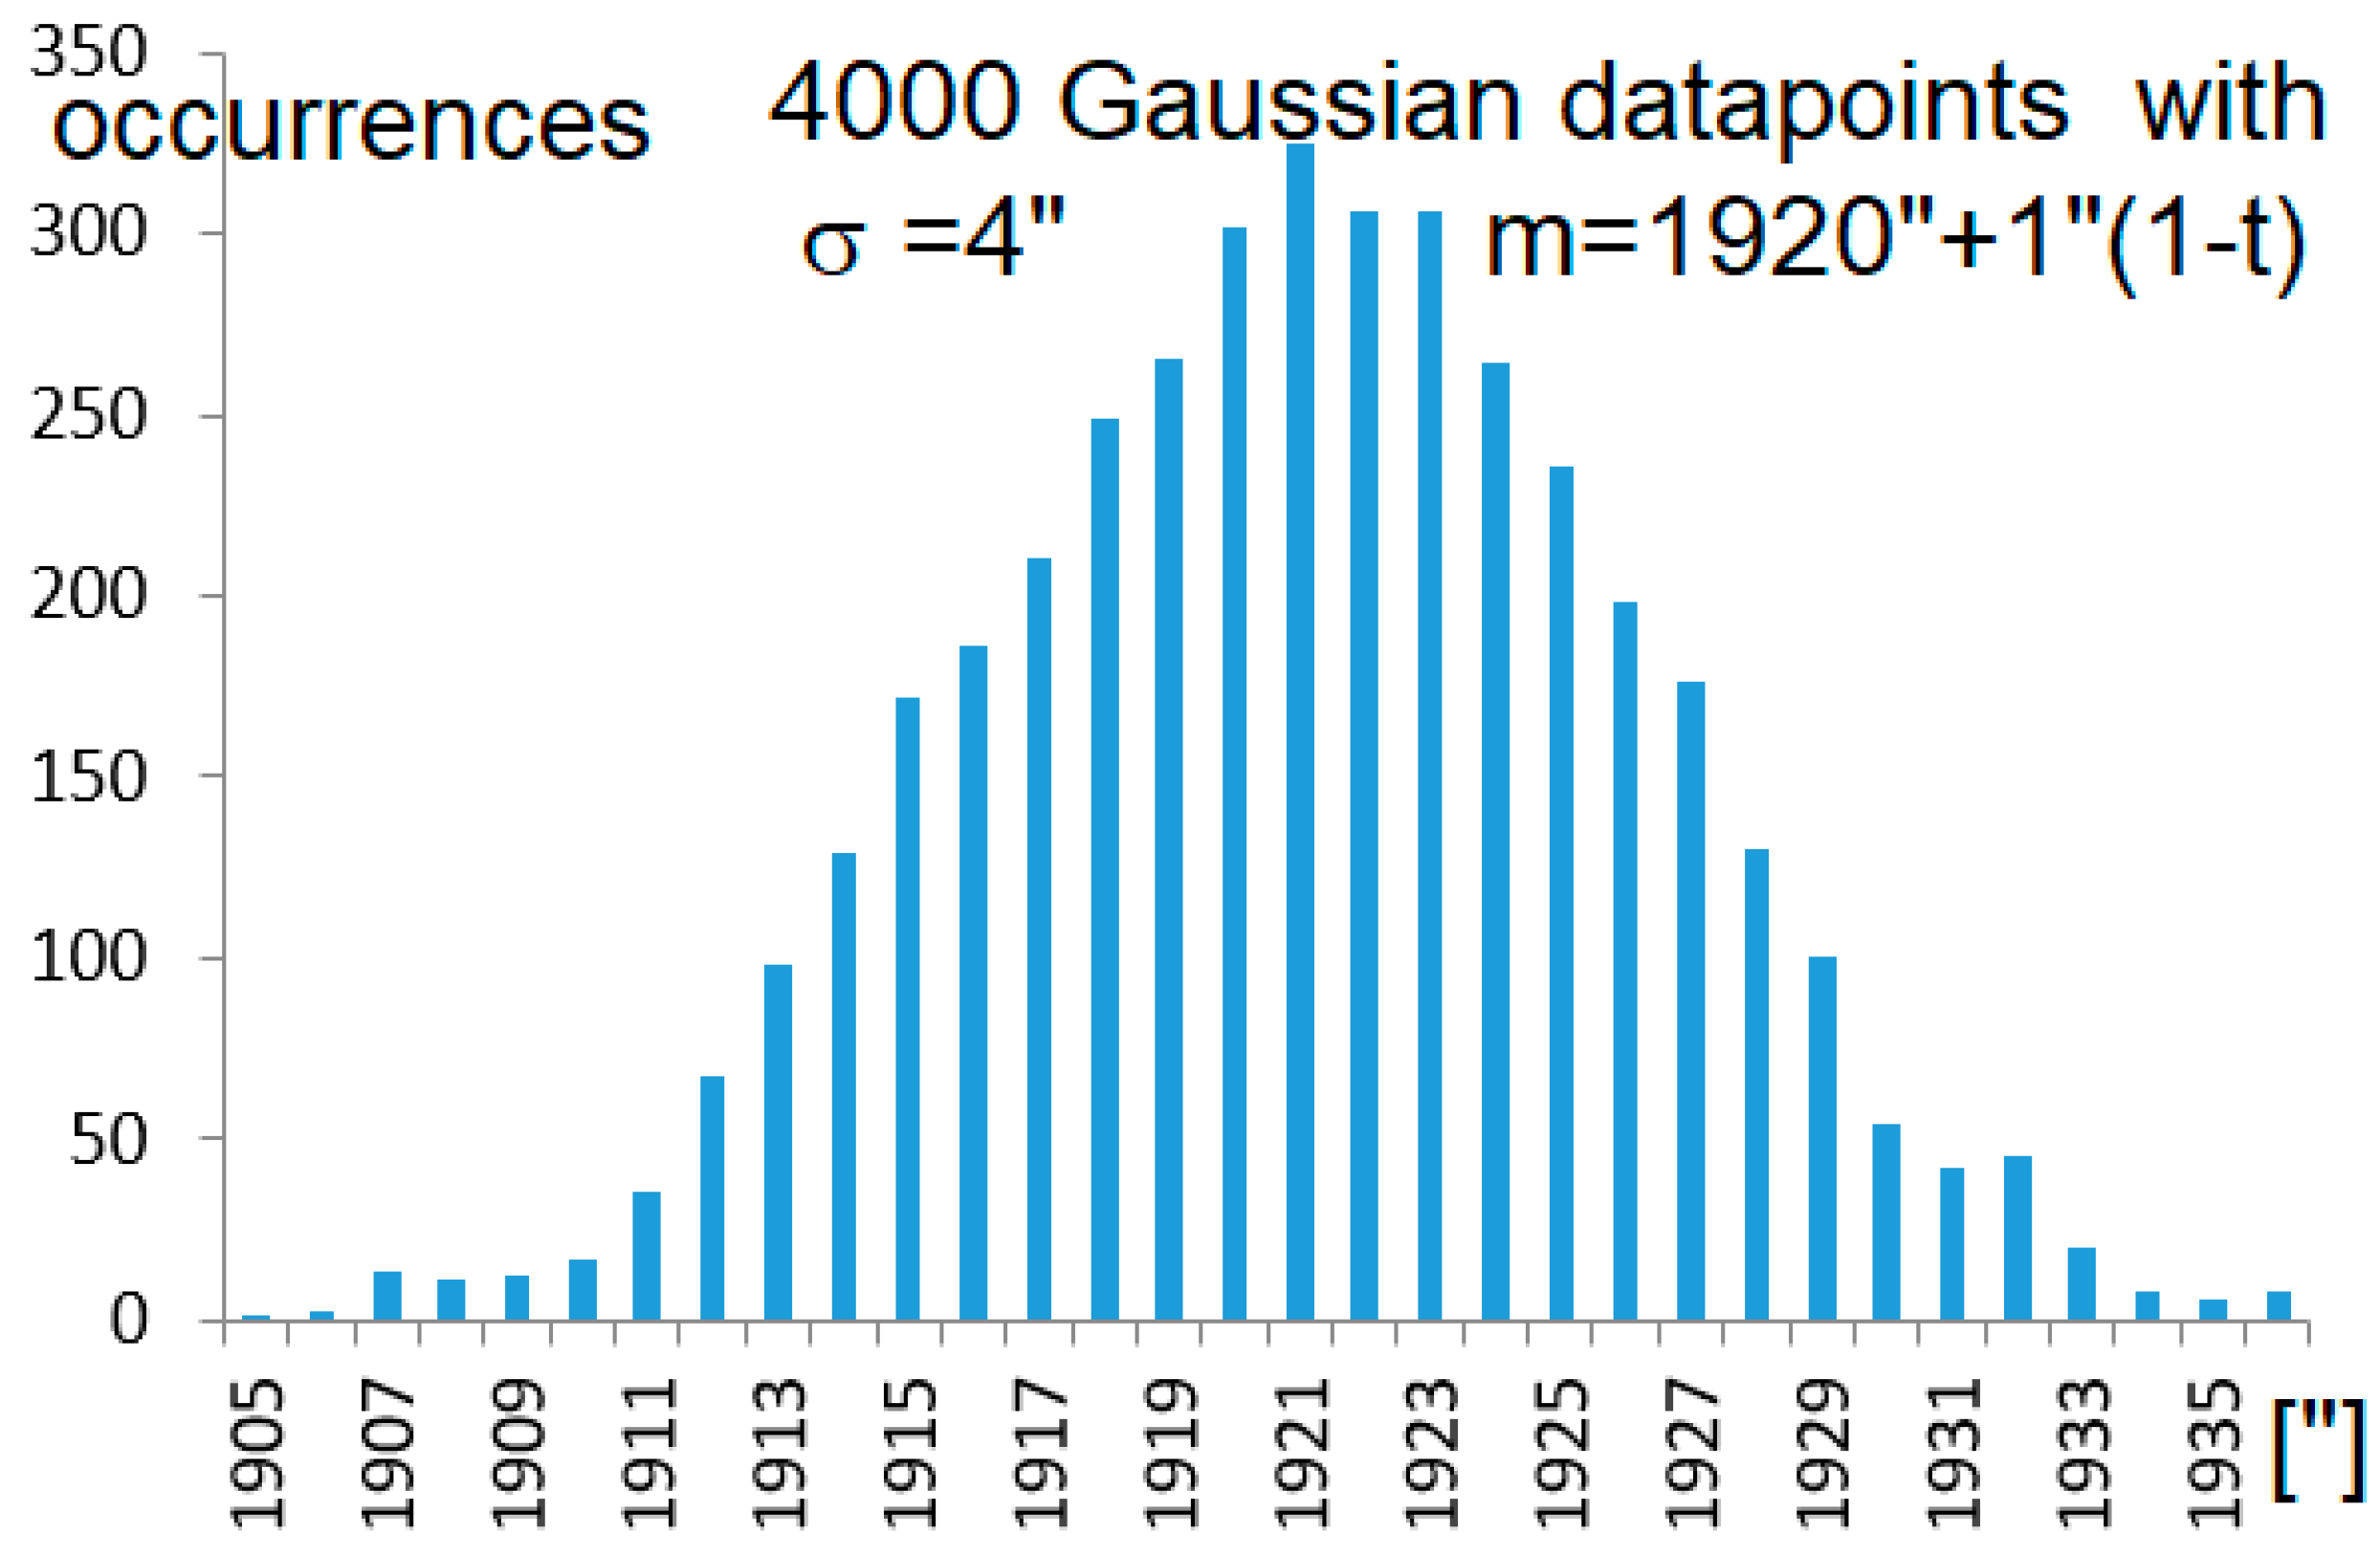
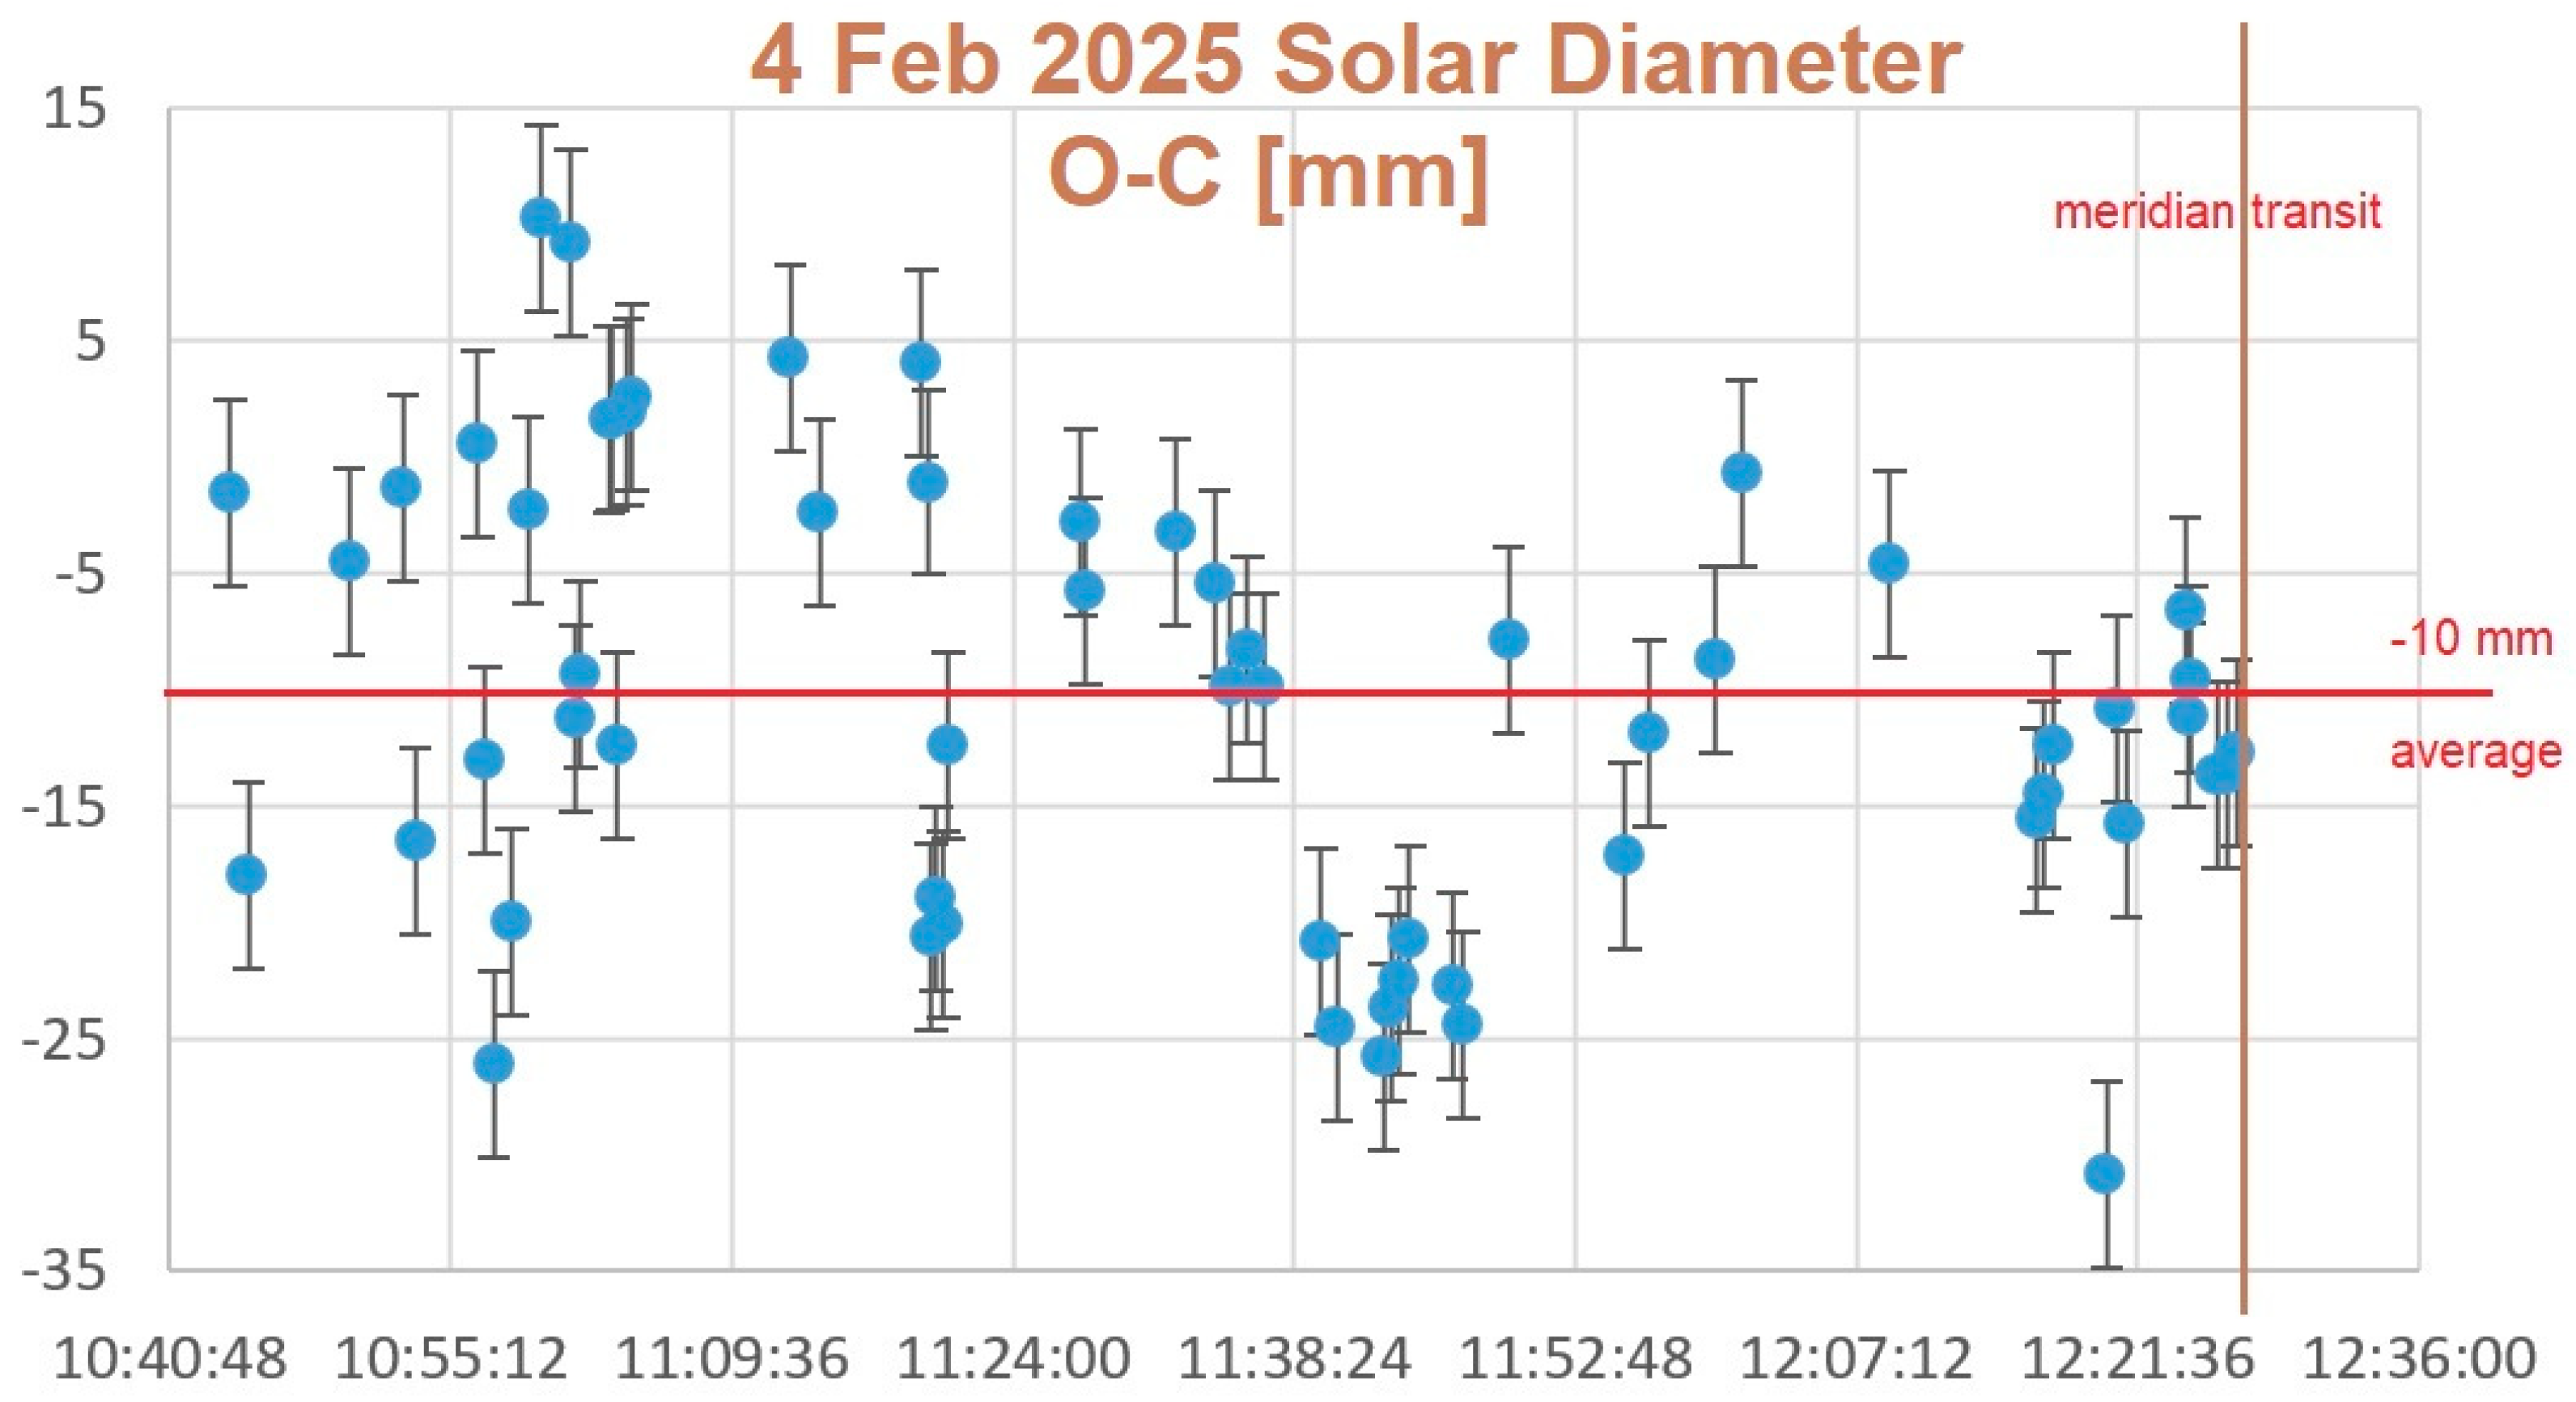
Figure 13.
The measures (extra- and on-meridian line) of 4 February 2025 compared to their ephemerides: there is a systematic difference with the solar diameter underestimated by -9 mm (personal/environmental equation). Bianchini (Fugure 2) underestimated of -9 mm in 1701-1703.
Figure 13.
The measures (extra- and on-meridian line) of 4 February 2025 compared to their ephemerides: there is a systematic difference with the solar diameter underestimated by -9 mm (personal/environmental equation). Bianchini (Fugure 2) underestimated of -9 mm in 1701-1703.
9. Real Data and Simulations with Realistic Errorbars
The astrometrical campaign IGEA-ZIA started in 2018 was aimed to calibrate the Clementine Gnomon in order to get the accuracy of 0.5 mm over all the meridian line. Some restaurations or adjustments have been made along the centuries and the original configuration pinhole-meridian line had been lost to this level of accuracy.
The first results IGEA-ZIA allowed to detect correctly the “sinus” described by Boscovich near the equinoxes, and to know the general deviation to the nearest arcsecond 5’11” East. With these achievements the meteorological effects on the center of the image have been clearly detected.19 Now we are concentrating to the meteo influences on the measures of the meridian solar diameter.
Presently (February 2025, Fugure 3, 4, 5, 13) the solar diameter corresponds also to the maximum of activity of the cycle XXV. We wanted to understand the experimental uncertainties that Francesco Bianchini (1662-1729) at the end of the Maunder Minimum in 1701-1702, when he measured the Sun near these two winters solstices. He underestimated the diameter of 9±6 mm, which corresponds to about 4.5‰ of systematic error at its maximum linear extension on the floor.20
C. Sigismondi measured the major axis of solar image, which is the meridian diameter on the Clementine line during the IGEA-ZIA campaign (2018-2024) with the extra-meridian extension to 2025. Several diameters measured on the meridian line and off-meridian, accompanied by meteorological data, show an average underestimate of 12±8 mm (Fugure 15), similar to Bianchini’s data. These modern observations have permitted to determine the errorbars of Bianchini, and then also Cassini and Manfredi as ranging around ±4”. As a consequence of these experiments, we could attribute realistic errorbars to the XVIII century measures of the solar diameter. Thus we simulated a set of 4000 data of solar diameters, divided into two clusters corresponding to the years 1655-1715 and 1715-1736, with a slow secular variation (≤ 1”/cy) of the solar diameter. The averages of the two clusters are statistically different notwithstanding the errorbars of ±4”: the difference is comparable with the standard deviation of the measures.
The simulations of Gaussian errorbars applied to slowly variating solar diameters during the 81 years encompassing the Maunder miminum and the two decades after, show the possibility to compare the averaged solar diameter of the two clusters within a statistical uncertainty of ±0.3”. Depending on the particular dataset, once assumed uniform datapoints along the years, only on 53% of the cases a difference of 0.55” can be detected by analyzing the clusters’ averages. If the solar diameter would have variated for a smaller amount (0.2”) over such long period, the statistical uncertainty is too large to assess that the diameter is not changed during the total period (Fugure 13).
Figure 14.
The simulated differences (100 times) between the 3600 averaged solar diameters in the Maunder minimum and 1000 after. The expected value of the difference in the simulations is 0.55”, and it has repeated 100 times with Gaussian noise of 4” applied to the single measures. The standard deviation of the averaged differences is 0.3”. In 26% of the cases the difference is ≤0.3”, giving a 100% of uncertainty. In 53% of the cases the difference corresponds to the theoretical one 0.5”±0.3” within the statistical errorbar, and for the last 21% the difference is >0.8”.
10. Conclusions and Perspective
The measured solar meridian diameters of Bianchini near the end of the solar Maunder minimum (Winters 1701-1702) are -9±6 mm shorter than the ephemerides, calculated with the solar standard diameter of 1919.63”, here assumed as 1920” (Lamy et al. 2015).
The corresponding dates around the Winter’s solstices from 2018 to 2024 (Fugure 15) yielded a meridian solar diameter -12±8 mm, measured by C. Sigismondi during the IGEA-ZIA campaign. The slightly larger statistical uncertainty is due to having included days with some clouds or veils, while Bianchini observed only with very good conditions.
Figure 15.
Seven solstices, 61 data in total. Blue: 2018-2021, Red: 2022-2024. Only the difference with respect to the ephemerides Observed-Calculated “O-C” is represented in mm.
Figure 15.
Seven solstices, 61 data in total. Blue: 2018-2021, Red: 2022-2024. Only the difference with respect to the ephemerides Observed-Calculated “O-C” is represented in mm.
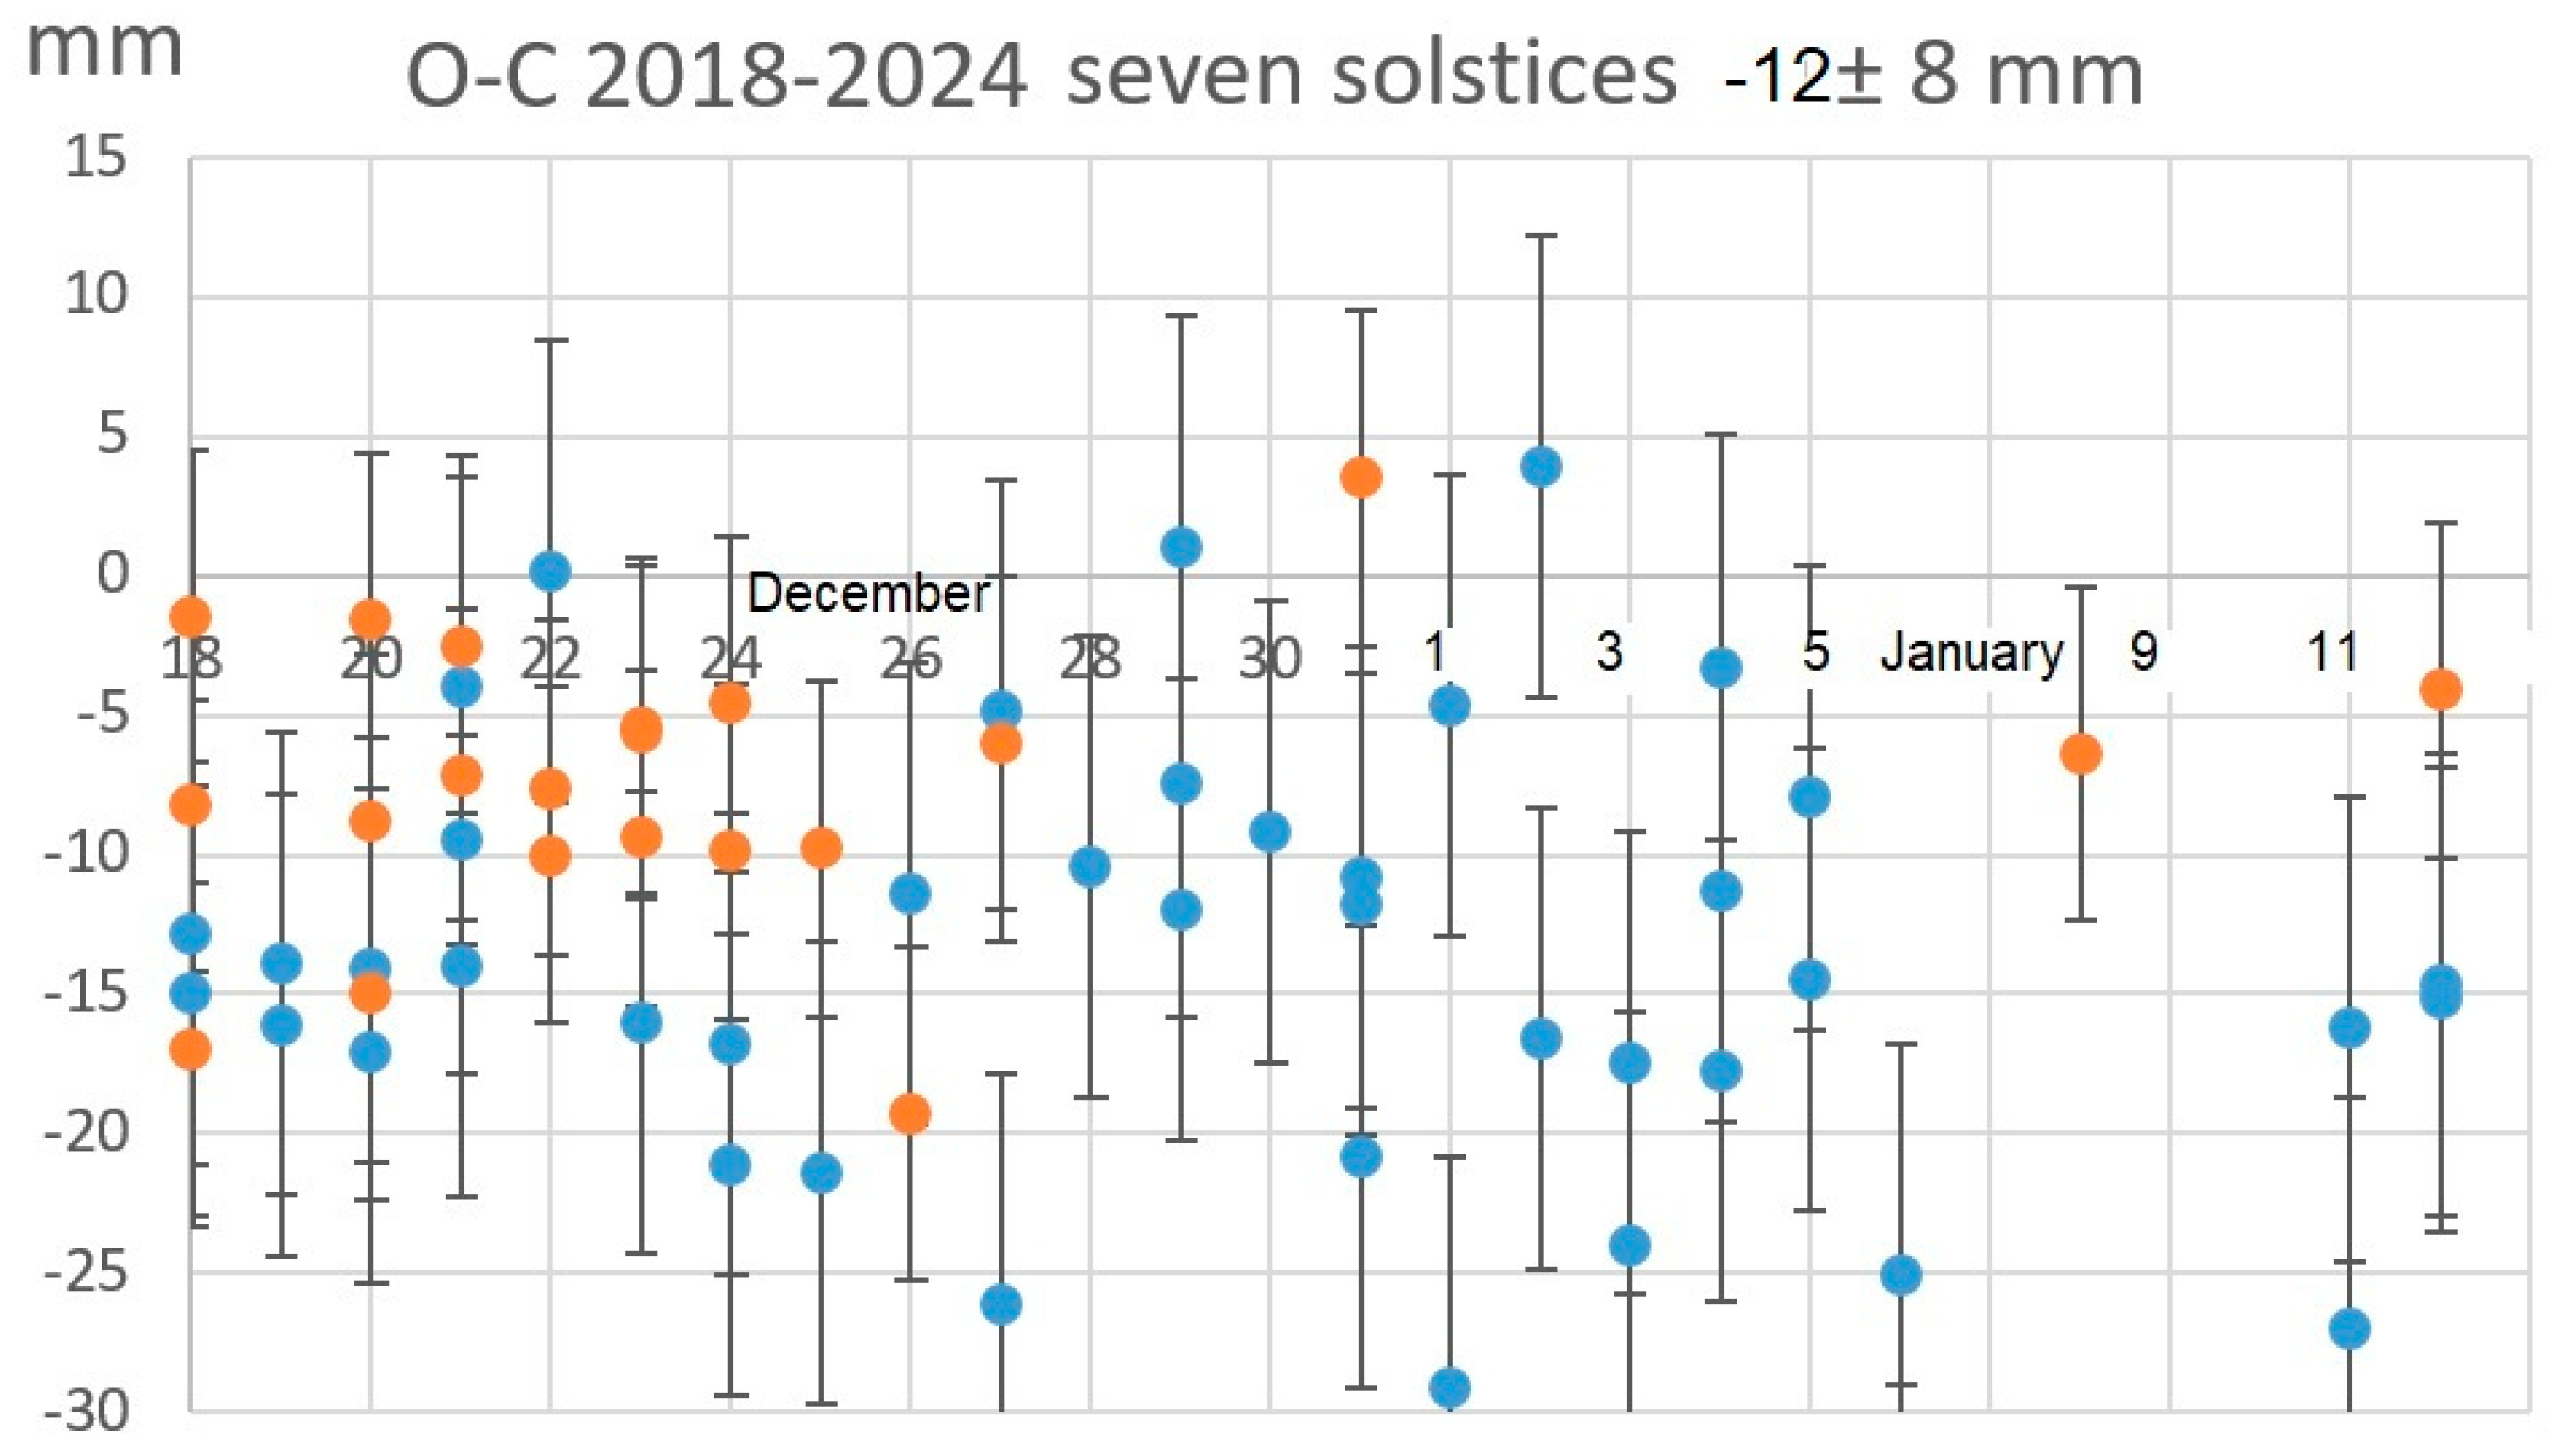
Assuming a similar personal equation, between Bianchini and Sigismondi, the meridian images have different diameters by 3 mm. Bianchini underestimated the solar diameter by 9 mm, Sigismondi by 12 mm (Fugure 15). This means having the same systematic error or personal equation in the same geometrical conditions.21 The Sun shrunk by 3 mm or 6”since then, within errorbars of ± 20”:ΔD⦿= -6” ± 20”. Evidently this affirmation is compatible with zero variations, but also with the tiny variations claimed with the eclipses of Clavius (Rome, 1567) or Halley (England, 1715) and Manhattan (New York and Providence, 1925) analyzed by Eddy and Boornazian (1980) or Sofia et al. (1980).
The largest images are now 1110 mm and at Bianchini’s times 1120 mmm because a larger ecliptic’s obliquity. Normalizing to the standard solar diameter and adjusting for the systematic errors the averaged winter solstice data of Bianchini are 1926”±10” while the modern ones are 1920”±14”.A single –and very good- measure can be as precise as ±1 mm, or ±2”, if the meteorological conditions are ideal, but in general the statistical fluctuations due to the seeing and to variations of the contrast enlarge the uncertainties (e.g. see Fugure 4): this has been the focus of this study. With these considerations the variation of the solar diameter during 3 ¼ centuries, since the end of the Maunder minimum, cannot be verified at better than 10” of accuracy. The data in comparison are 10 from Bianchini (2 winter solstices) and 61 from Sigismondi (7 winter solstices). The data near the winter solstice have been chosen for their larger accuracy given the dimensions of the solar images.22
Author Contributions
C. S. conceived the structure of the paper and wrote it, A. B. contributed to the statistical analysis.
Acknowledgments
Costantino Sigismondi wants to remember gratefully Mons. Giuseppe Blanda (1937-2022), who supported his observations including his reports in the official website of the Basilic, and Prof. John L. Heilbron (1934-2023) who inspired the study of the Clementine Gnomon with his masterpiece “The Sun in the Church” (1999). Thanks also to Don Renzo Giuliano, Don Franco Cutrone and Don Pietro Guerini: as rectors of the Basilica of S. Maria degli Angeli, for welcoming my daily astronomical observations from 1999, with great care.
Conflicts of Interest
The author declare no conflicts of interest.
| 1 | A very good study on science and historical context of this instrument has been made by the late John L. Heilbron who, in the last quarter of century of his life, dedicated his studies to “The Sun in the Church” (1999) and to Mons. Francesco Bianchini (2023). |
| 2 | Originally it was 20 mm wide, but along the history it has been reshaped to the present 25 mm. Also its collocation with respect to the line changed slightly, that’s why an accurate calibration has been necessary in the last years. |
| 3 | The mean solar angular diameter at 1 AU is still tabulated at 1919.26”as an astrophysical constant, since Auwers (1891) but there are increasing evidences of a present value very close to 1920”, with a radius of 919.99” measured in the last decades of total solar eclipses (Quaglia et al., 2024, Lamy et al., 2015). |
| 4 | |
| 5 | The “cylinder effect” reduces the effective opening of the pinhole, due to its thickness, partially shadowing the 25 mm open disk. |
| 6 | On 20 February 2025 the mean solar meridian diameter was visually measured as 3.5 mm or 13” shorter than the ephemerides (-6.8‰), in very good agreement with the timing measurements (-4.7‰). |
| 7 | |
| 8 | Aldebaran |
| 9 | One of the observations near the solstices, on 29 December 1701, resulted an outlier, with the measured image 42 mm shorter than the ephemerides, while all other measures are in very good agreement with them, with a systematic reduction of 9 mm. Nevertheless our clear sky conditions are indeed better than “Sole languido” or “Sole languidissimo” (-/+ clouds’ veil) mentioned in the Manfredi’s report (1736). |
| 10 | Obtained, before the yellow Veronese marble, from the video https://youtu.be/i__e_fgtIas
|
| 11 | A video of the egress of Sirius in daytime on 29 March 2023 https://youtu.be/jKYO4edGjl0 at the Vatican Obelisk shows this affirmation.The environmental conditions in the Basilica of St. Maria degli Angeli, observing Sirius in daytime through a narrow window, were much better than St. Peter’s square. |
| 12 | General Relativity is necessary to complete the calculation, when the speed of light is considered. |
| 13 | The deviation from 0° azimuth of the meridian line is the same as in 1702, even if the pinhole’s position and width changed. |
| 14 | Boscovich in 1750 found a delay of 5 s in Summer and 17 s in Winter. In 1734, Anders Celsius spent six months in Rome, observing with the Clementine Gnomon and finding only 4/9 of the deviation of Boscovich, who 16 years later, used a better reference time. A change in the pinhole position may change these delays, but not their difference, which depends on the meridian line’s absolute orientation. |
| 15 | |
| 16 | |
| 17 | Sirius and Antares have been observed in daytime from St. Peter’s square using the Vatican Obelisk as reference, with a small telescope of 40 mm opening. |
| 18 | A future development is to obtain electronic timing through video, for the brightest stars, in order to monitor the ΔUT1 by using directly the sidereal time, instead of using the solar transit time (Sigismondi, 2022). The alignment of the telescope on the meridian line within ±0.5 mm at the distance of Rigel would produce ±0.2 s of error, and without the daytime seeing near 5”, the limit of 0.1 s can be achieved for very good pointings. |
| 19 | The position of the center of the Sun on 20 February 2025 was 3.2 mm Northward with respect to the ephemerides. The meteorological shift due to temperature (14.5 °C) and pressure (1027 hPa) with respect to STP (15°C, 1013.25 hPa) is -1 mm/5°C and +1/mm/10 hPa. A similar shift 2.7 mm occurred on 22 February 2025 with 16°C and 1028 hPa, confirming the accuracy of ±0.5 mm achieved for the solar positions with IGEA-ZIA observational campaign. |
| 20 | Winter solstice (21 december) and Perihelion (4 January) are almost coincident. |
| 21 | With the Sun brighter and smaller the difference between observations and ephemerides reduces gradually and around half of the meridian line it is around -3.5 mm (the case of 26 February 2025 with the image 482 mm wide, and the ephemerides predicting 485.5 mm). |
| 22 | The “inaugural” meridian diameter of 6 October 1702 was 415.6 mm with the Southern limb coincident with the ephemerides, while the Northern one is -10 mm, so that the diameter resulted -10.6 mm with respect to the ephemerides. Rescaling to the winter solstice this would be -28.6 mm. The choice of the winter’s solstices data is for better relative errors and largest ratio image to penumbra (pinhole size). |
References
- A. Auwers, A., “Der Sonnendurchmesser und der Venusdurchmesser nach den Beobachtungen an den Heliometern.
- C. Caldarella and E. Cicillini, ICRA Report, Sapienza University of Rome, 2021 https://www.icra.it/solar/report20-21.pdf (visit 13/2/25).
- C. Sigismondi and L. Ricciardi, The Sixteenth Marcel Grossmann Meeting, pp. 2398-2410 (2023) (link).
- C. Sigismondi and S. Pietroni, Journal for Occultation Astronomy (ISSN 0737-6766), Vol. 12, No. 3, p. 14-20. (2022) (link).
- C. Sigismondi, Am. J. of Physics, 70, 1157 (2002).
- C. Sigismondi, Gerbertus 16, 29 (2022).
- C. Sigismondi, Phys. Sci. Forum 2021, 2(1), 49 (2021) https://www.mdpi.com/2673-9984/2/1/49.
- C. Sigismondi, The Eleventh Marcel Grossmann Meeting, pp. 2470-2472 (2008) (link).
- C. Sigismondi, The Sixteenth Marcel Grossmann Meeting, pp. 3519-3535 (2023) (link).
- D. W. Dunham, S. Sofia and A. Fiala, Science, 210, 1234 (1980).
- der deutschen Venus-Expeditionen”, Astronomische Nachrichten, 128, Issue 20, 361 (1891).
- F. Bianchini, Correspondance, 1702 (Biblioteca Vallicelliana, Roma, Fondo Bianchini).
- F. Bianchini, De Nummo et Gnomone Clementino, Romae 1703 https://archive.org/details/dekalendarioetcy00bian/.
- F. Espenak https://astropixels.com/ephemeris/perap/perap1701.html (visit 13/2/25).
- G. Abetti (1952), Il Sole, Hoepli, Milano.
- J. Eddy, A. A. Boornazian and C. Clavius, Space and Telescope, 60, 10 (1980).
- J. L. Heilbron, The Sun in the Church, Harvard Universtiy Press (1999).
- L. Quaglia, et al., Ap J S 256, 36 (2021) (link).
- M. Meftah, et al. A&A 2014 (link).
- M. Meftah, et al. MNRAS (2013) (link).
- P. Lamy, et al., Solar Physics 290, 2617 (2015) (link).
- Vatican Museum Catalogue https://catalogo.museivaticani.va/index.php/Detail/objects/MV.44538.0.0?lang=en_US (2020) (visit 15/2/2025).
- W. Sullivan et al., Bulletin-29iii-Sullivan.pdf (2016).
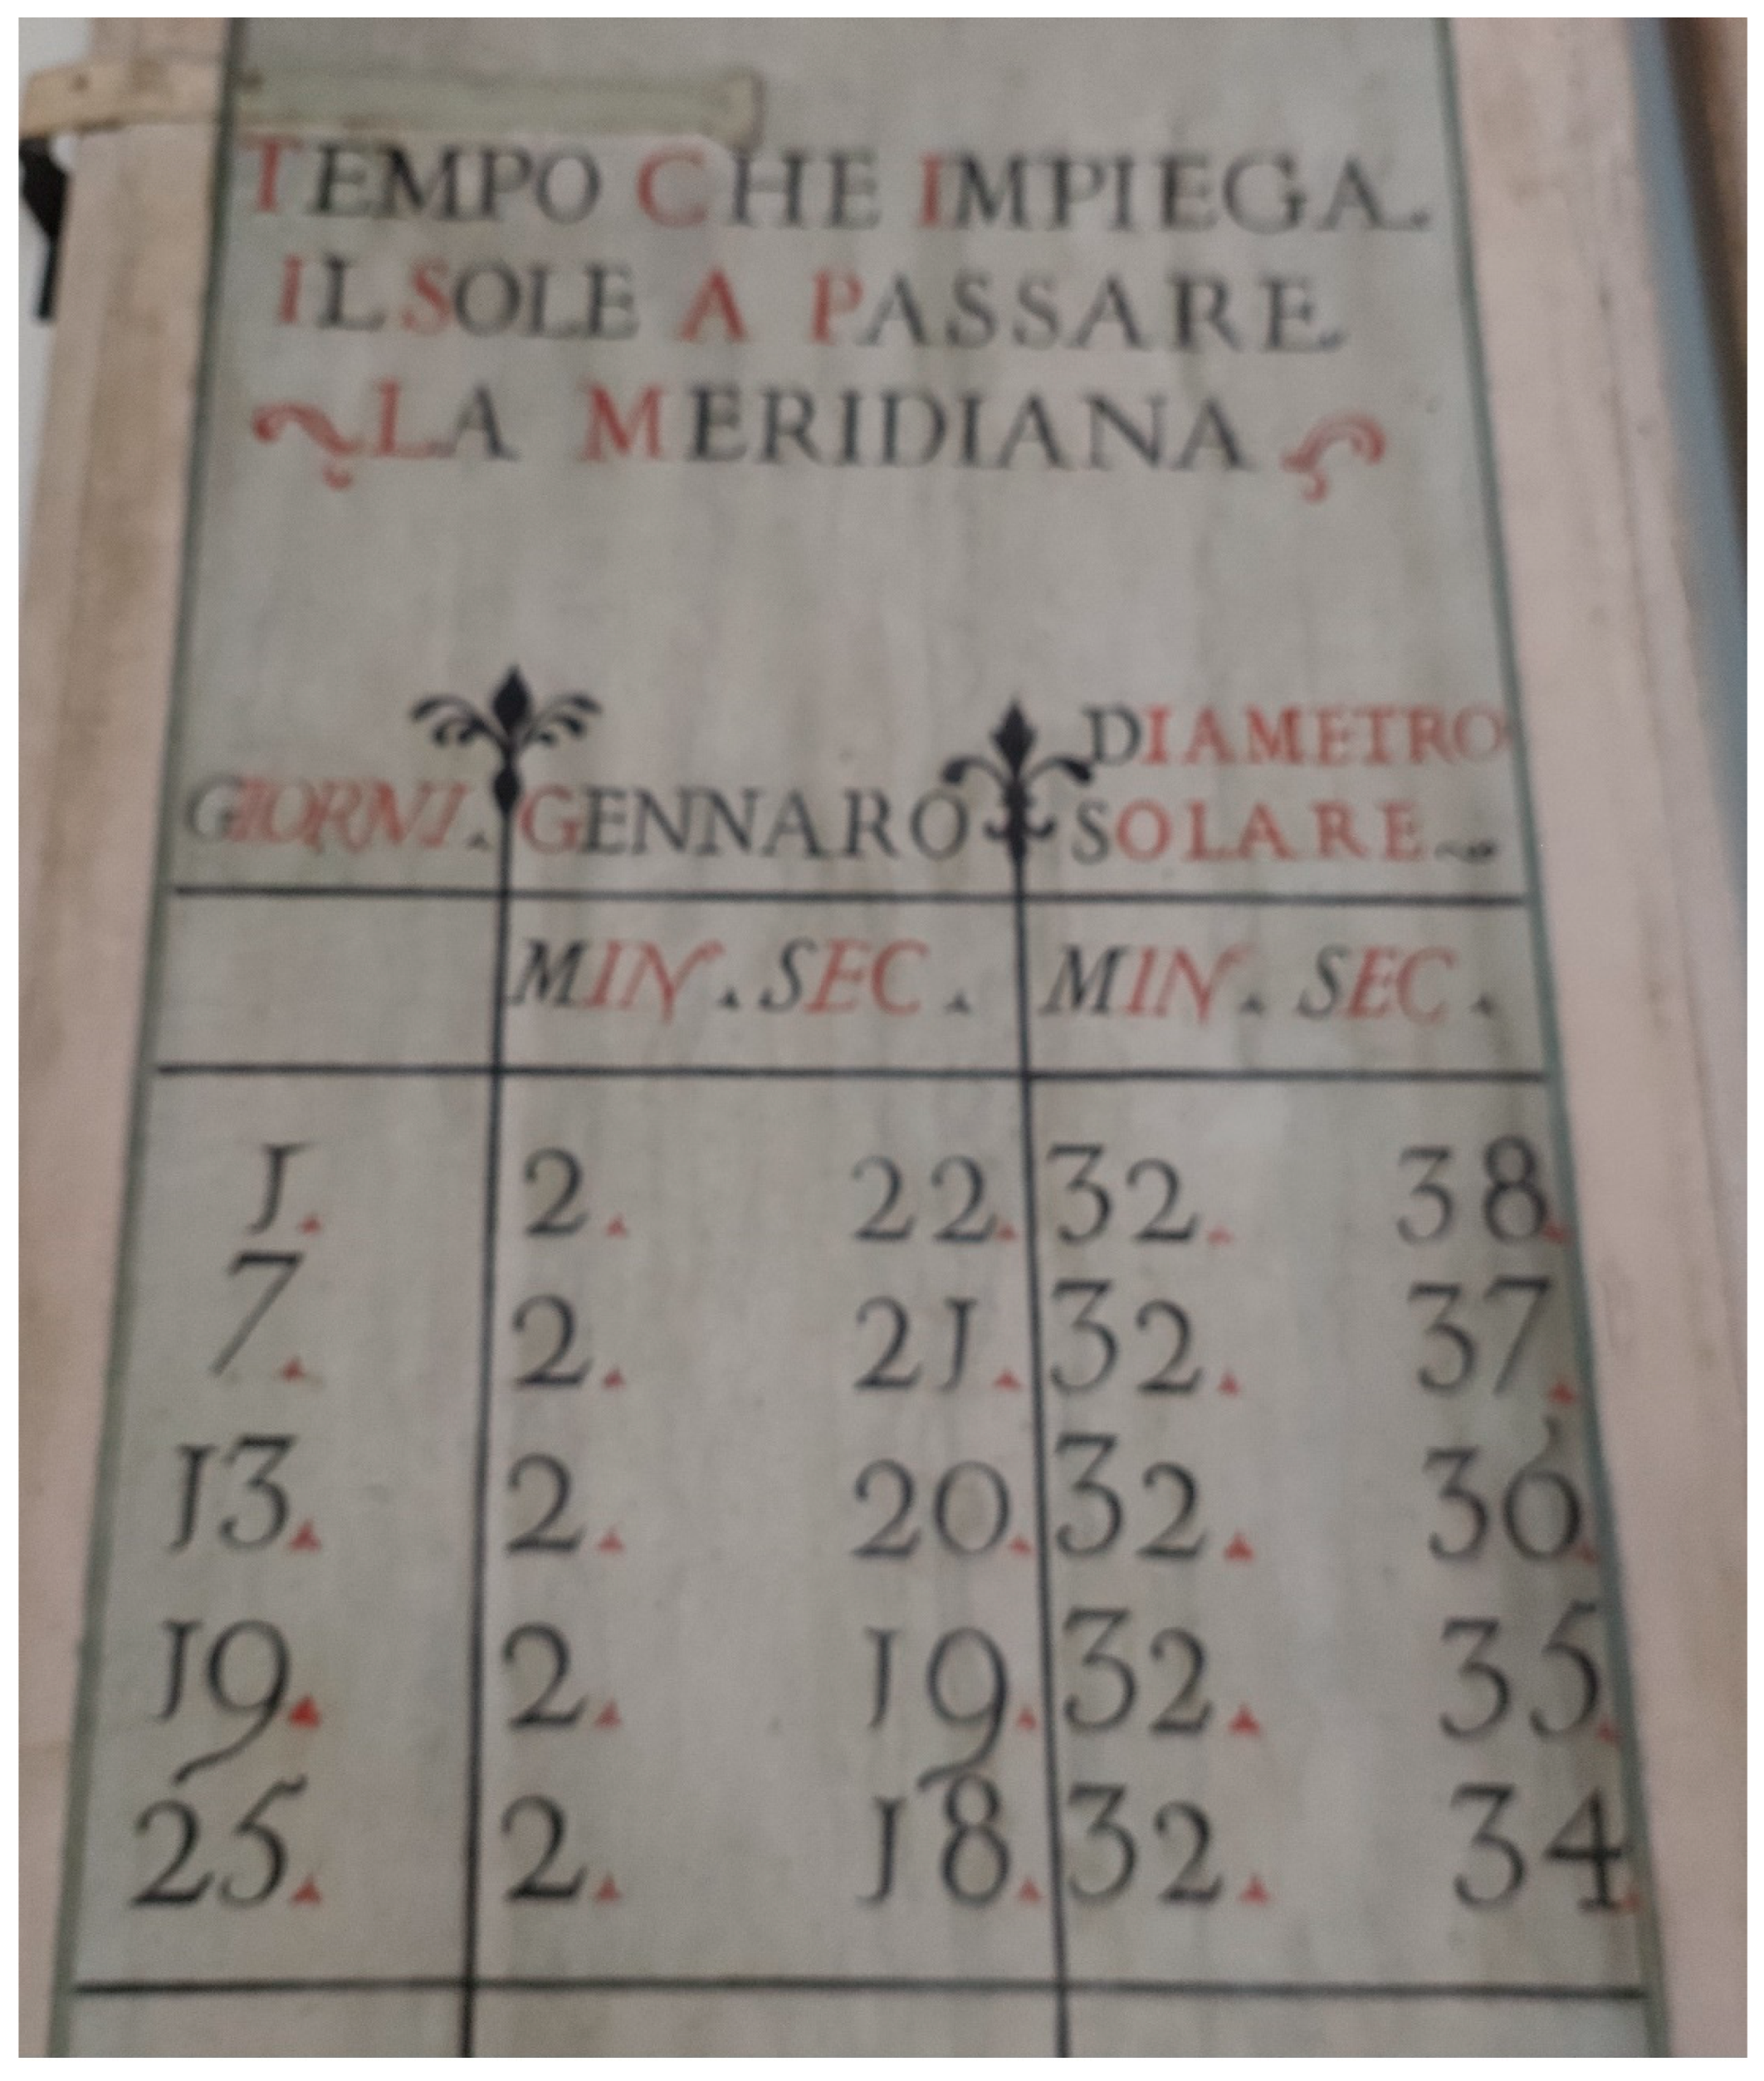
Figure 1.
Wooden table of January solar transits’ durations belonging to the Cardinal Francesco Saverio De Zelada (1798), Musei Vaticani, Sala della Meridiana. The solar angular diameter shows a maximum of 32’38”: the modern ephemerides Espenak (2025) calculate 32’33”. This is, probably, the irradiation effect (Abetti, 1925) at the telescope.
Disclaimer/Publisher’s Note: The statements, opinions and data contained in all publications are solely those of the individual author(s) and contributor(s) and not of MDPI and/or the editor(s). MDPI and/or the editor(s) disclaim responsibility for any injury to people or property resulting from any ideas, methods, instructions or products referred to in the content. |
© 2025 by the authors. Licensee MDPI, Basel, Switzerland. This article is an open access article distributed under the terms and conditions of the Creative Commons Attribution (CC BY) license (http://creativecommons.org/licenses/by/4.0/).
Copyright: This open access article is published under a Creative Commons CC BY 4.0 license, which permit the free download, distribution, and reuse, provided that the author and preprint are cited in any reuse.


