
Submitted:
28 March 2025
Posted:
31 March 2025
You are already at the latest version
Abstract
Understanding the complex phenomena of interactions between the elements of a Combined Piled Raft Foundation (CPRF) is essential for the proper design of such foundations. To evaluate the effects of mutual influence among CPRF elements, a series of long-term measurements of selected physical quantities related to the performance of the foundation were conducted on a building with a frame structure, stiffening walls, and monolithic technology, consisting of seven above-ground stories and one underground story. The analysis distinguishes the real deformations resulting from temperature changes and from stress strains resulting from load changes. The two types of deformations were subject to further interpretation of only changes in stress strain over time. Changes in stress values in the subsoil, as well as strain measurements in the vertical direction of concrete columns, were recorded to assess the load distribution between the CPRF components. The numerical analysis results obtained for a fragment of the monitored foundation were compared with actual measurement results to verify the numerical model of interaction between the structure and the soil. This comparison also served to supplement and sim-ultaneously expand the dataset of test results on a real-world scale.
Keywords:
Combined Pile Raft Foundation
; long-term in-situ measurements
; FEM analysis
; sensors
1. Introduction
Highlights
What are the main findings?
- FEM analysis enables to complete the missing readings from the not correctly functioning sensors leading to conclusion that CPRF column in the range of small settlements (a few millimeter level) is characterized by lower “stiffness” than that of a single column, while with larger settlements (0,06D), the increase in load-bearing capacity and stiffness of the CPRF column in comparison to a single column is observed.
- In the analyzed CPRF, the CMC columns carry 75% of the total load.
What is the implication of the main finding?
- The need to carry out measurements with ongoing comparison to the results of the FEM analysis - current calibration of the digital twin system for assessing the work of the foundation.
- Optimized design of CPRF elements - possibility to draw in weaker soil beneath the foundation.
Gotman N.Z. and Gotman A.L. [1] analyzed the interaction between piles, soil, and slabs in a combined piled raft foundation in cohesive soils, focusing on changes in axial forces within the piles. Measurements of axial force changes were taken using strain gauge-equipped force meters placed at the base and head of 9.0 m long piles, as well as at two cross-sections located at depths of 4 m and 7 m below the pile head. The study considered three configurations: piles working individually, piles in a group, and piles in a combined piled raft foundation. Their findings showed that in a combined piled raft foundation, pile-pile interaction causes the mobilization of friction on the pile side only in the lower portion—between 25% and 33% of the total pile length measured from the bottom. This contrasts with piles working alone, where friction is mobilized along the entire pile length from top to bottom.
Oliver Reuil and Mark F. Randolph [2] studied the behavior of the combined piled raft foundation of the Westend Duo building in Frankfurt, which was founded on Frankfurt clay. The foundation slab covered an area of 4100 m², and monitoring included measurements of axial forces in three piles, stress on the ground beneath the slab using five pressure sensors, groundwater pore pressure using five sensors, and settlement at 23 points using geodetic surveying. The authors reported that the maximum settlement of the slab, 4.7 cm, did not exceed the estimated value of 7.2 cm. Preliminary analyses had indicated that the piles would absorb approximately 40% of the total load (αFPP = 40%).
Kharichkin [3] focused on measuring vertical forces in piles to evaluate their role as “reducers” of settlement in a raft footing under a residential building in Moscow. The building consisted of two sections, one 70 m tall (22 stories) and the other 90 m tall (30 stories), with a total foundation area of 3000 m². Each section was supported by driven prefabricated piles spaced at 0.9 × 0.9 m and 1.05 × 1.05 m, respectively, with lengths of approximately 14 m and cross-sectional dimensions of 0.3 × 0.3 m. Six piles were equipped with SVD-100 force sensors welded to steel plates at the pile heads to measure forces. Results indicated that corner piles experienced forces of 345 kN, which were 1.9 times greater than piles along the edge of the slab and 2.3 times greater than piles located within the slab’s plan. Settlements were measured as 18.6 mm for the lower building and 21.0 mm for the taller building [4].
Ryuuichi Sonoda [5] analyzed a building in Port Island, Kobe City, founded on a pile-slab foundation. The seven-story steel-frame building, with dimensions of 35.25 × 55.80 m in plan, was supported by a 0.4 m thick slab and 2.4 m high foundation beams resting on 93 prestressed high-strength concrete piles (PHC) with a diameter of 0.65 m and a length of 12 m. One pile was equipped with deformation sensors at depths of 4.4 m, 8.4 m, and 11.4 m. The monitoring system also included 12 benchmarks for geodetic settlement measurements and a point for measuring pore water pressure in the ground. The forces measured in the piles after construction closely matched numerical predictions.
In Frankfurt am Main, Katzenbach [6] carried out automatic measurements of piles and subsoil for high-rise buildings founded on combined piled raft foundations in Frankfurt clay during the 1990s and subsequent years. These measurements verified the numerically estimated load distribution between piles and subsoil under foundation slabs. One notable example is the Messeturm building, which is 256 m tall and founded on a square plan of 58.8 × 58.8 m. Its foundation consists of a 6.0 m thick slab in the central area, tapering to 3.0 m at the edges, supported by 64 bored piles with diameters of 1.3 m and lengths ranging from 26.9 m to 34.5 m, spaced 3.5 to 6.0 diameters apart.The 256 m high Messeturm building on a square plan of 58.8 m × 58.8 m, founded on a 6.0 m thick slab in the central prt, decreasing to 3.0 m at the edges, and on 64 piles of 1.3 m in diameter and lengths ranging from 26.9 m to 34.5 m, spaced 3.5 to 6.0 diameters, was described in detail by Sommer et al. [7], Sommer [8], El-Mossallamy and Franke [9], and Tamaro [10]. Monitoring included geodetic measurements of settlements and tilts, ground settlement at various depths using extensometers, ground stresses under the slab using pressure sensors, and axial force distribution along piles using deformation measurements at six points. These observations revealed that 55% of the load was carried by the piles, while 45% was borne by the ground under the foundation slab. Additionally, friction mobilized by the piles varied with depth, ranging from 25–70 kPa at depths up to 15 m below the slab base and increasing to 110 kPa for inner piles and 160 kPa for outer piles at greater depths. Katzenbach found that piles in combined piled raft foundations mobilized significantly greater friction compared to piles working individually.
Similar monitoring was conducted for the Messe Torhaus building in Frankfurt am Main, which is approximately 130 m tall (30 floors). The building was supported by two independent slabs, each resting on 42 bored piles with a diameter of 0.9 m and a length of 20 m, spaced 3–3.5 diameters apart. Measurements showed that 80% of the load was carried by the piles, while 20% was borne by the subsoil under the slab. The ground’s load contribution originated primarily from the self-weight of the foundation slab.
Katzenbach also analyzed the DG-Bank building (Westendstrasse 1 in Frankfurt am Main), which is 208 m tall with 53 floors. The foundation consisted of a 3.0–4.5 m thick slab covering an area of 2940 m², supported by 40 bored piles with diameters of 1.3 m and lengths of 30 m. Measurements indicated that half of the load was carried by the ground under the foundation slab. Further studies by Katzenbach examined load distribution between piles and subsoil for other buildings founded on Frankfurt clay, including Taunustor-Japan Centre (40% piles), Forum-Kastor and Pollux (35–40% piles), Congress Centre Messe Frankfurt (40% piles), Main Tower (85% piles), Eurotheum (30% piles), and Commerzbank (96% piles).
The main objective of this study is to assess the interaction of elements constituting the combined piled raft foundation of an eight-story monolithic reinforced concrete building. A measurement system was designed and implemented for the first time in Poland. The system includes a method for measuring stress changes in the ground under the foundation slab and deformation measurements of foundation columns to estimate theoretical force changes at three depths.
2. Materials and Methods
2.1. Soil and Water Conditions
The analyzed building is located within a deep Carpathian foreland filled with Miocene sediments. In the ceiling of Miocene clays, which were not drilled directly under the building, an erosion incision was eroded, filled with silty periglacial formations several to a dozen or so meters thick. These formations were formed mainly in silty clays, silt, and fine and silty sands covered from the ground surface with fluvioglacial sands. Within the sandy-silt intercalations in Miocene formations, at a depth of 10 to 25 m below ground level, a Tertiary aquifer was drilled and taken in the area by drilled wells. Hydrated sand lenses were found with groundwater under low hydraulic tension within the periglacial deposits. A groundwater was observed in the near-surface layer of fluvioglacial sands during drilling.
Based on the research results, two essential geotechnical layers can be distinguished in the subsoil under the building, as shown in Figure 1. The first one is a layer of Quaternary Pleistocene silty periglacial formations, developed in the form of silty clays, silt, sandy silt, less frequently clays and silty clays, sporadically sandy clays and clayey sands, in a plastic and soft-plastic state with a liquidity index of IL = 0.4–0.55. Below are silty and fine sands, constituting the interbedding of Miocene clays in a compacted state, with a density index of approximately ID = 0.7–0.8.
The ground conditions in the vicinity of columns P1-P6 (see Figure 1) have been detailed by adding the results from the closest CPT – Figure 2 and Figure 4 (for P1 to P6) and from the dilatometric test (Figure 3 for column P3). The resistance of the CPT recorded at the level of 2.0–5.0 MPa confirms the macroscopically recognized and presented in the geological-engineering cross-section (Figure 1) state of silty soils (by PN-B-04452: IL = 0.21 for qc = 5.0 MPa, IL = 0.51 for qc = 2.0 MPa).
2.2. Building Structure
The analyzed building has the shape of a cuboid with a rectangular base with dimensions of 26.90 m × 84.20 m.
The building has a height of 32.6 m from the foundation level, consisting of seven aboveground floors and one underground floor located in the “deeper” section. The facility was designed using monolithic construction technology as a skeleton structure with stiffening walls. The building is founded 4.50 m below ground level on a foundation slab that is 0.80 m thick, with localized thickening to 1.0–1.2 m under the pillars. Table 1 provides the start dates for the individual concreting stages as well as the indicative layout of the floors in the analyzed building. To limit vertical displacements of the structure, localized deep-ground reinforcement was implemented in the area where pillars and walls meet the foundation slab. This reinforcement was carried out using CMC concrete displacement columns (Les Colonnes à Module Contrôlé), which have a diameter of 0.40 m. The columns were embedded into the load-bearing soil, consisting of silty sands, to a depth of at least 1.0 m. The total length of the CMC columns ranged from 8.4 m to 19.3 m. For further analysis, the foundation system consisting of the CMC columns and the soil beneath the slab was modeled and analyzed as a Combined Piled Raft Foundation (CRPF).
2.3. Measurement of Stresses in the Ground Under the Foundation Slab
To estimate changes in stress values in the ground at the contact point with the foundation slab caused by the varying self-weight of the building during construction, three wire pressure transducers (measured in kPa) were installed in the equalization chamber [13]. One of the sensors was placed in the depression near the measured concrete column (S8), while the other two were positioned as follows: one in the middle of the distance between the edges of adjacent depressions (S7), and the other in the middle of the distance between the edge of the depression and the nearest concrete column (S9), as shown in Figure 5.
2.3.1. Measuring Sensors
The system was constructed using Geokon model 4800 wire pressure sensors, which have a measurement range of 170 kPa. These sensors consist of two stainless steel sheets welded together around their perimeter, with a narrow gap between them filled with hydraulic fluid [14,15]. External loads applied to the sensor surface result in changes in the volume of the chamber, causing the fluid to move into or out of the pressure transducer. This movement alters the length of the string connected to the steel membrane that is in contact with the fluid, thereby changing the string’s natural frequency [16,17,18]. Assuming the hydraulic fluid is incompressible, the difference in the frequency of the string vibrations can be translated into changes in pressure [19,20]. Integration with a temperature sensor enables thermal compensation for the sensor readings, ensuring accuracy across varying temperatures. Using individual calibration cards, calculations are performed to determine changes in vertical stresses in the ground beneath the foundation slab, expressed directly in kPa [21,22]. Figure 6 illustrates the construction details of the measuring device, while its basic technical data are provided in Table 2.
2.3.2. Installation Method
The pressure transducers were installed in the ground beneath the leveling concrete. Prior to installation, the mounting locations were carefully prepared: the ground was excavated to a depth of approximately 0.10 m, and the shape of the recess was adjusted to match the dimensions of the sensor, as shown in Figure 7. Each transducer was placed inside a polypropylene woven bag filled with sand. This procedure was designed to eliminate point interactions and ensure uniform pressure transfer from the foundation slab to the sensor.
2.4. Measurements of Deformation of CMC Concrete Displacement Columns
The measurements included six CMC concrete displacement columns, where longitudinal deformations were measured at three depths. Each column, located beneath the recesses of the foundation slab, has a diameter of 0.40 m and extends several meters in length. The columns were embedded through layers of weak-bearing silt and dust and rested in a layer of sand, penetrating the sand layer to a depth of at least 1.0 m.
The locations of the measured columns and the adopted nomenclature are illustrated in Figure 8. In the subsequent sections of the paper, the axial force variation was analyzed for all columns (from P1 to P6). Additionally, a stress distribution analysis was performed for the slab-subgrade-column system near column P1 [23], focusing on the distribution of load transfer between the structure, the soil beneath the foundation slab, and the concrete column(s).
2.4.1. Method of Measuring Deformations
In each of the measured concrete columns, string sensors were installed at three different depths to measure the vertical deformation of the shafts (expressed in microstrain [µε]). These sensors enabled observation of changes in force distribution along the column due to variations (or consistency) in the applied load [24].
Steel profiles were embedded within the analyzed columns, and Geokon model 4100 wire strain gauges were heated and attached to the profiles at three designated locations. Figure 9 provides a visual representation of the measuring device, while its basic technical data are summarized in Table 3.
The sensors are enclosed within steel protective housings, as shown in Figure 10, to prevent damage during installation. These housings are specifically designed to minimize resistance from the concrete mix during the pressing or vibrating of the steel profiles, as illustrated in Figure 10, Figure 11, Figure 12 and Figure 13.
Columns P1 and P2 were equipped with steel pipes measuring approximately 50 mm in diameter, with a wall thickness of 2.9 mm and a length of 15.2 m. The locations of the sensors along the length of the profile are shown in Figure 14. After subjecting these columns to test loads, the upper part of the profile, approximately 1.8 m in length, was cut off to align with the upper surface of the base concrete [25].
Columns P3, P4, P5, and P6, on the other hand, were equipped with IPE120 steel I-beams, each 12.0 m long. Figure 14 also illustrates the sensor placements along the length of these profiles.
2.4.2. Assessment of Compressive Forces in CMC Columns
The determination of compressive forces in columns based on deformation measurements was carried out based on physical laws relating stress to deformation. For the purposes of this study, it was assumed that the dependency is linear:
The value of the modulus of elasticity, E, was adopted based on the PN-EN 1992-1-1:2008 standard Eurocode 2 – Design of concrete structures – Part 1-1: General rules and rules for buildings [26] for concrete class C25/30, reducing it by 30% due to the use of sandstone aggregate: Ecm = 21.7 GPa.
It was assumed that there is full adhesion between the steel profile and the concrete, ensuring compatibility of deformations. The transformed cross-sectional areas Acs were determined for columns with an IPE120 profile and a tubular profile, taking into account the ratio of the modulus of elasticity of steel Est = 200 GPa and concrete Ecm = 21.7 GPa.
The value of the force Ncol in the column at various depths was determined using the formula:
where e – the change in deformation measured by the sensor, taking into account the correction related to different thermal expansion coefficients of steel and concrete, corresponds to the stresses in the structural element, excluding free thermal deformations (further explanation in the text).
It should be noted that the values of the forces were determined under the assumption of constant stiffness in compression of the column along its length (AcsEcm = const). This means that the assumption was made that along the length of the column, there are no disturbances causing a change in the column’s diameter (Acs = const) or a change in the elastic properties of the column concrete (Ecm = const).
3. Results with Discussion
3.1. Take-Off Measurements of Column Deformation
Take-off measurements (“zero measurements”) for the deformation sensors installed in the columns were taken immediately after their completion, i.e., on 12/10/2015. The readings of the sensors in columns P1 and P2 were also read during the test load.
Automatic measurements were started on 20/05/2016. In Figure 15 and Figure 16, the recorded strain values from this period are presented in relation to the assumed take-off measurements from 12/10/2015. The dotted lines in the graphs below were introduced only to increase the Figures’ readability because the intermediate periods’ strain functions are unknown.
Based on the graphs of deformations measured in columns P1 and P2 at three depths (Figure 15 and Figure 16), from their installation on 12/10/2015 until the activation of automatic measurements on 20/05/2016, three distinct phases can be identified. The first phase corresponds to changes in deformation due to the maturation of the concrete mix. The second phase is associated with deformation changes resulting from the application and removal of the test load. The third phase covers the waiting period for the initiation of automatic measurements during the building’s construction, reflecting an increase in load due to the building’s own weight.
In the first phase, column shortening was observed in all sensors except P1_3, most likely caused by temperature changes following the release of heat during cement hydration, along with concrete shrinkage. Shrinkage occurs due to structural changes in the cement paste caused by physicochemical processes of water loss during concrete setting and hardening. It is assumed that shrinkage was facilitated by the soil’s moisture content of 25%. In contrast, sensor P1_3, located near the column head, exhibited an opposite trend: swelling, likely caused by the presence of water in the upper soil layers during the setting of the concrete mix. Column shortening may also have resulted from the load imposed by the concrete mix itself. However, since column deformations were measured at only two points in time (at the start of the concrete setting process and at the onset of the test load), it is not possible to fully or accurately interpret the processes occurring in the column during the initial 30 days after its installation in the ground.
During the second phase, corresponding to the test load, column shaft shortening was observed (Figure 18), accompanied by a residual force remaining in the column shaft after unloading. Based on deformation measurements, it can be concluded that the residual force in column P1 is greater than that in column P2. Comparing these observations with the axial force changes along the column during the test load (Figure 19), these conclusions appear well-founded. The performance of the side surface of column P1 is better compared to column P2, which ultimately results in the mobilization of greater force during the test load and, consequently, a higher residual force in column P1.
In the third and final phase, a phenomenon similar to that observed in the first phase is evident. Measurements from all sensors, except P1_3, indicate column shortening, while sensor P1_3 shows column lengthening. As in the first phase, this can be attributed to the presence of water in the substrate, which causes soil swelling—a phenomenon observed exclusively in the upper part of the column.
3.2. Load Test of Columns P1 and P2
The strain graphs for both columns during the load tests are presented in Figure 17a and Figure 18a. In this analysis, the zero strain reading corresponds to the measurement taken prior to the application of the test load. The recorded strain values reflect only the changes resulting from the variation in the load applied to the column head.
Columns P1 and P2 were subjected to a test load, among other things, to verify the correct operation of the measuring devices installed inside the columns. Load tests were also conducted to obtain the load-settlement relationship for the columns, which is necessary for the proper design of the building’s foundation. A force was applied to the column heads, with the value increasing in ten stages. After the fifth stage, the columns were unloaded.
In column P1, the distribution of the axial force (Figure 19a) corresponded to typical column operation. Specifically, the estimated force values at all stages of the test load were highest for the sensor located at the highest point (P1_3), where the observed values were close to the force applied to the head at each stage of the load. The lowest force values were recorded by the sensor at the deepest point (P1_1). This response indicates good cooperation between the column side and the ground, as well as good quality of the column shaft.
In column P2 (Figure 19b), during the first stage of loading, the force estimated from the measurement with sensor P2_3 was only slightly higher than the force estimated using sensor P2_2. After the fifth stage and unloading of the column, the force at point P2_2 was higher than that at point P2_3 during the subsequent loading step. Although a measurement error cannot be ruled out, the author believes this axial force distribution could indicate narrowing in the vicinity of sensor P2_2. It may also suggest the absence of friction mobilization on the column side up to the depth at which the P2_2 sensor was located.
When comparing these conclusions with the results of the CPT probing, it is important to note that the soil surrounding the P1 and P2 columns, at the location of the P1_2 and P2_2 sensors, exhibits significantly different cone resistance qc. For column P1, the resistance is approximately twice as high as that for column P2 (over 5 MPa for column P1 compared to 2.5 MPa for column P2, on average). The higher force values at the mid-height of column P1, compared to the upper part after the fifth stage and unloading, may also suggest variable values of the modulus of elasticity of the hardened concrete along the column.
Despite the differing behavior of the side surfaces and bases of columns P1 and P2, the load-settlement relationship determined for their heads is very similar (Figure 20). This indicates that, from the perspective of the structure’s overall behavior, the columns perform almost identically within the analyzed load range.
The conclusions from the axial force distribution interpretation along the shafts of columns P1 and P2 (Figure 19) for different load steps can be compared to the findings resulting from the load-settlement relationship for their heads (Figure 20). After the final unloading for P1, practically no change in the head elevation was observed, while the head of column P2 moved upwards after the load was removed. The share of plastic deformation of the soil along and under column P2 is relatively small. Column P2 deforms elastically without the cooperation of the side surface (lack of lateral constraints). In the case of column P1, the side surface works much better, which is manifested by a practically complete reduction of the column head displacement upwards because the side surface counteracts the column from rising.
The maximum force applied to the heads of columns P1 and P2 of 1200 kN causes an estimated elastic shortening of column P1 by about 8.3 mm (assuming the modulus of elasticity for the concrete column E = 21.7 GPa, diameter D = 0.40 m and length L = 18.8 m) and of column P2 by about 7.0 mm (assuming the same value of the modulus and diameter and length L = 15.8 m). The values estimated in this way are close to the values of the settlements of the heads of columns P1 and P2 measured during the test load (Figure 20). The estimated elastic shortening of column P1 observed on the load-settlement graph, taking into account good ground conditions around the column, may indicate the mobilization of friction along the entire length of the column, which results in a decrease in the axial force in the column (Figure 19a). The extension (with excellent approximation) of the last linear section of the axial force dependence over depth for column P1 (Figure 21a) shows that the side surface transfers almost the entire force value applied to the column head, with practically no work done by the column base. It follows from Figure 21b that different substrate-column interaction processes accompany the work done by column P2. As shown in Figure 20, column P2 shortens elastically by about 6.0 mm. Permanent deformations of the substrate amount to about 2.0 mm. The agreement of the estimated and observed elastic deformations confirms the above interpretation of the axial force variation with depth (Figure 19b), where the side layer does not cooperate with the ground in the first eight meters, both under load and during unloading. The return of elastic deformation of the column shaft is noticeable in the absence of resistance of the side layer. The work of the lower part of the column, for a depth greater than 8.0 m, causes mobilization of friction at the column-ground interface and/or a slight settlement of the base, resulting in plastic deformation of the ground.
3.3. The Influence of Temperature Changes on the Measurement of Column Deformations
Sensors Pi_3 were installed at the point of the greatest temperature and atmospheric pressure fluctuation. For example, Figure 22 shows a graph of temperature changes as a function of time measured by sensor P1_3, placed in column P1. The graph shows that the temperature of the concrete near the head changes significantly and directly affects the values of deformations and, therefore, the estimated values of the axial force in the column.
Analyzing the actual deformations of concrete in a simplified way, we can distinguish free deformations, deformations resulting in the formation of stresses, and creep and shrinkage deformations. Neglecting rheological phenomena due to the relatively short measurement period, we can assume that the actual deformations (L) are the sum of deformations caused by the impact of temperature and deformations resulting from mechanical impacts, which generate stresses in whole or in part. In other words, these are such deformations that could be determined at the measuring point based on the measurement of the change in the base length made using an external measuring device, e.g., a caliper. Stress strains are such theoretical strains that, using Hooke’s law, correspond to the values of stresses at the measuring point. Mechanical and non-mechanical interactions can cause them. For example, in a wholly restrained beam element, its length does not change due to temperature, and therefore no strains occur. Using the temperature measurement, however, we can determine the theoretical value of the strains that would occur if the element were free to change length. Temperature changes in a restrained beam generate stresses that do not cause strains.
In the analyzed case, based on measurements with wire sensors, the actual strains e(L) were determined, and then stress strains e(s) were separated from them (Figure 22). In the further part of the work, only the changes in stress strains e(s) over time will be analyzed.
3.4. Distribution of Force on the Elements of the Combined Piled Raft Foundation
The stress (pressure) change in the subsoil under the foundation slab was analyzed as a function of time (Figure 23). As mentioned earlier, the string pressure transducers were located in such a way as to enable the determination of the part of the foundation slab through which the load is transferred to the subsoil from the point support of the column type. One of the stress sensors was installed in a depression in the vicinity of the measured concrete column (S8), while the other two were in the middle of the spans, between the adjacent depressions (S7) and between the depression and the subsequent columns (S9) - compare Figure 2. The measurements were designed to provide the information necessary to determine the vertical load distribution between the subsoil under the foundation slab and the concrete columns.
The automatic measurement system was launched on 20/05/2016 at 16% of the construction progress about the shell of the entire building (compare Table 1), i.e., after the foundation slab and the ceiling above story -2 were completed in the part between axes C1-C5/15’-22’ and after concreting the foundation slab between axes B12-C7/10-15 (in the measurement area). In connection with the above, a correction was introduced to the stress measurement, consisting in taking into account the initial stress resulting from the thickness of the slab, i.e., 30 kPa for sensor S8 in the recess and 20 kPa for the two remaining sensors S7 and S9.
Based on the stress measurements in the subsoil under the foundation slab outside the recess (sensors S7 and S9), assuming for analysis the stress value from measurements taken between day 400 and 500, i.e., approx. 40 kPa, it can be hypothesized that the soil, apart from the foundation slab’s dead weight, transfers the load from the above-ground part of the structure at a level of approximately—20 kPa. The area of the slab within the column, where the recess of the foundation slab with an area of 3.5 m × 3.5 m is located, transfers to the ground a load that is more than twice as high, i.e., the stresses measured in the ground are of the order of 80 kPa, of which 30 kPa is the dead weight of the foundation slab, and 50 kPa is the load transferred by the column to the foundation.
To determine the load distribution on the subgrade and concrete columns, a comparison was made of the stress values transferred to the subgrade by the above-ground part of the structure (Figure 23), and the forces mobilized in the concrete columns (from Figure 24) with the total value of the force transferred by the column to the foundation slab. This force was estimated by the structural designer at the level of Fc,d = 10125 kN based on the analysis of the FEM model of the above-ground part of the structure. Assuming the average load factor at the level of 1.2 (static and strength calculations were carried out based on the PN-B standard package), the average value of the force in the column can be estimated as Fc,k = 8438 kN). The additional load on the ground beyond the slab depth, which was measured the value was 20 kPa in the area of 7.75 m × 10.30 m - 3.5 m × 3.5 m = 67.6 m2, allows us to estimate the value of the force taken up by the ground under the slab at the level of Fr2,k = 1352 kN. The additional load on the ground under the slab recess determined based on the measured stress of 50 kPa in the area of 3.5×3.5 = 12.3 m2 gives the force value Fr1,k = 613 kN. In total, the plate transfers a force of Fr,k = 1965 kN to the subgrade. The value of the axial force estimated after 788 days based on the measurement of concrete deformations with the P1_3 sensor located near the head of the P1 column is Fp,k = 869 kN. Considering the actual distribution of 7 columns within the recess (Figure 170), it can be assumed that the total load taken by the group of columns is Fpg7,k = 7 × 869 kN = 6083 kN. The sum of the values of the force taken by the ground Fr,k = 1965 kN and the columns Fpg7,k = 6083 kN is Fc’,k = 8048 kN is very close to the force value specified by the structural designer, i.e., 8438 kN. The difference is about 4.8%. Finally, it can be assumed that in the analyzed plate-pile system, the subsoil takes over Fr,k / Fc’,k = 1965/8048 = 24.4% of the total load transferred to the foundation from the column and the Fpg7,k/ Fc’,k column = 6083/8048 = 75.6% of this load.
3.5. Analysis of the Behavior of Columns as an CPRF Element
Figure 24 shows the changes in the values of axial forces in columns P1 and P2 as a function of time, estimated based on deformation measurements using sensors placed along the tested columns.
After about 100 days of observation in column P2, sensor P2_3, which is located in the vicinity of the column head, no correct readings were observed.
During the measurements of deformations in column P4, 120 days after their commencement, the lack of correct readings was found in two sensors: the lowest (P4_1) and the highest located (P4_3) sensor. The fault caused by the broken wiring was removed in sensor P4_3 after 560 days.
During the installation of the measuring system in column P6, the repeated lifting and pressing of the steel I-beam into the concrete mix damaged the cable of the lowest-located sensor P6_1.
After approximately 70 days of readings in column P6, the middle sensor of column P6_2 was not receiving correct readings. The sensor was restored to working order after 560 days.
For all columns, after the conventional date of completion of the shell stage of the structure, i.e., after 201 days from the start of automatic measurements, a uniform increase in deformations is observed in all sensors installed in a given column.
Generally, it can be assessed that in column P3, friction along the side surface is mobilized the least. The force diagrams in the upper part of the column show similar values, while they overlap in the lower part. Column P1 behaves similarly, but the decrease in axial force with depth is more pronounced here, which may indicate better mobilization of friction. Column P2 shows better cooperation with the soil medium.
Columns P5, P6, and P4 observe the highest values of the estimated axial forces, which indicates that these columns operate very effectively.
The analysis of the change in the axial force value as a function of time (Figure 24) over 788 days allowed for the following conclusions to be drawn:
Column P1 (No. 257)
Column P1 works in a group of 5 or 7 columns if we consider the additional two anchor columns made to carry out the test (Figure 25) at a spacing of 1.4 m (approx. 3.5D). Considering the anchor columns, column P1 works as a middle column.
Figure 26 compares the distribution of the axial force along column P1 for the last reading taken into account in this analysis, i.e., after 788 days from the start of measurements on 20/05/2016, with the change in the value of the axial force from the test load of the column. The course of the axial force along the column for the last reading leads to the conclusion that the side surface of the column in the plate-pile system works weaker than in the single-layer system. The value of the axial force along the length of the column in the plate-pile system decreases slightly, i.e., by approx. 230 kN over the measured length of 10 m, in contrast to a single column, where the decrease in the force value along the length is apparent. The reduction in the contribution of the FPP column sidewall to load transfer is compensated by better mobilization of force in the lower unmeasured part of the column with a length of 8.8 m, including the base. This can be explained by increased friction on the sidewall in the lower part of the column and/or increased mobilization of the soil resistance under the column base.
The observations led to the conclusion that the statement about the existence of the so-called “dead zone” that typically occurs at small axle spacing should be considered correct. Columns of the 3D row This situation can be explained by the limitation of friction mobilization on the side due to the reduction of the relative displacement of the upper section of the column about the surrounding soil. As a result of the pressure of the slab on the columns and the ground, the columns and the surrounding soil under the slab are subject to identical displacement. This interpretation is consistent with the conclusions presented in [28] regarding the interactions between piles and the interactions between piles and the slab, according to which the friction on the side of the pile/column in the combined piled raft foundation is mobilized only in its lower part, i.e., on 1/3 to ¼ of the total pile length, i.e., 6.3 m in the case of our tests.
Column P2 (No. 329)
The P2 column works in a 5-column arrangement (after considering the additional two anchor columns, Figure 25), with a spacing of 2.30 m (approx. 5.85D).
The P2 column should be defined as the middle one in the column arrangement. Considering the column spacing close to 6D, according to the conclusions from the numerical analysis [9], it should be expected that the P2 column will work similarly to a single column.
Later in the work, a more extensive analysis for column P2 was performed, supplementing the field measurements with the results of numerical analysis.
Column P3 (No. 222)
The P3 column works in a 3-column arrangement (Figure 25) as a middle column with a spacing of 1.43 m (3.6D).
As stated above, in column P3, friction along the side surface is mobilized the least. In comparison to other columns. Very similar force values in three sensors, practically throughout the entire measurement period, indicate that the column load of 750 kN is transferred to a small extent by the first measured section of the column (approx. 130 kN) and, above all, by the lower, unmeasured part of the column, i.e., the side surface together with the base. Relating these observations to Kazenbach’s conclusions [6] from the monitoring of piles under the Commerzbank Tower building in Frankfurt, it can be assumed that columns embedded in load-bearing sands underlying much weaker dust mobilize a high value of friction on the side surface.
Columns P4, P5 and P6
It is assumed that columns P4, P5 and P6 operate in similar ground conditions and under similar load conditions. Column P5 operates in a single-column configuration, column P6 in a two-column configuration (spacing 2.83 m), and column P4 in a three-column configuration (spacing 2.33 m), as in Figure 27.
From the direct readings, the full distribution of force values along the length of column P5 can be estimated. In columns P4 and P6, although time-limited, reading is possible at the middle sensor (P4_2 and P6_2) and at the column head (P4_3 and P6_3).
Comparing the readings from the highest positioned sensors (Pi_3) in all three columns, it can be concluded that the force values on the last day of measurement are very similar to each other (1227 kN, 1203 kN, 1148 kN for columns P4, P5 and P6, respectively).
Comparing the axial force drop on the upper measured section of the three columns, between sensors Pi_3 and Pi_2, it can be observed that the column side surface P4 works best, then P6 and P5, with the axial force decreasing by 595 kN, 362 kN and 243 kN, respectively.
To sum up, based on the distribution of estimated axial force values along the length of the column on the last day of measurement, based on the change of the axial force value with depth, it can be concluded that the behavior of columns P1, P2 and P3 is similar to the behavior of typical middle (inner) piles in a plate-pile system. Columns P1, P2 and P3 are located inside the group of columns (Figure 25). The small differences in the interpreted force values indicate poor side surface performance. The reduction in side surface friction observed at the top of the columns indicates the existence of a “dead zone”.
Based on the measurements carried out, the behavior of columns P4, P5 and P6 can, with high probability, be compared to the behavior of typical columns corner/edge in the spacing of the order of 6D. Columns P4, P5 and P6 were located on the edge of the column group. Mobilization of friction on the side surface along the entire length of the column results in a significant decrease in the axial force along the column.
3.6. Detailed Analysis of the P2 Column Based on Field Measurements and FEM Calculations (ZSoil)
Based on the measurement of the actual deformations of concrete columns, a part was distinguished stress, and then the axial force values were derived. This approach was particularly important for the sensors closest to the heads, where the most significant temperature changes were observed. In the case of columns P2 and P4, it was impossible to measure the strain in the column just below the foundation slab after 100 and 120 days, respectively.
Hence, to determine the course of the change of the axial force in the column head during P2, as a supplement to the readings from the P2_3 sensor during the field tests, a numerical analysis was carried out using the Finite Element Method in the ZSoil program. The analysis also verified the possibility of using alternative tools to determine the values of axial forces in the column caused only by changes in load without the influence of temperature. The column choice resulted from possibly calibrating the model based on the load-settlement relationship from the test load. Moreover, thanks to the geodetic monitoring of the foundation slab settlements on the benchmark located directly above the P2 column, it was possible to obtain the information needed to compare the work of the combined piled raft foundation column with the column working independently.
3.6.1 FEM Model.
The FEM model [28] [29]was limited to a detailed analysis of the part of the structure located between the B12-C7/10-15 axes (red contour) with column P2, taking into account the influence of the part located between the C1-C5/15’-22’ axes and parts of the neighboring buildings with uniformly distributed load shown in Figure 28. The model considered the point average load from the most unfavorable combination of loads from all stories of the analyzed building acting on the foundation slab (from ARSA to Zsoil). The load in the form of concentrated forces was applied to the foundation slab at the locations of columns and walls. The model reproduced the actual arrangement of columns with their lengths from the as-built documentation. The columns were modelled as piles (beams) with a D = 0.40 m diameter. To stiffen the structure, all stories were taken into account in the FEM model.
In order to model the subsoil, the constitutive soil model HSs (Hardening Soil model with small stiffness) [30]was used, for which the parameters were selected based on the available results of field and laboratory tests (Table 4).
The parameters adopted for the constitutive model of the subsoil medium were verified by comparing the load–settlement relationship for column P2 during the test load (Figure 29) and the settlement of the foundation slab located between the axes B12- C7/10-15 of the building part (Figure 30).
Comparing the results of field tests and numerical simulations, a relatively good convergence with the results of the test load of column P2 can be observed (Figure 29). The numerically estimated settlement of the foundation slab compared to the geodetic measurements indicates a two- or three-fold overestimation of the results (Figure 30A and C), assuming the full load of the building. Assuming that 60% of the target weight of the building is applied to the foundation slab, the subsoil settles quite similarly to reality (Figure 30A and B). It is worth noting that the geodetic measurement of 12/06/2018 did not show any differences (except for the R11_H benchmark, where the change was 1 mm) compared to the measurement from 30 January 2017, i.e., from the 254th day from the start of automatic measurements. Based on the assumptions made at the beginning of the chapter (Table 29), on the 201st day from the launch of the measuring platform, the progress of work on the building structure was approximately—50%.
Analysis of Results
The analysis of the changes in the value of the axial force as a function of time for the measured columns (Figure 24) showed that this course is bilinear. In the conventional time of 200 days, the increase in the axial force for all correctly functioning sensors is more significant than for later measurements. Geodetic measurements of the foundation slab settlements over time confirmed these observations.
For deformation measurements taken after day 201, i.e., for the finishing phase of the building, taking into account the estimated change in the force values determined based on the measurements with individual sensors (P2_2 and P2_1), it was estimated that the finishing works, which translated into a further increase in load, progressed at a rate of 0.04% per day. Hence, for further analysis, the steps of 55%, 60%, 70% and 80% of the total load were conventionally assumed as 325, 450, 700 and 949 days from the start of automatic measurements on 20/05/2016.
The FEM analysis in ZSoil was performed assuming the nodal load from ARSA, as a result in the form of reactions from rigid supports, on which the entire structure of the building was based, including the foundation slab. This situation resulted in the inability in ZSoil to take into account the direct transfer of the load from the foundation slab’s own weight to the subsoil. Therefore, the values of axial forces in the numerically modeled columns were corrected by the value of the foundation slab’s weight.
Considering that automatic measurements began after the foundation slab and the ceiling above the “– 2” level were completed, the modification of axial forces also included the ceiling weight. In total, according to Table 1, the values of axial forces, estimated numerically at each load step, were reduced by the value of forces generated for 16% of the full load. In accordance with the records from the Construction Journal regarding the commencement of concreting of individual levels of the building, for each characteristic load step, the corrected value of axial force at the depth corresponding to the location of sensors P2_3, P2_2 and P2_1 was read from the ZSoil program and compared with the force values from the column deformation measurements (Figure 31). Additionally, the values of axial force at a depth of 14.48 m estimated in ZSoil were plotted.
Comparative analysis of the results indicates a good convergence of the force values in sensors P2_2 and P2_1, especially in the last three steps of the construction implementation phase and at the building completion stage. After exceeding the conventional step of 70% of the building load, the force values from field measurements stabilize, while the forces from the numerical analysis continue to increase. Similarly to the observations from the building settlements, which stabilized and did not change the settlements estimated numerically for the 60% load step, a further increase in the axial force resulting from the FEM analysis can be considered unjustified.
This is most likely because the load values from the most unfavorable combination were used in the numerical analysis and were overestimated compared to the actual values. The numerically determined value of force as a function of time in the P2_3 sensor, located in the vicinity of the column head, allowed for a comparison of the behavior of a single column with the behavior of a column of a combined piled raft foundation. Figure 177 shows the course of the load settlement relationship of the column head. The actual measurement of the foundation slab settlement in the benchmark located directly above the P2 column was compared with the value of force in the P2_3 sensor read from the FEM model.
Hyperbolic curve approximation of actual measurements of the test (dashed line). FPP force vs. plate settlement – column working in FPP: force readings from FEM analysis after axial force correction vs. plate settlement above column P2 and results from FEM analysis with axial force correction (ZSoil – P2_3 FPP).
Based on the comparison of the load-settlement (Ns) curve for a single column from the test load with the Ns curve for a column with a combined piled raft foundation (Figure 32), it can be concluded that the FPP column, in the range of small deformations of the soil medium (correspondingly, the settlement of the column head at the level of several millimeters), is characterized by lower stiffness, i.e., it settles more than an independent column at a similar load value.
Considering the ongoing development of construction works, determining the force-time course in the P2_3 sensor, located near the column head and at an additional depth of 14.5 m (Figure 31), made it possible to supplement the actual measurements and compare the axial force distribution along the length of the combined piled raft foundation column with the force distribution measured in a single column during test loads (Figure 33).
Based on the linear approximation of the numerically estimated values in ZSoil, the force values in sensors P2_2, P2_1, and P2_0 were determined for the force value read in sensor P2_3 from the test load. The compiled information made it possible to draw the following conclusions:
- For the first three load steps (137 kN, 274 kN, 412 kN), the value of the axial force in the FPP column is reduced to a lesser extent compared to the single column, which can be interpreted as a weaker mobilization of friction on the side surface of the column,
- For subsequent load steps, we observe different behavior of the FPP column – a more significant decrease in the axial force along the length of the FPP column indicates a more significant mobilization of friction on the side surface than in the case of a single column,
- The involvement of the side surface in the cooperation in the ground with relatively low mechanical parameters in the FPP sub-plate zone, compared to the lack of mobilization of friction on the side surface of the column working independently, can be explained by the increase in vertical normal stresses in the soil medium around the column, caused by the pressure of the foundation slab.
4. Conclusions
The measurement system consisting of a setup for monitoring stress changes in the soil beneath the building’s slab, as well as a system for measuring deformation of concrete columns was presented. It could be considered as a significant contribution to the development of knowledge regarding the interaction between the elements of combined piled-raft foundation.
In the analysis, actual deformations resulting from temperature changes were separated from stress-induced deformations arising from changes in load, and only stress-induced deformation changes over time were further interpreted.
Using measurements of soil stresses and forces in the columns, the distribution of load between the subsoil and the concrete columns was estimated, indicating that in the analyzed piled-raft system, the columns bear 75% of the total load from the pillar. The analysis of changes in axial force values in six columns over time showed that after exceeding the conventional date marking the completion of the raw structural state, i.e., approximately 201 days after the start of automatic measurements, the increase in force in all sensors for a selected column occurred proportionally. Among the examined columns, the following behaviors were observed:
- typical behavior for middle columns with small changes in axial force measured along the column, indicating weak lateral skin friction and simultaneously suggesting the existence of a “dead zone.”
- typical behavior for corner/boundary columns with spacing on the order of 6D, with the ability to mobilize friction along the entire length of the column, ultimately resulting in a distinct decrease in axial force at depth.
Based on finite element analysis (FEA) in ZSoil, missing readings at the head and base of one of the columns were supplemented, while simultaneously comparing these readings with those from other correctly functioning sensors. Comparing the behavior of an individual column with the behavior of the piled-raft foundation column, it was deduced that the piled-raft column, within the range of small settlements (several millimeters), exhibits lower “stiffness” than a single column. However, with larger settlements (0.06D), an increase in load-bearing capacity and stiffness of the piled-raft foundation column was observed, in line with conclusions from archival analyses.
Author Contributions
Conceptualizations (G.K), Data curation (G.K), Formal analysis (G.K), Investigation (G.K), Methodology (G.K), Software (G.K), Supervision (G.K), Validation (G.K), Visualization (G.K), Writing—original draft (G.K and S.M.K), and Writing— review and editing (G.K and S.M.K).
Funding
There is no funding.
Institutional Review Board Statement
Not applicable.
Informed Consent Statement
Not applicable.
Data Availability Statement
The data is provided by the corresponding author.
Conflicts of Interest
The authors declare there is no conflict of interest.
References
- Gotman, N.Z.; Gotman, A.L. A contribution to the piled raft foundation design. Darmstadt Geotechnics 2009, 18, 91–99. [Google Scholar]
- Reuil, O.; Randolph, M.F. Optimized design of combined pile raft foundations. Darmstadt Geotechnics 2009, 18, 149–169. [Google Scholar]
- Kharichkin, A.; Bezvolev, S. Soil-pile interaction in pile foundation and pile reactions monitoring. Darmstadt Geotechnics 2009, 18, 243–255. [Google Scholar]
- Kharichkin, A.; Godzikovsky, V.A.; Antonov, V.D. Patent for SVD-100 Pile dynamometer, RU 69241 U1, 2006.
- Sonoda, R.; Kitiyodom, P. Post-analyses of settlements of piled raft foundation in a reclaimed ground. Darmstadt Geotechnics 2009, 18, 289–306. [Google Scholar]
- Katzenbach, R.; Moorman, C. Piled raft foundation projects in Germany. In Design Applications of Raft Foundations; Hemsley, J.A., Ed.; London, UK, 2000; pp. 323–391.
- Sommer, H.; DeBenedittis, D. Messe Turm, foundations for the tallest building in Europe. In Proceedings of the 4th DFI Conference, Stresa, Italy, 1991; pp. 139–145.
- Sommer, H. Development of locked stresses and negative shaft resistance at the piled raft foundation – Messeturm Frankfurt/Main. Deep Foundations on Bored and Auger Piles; Van Impe, W.F., Ed.; Balkema, Rotterdam, 1993; pp. 347–349.
- El-Mossallamy, Y.F.E. Piled rafts: numerical modeling to simulate the behavior of piled raft foundations. Darmstadt Institute of Geotechnics 1997. [Google Scholar]
- Tamaro, G.J. Foundation engineers: why do we need them? Martin S. Kapp Lecture, ASCE, New York, 1996.
- Additional geotechnical studies for the construction of the PROKOCIM University Hospital building at Jakubowskiego and Kostaneckiego Streets in Kraków. Geocontrol Design and Research Institute Sp. z o.o., Kraków, 2015.
- Geological and engineering documentation for the concept of the new seat of the PROKOCIM University Hospital at Jakubowskiego and Kostaneckiego Streets in Kraków, Kraków, 2007.
- Buda-Ożóg, L.; et al. Distributed fibre optic sensing: Reinforcement yielding strains and crack detection in concrete slab during column failure simulation. Measurement 2022, 195, 111192. [Google Scholar] [CrossRef]
- Siwowski, T.; Rajchel, M.; Sienko, R.; Bednarski, L. Smart monitoring of the FRP composite bridge with distributed fibre optic sensors. In Proceedings of the 9th International Conference on Fibre-Reinforced Polymer (FRP) Composites in Civil Engineering (CICE 2018), Paris, France, 2018; pp. 17-19.
- Mardanshahi, A.; Sreekumar, A.; Yang, X.; Barman, S.K.; Chronopoulos, D. Sensing Techniques for Structural Health Monitoring: A State-of-the-Art Review on Performance Criteria and New-Generation Technologies. Sensors 2025, 25, 1424. [Google Scholar] [CrossRef] [PubMed]
- Sieńko, R.; Bednarski, Ł.; Kanty, P.; Howiacki, T. Application of Distributed Optical Fibre Sensor For Strain and Temperature Monitoring within Continuous Flight Auger.
- Pozo, F.; Tibaduiza, D.A.; Vidal, Y. Sensors for structural health monitoring and condition monitoring. Multidisciplinary Digital Publishing Institute 2021, 21, 1558. [Google Scholar] [CrossRef] [PubMed]
- Wu, T.; Liu, G.; Fu, S.; Xing, F. Recent progress of fiber-optic sensors for the structural health monitoring of civil infrastructure. Sensors 2020, 20, 4517. [Google Scholar] [CrossRef] [PubMed]
- Zhu, R.; et al. Improving the Performance of Piled Raft Foundations Using Deformation Adjustors: A Case Study. Buildings 2022, 12, 1903. [Google Scholar] [CrossRef]
- Capozzoli, L.; Fornasari, G.; Giampaolo, V.; De Martino, G.; Rizzo, E. Multi-Sensors Geophysical Monitoring for Reinforced Concrete Engineering Structures: A Laboratory Test. Sensors 2021, 21, 5565. [Google Scholar] [CrossRef] [PubMed]
- Bednarski, Ł.; Sieńko, R.; Grygierek, M.; Howiacki, T. New distributed fibre optic 3D Sensor with thermal self-compensation system: Design, research and field proof application inside geotechnical structure. Sensors 2021, 21, 5089. [Google Scholar] [CrossRef] [PubMed]
- Wang, D.; Yang, X.; Zhang, S.; Chen, C.; Zhao, Y. Long-Term Bearing Capacity of Concrete Pile Composite Foundation under Composite Salt Erosion. Buildings 2024, 14, 289. [Google Scholar] [CrossRef]
- Sieńko, R.; Bednarski, L.; Howiacki, T. About distributed internal and surface strain measurements within prestressed concrete truck scale platforms. In IOP conference series: materials science and engineering, 2019, 471, 052074. [Google Scholar] [CrossRef]
- Bednarz, B.; Popielski, P.; Sieńko, R.; Howiacki, T.; Bednarski, Ł. Distributed fibre optic sensing (DFOS) for deformation assessment of composite collectors and pipelines. Sensors 2021, 21, 5904. [Google Scholar] [CrossRef] [PubMed]
- Howiacki, T.; Sieńko, R.; Zuziak, K. Distributed strain, settlement and temperature sensing in geotechnical earth embankments. In Geotechnical Engineering Challenges to Meet Current and Emerging Needs of Society; CRC Press, 2024; pp. 1457-1462.
- Kamiński, K.; Nowicki, P. Designing Compressed Reinforcement Cross-Sections by Curvature and Nominal Stiffness Methods. Applied Mechanics and Materials 2016, 797, 69–78. [Google Scholar] [CrossRef]
- Bednarski, Ł.; Sienko, R. Measurements of structure deformations using wire sensors. Inżynieria i Budownictwo 2013, 615–619. [Google Scholar]
- Kacprzak, G.; Biss, M. FEM analysis (ZSoil) of the displacement columns of the slab-pile foundation of building H of the University Hospital Collegium Medicum in Krakow. Warbud SA, Warsaw, September 2017.
- Biss, M. Calculation of settlements of buildings using FEM. Master’s thesis, Warsaw University of Technology, 2017.
- Truty, A. Hardening soil model with same strain stiffness. Technical report, Zace Services Ltd., 2008.
Figure 1.
Geological-engineering cross-section of the ground beneath the analyzed building. The location of the tested concrete columns (P1 to P6) was marked [11].
Figure 1.
Geological-engineering cross-section of the ground beneath the analyzed building. The location of the tested concrete columns (P1 to P6) was marked [11].
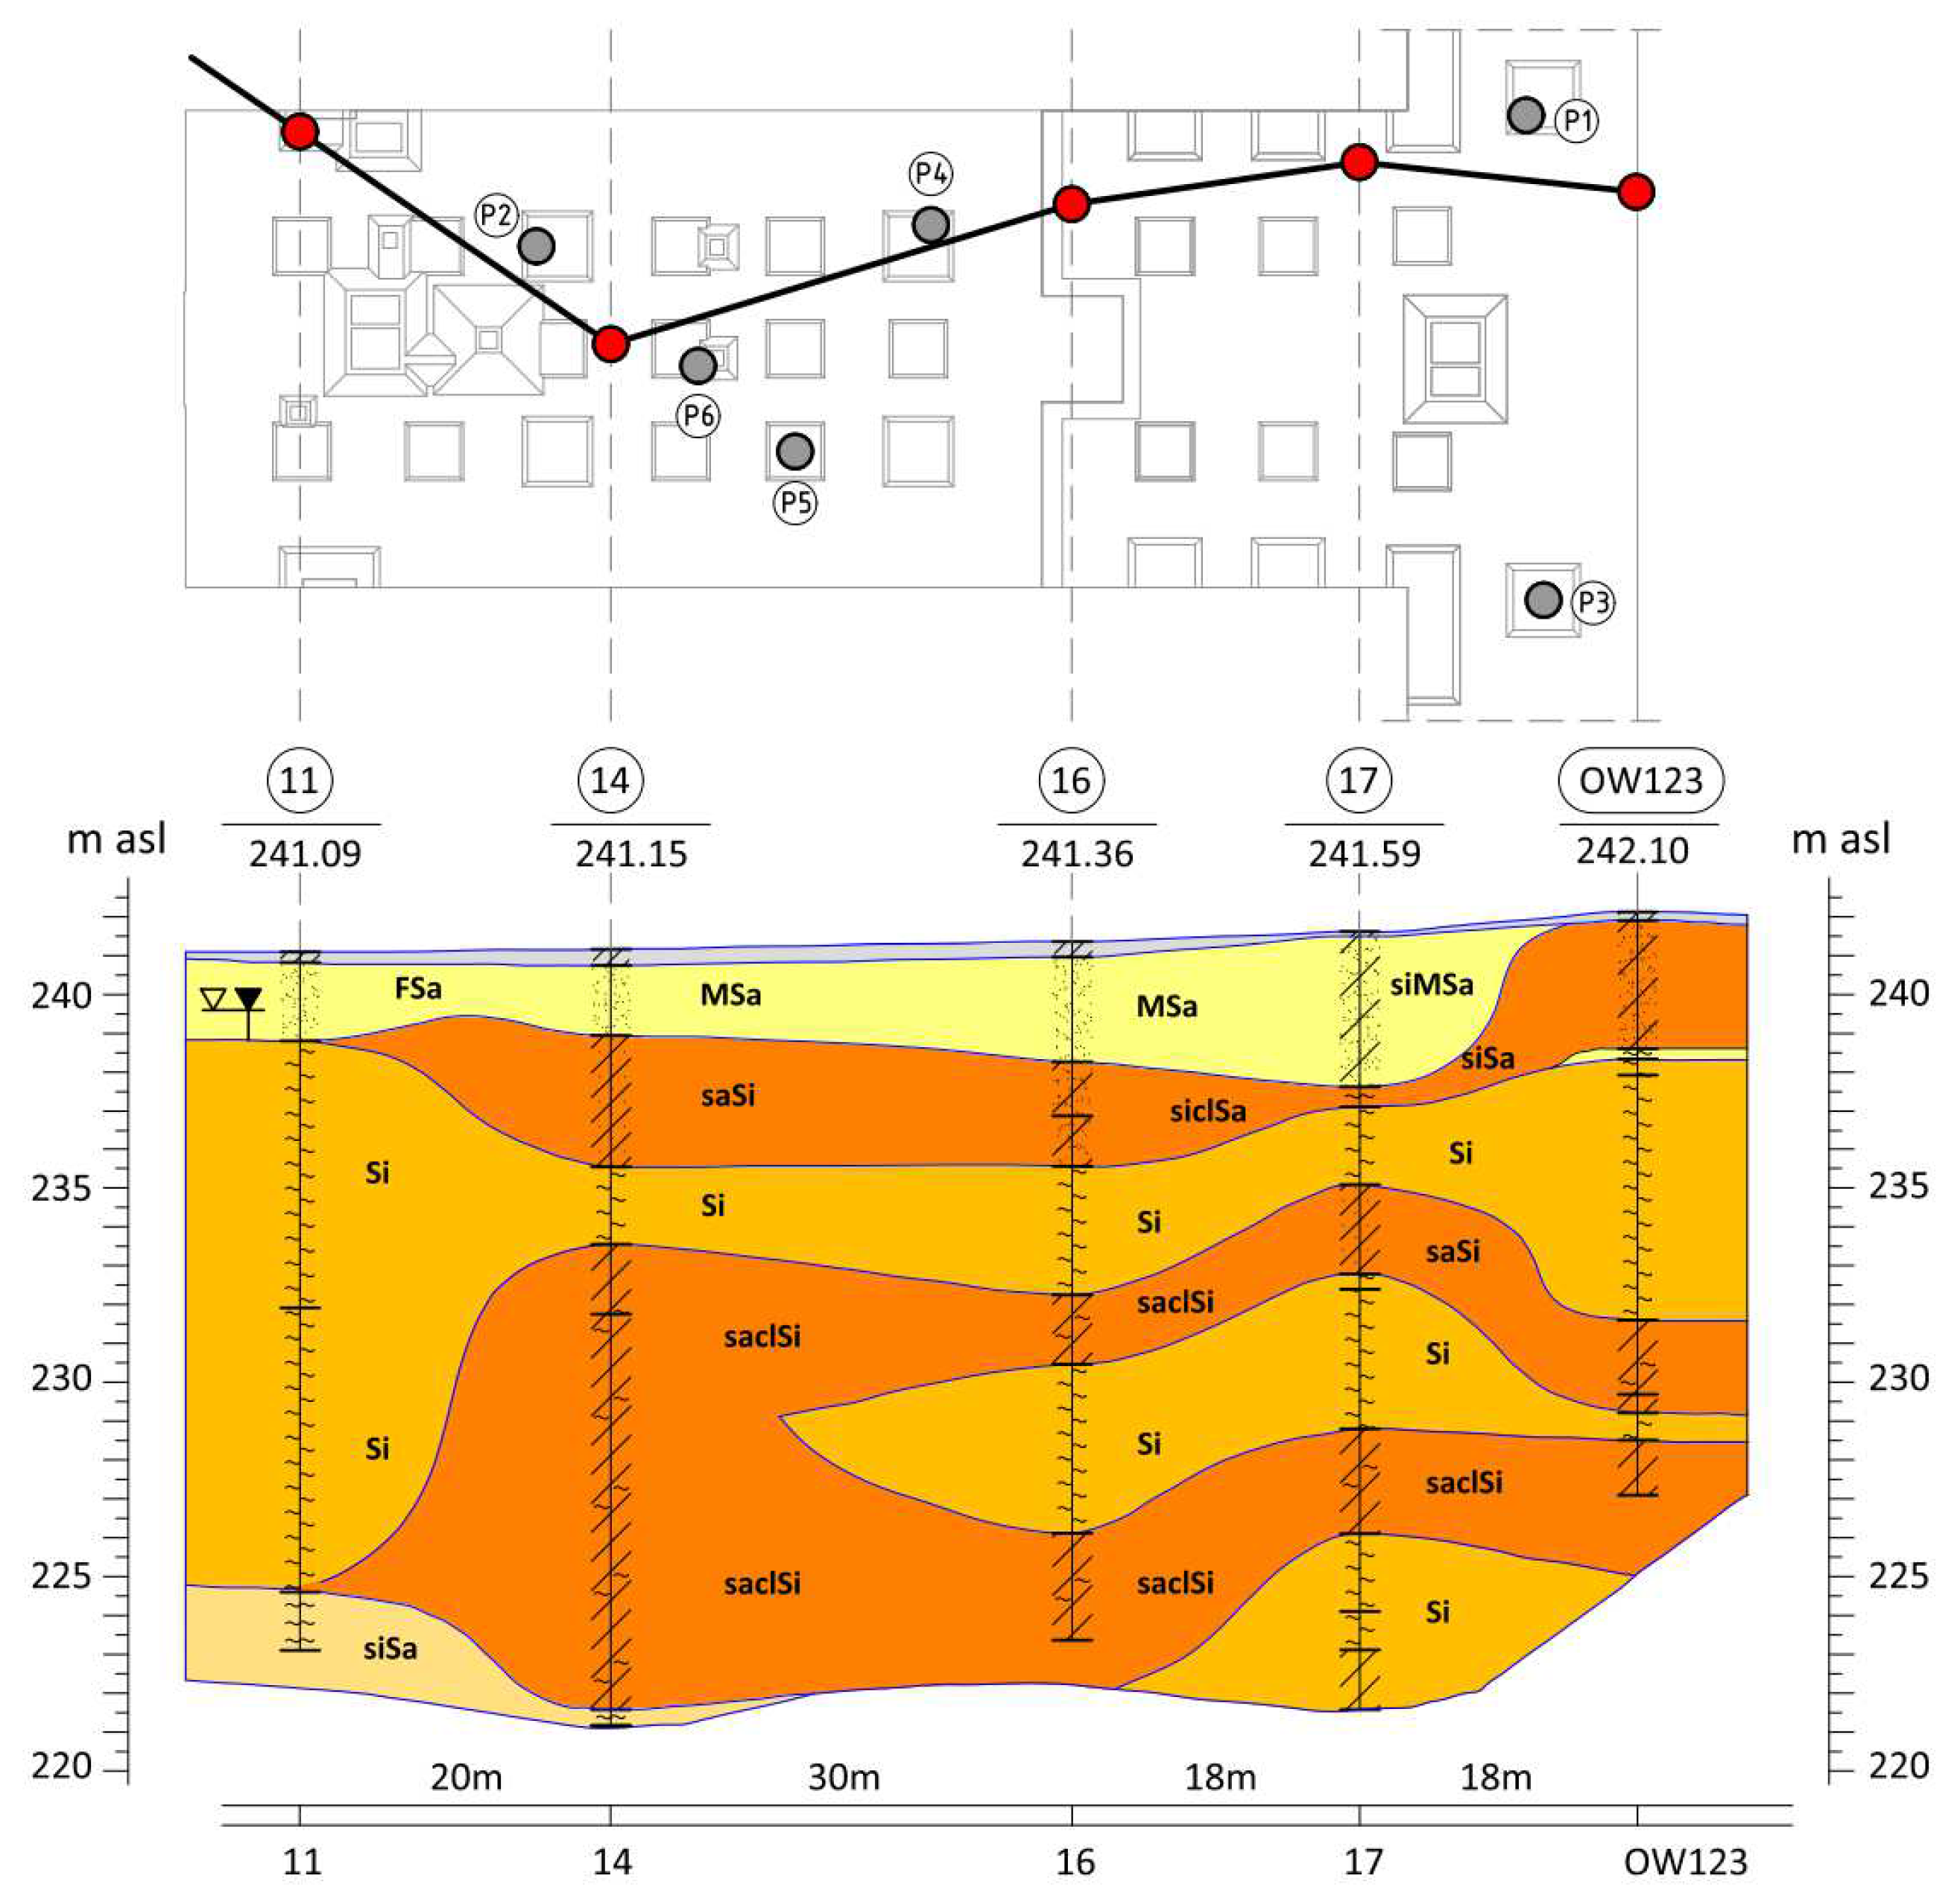
Figure 2.
CPT probing in the vicinity of columns P1 and P2 [12].
Figure 2.
CPT probing in the vicinity of columns P1 and P2 [12].
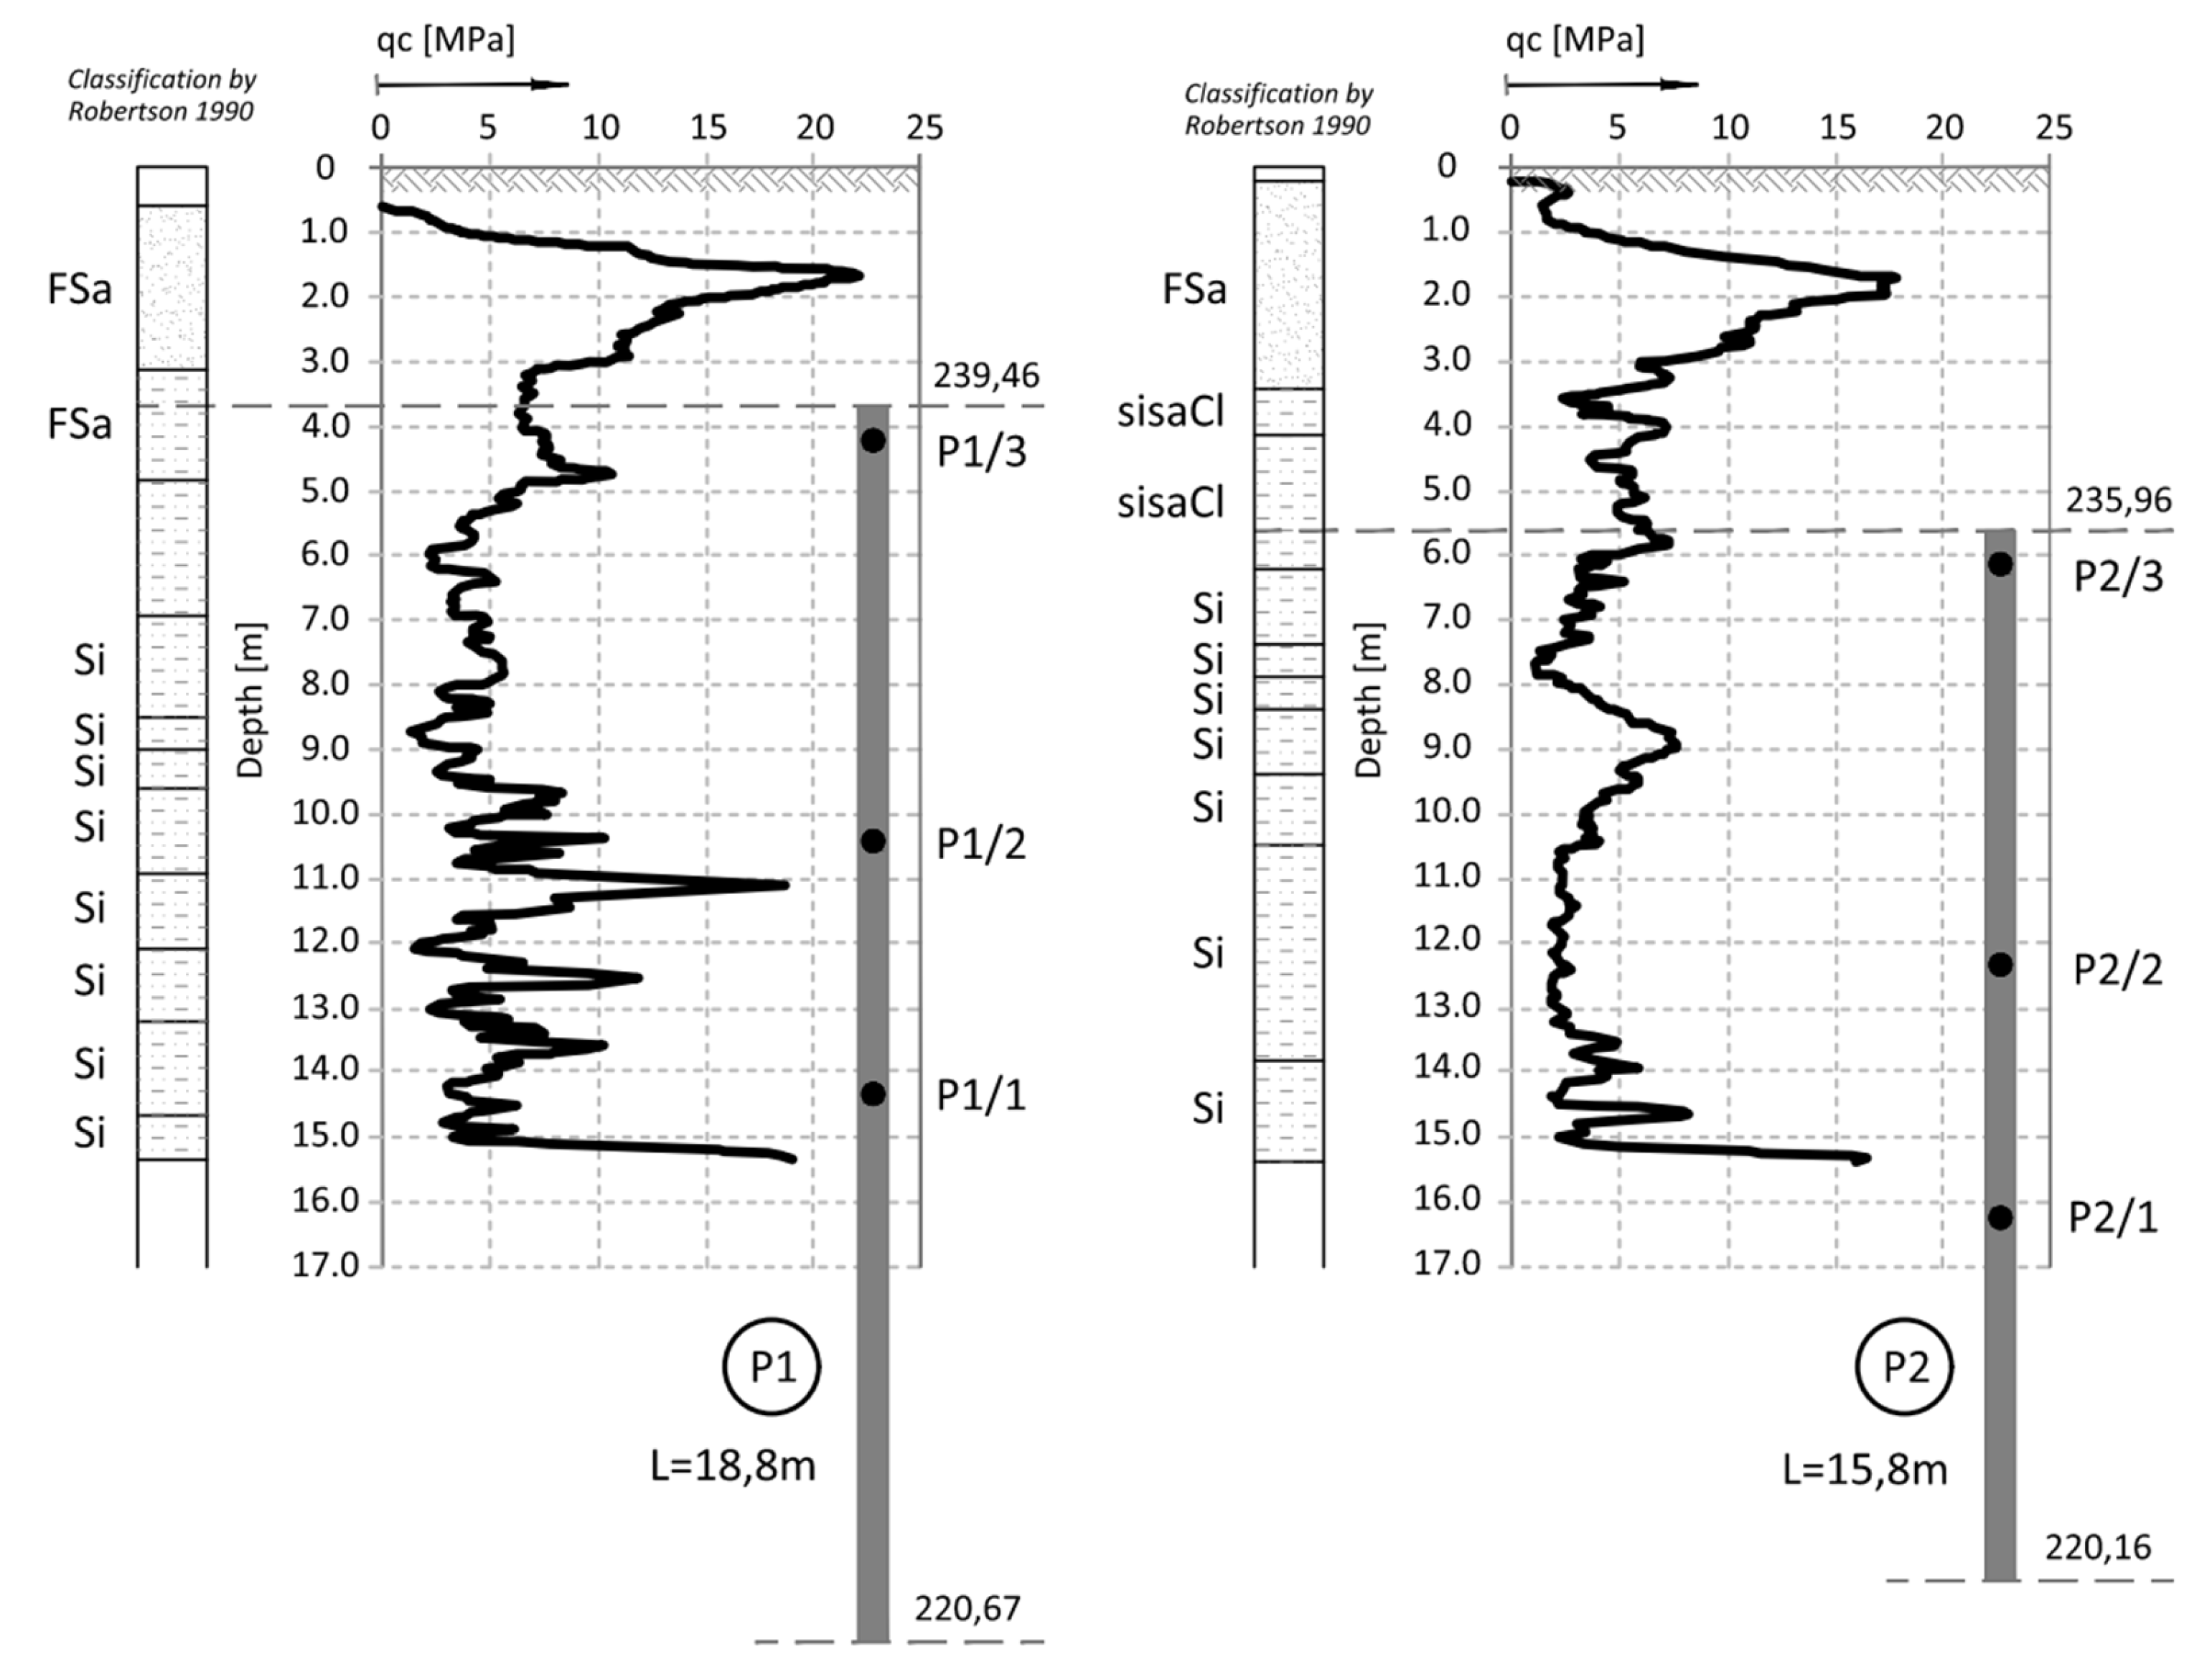
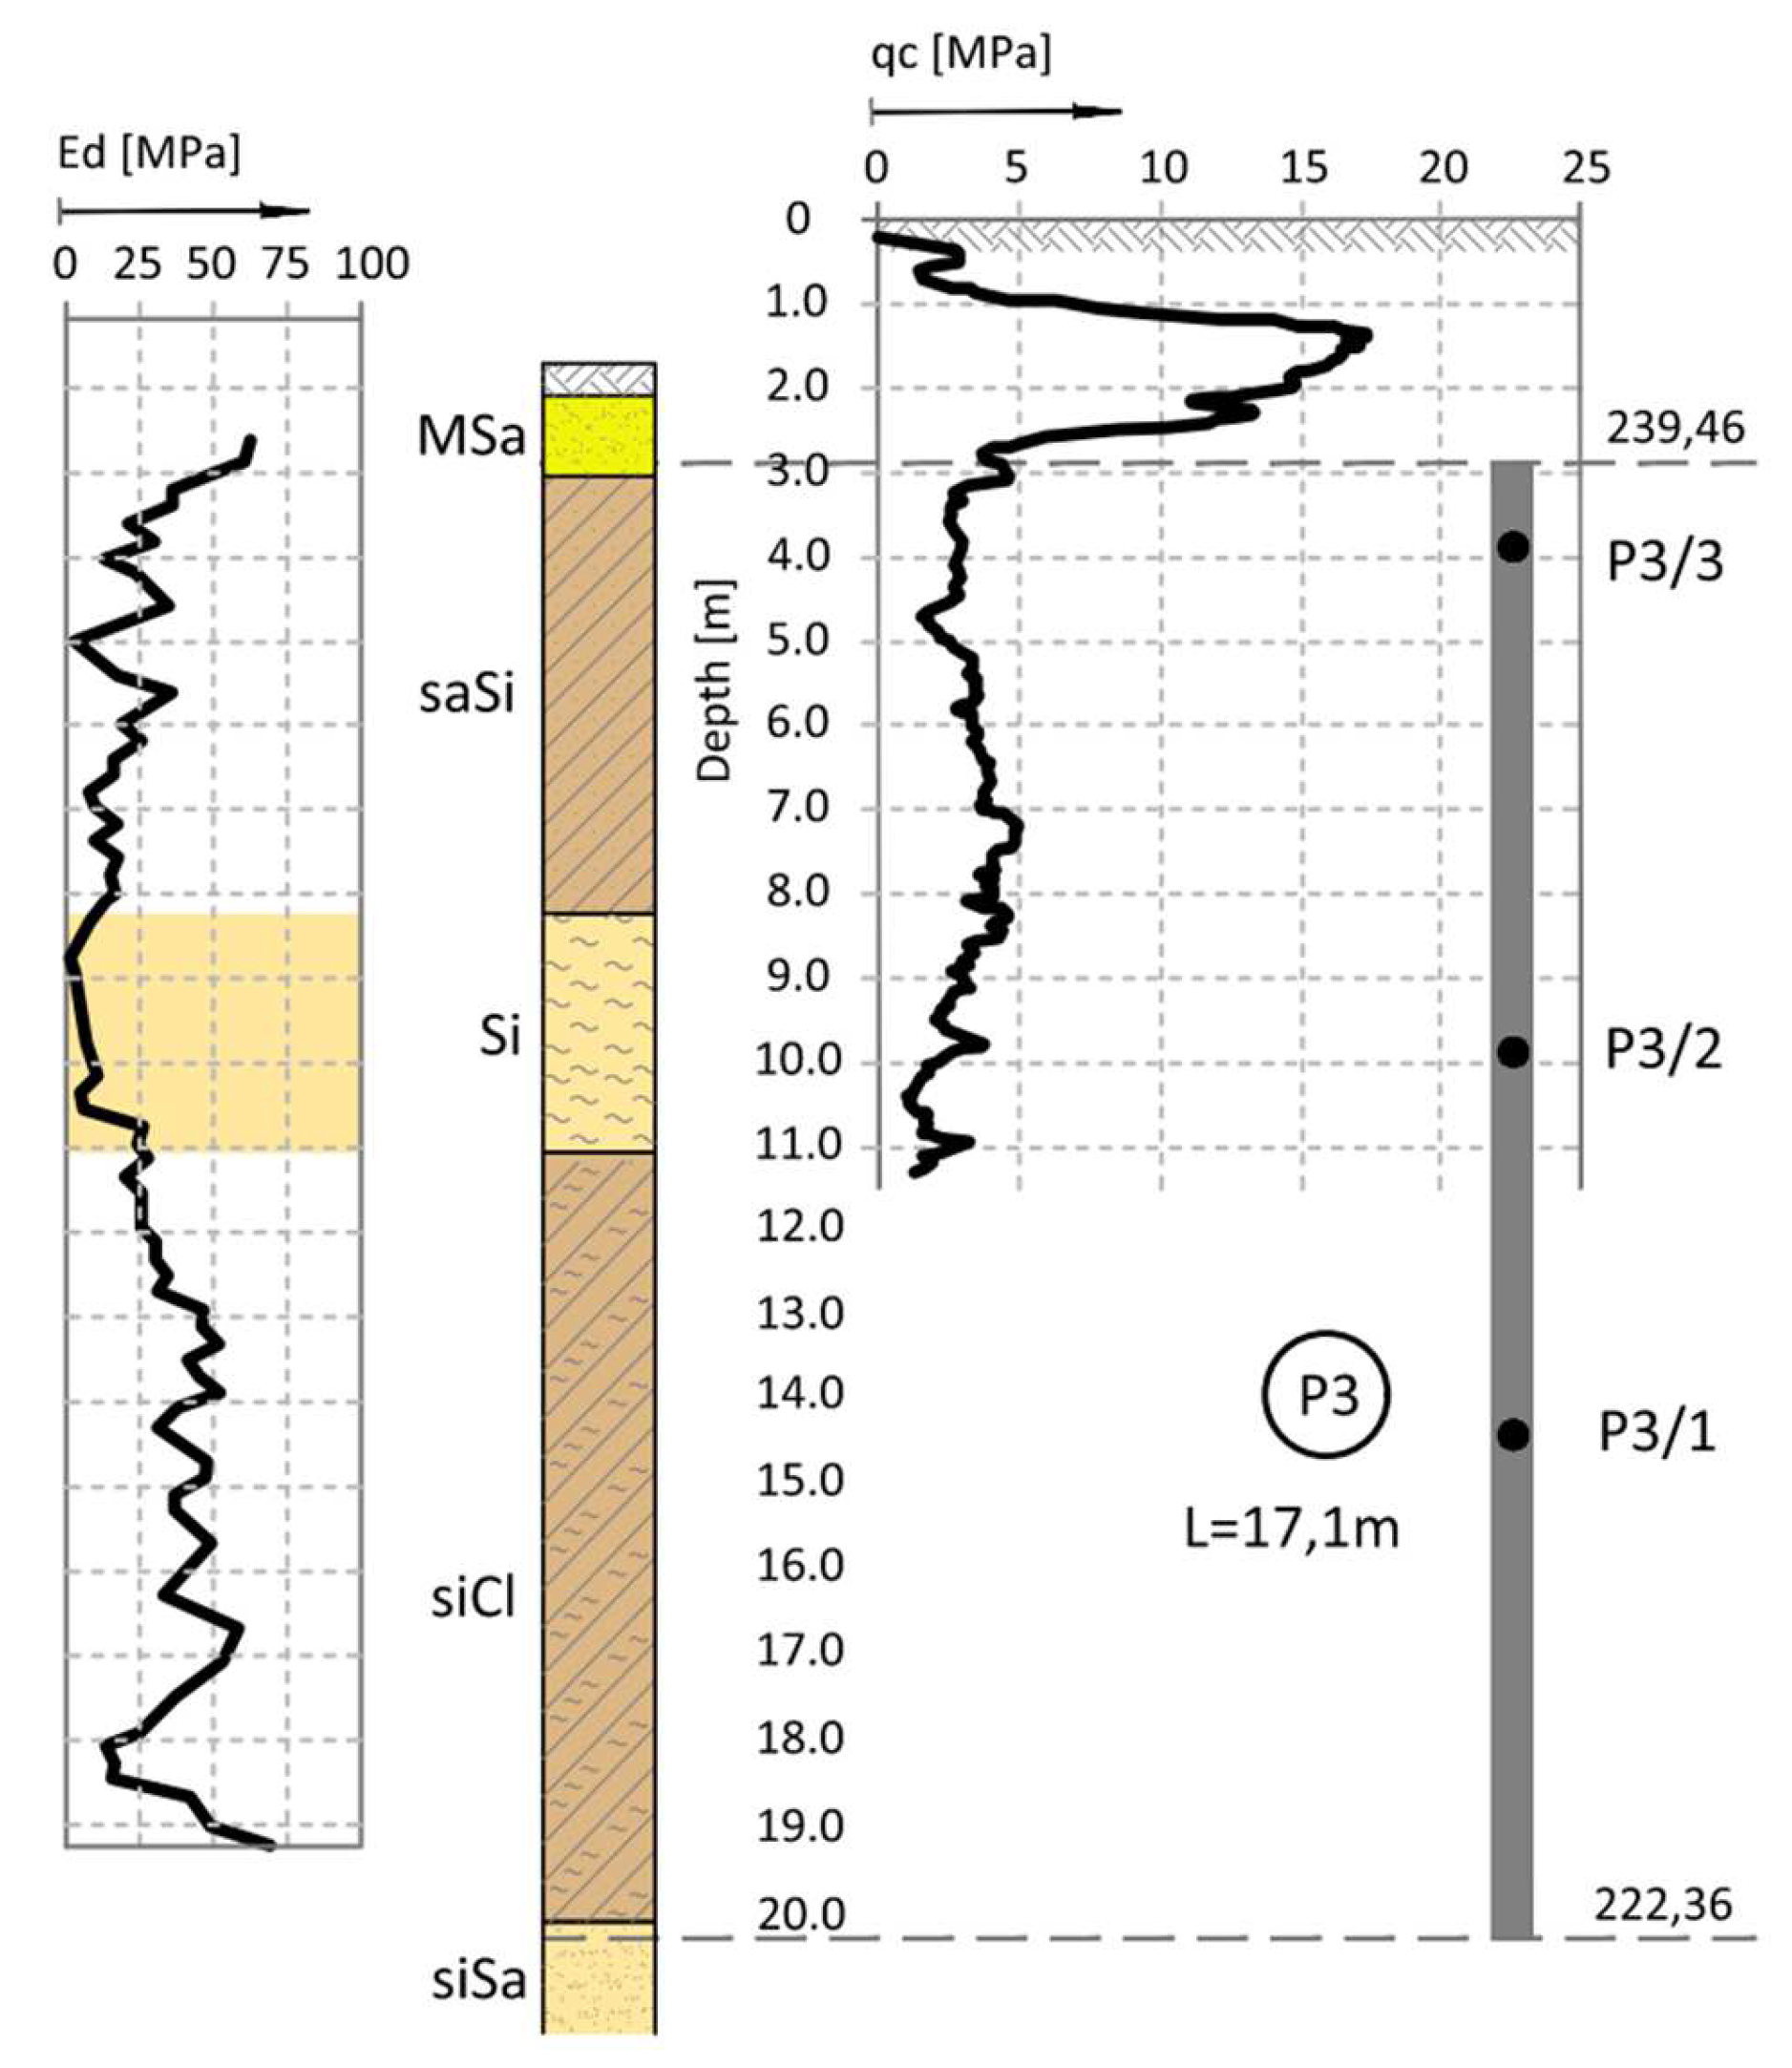
Figure 4.
CPT probing in the vicinity of columns P4, P5 and P6 [12].
Figure 4.
CPT probing in the vicinity of columns P4, P5 and P6 [12].
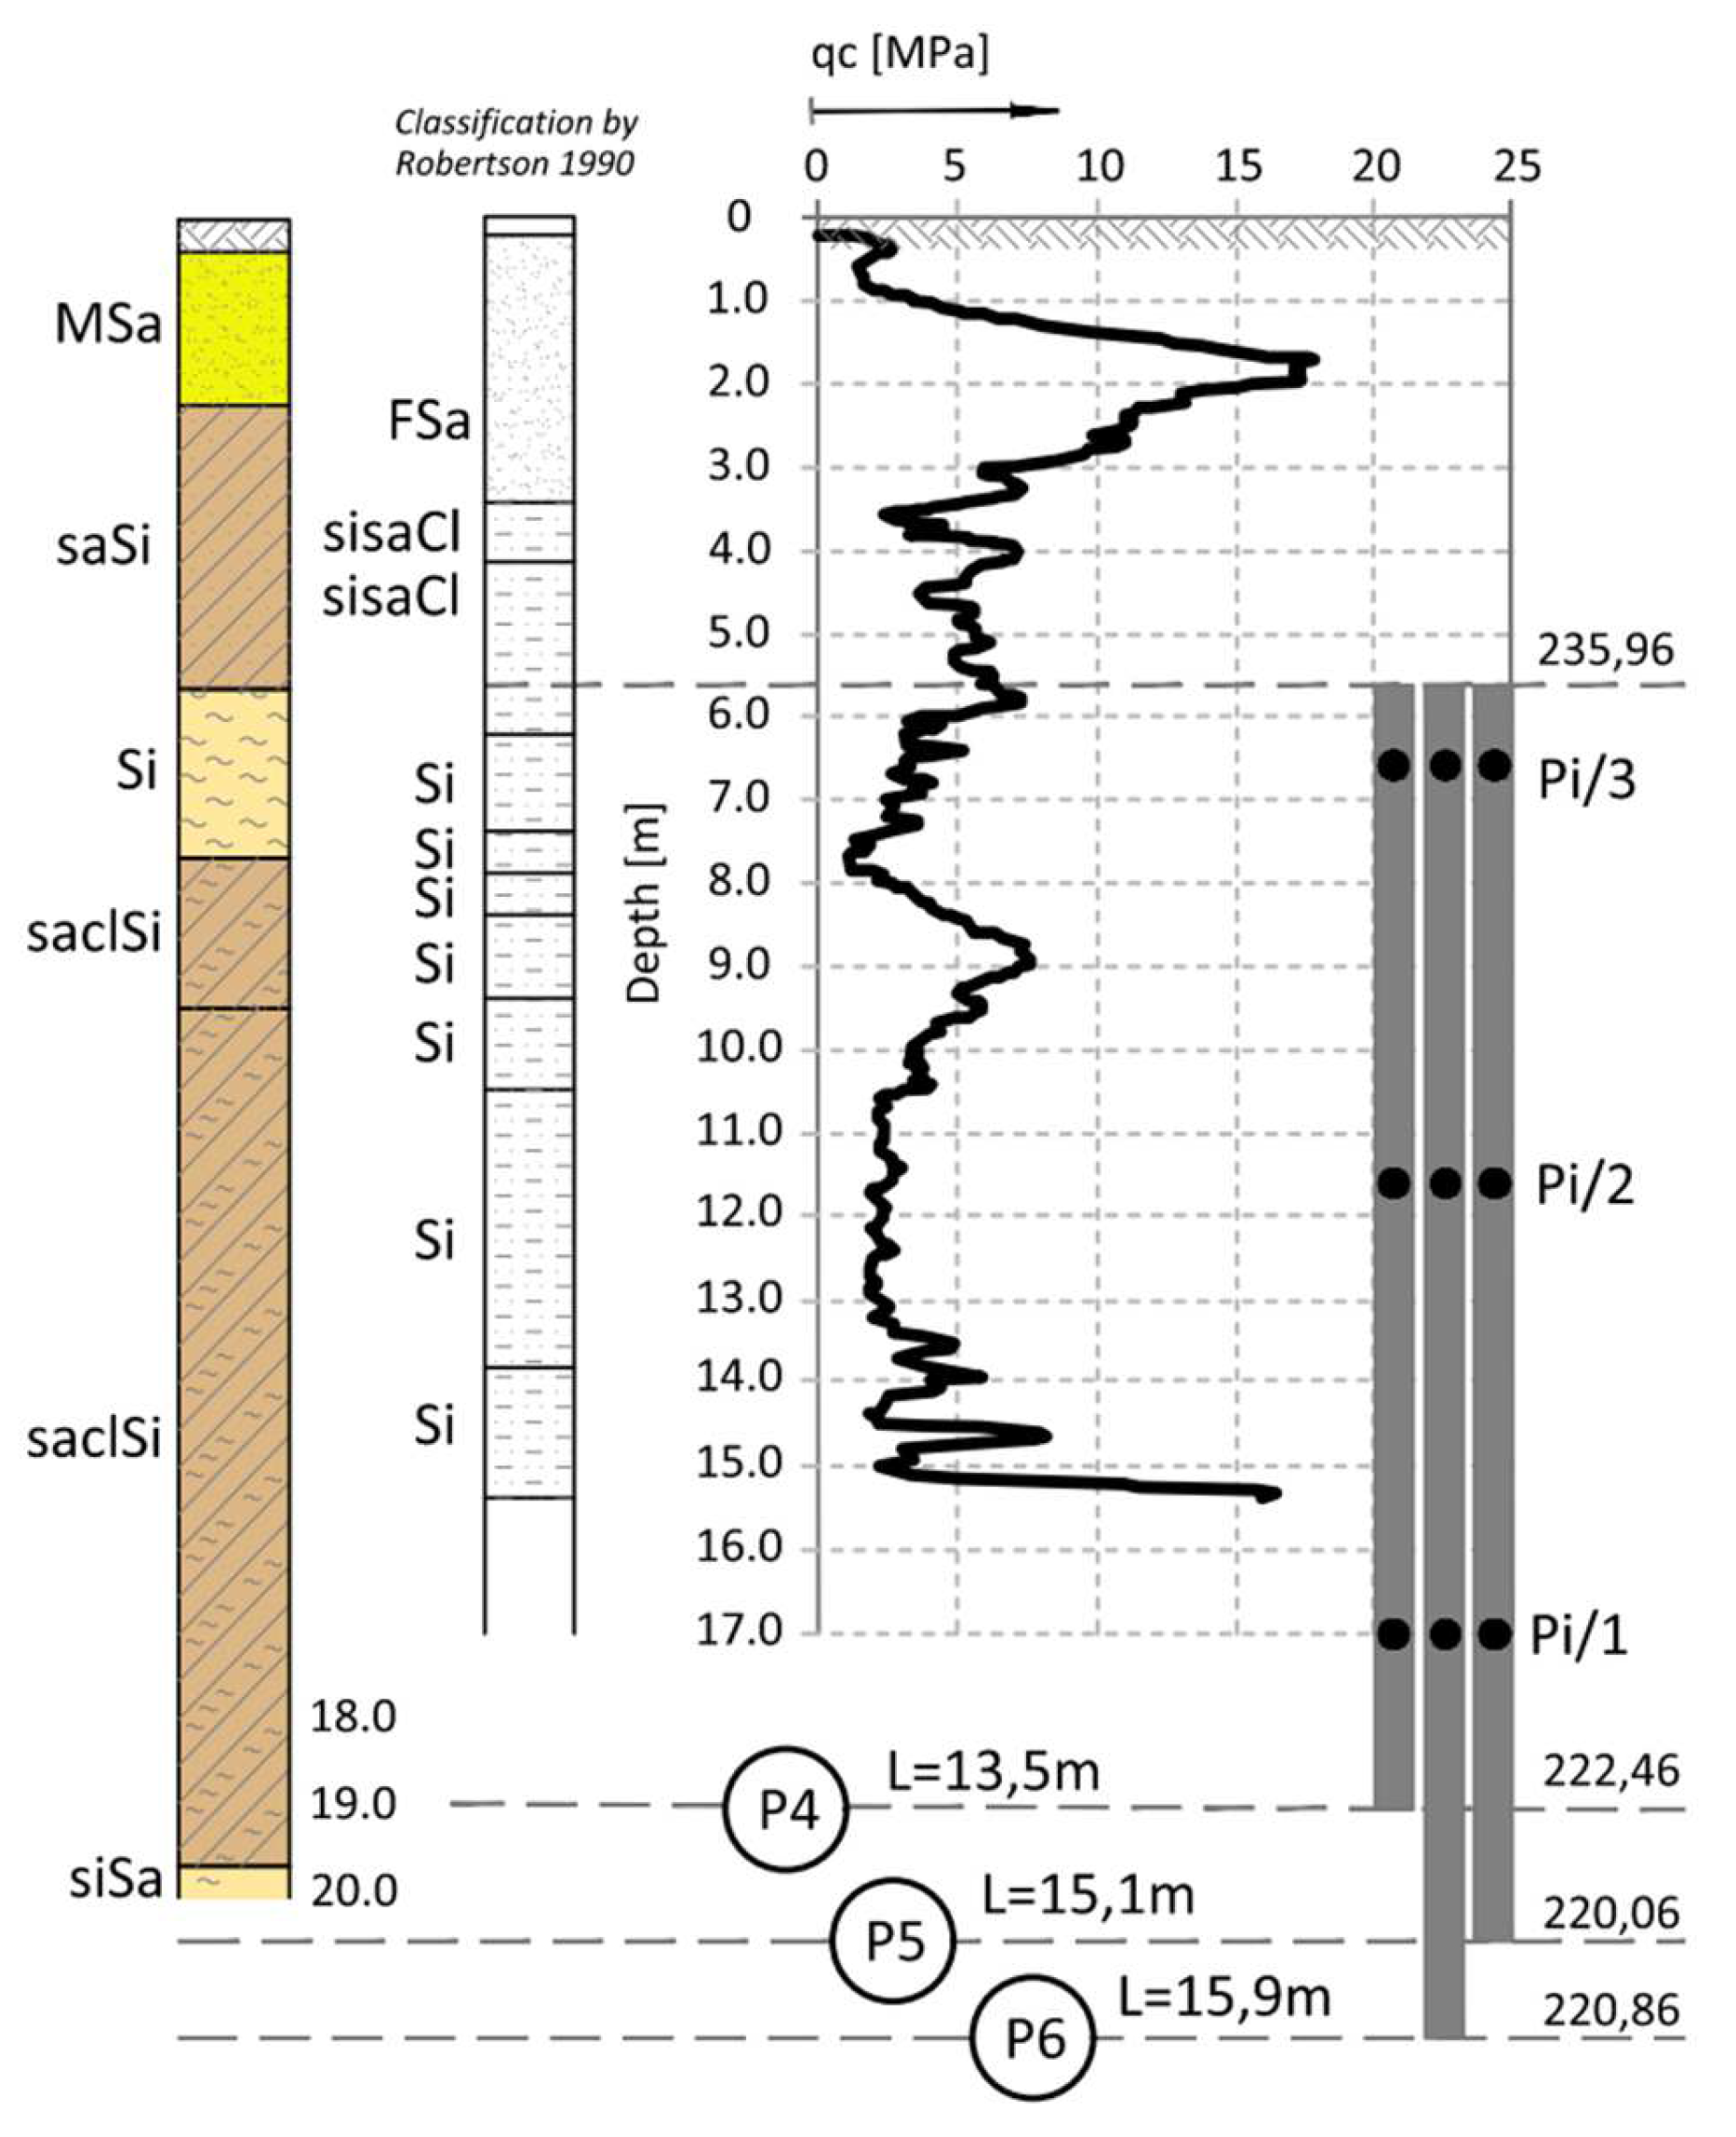
Figure 5.
Location and names of stress measurement points in the ground under the foundation slab.
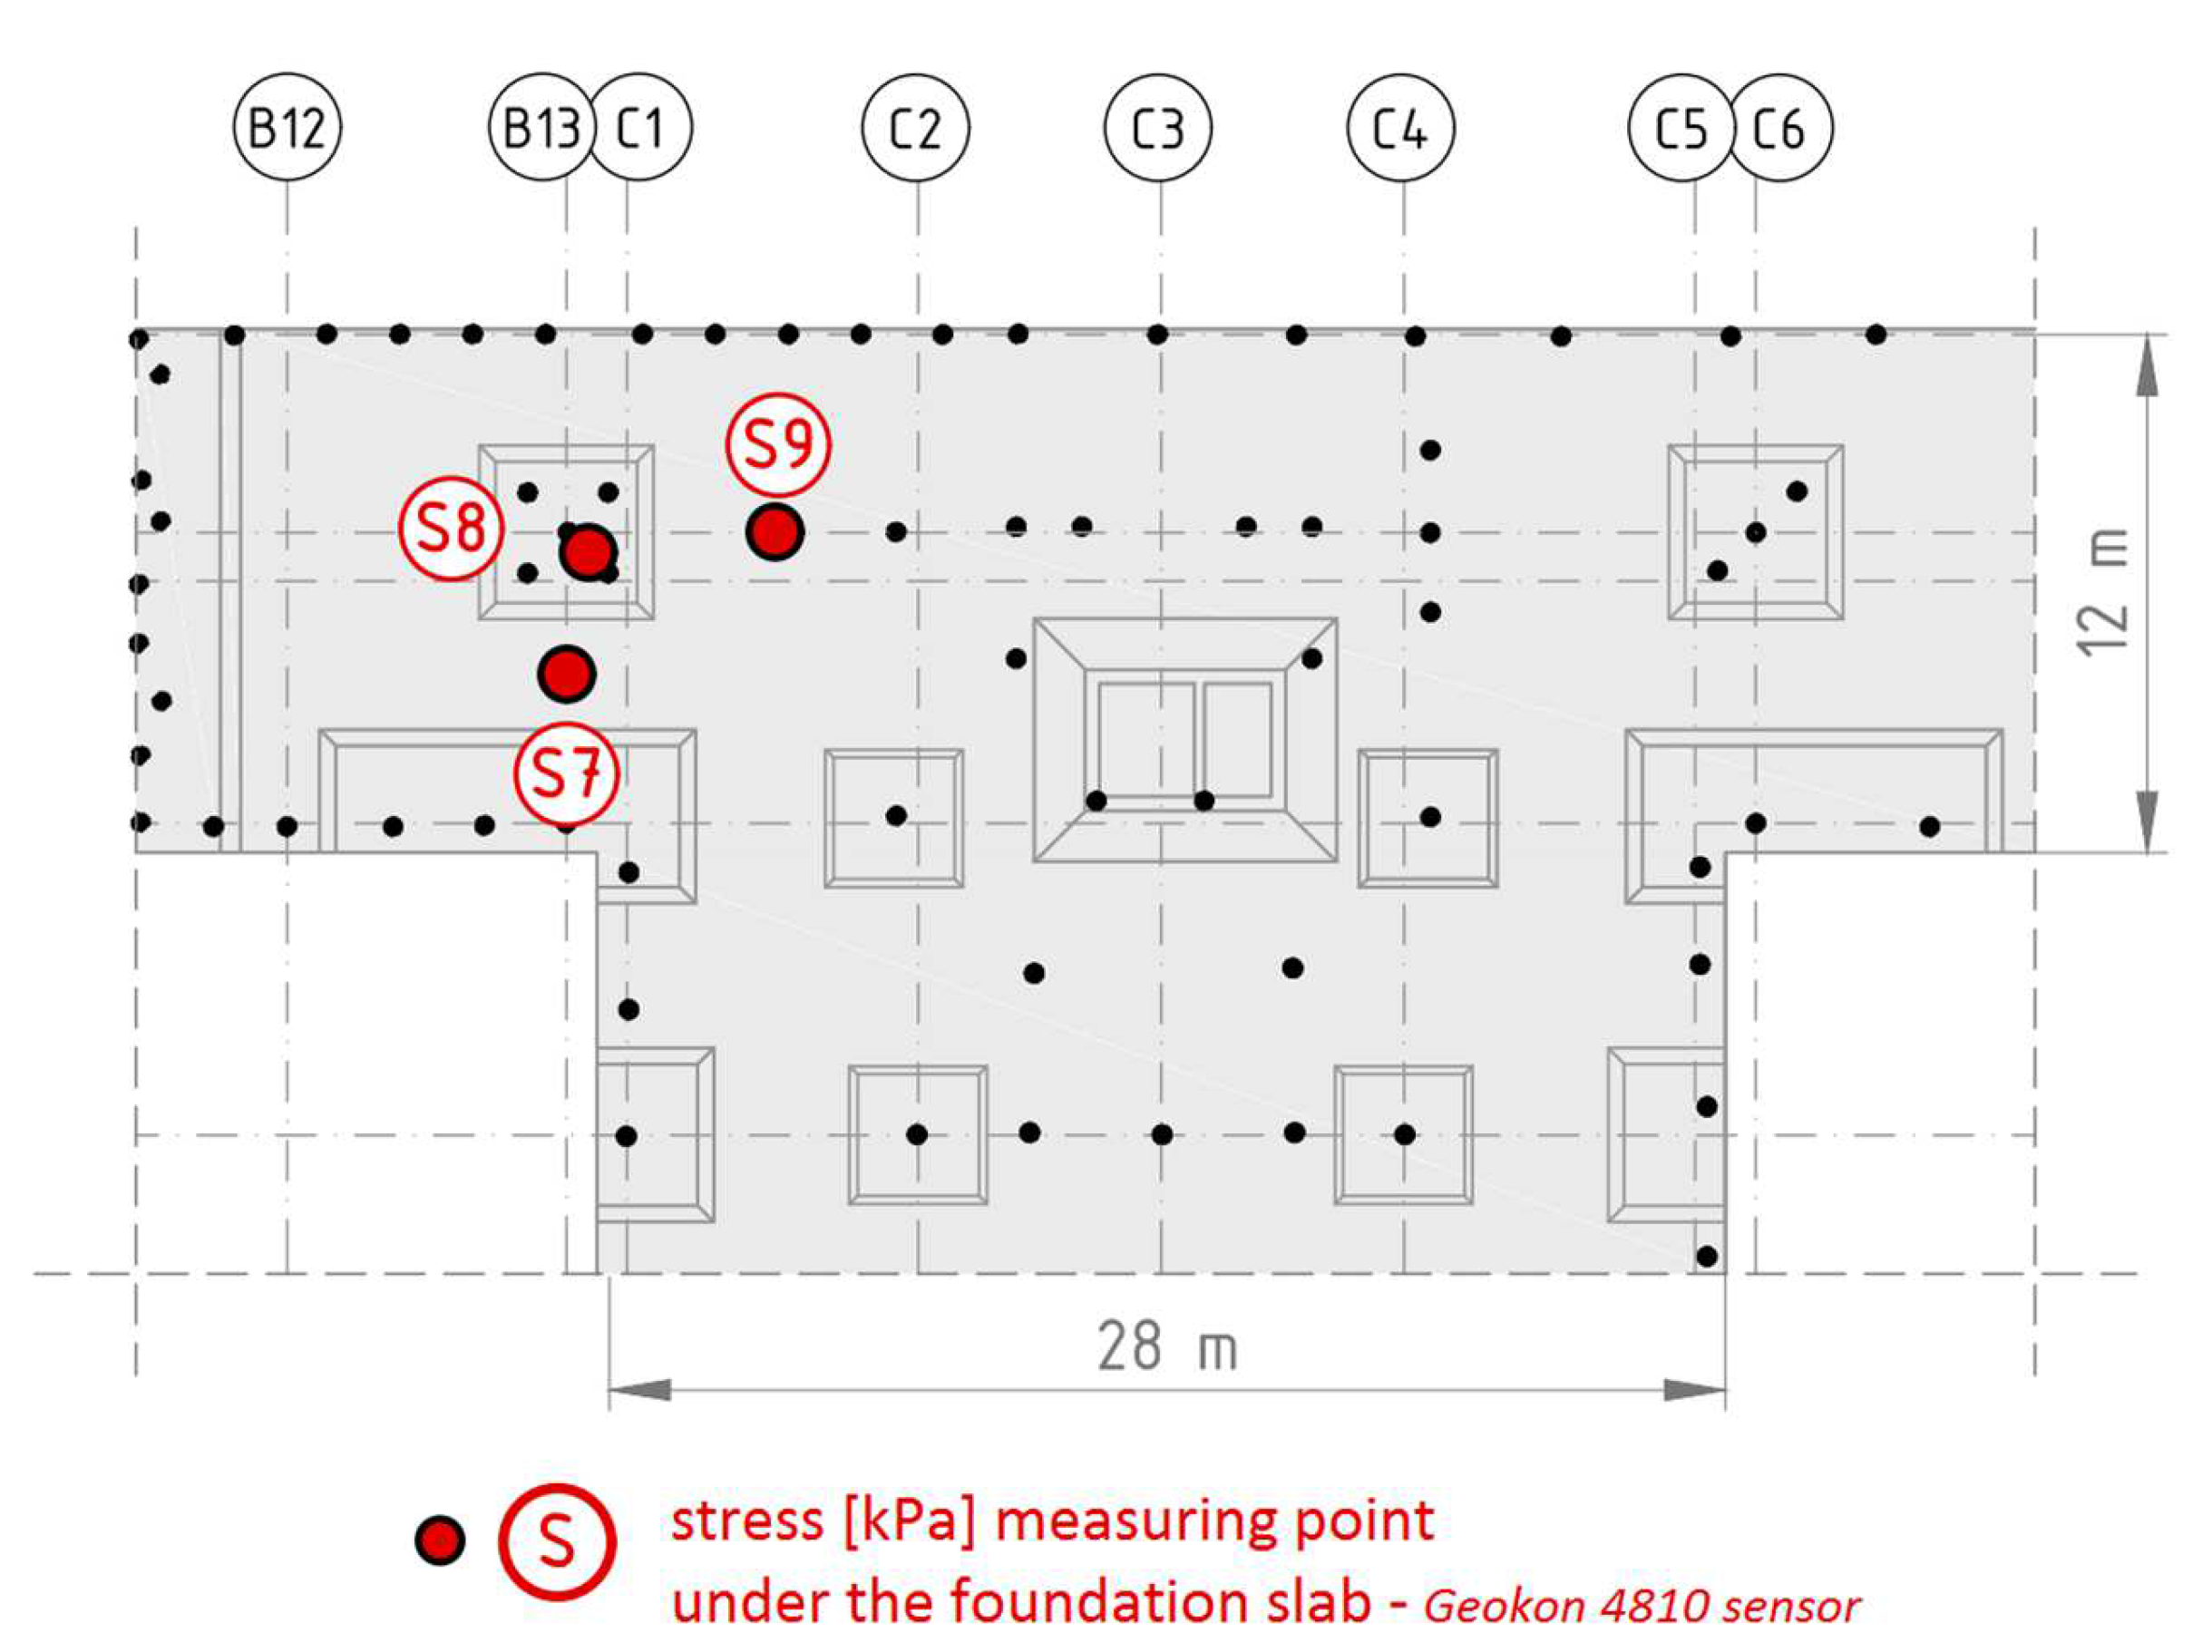
Figure 6.
Construction of a string pressure transducer.
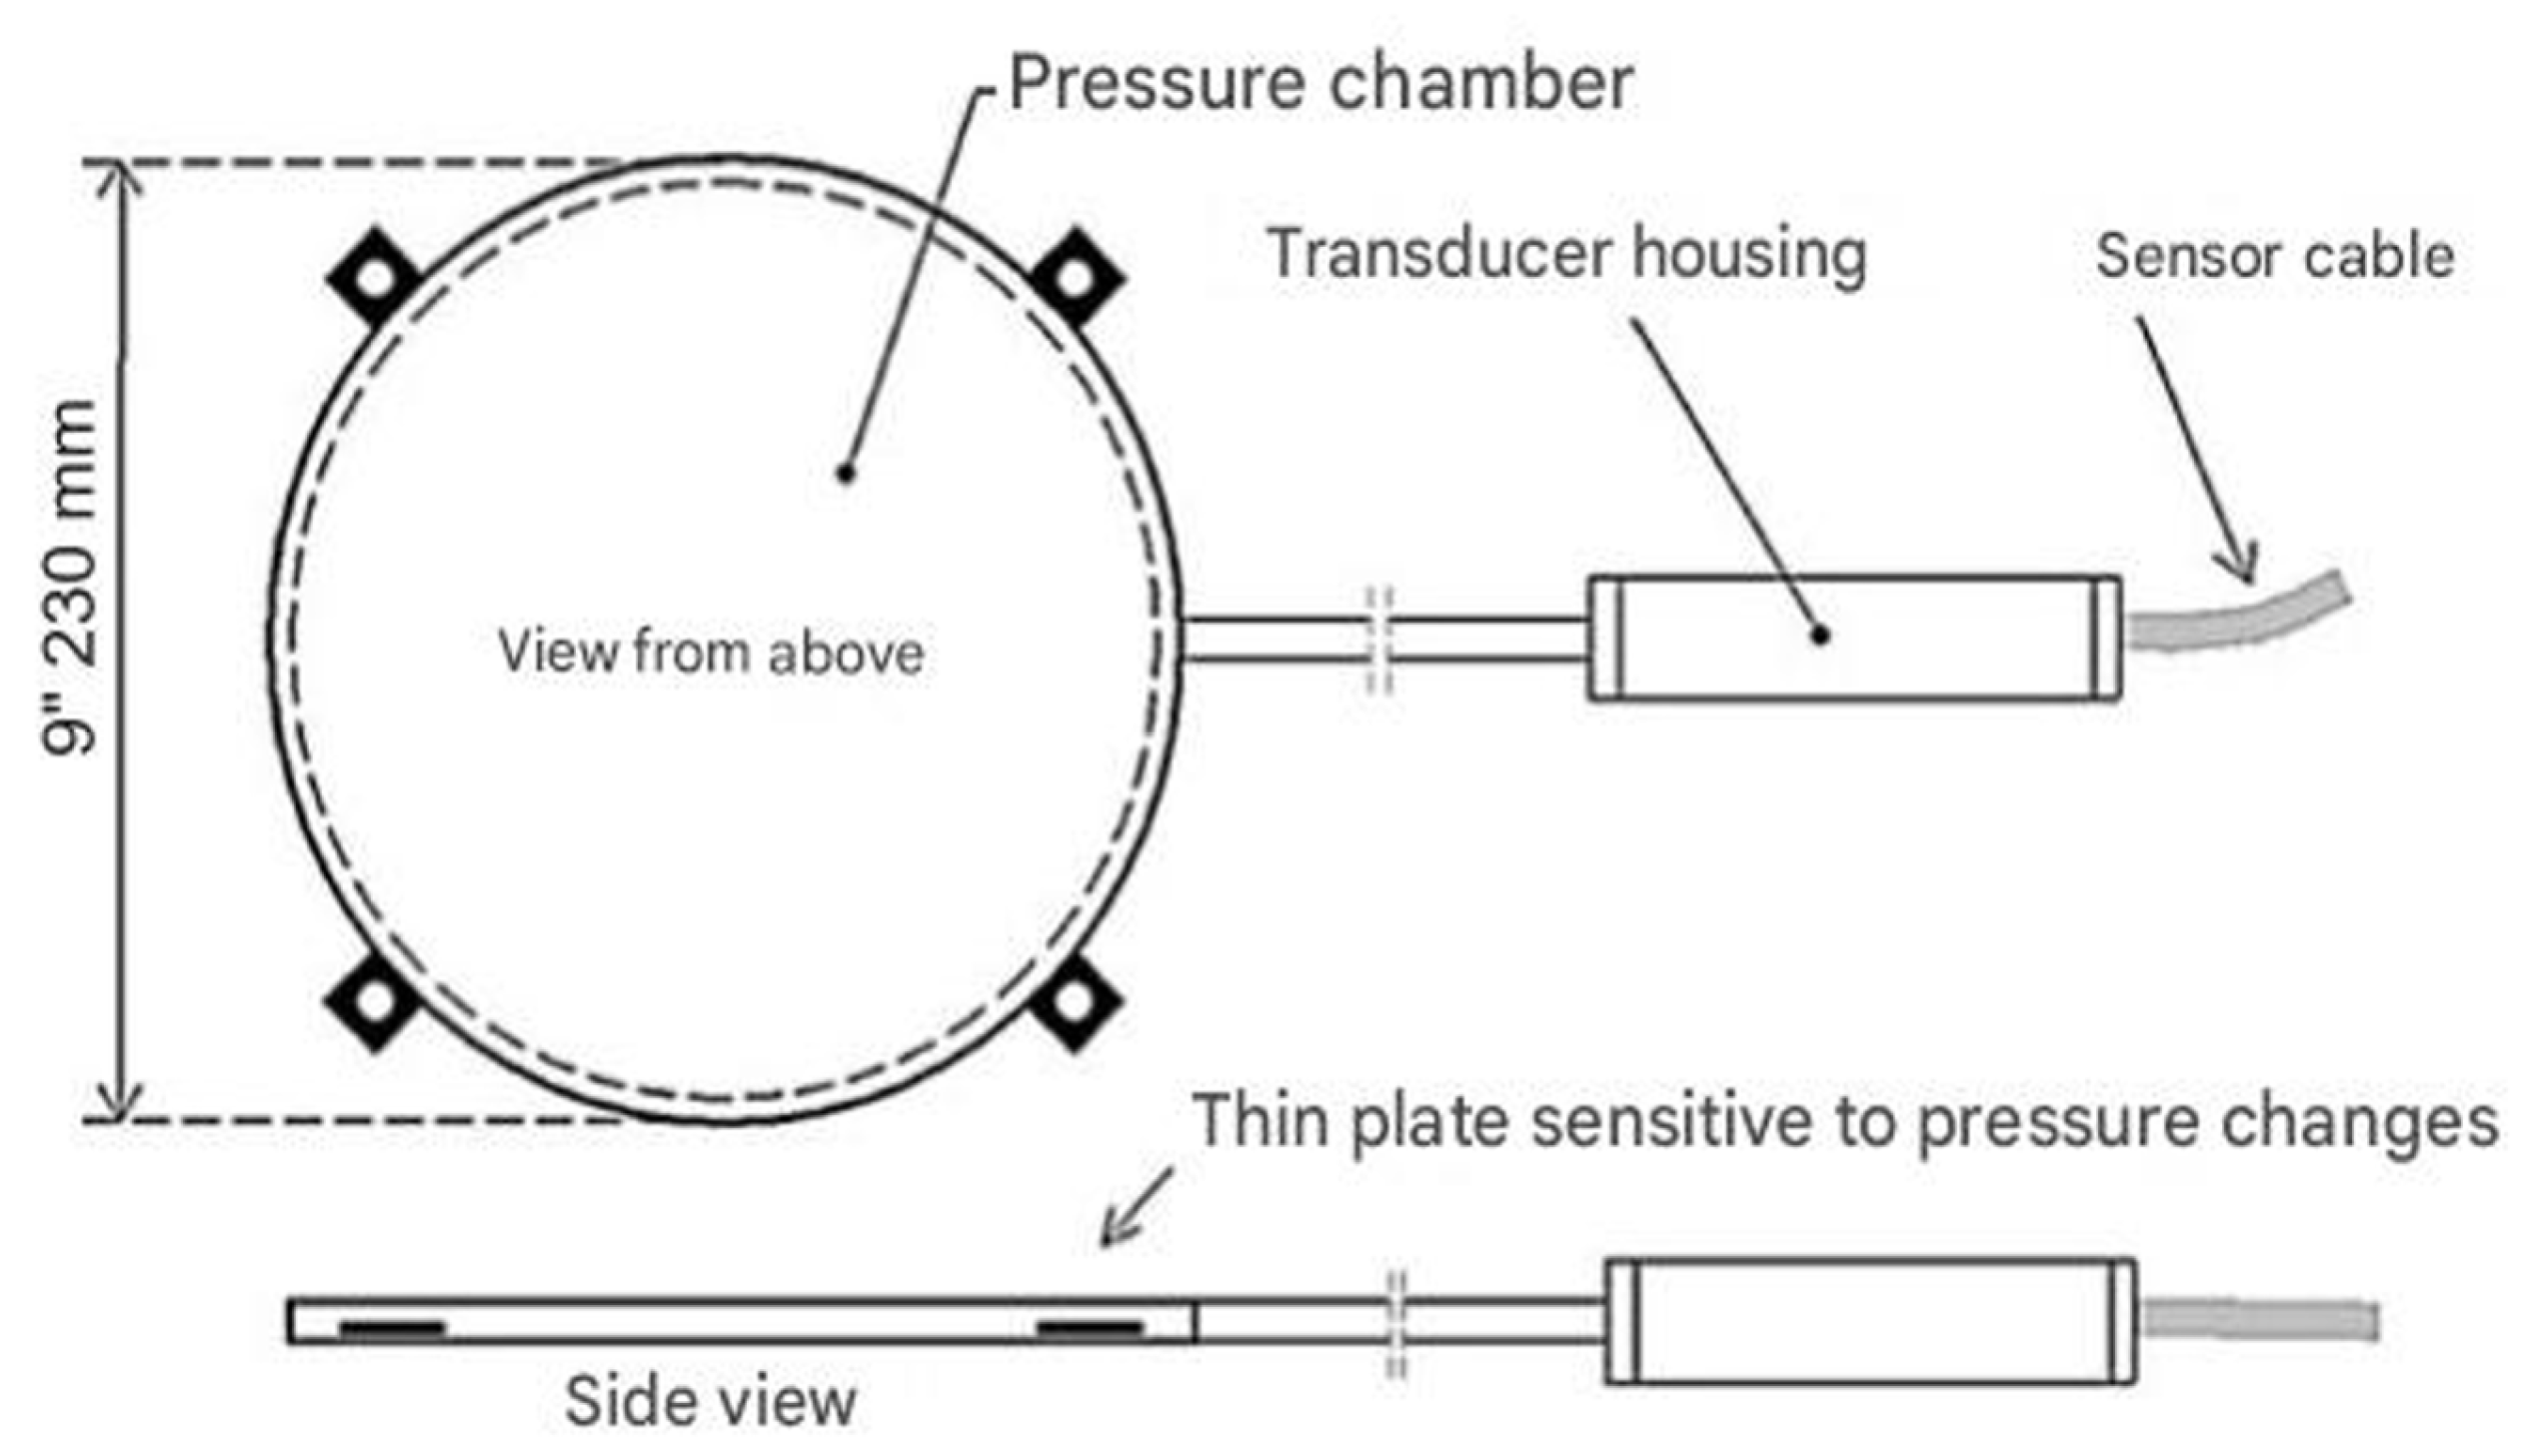
Figure 7.
View of the recess prepared for the installation of the pressure transducer.
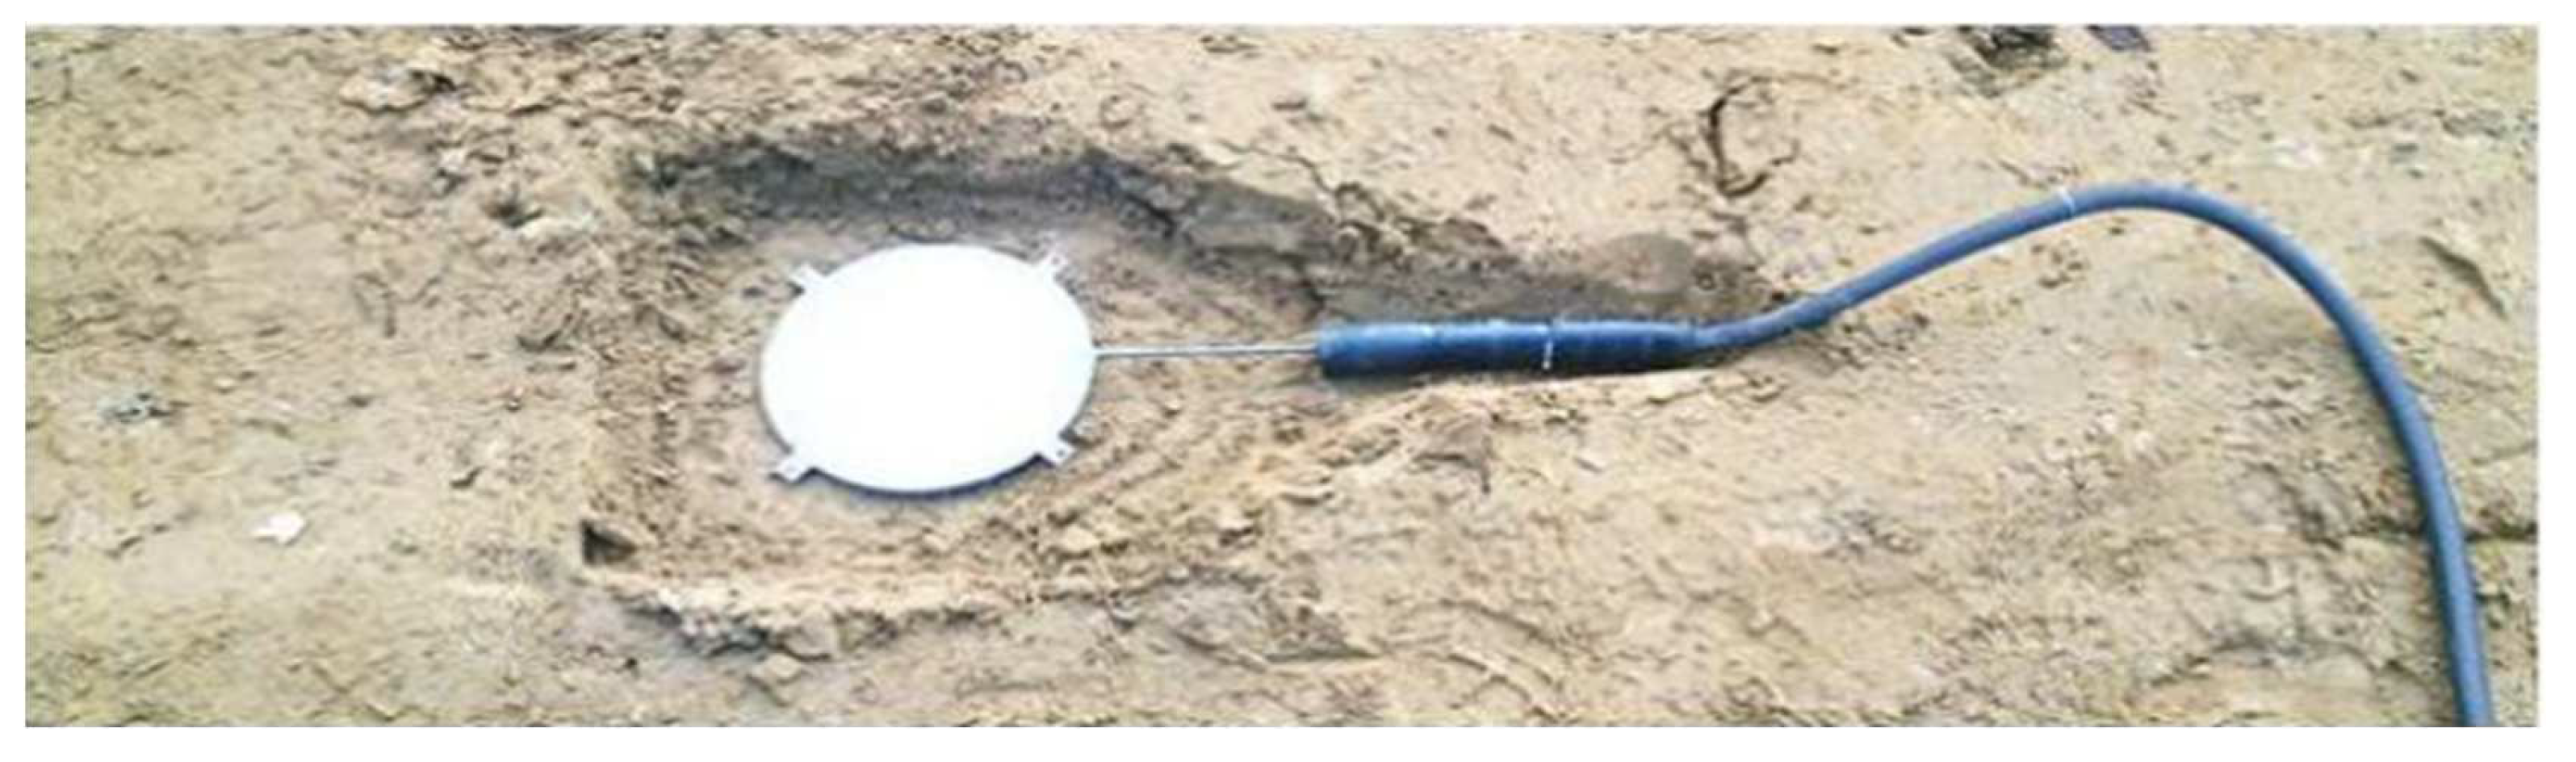
Figure 8.
Location and marking of measured concrete columns (P1–P6).
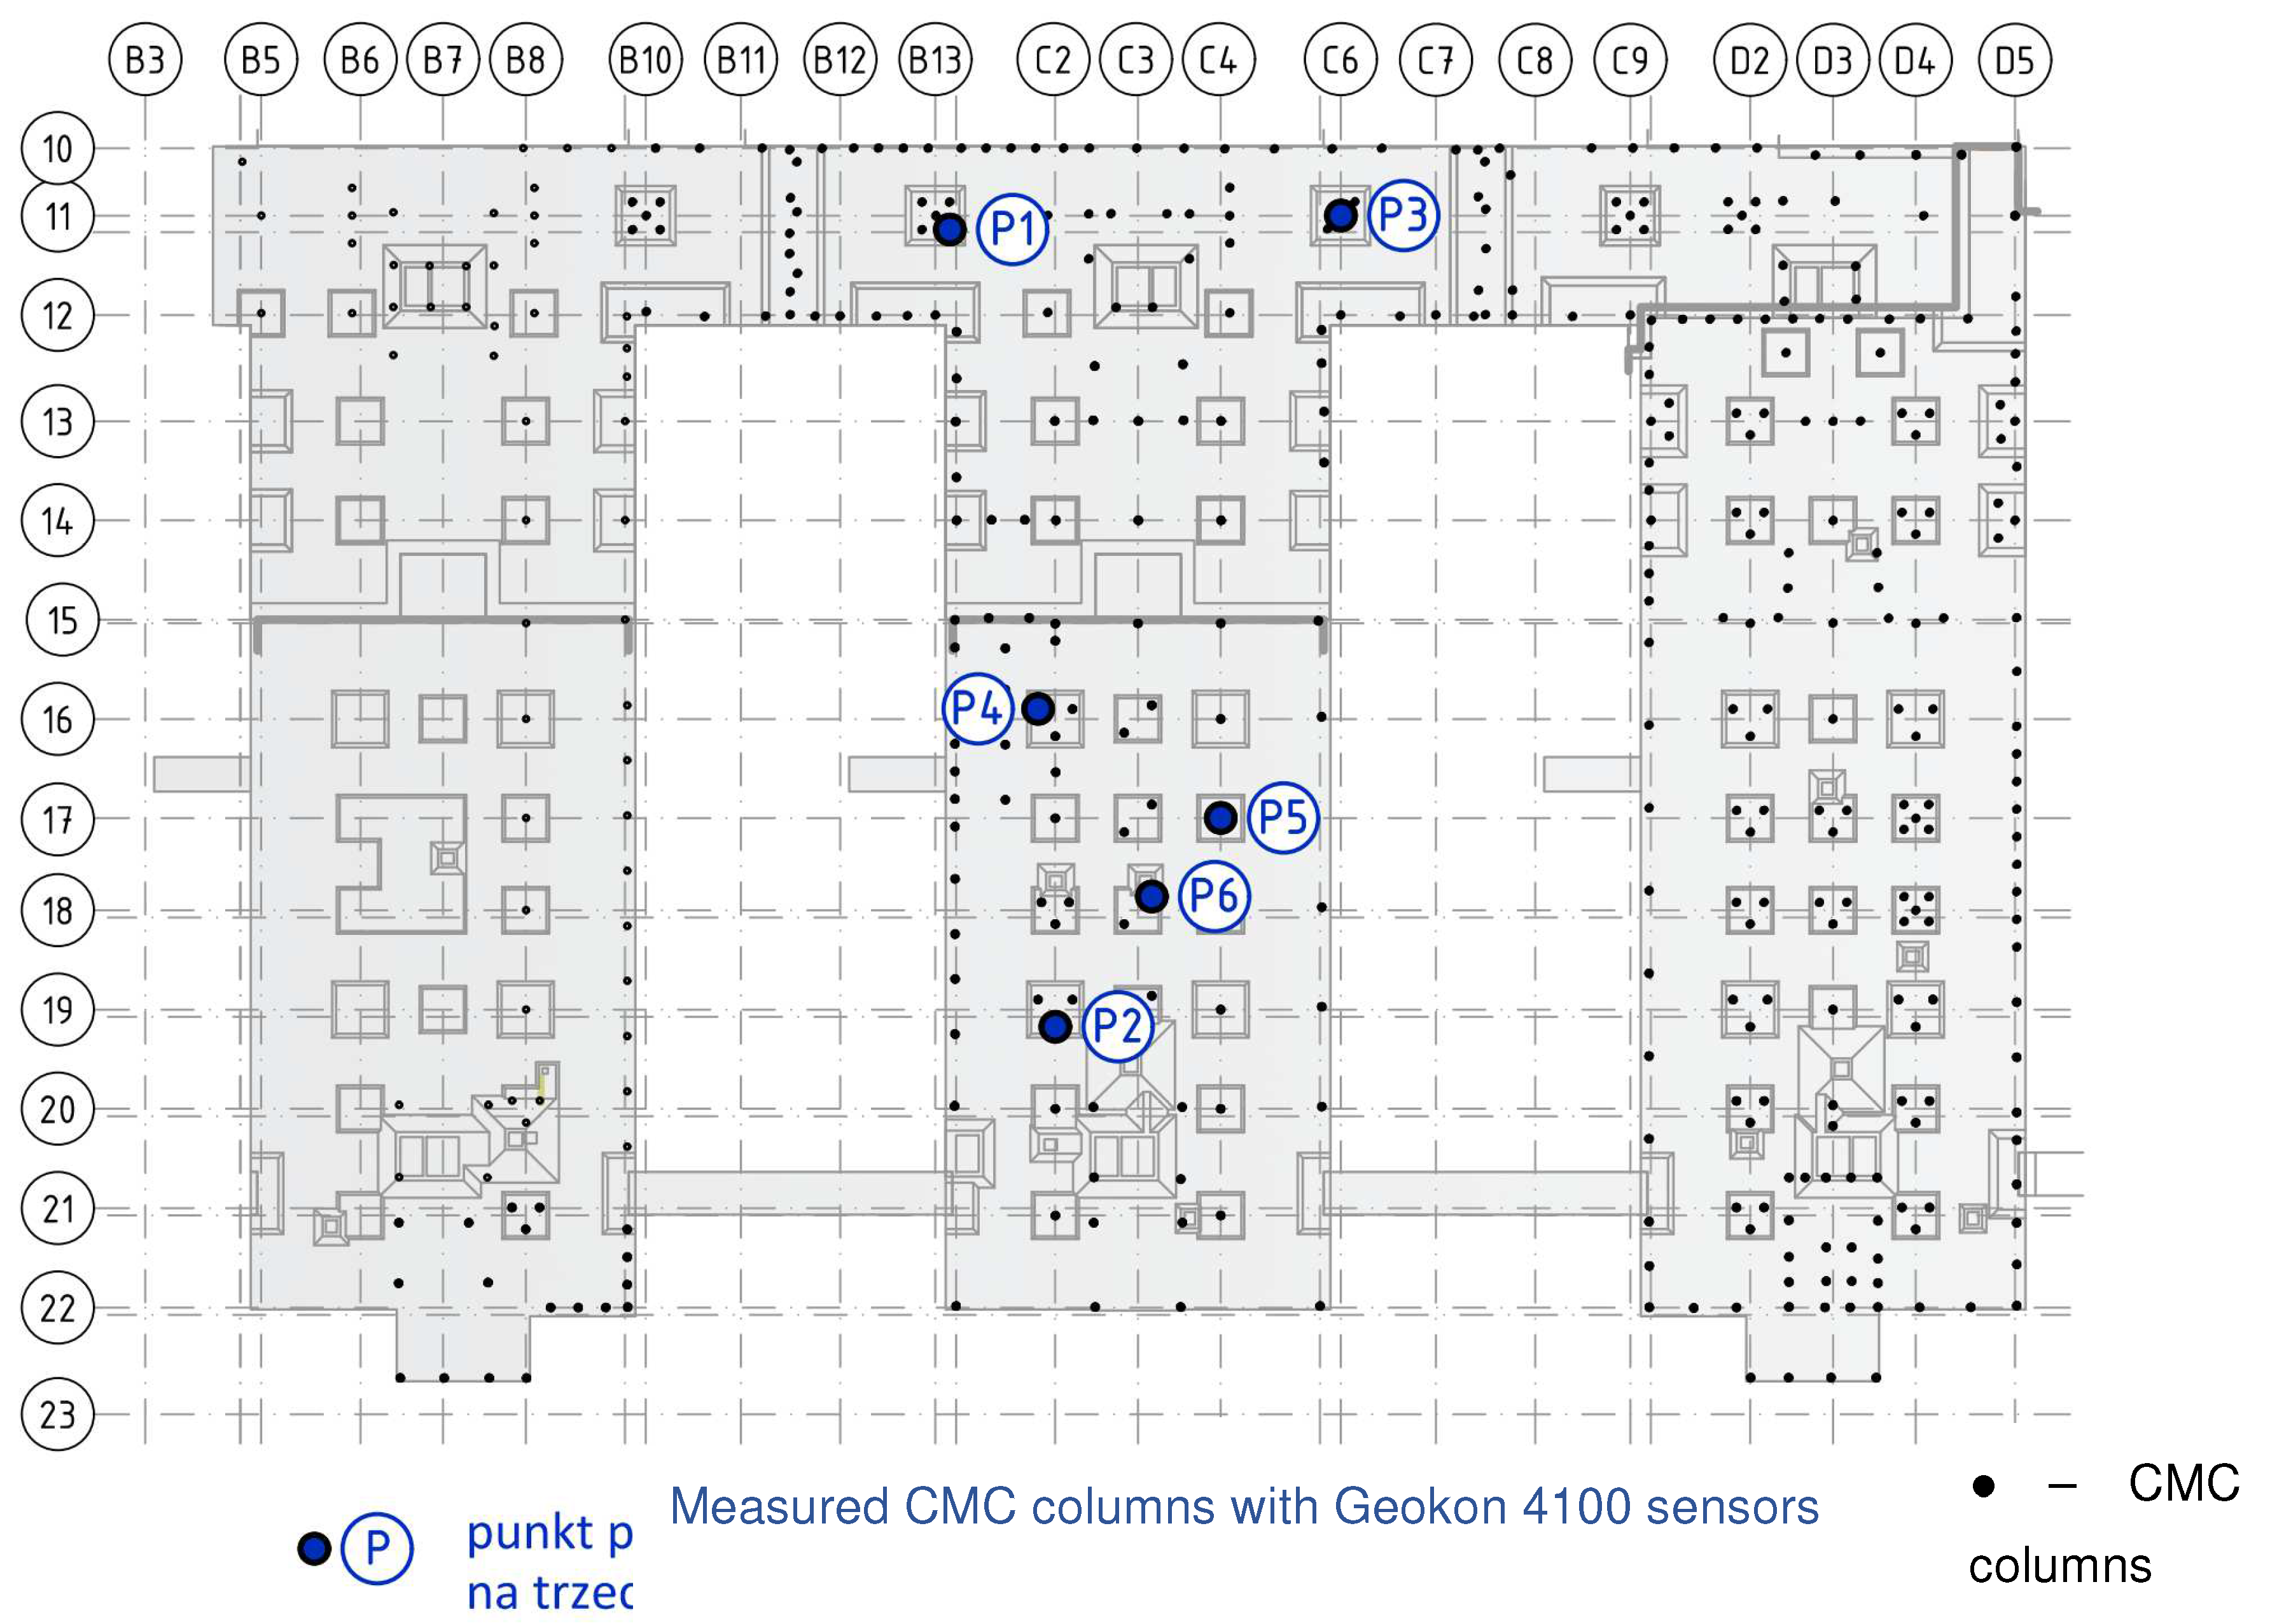
Figure 9.
Geokon 4100 string strain sensor.
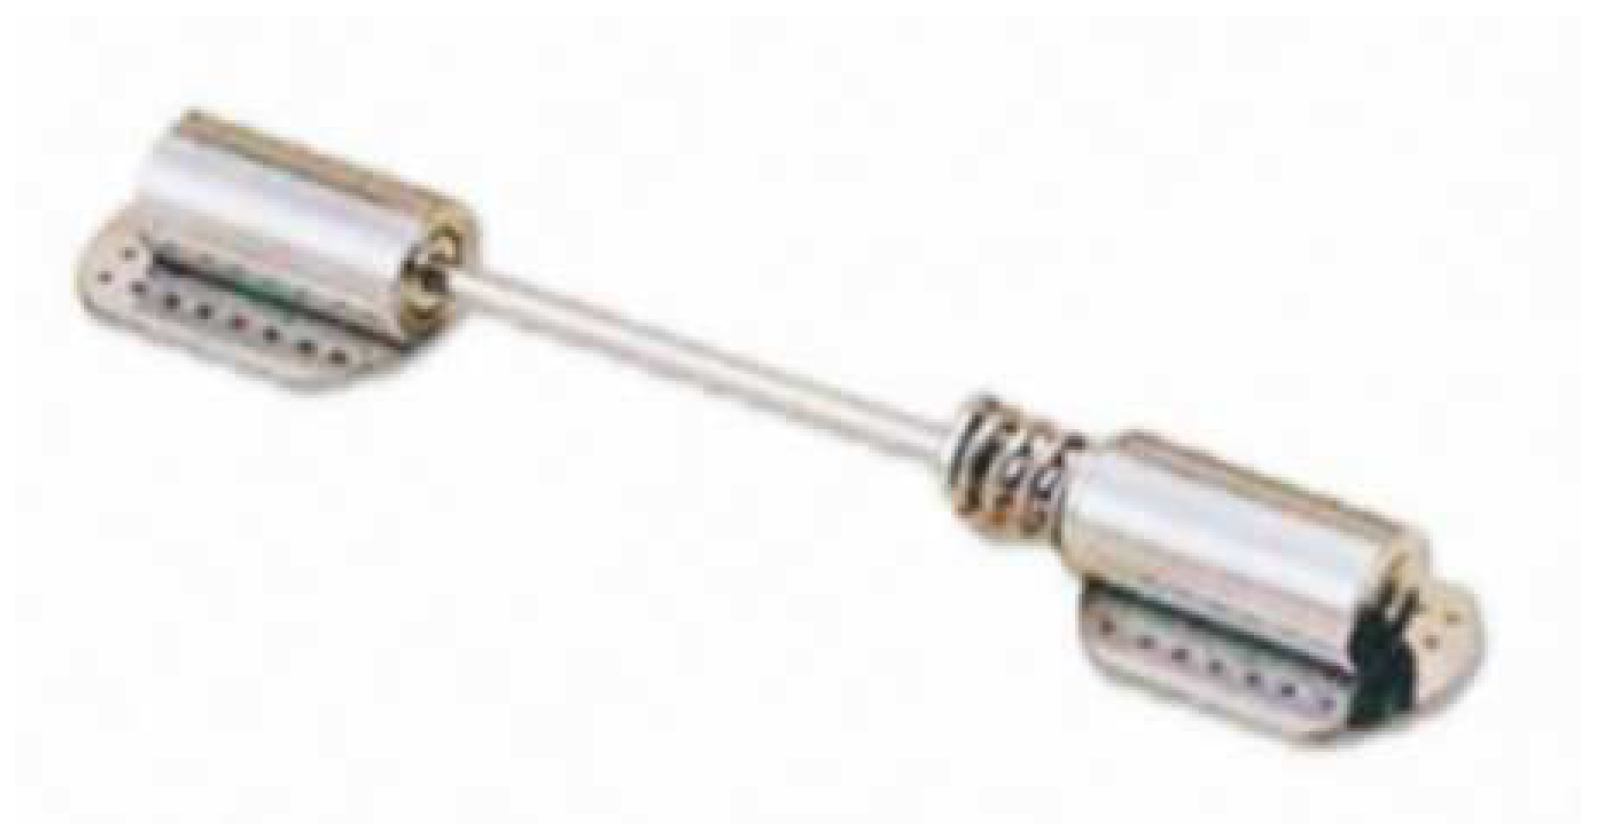
Figure 10.
Construction of protective casings.
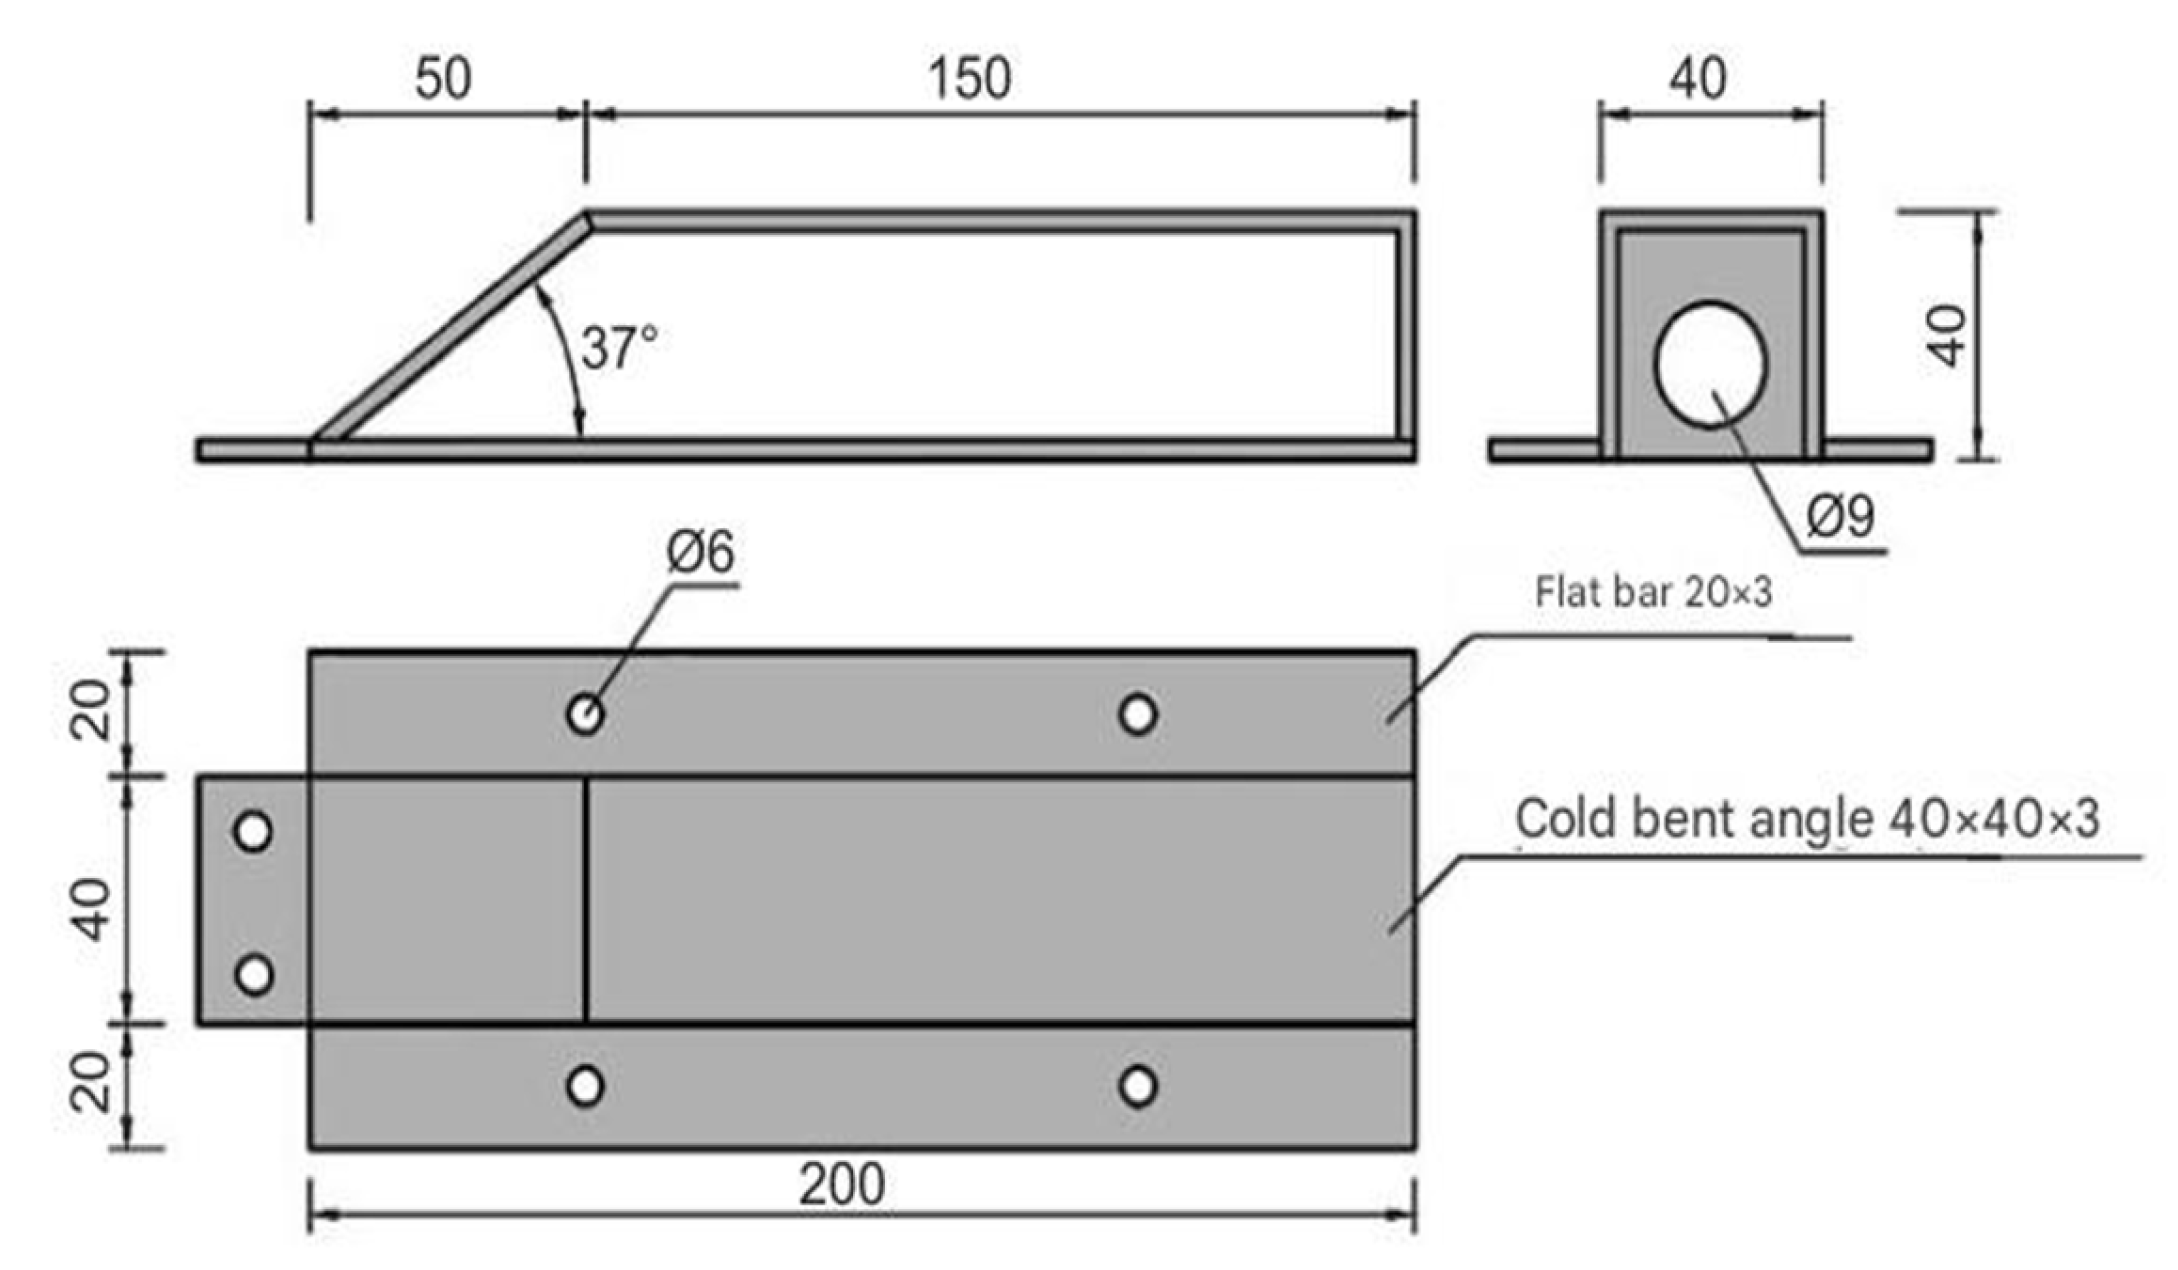
Figure 11.
Protective casings installed on IPE120 profiles.
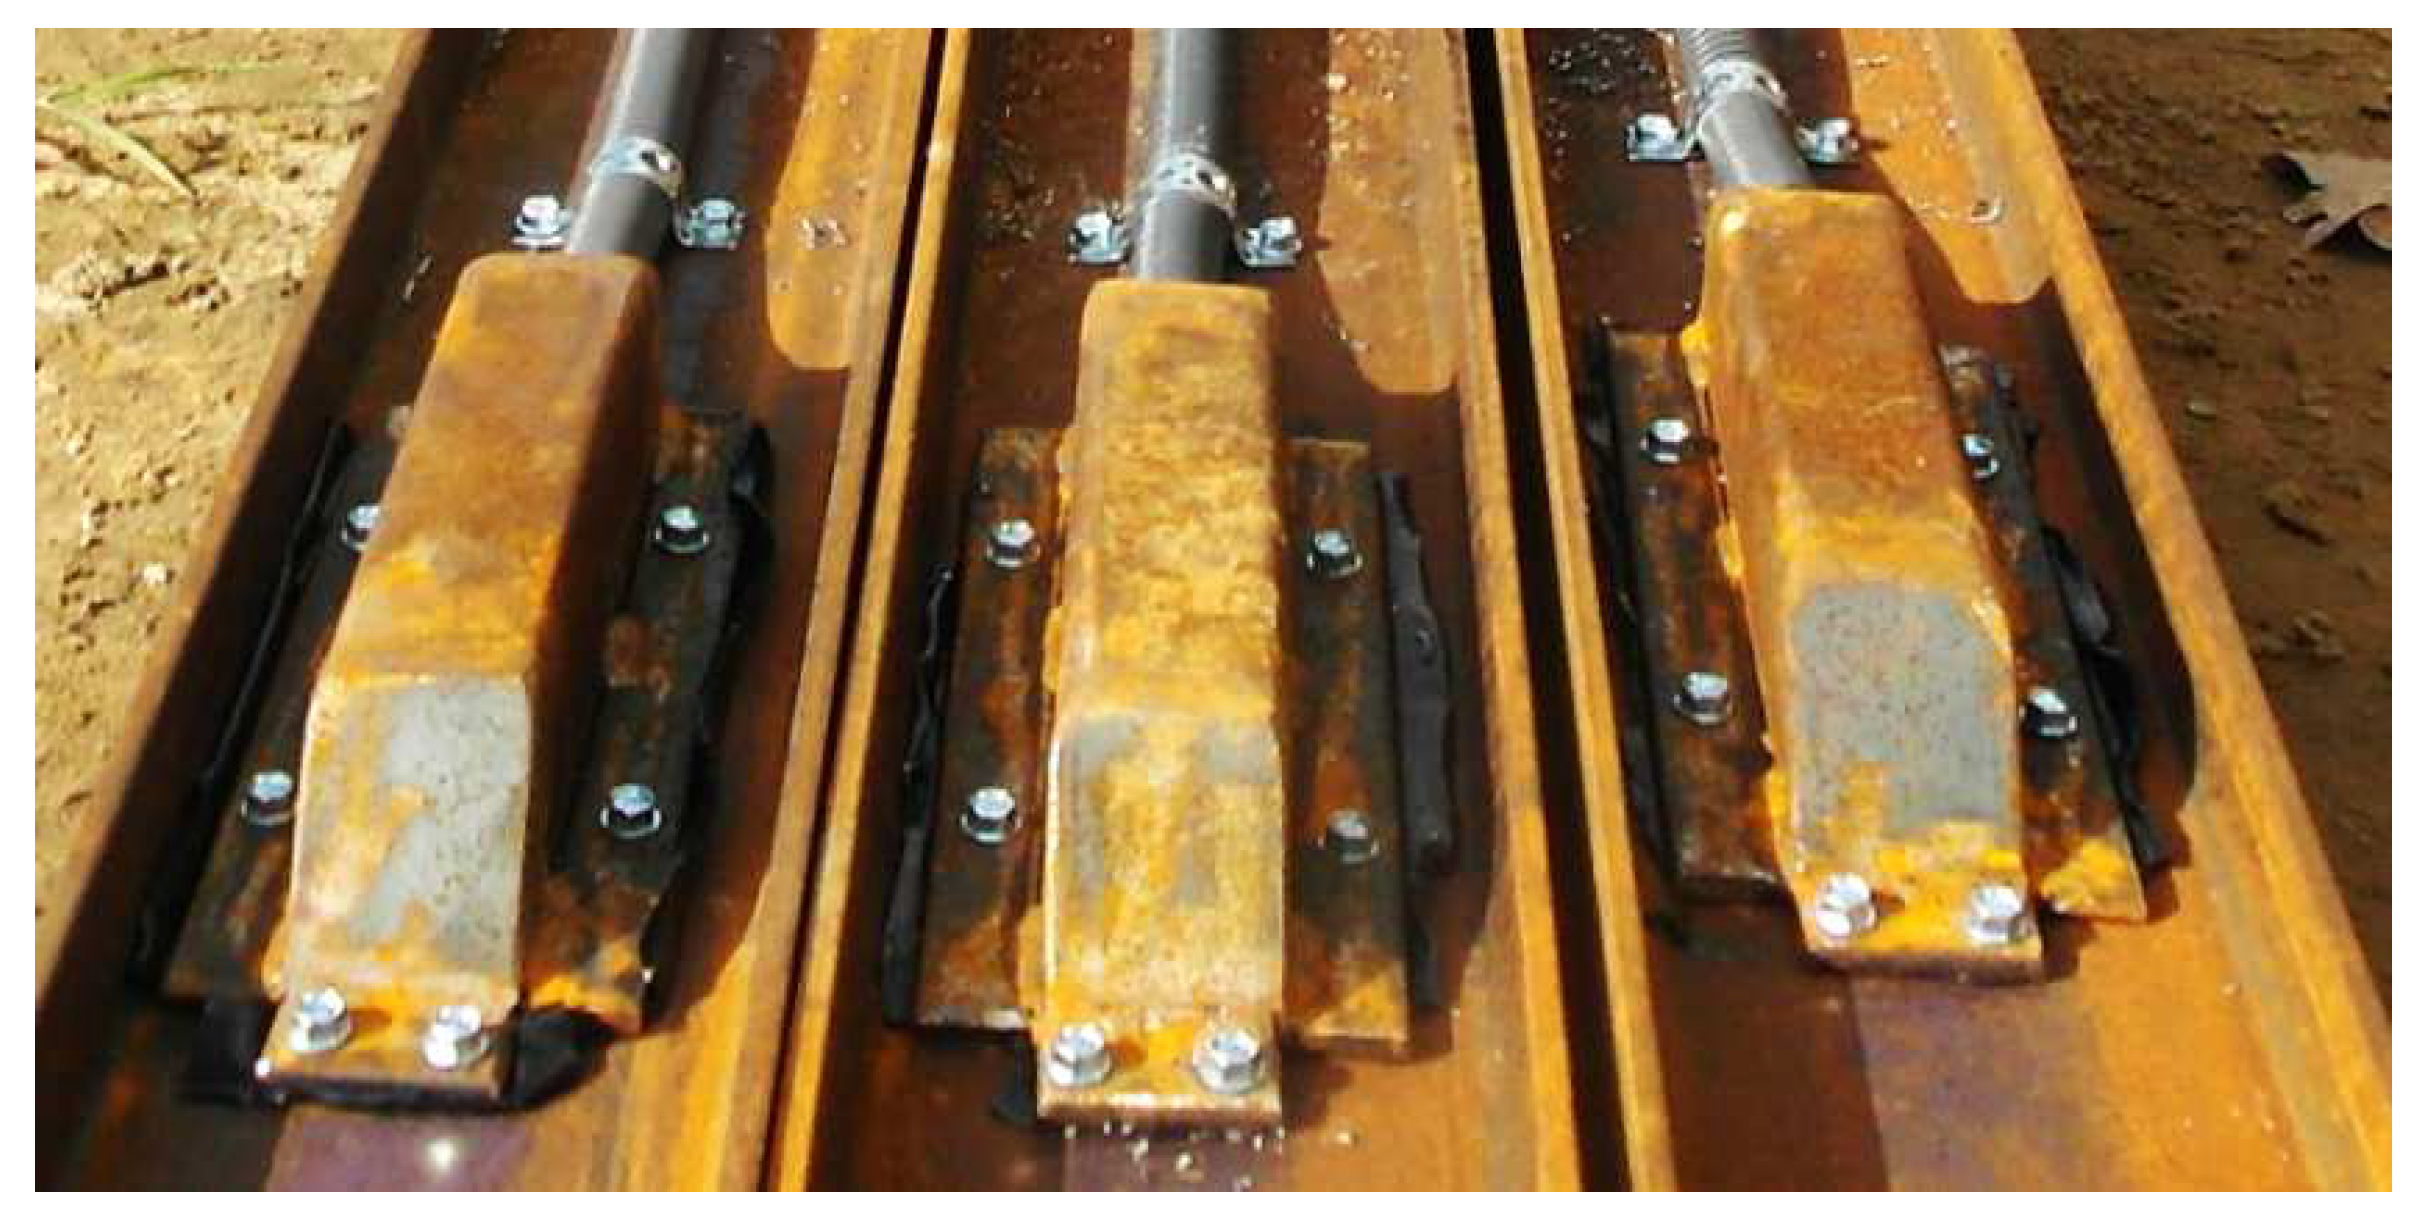
Figure 12.
Protective casings installed on RO pipes 2’‘×2.9.
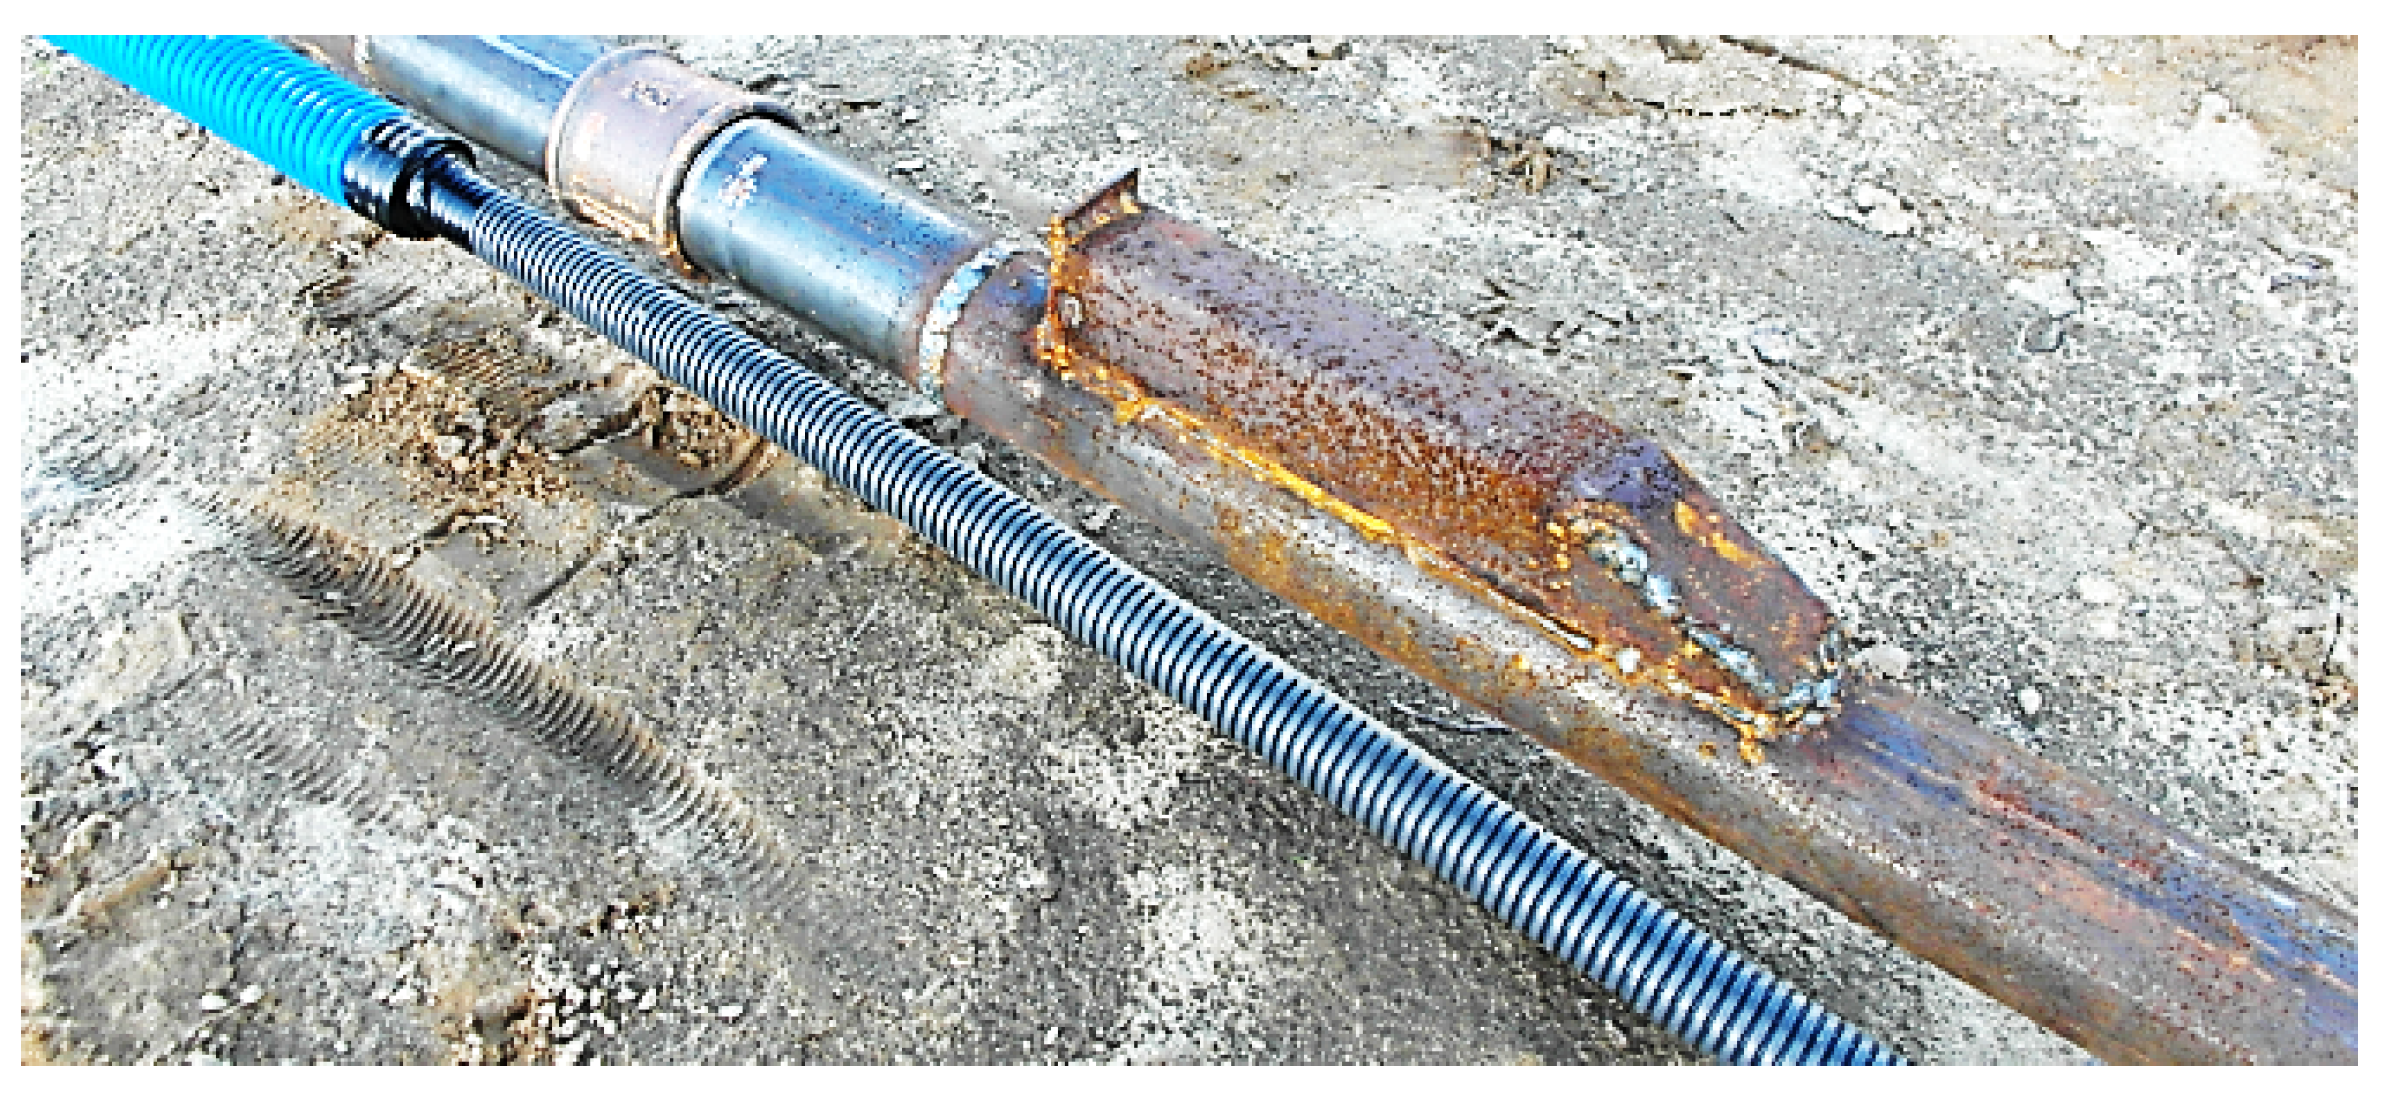
Figure 13.
View of steel profiles with sensors during the insertion into the concrete mix.
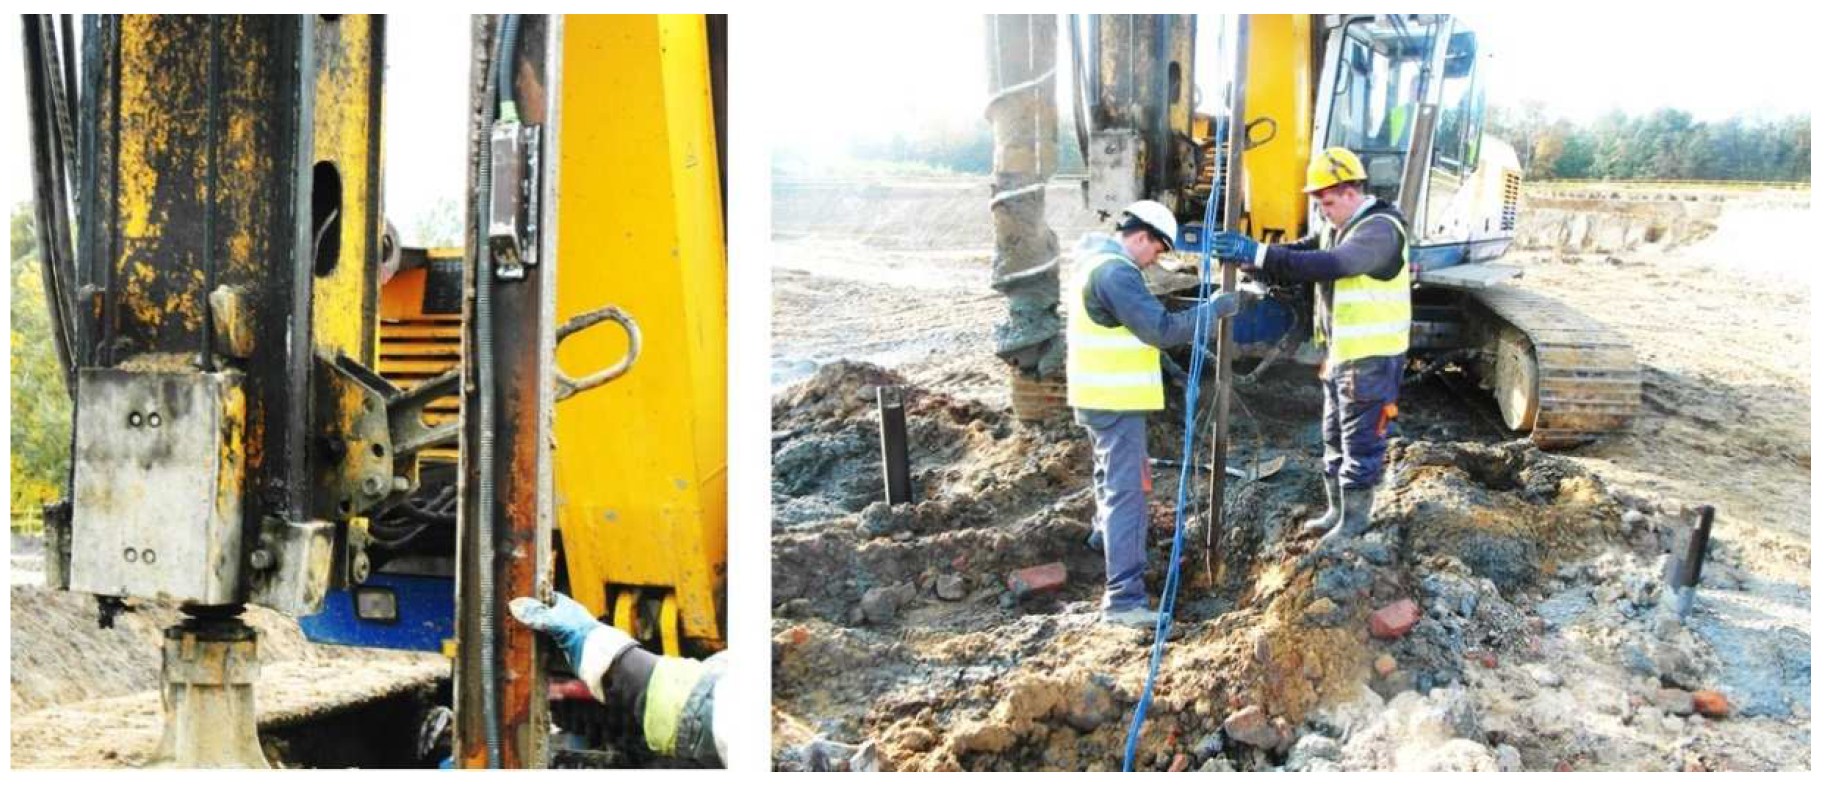
Figure 14.
The method of installing deformation sensors and the adopted numbering.
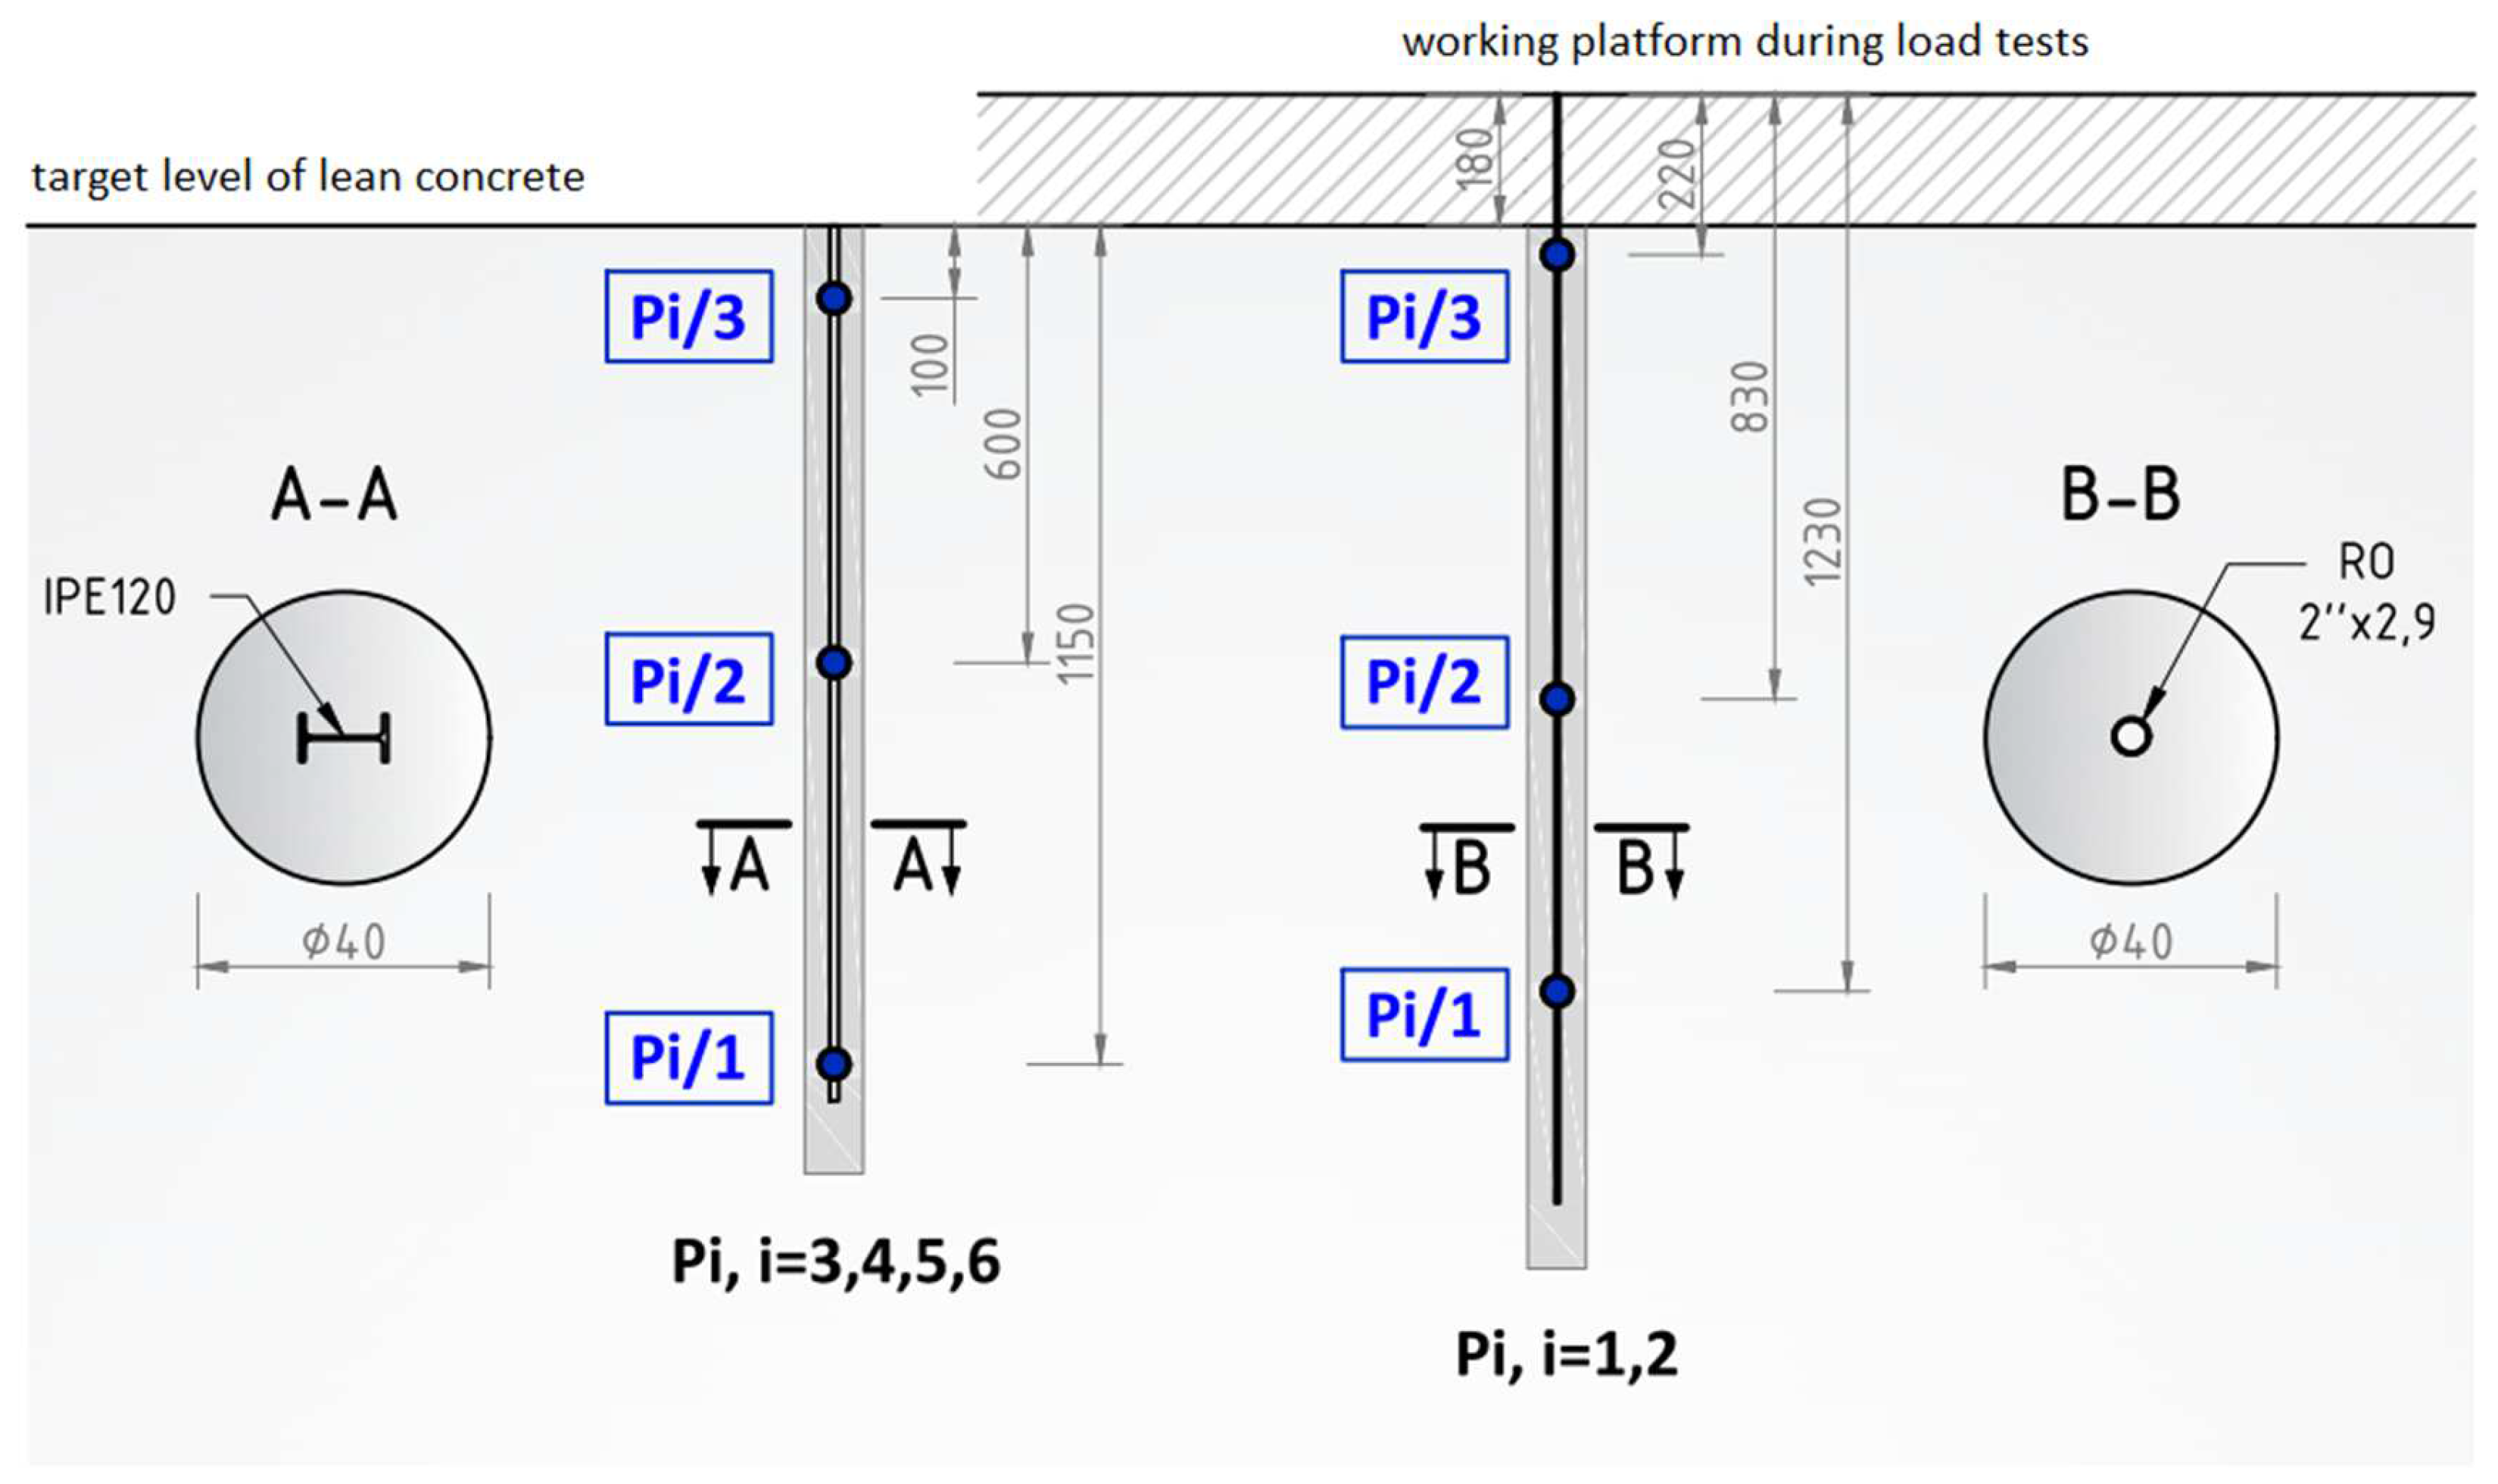
Figure 15.
Strain graphs of the P1 column in the period from the take-off measurements to the start of automatic measurements.
Figure 15.
Strain graphs of the P1 column in the period from the take-off measurements to the start of automatic measurements.
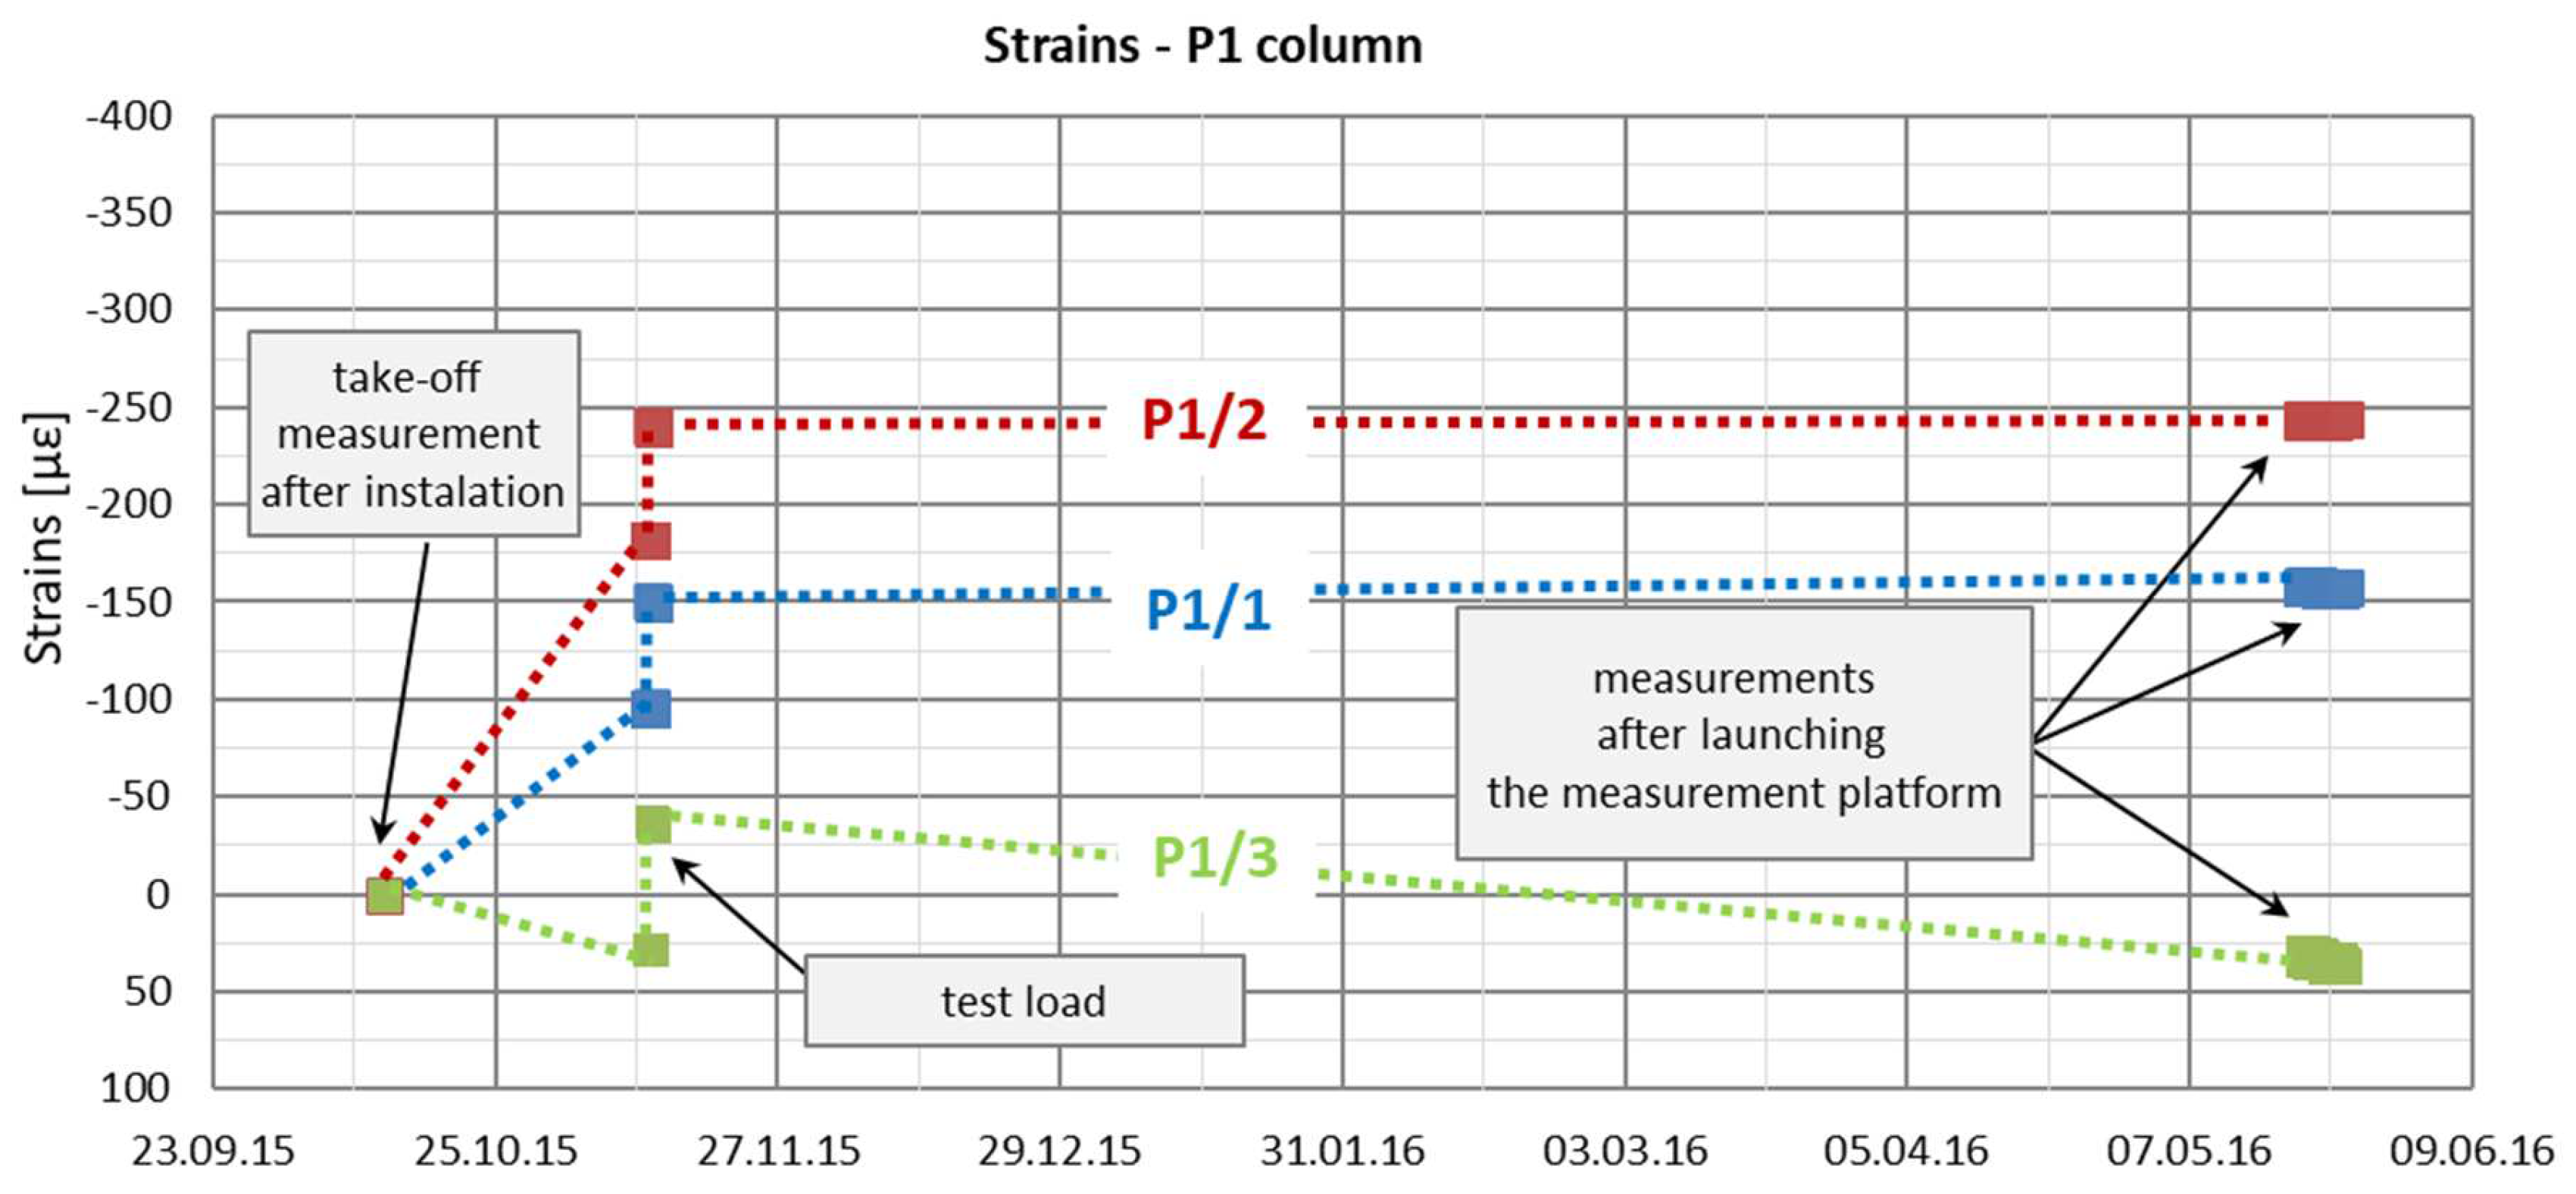
Figure 16.
Strain graphs of the P2 column in the period from the take-off measurements to the start of automatic measurements.
Figure 16.
Strain graphs of the P2 column in the period from the take-off measurements to the start of automatic measurements.
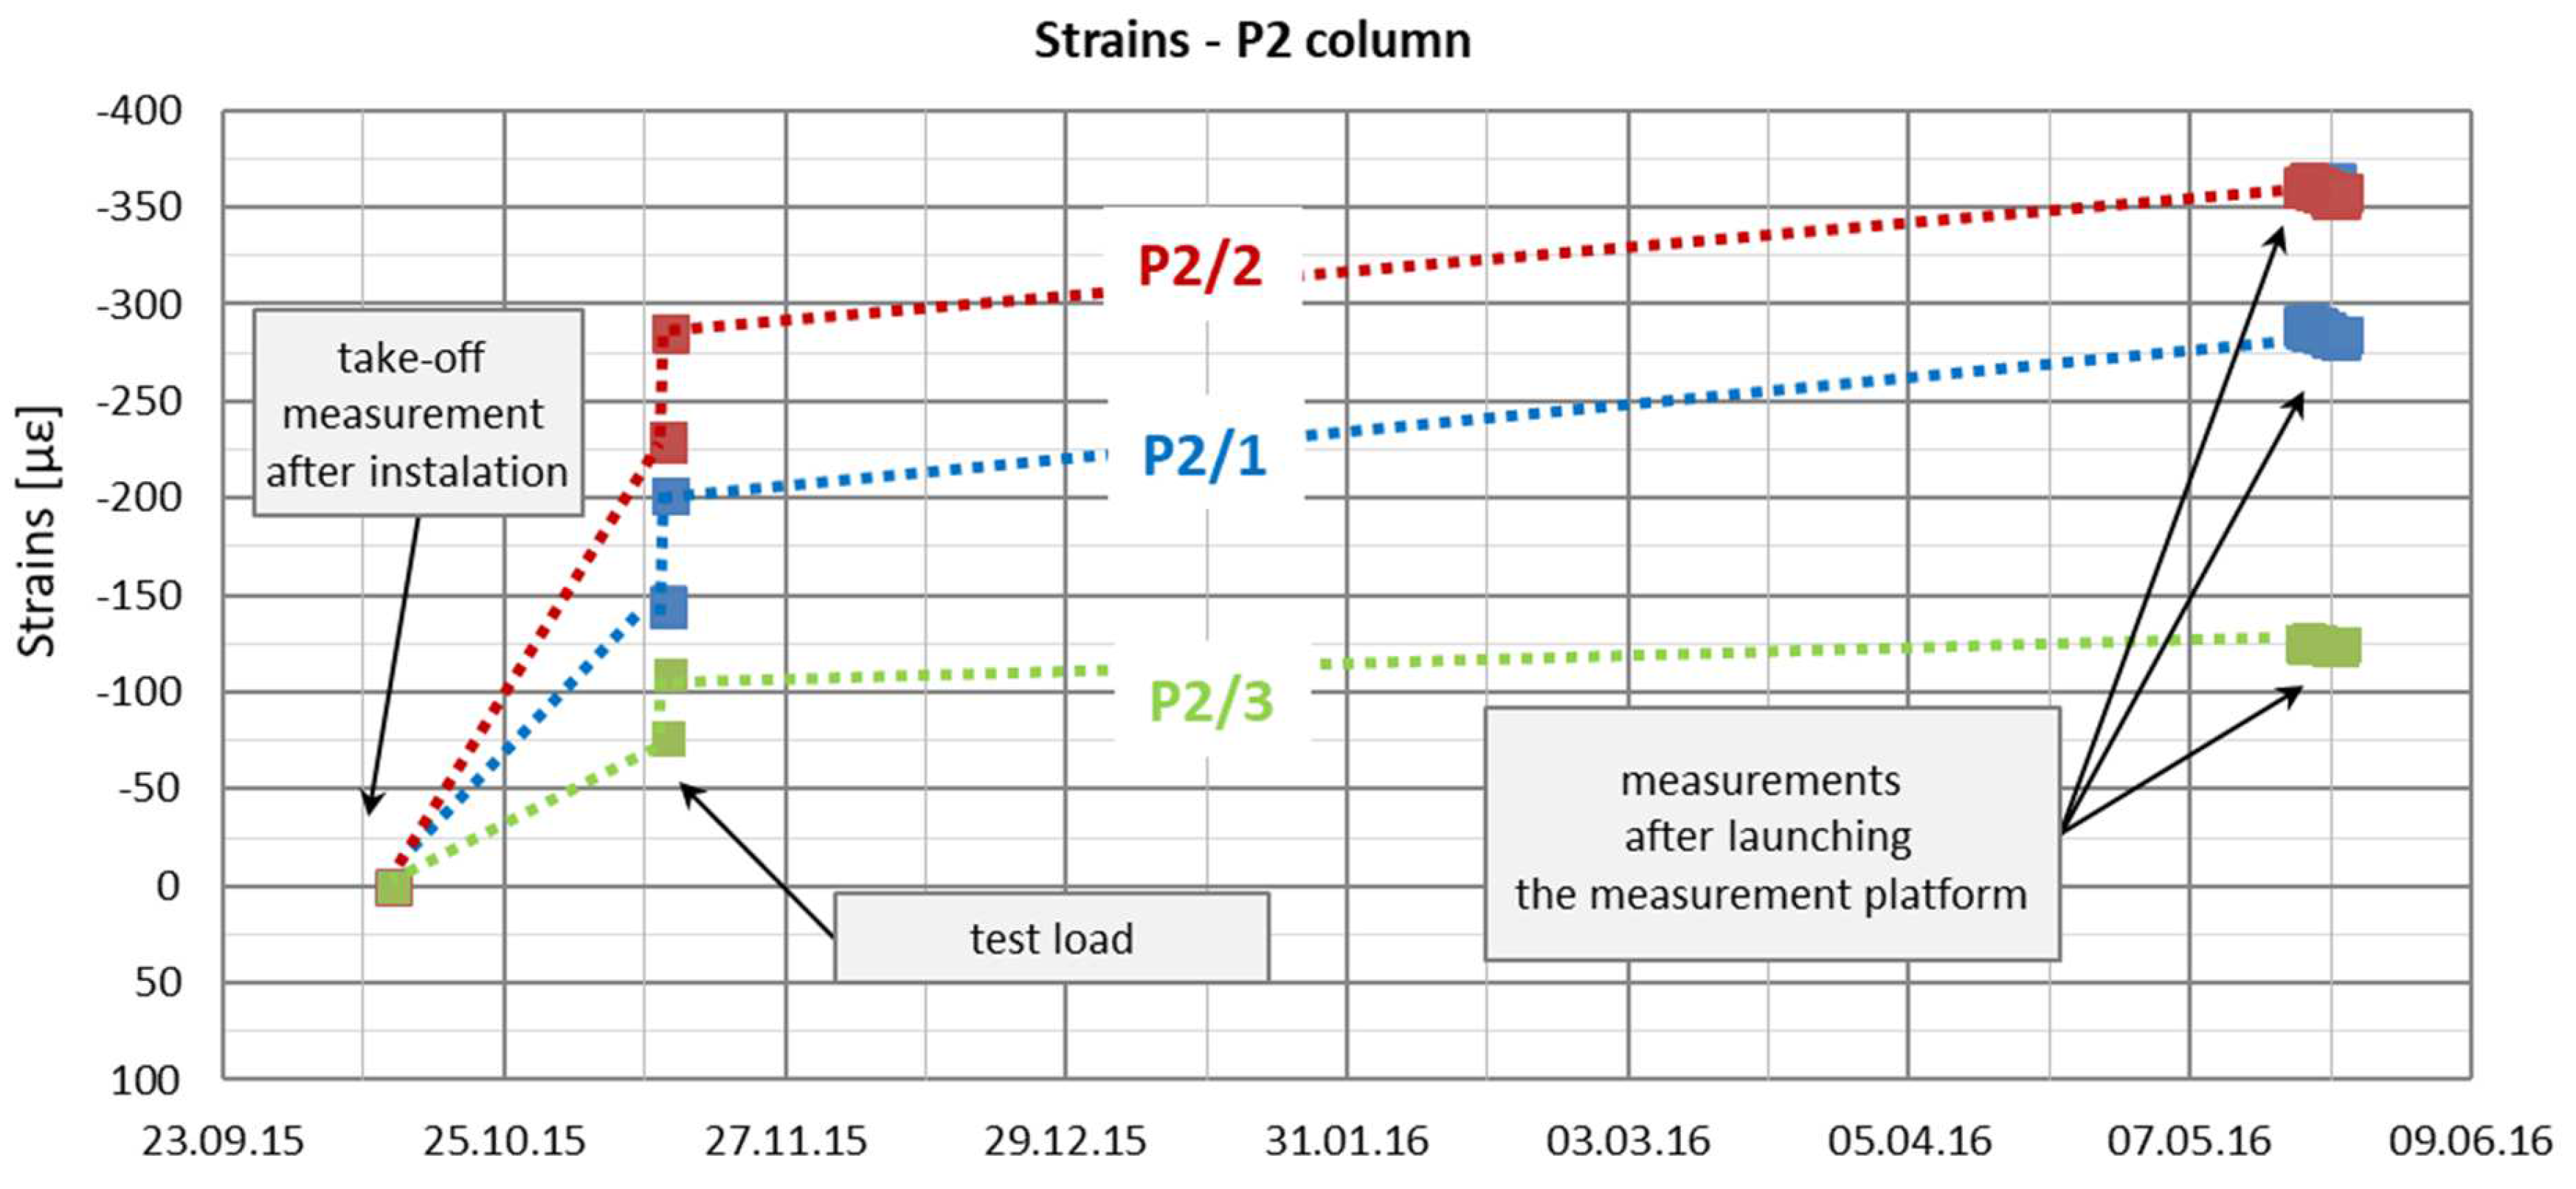
Figure 17.
a) Deformation of column P1 and b) axial force in column P1 during load test.
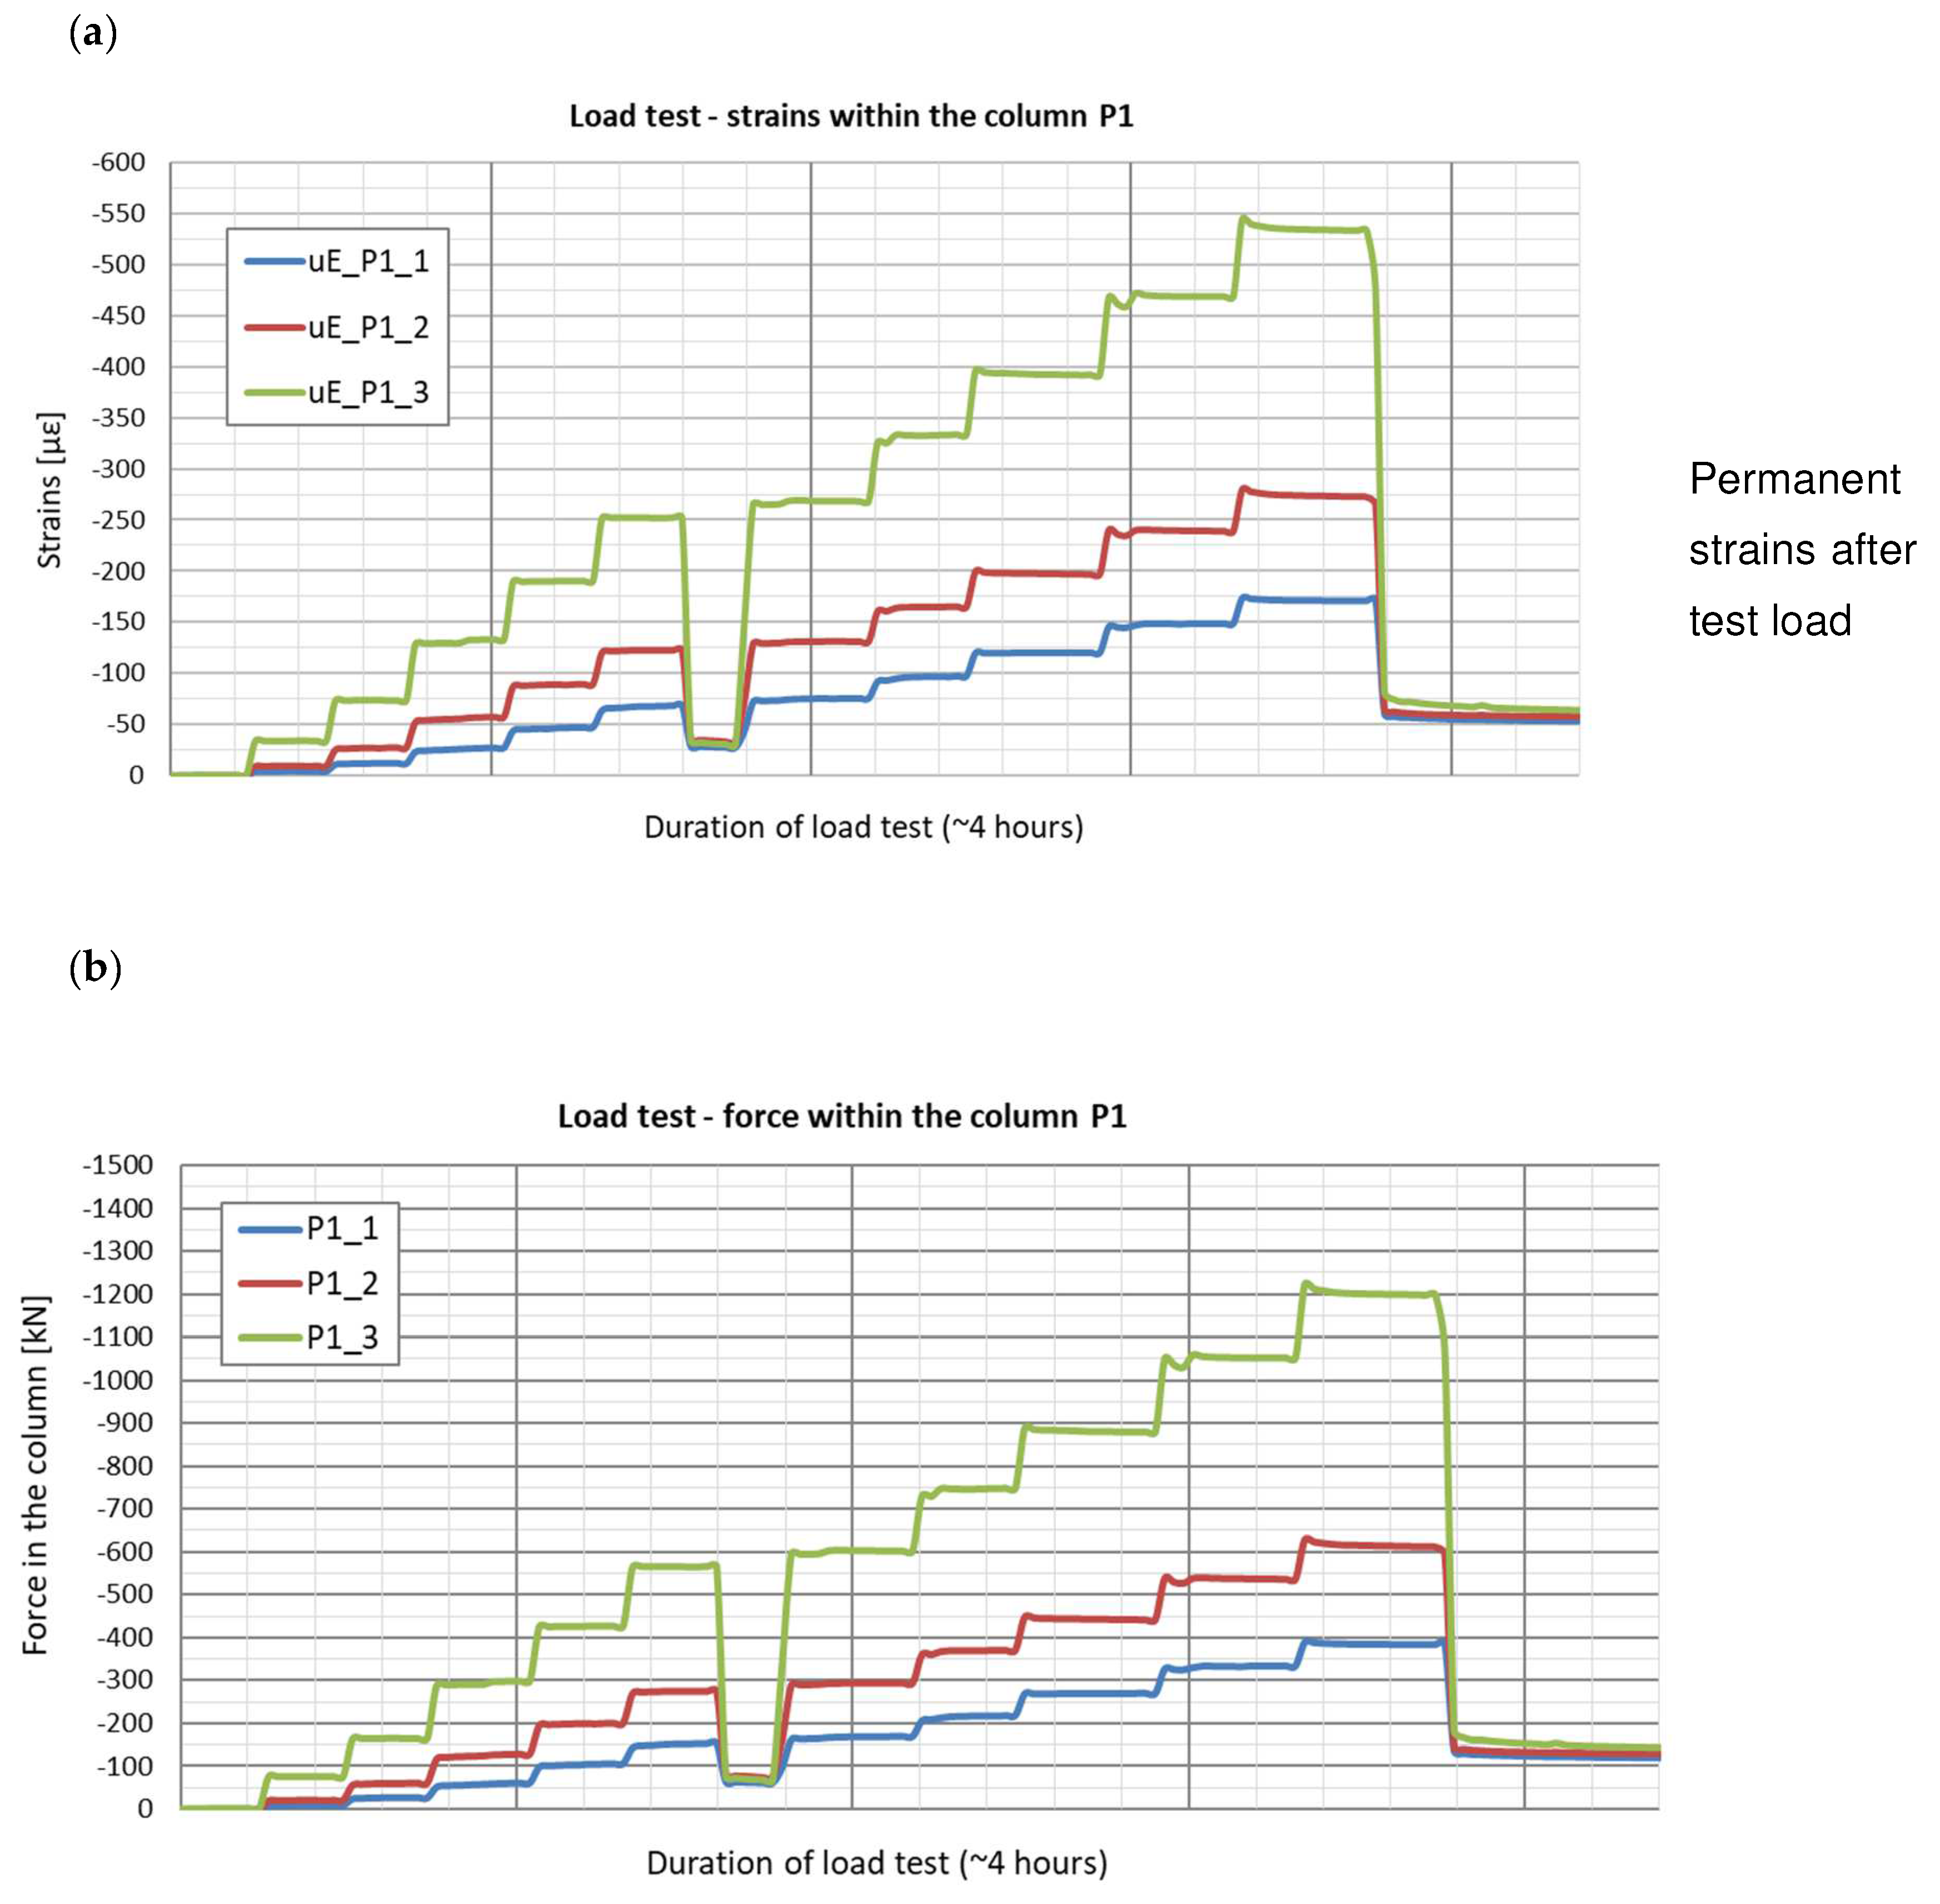
Figure 18.
a) Deformation of column P2 and b) axial force in column P2 during load test.
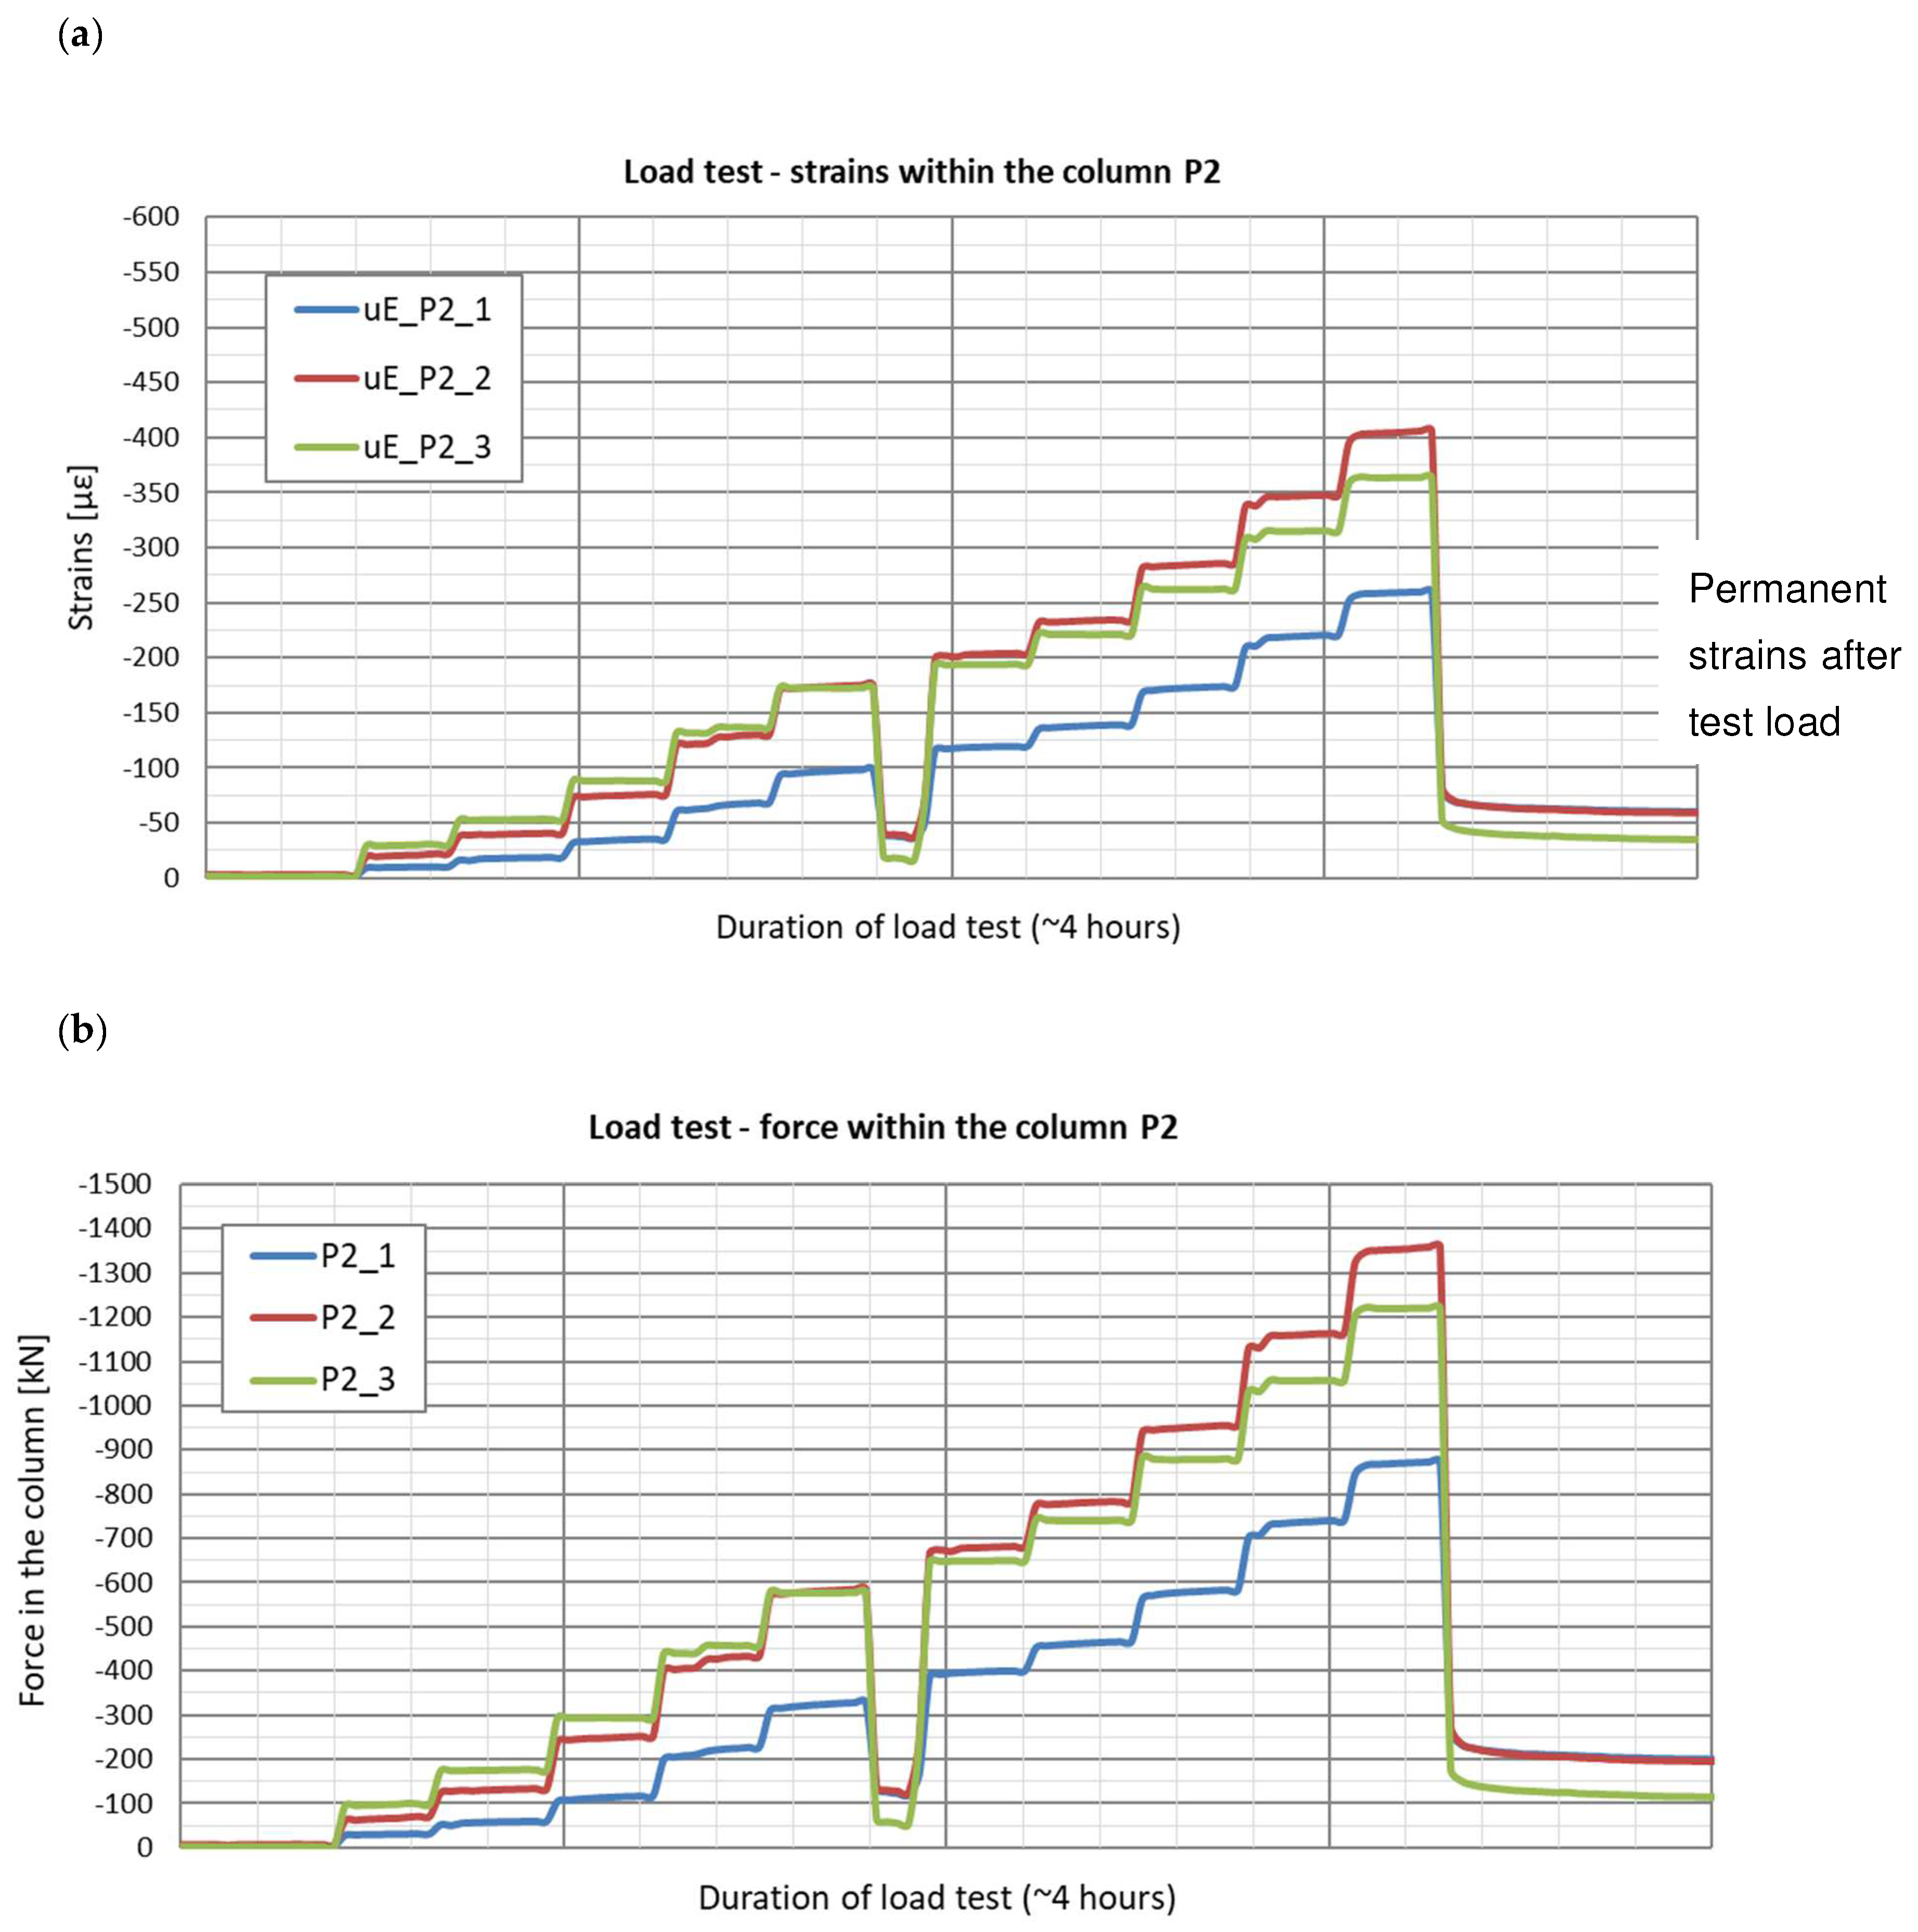
Figure 19.
Graphs of the force distribution along columns a) P1 and b) P2 during the test load. Graphs made based on the strain readings.
Figure 19.
Graphs of the force distribution along columns a) P1 and b) P2 during the test load. Graphs made based on the strain readings.
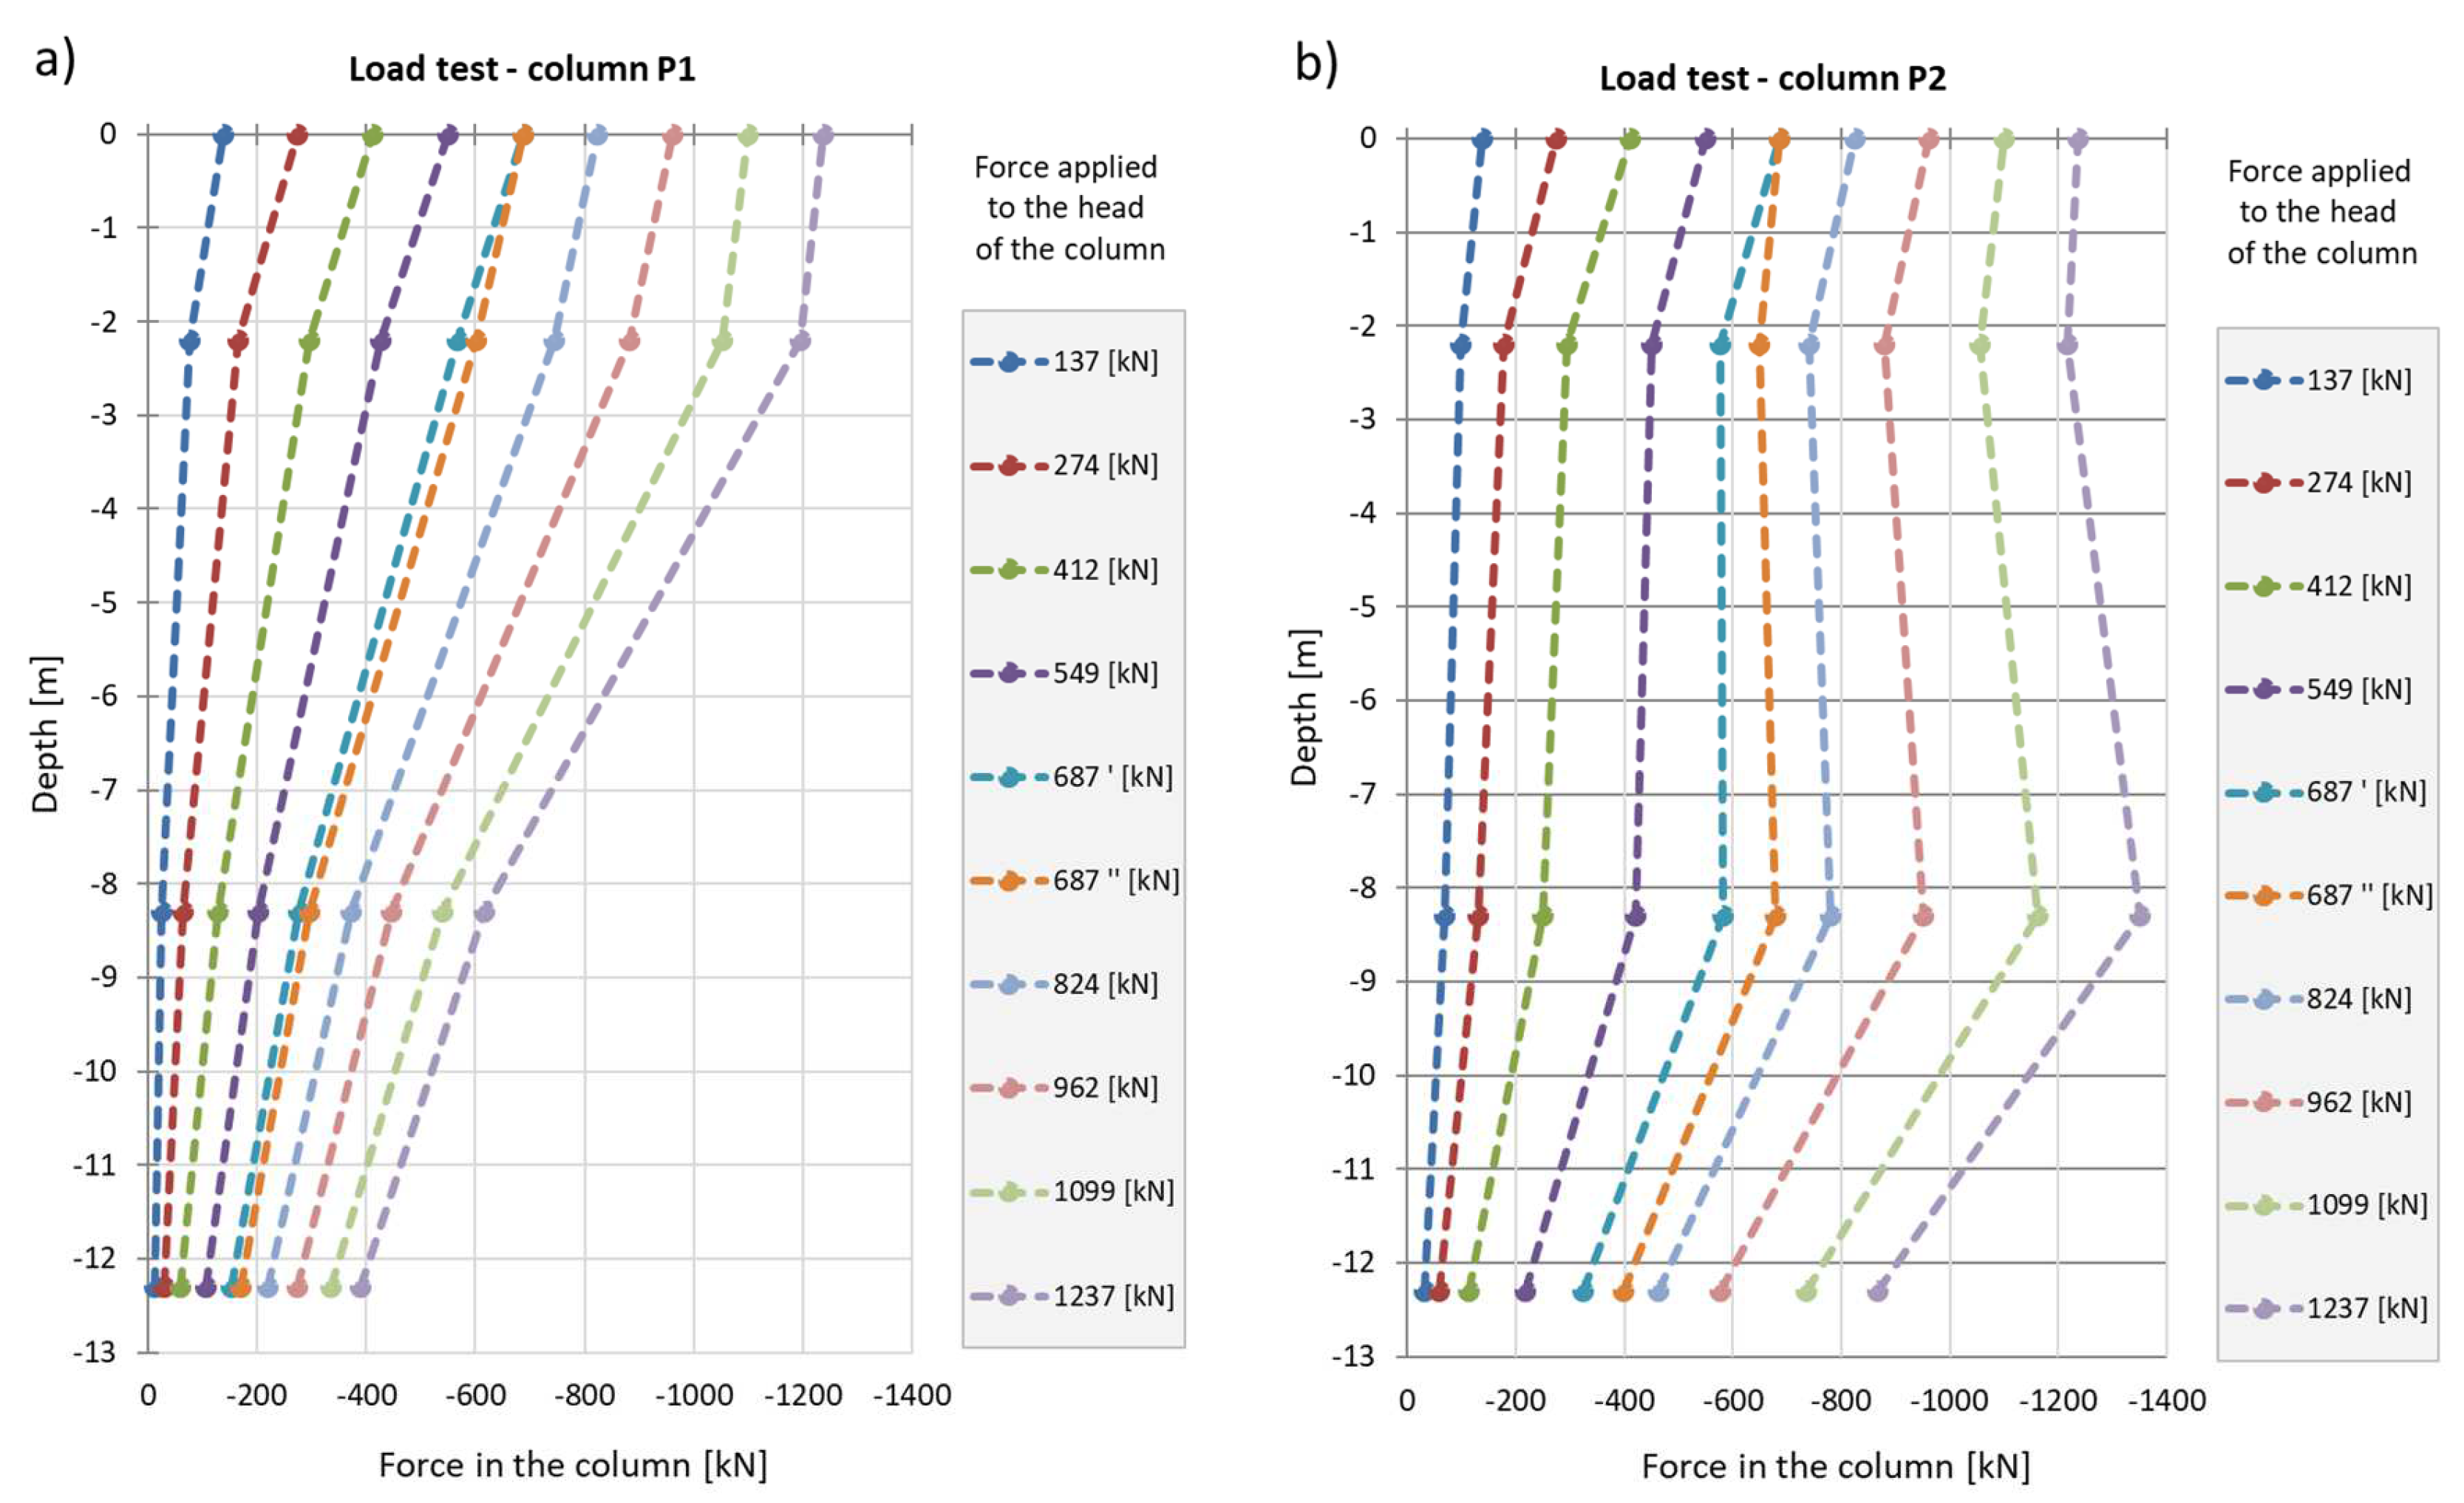
Figure 20.
The load-settlement relationship for the head for columns P1 and P2 (load test results).
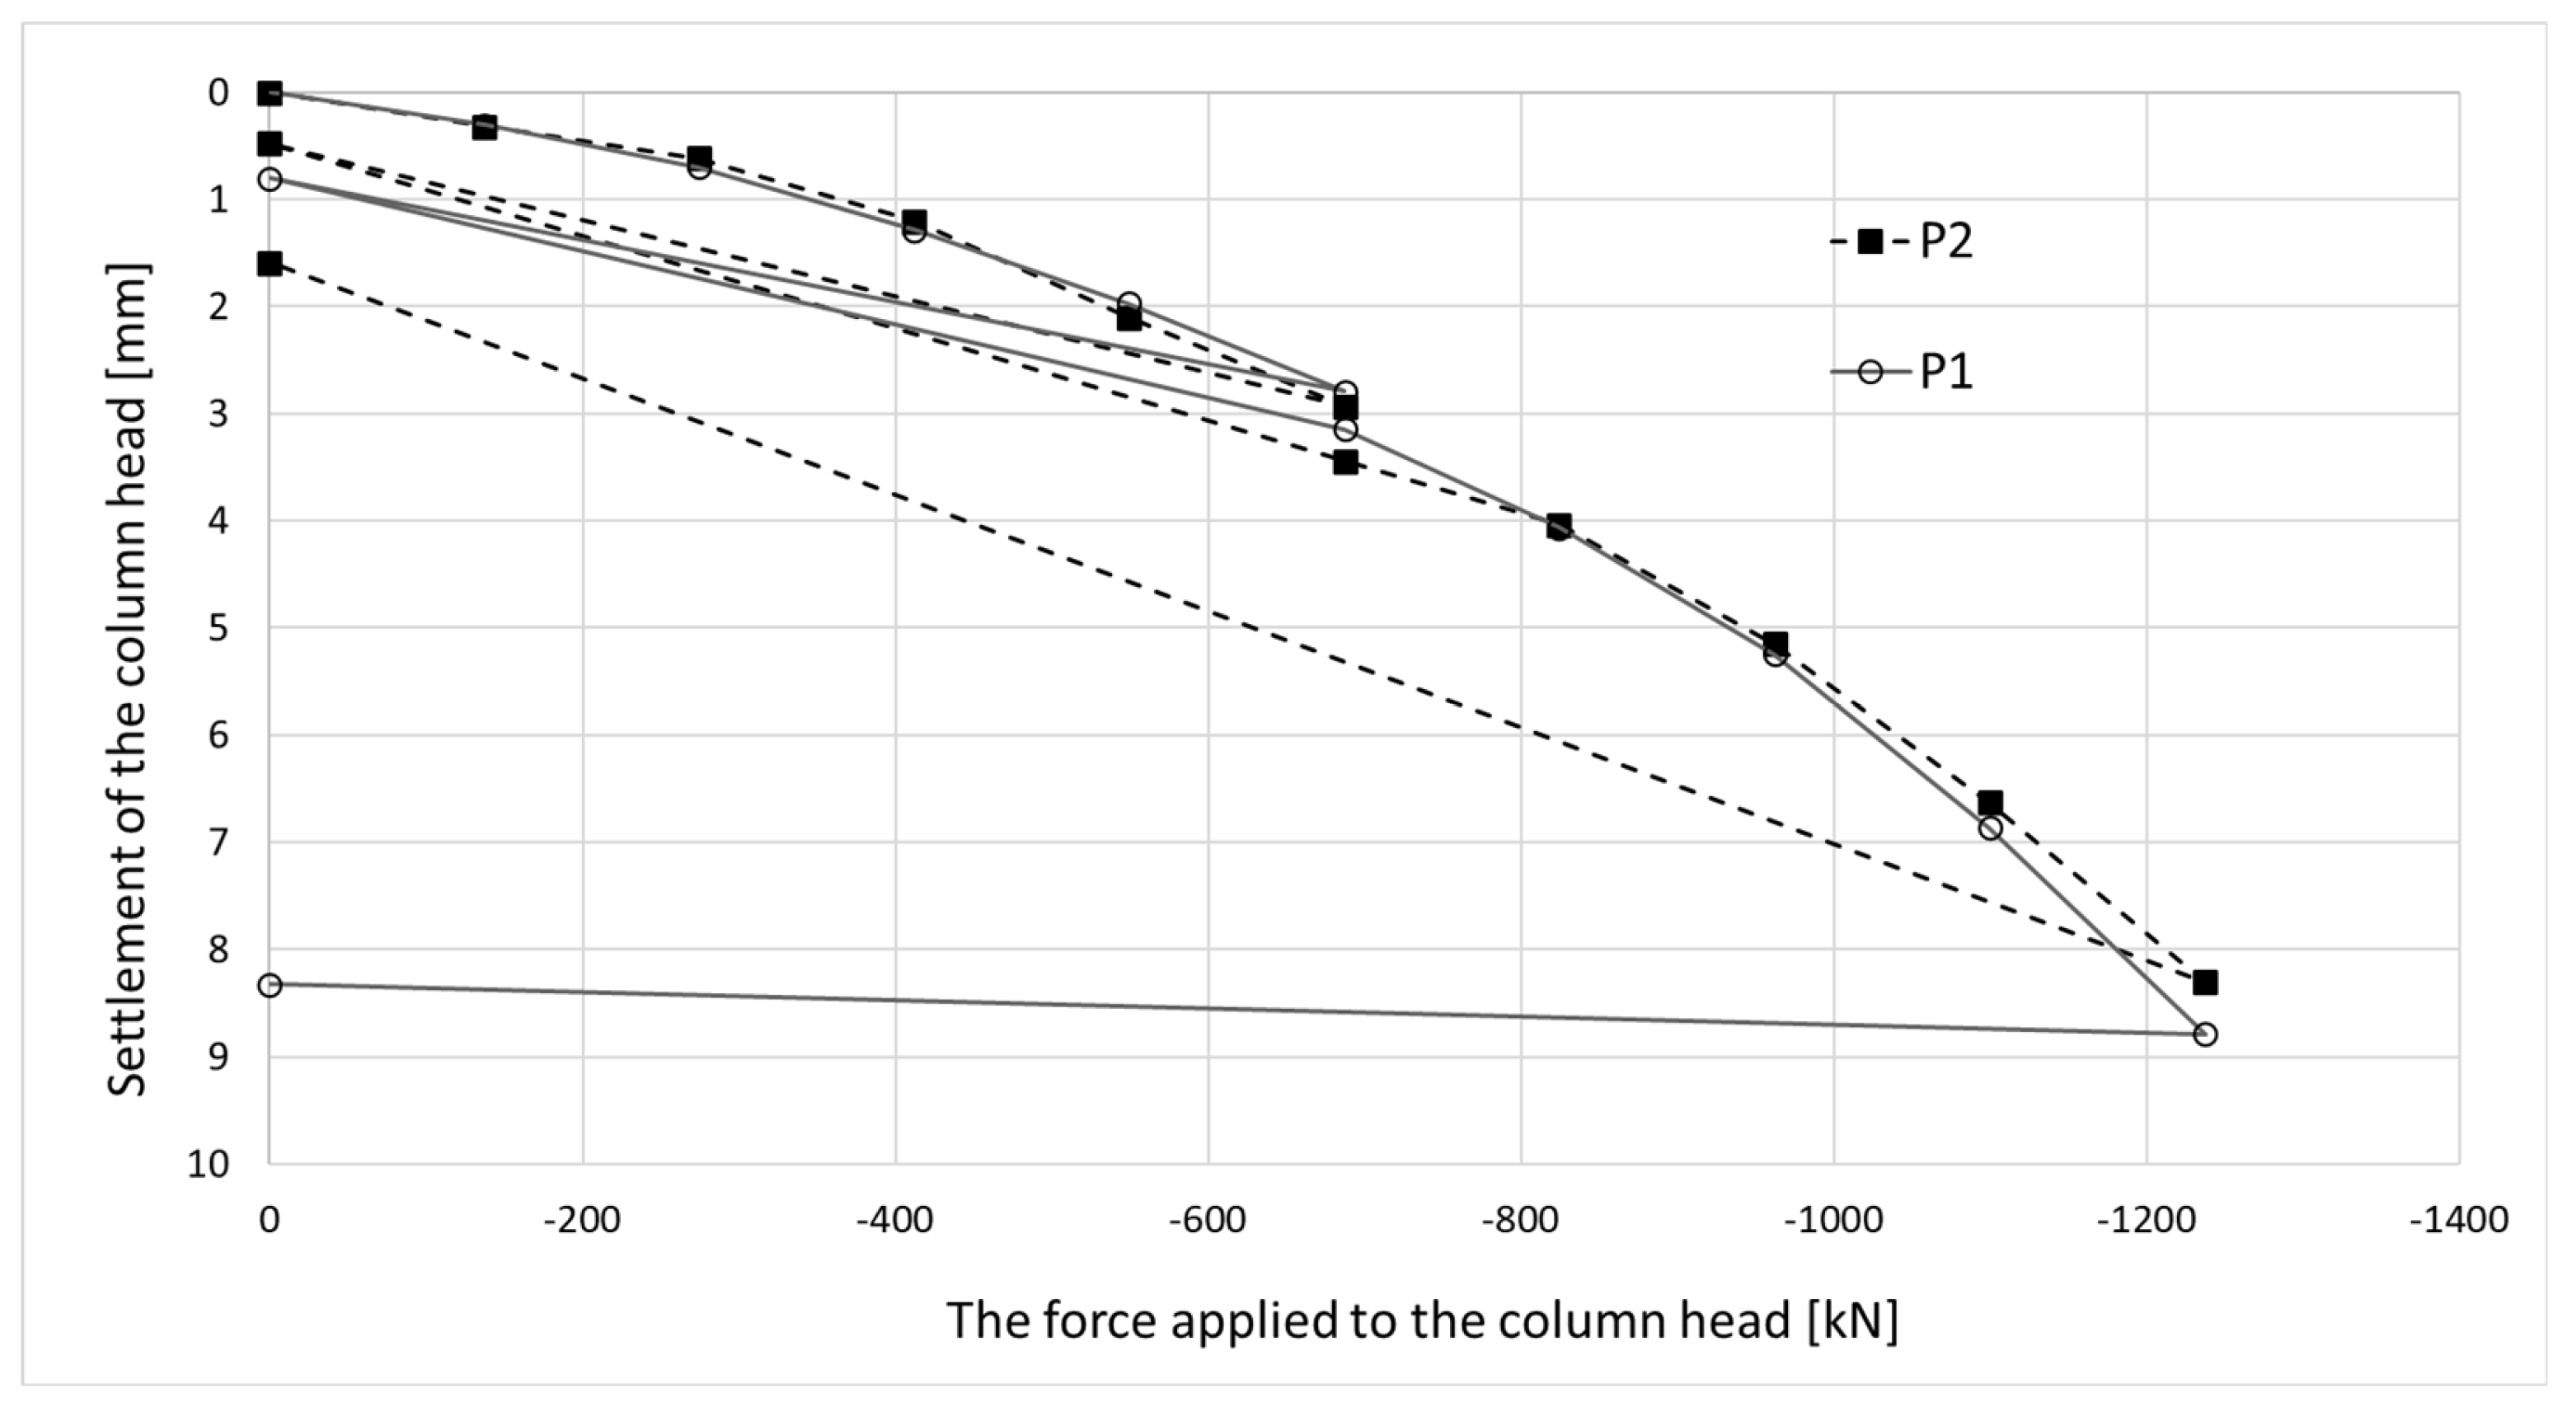
Figure 21.
Hypothetical extension of the force distribution diagram along columns a) P1 and b) P2 during the test load.
Figure 21.
Hypothetical extension of the force distribution diagram along columns a) P1 and b) P2 during the test load.
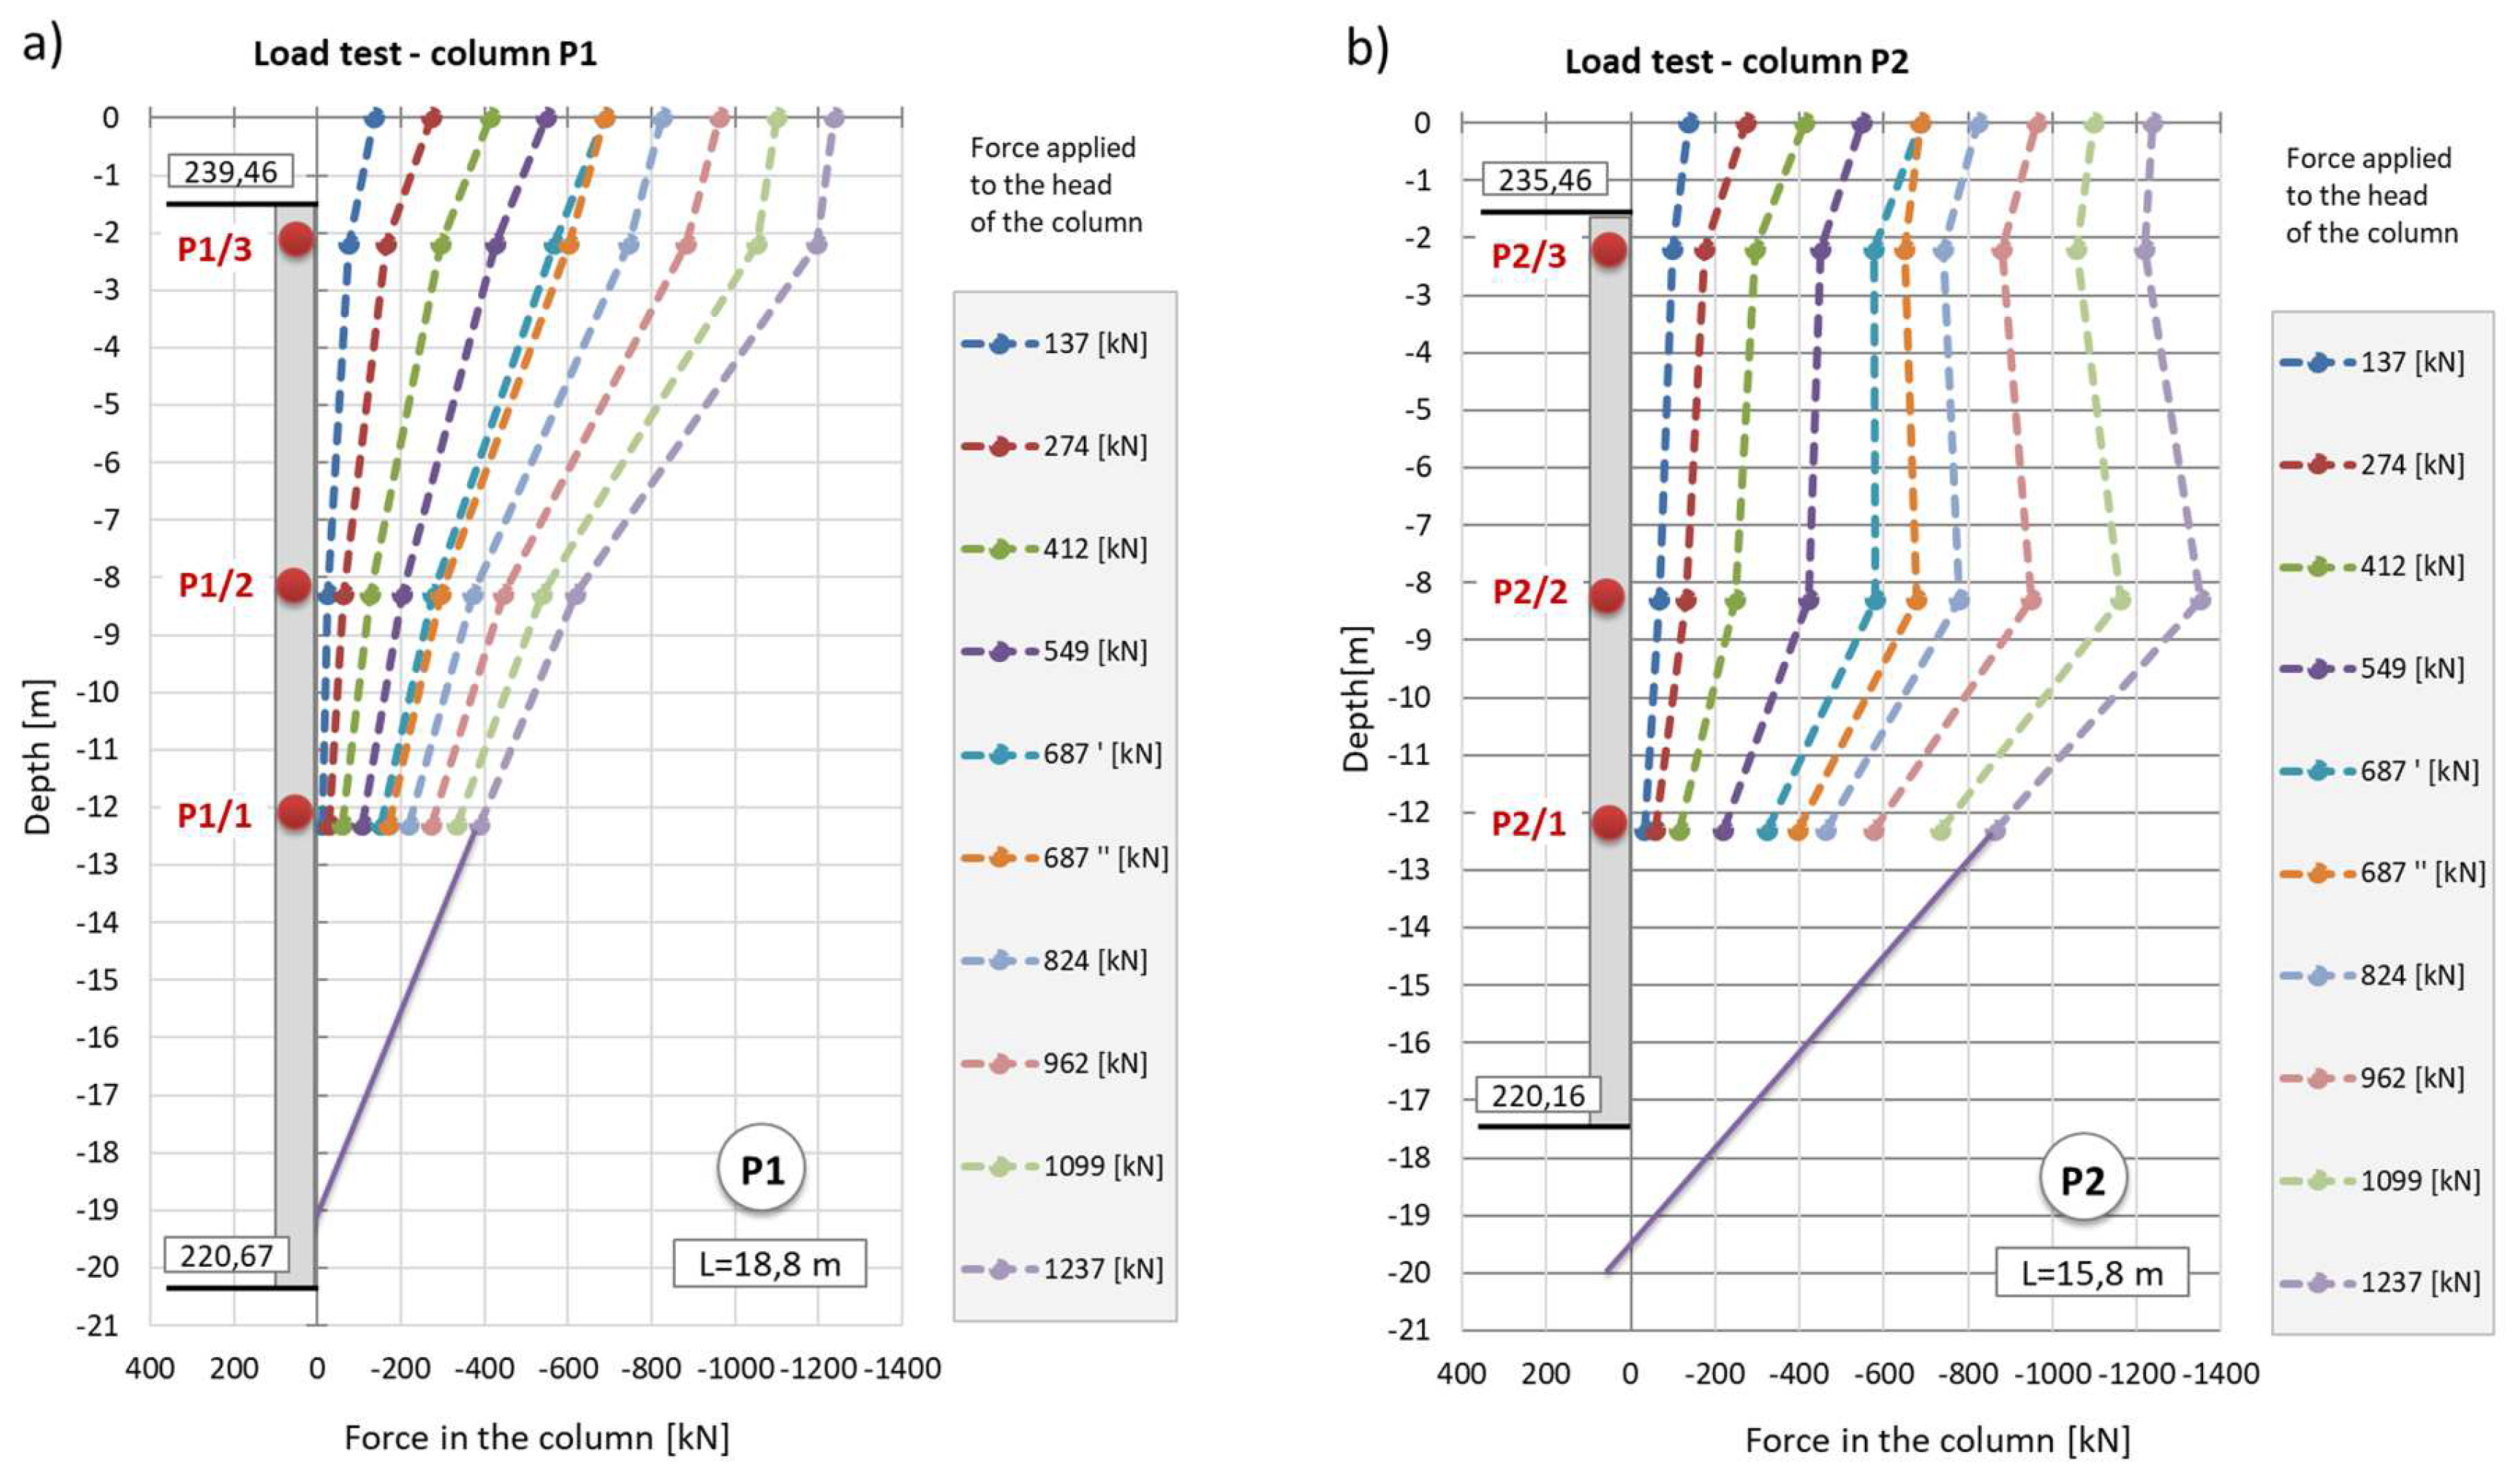
Figure 22.
Influence of temperature on the determined strain values. Designations: e(L) - real strains [27], e(s) - stress strains.
Figure 22.
Influence of temperature on the determined strain values. Designations: e(L) - real strains [27], e(s) - stress strains.
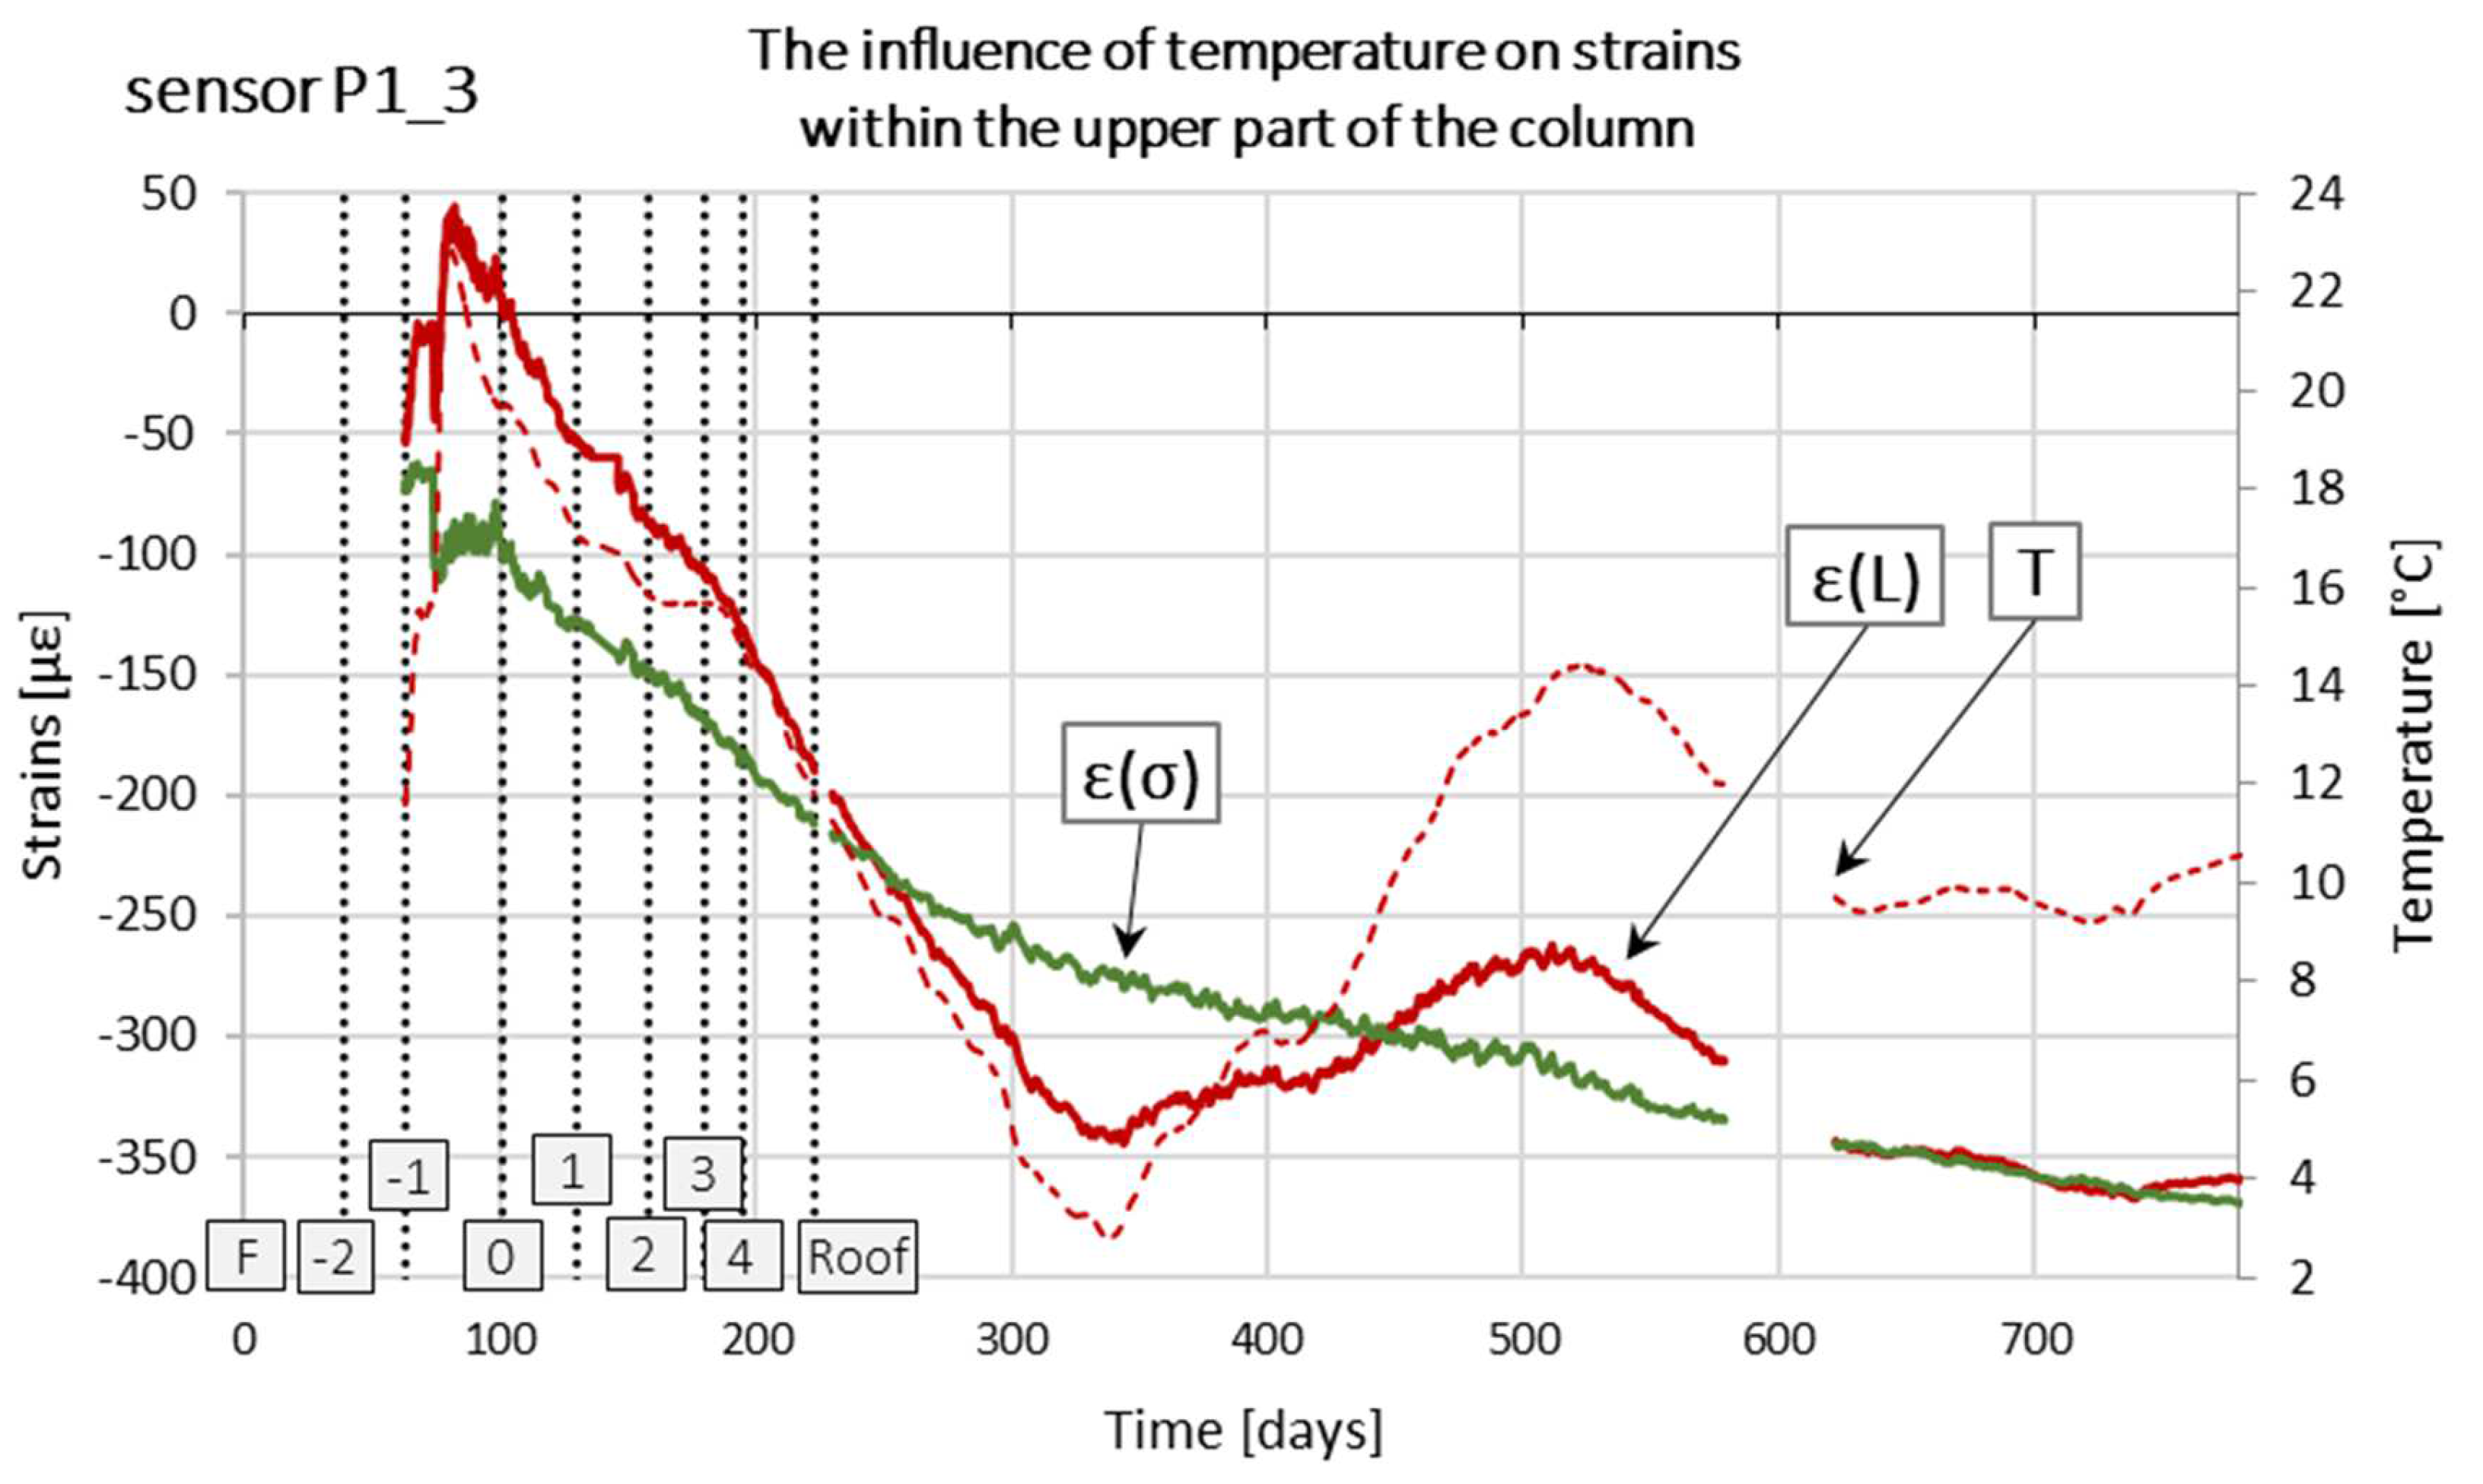
Figure 23.
Change in the stress value in the ground under the foundation slab as a function of time for selected locations, taking into account the correction resulting from the stresses existing in the ground at the moment of starting the measurement.
Figure 23.
Change in the stress value in the ground under the foundation slab as a function of time for selected locations, taking into account the correction resulting from the stresses existing in the ground at the moment of starting the measurement.
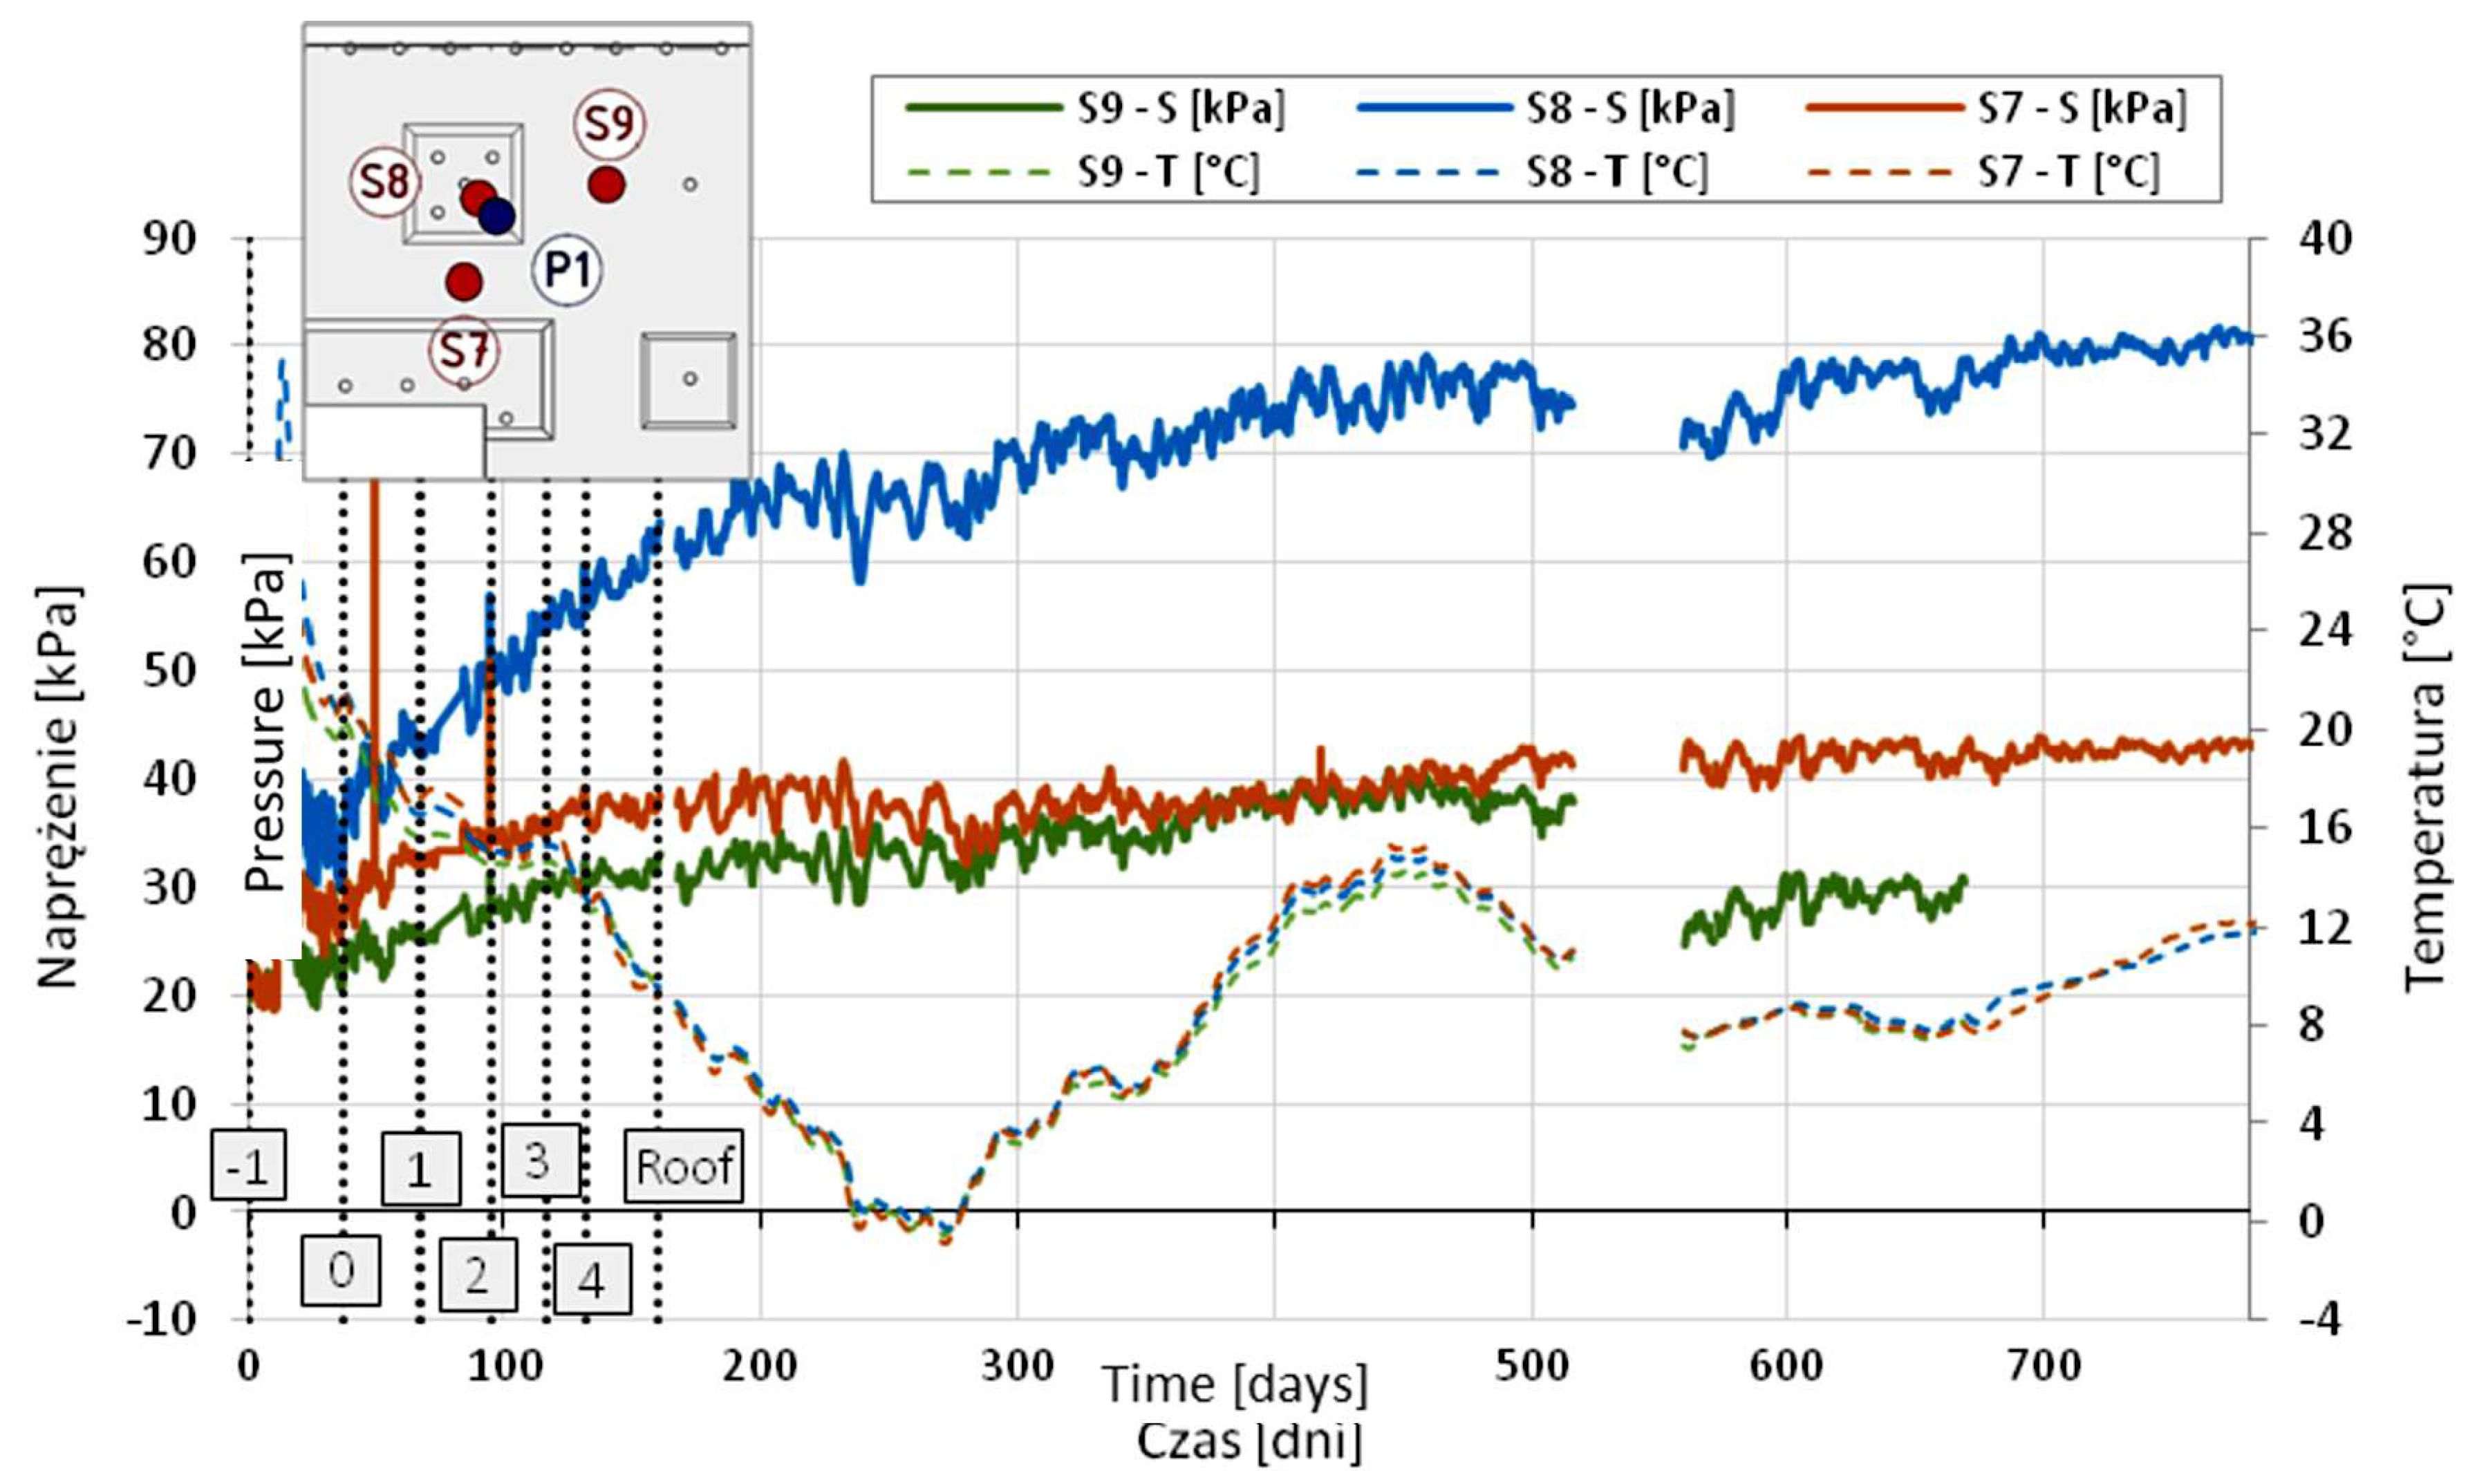
Figure 24.
Change of the estimated value of the axial force as a function of time based on the measurement of concrete deformations.
Figure 24.
Change of the estimated value of the axial force as a function of time based on the measurement of concrete deformations.
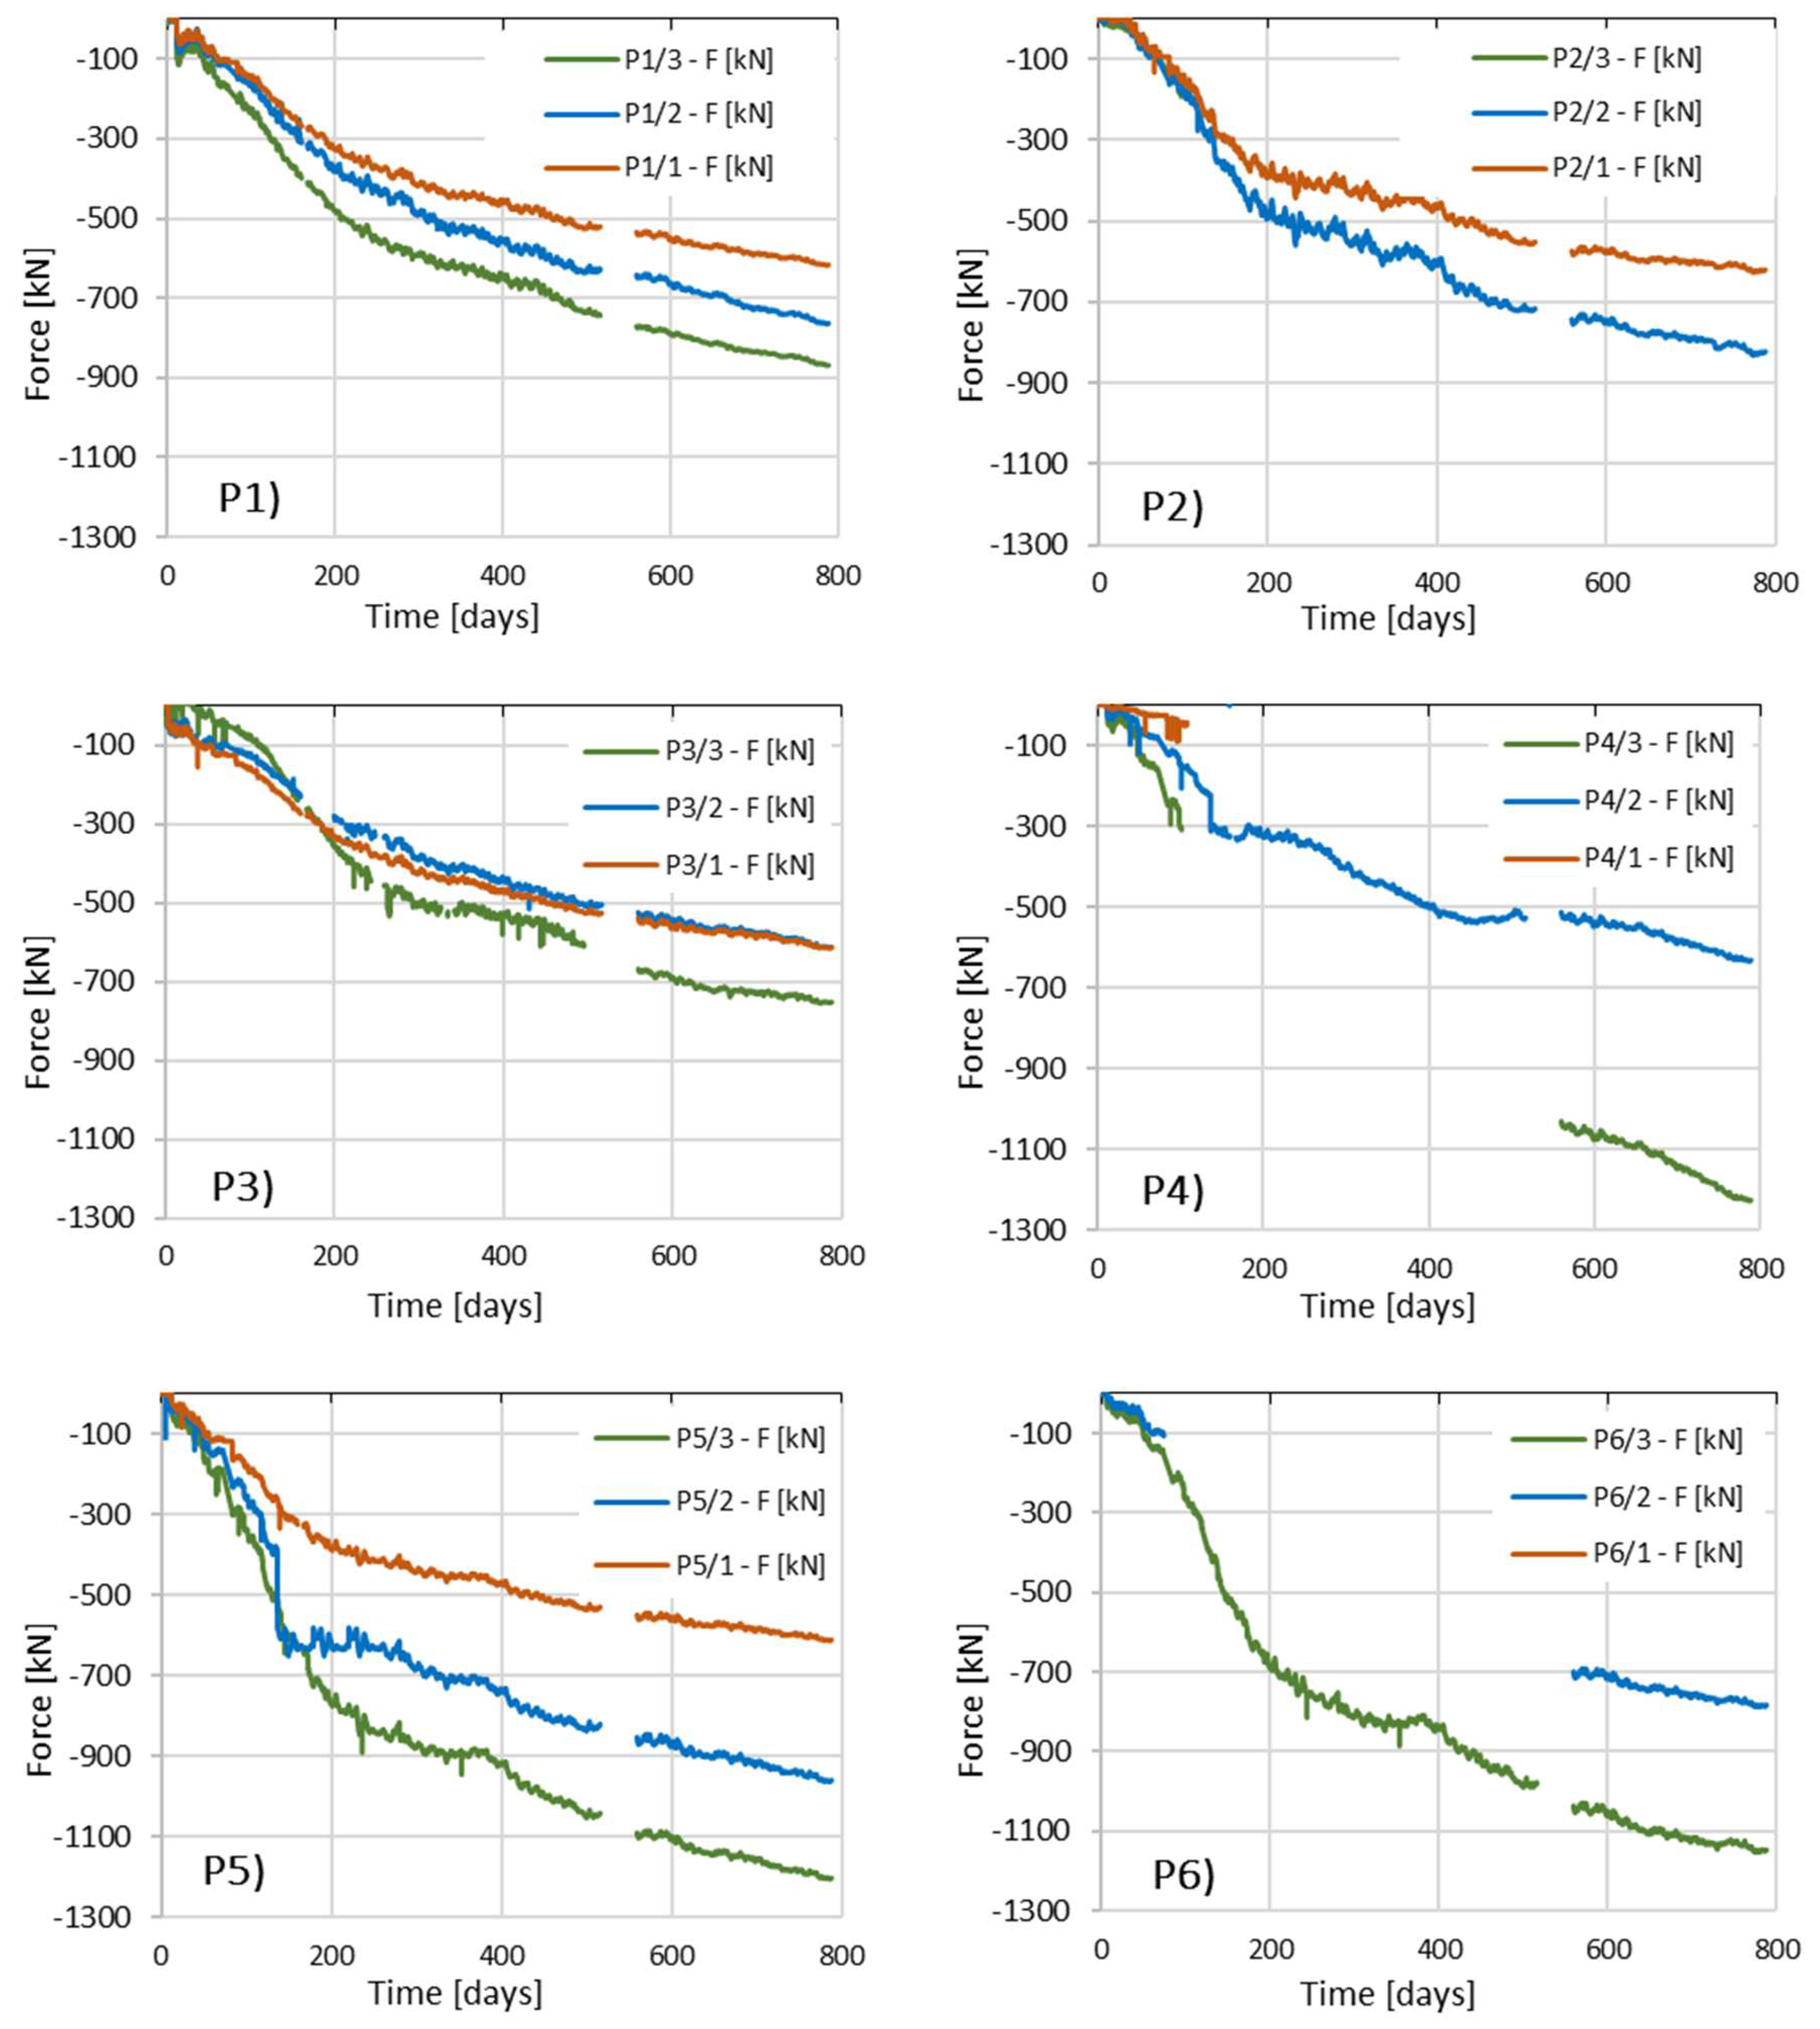
Figure 25.
Column arrangement around column P1, P2 and P3.
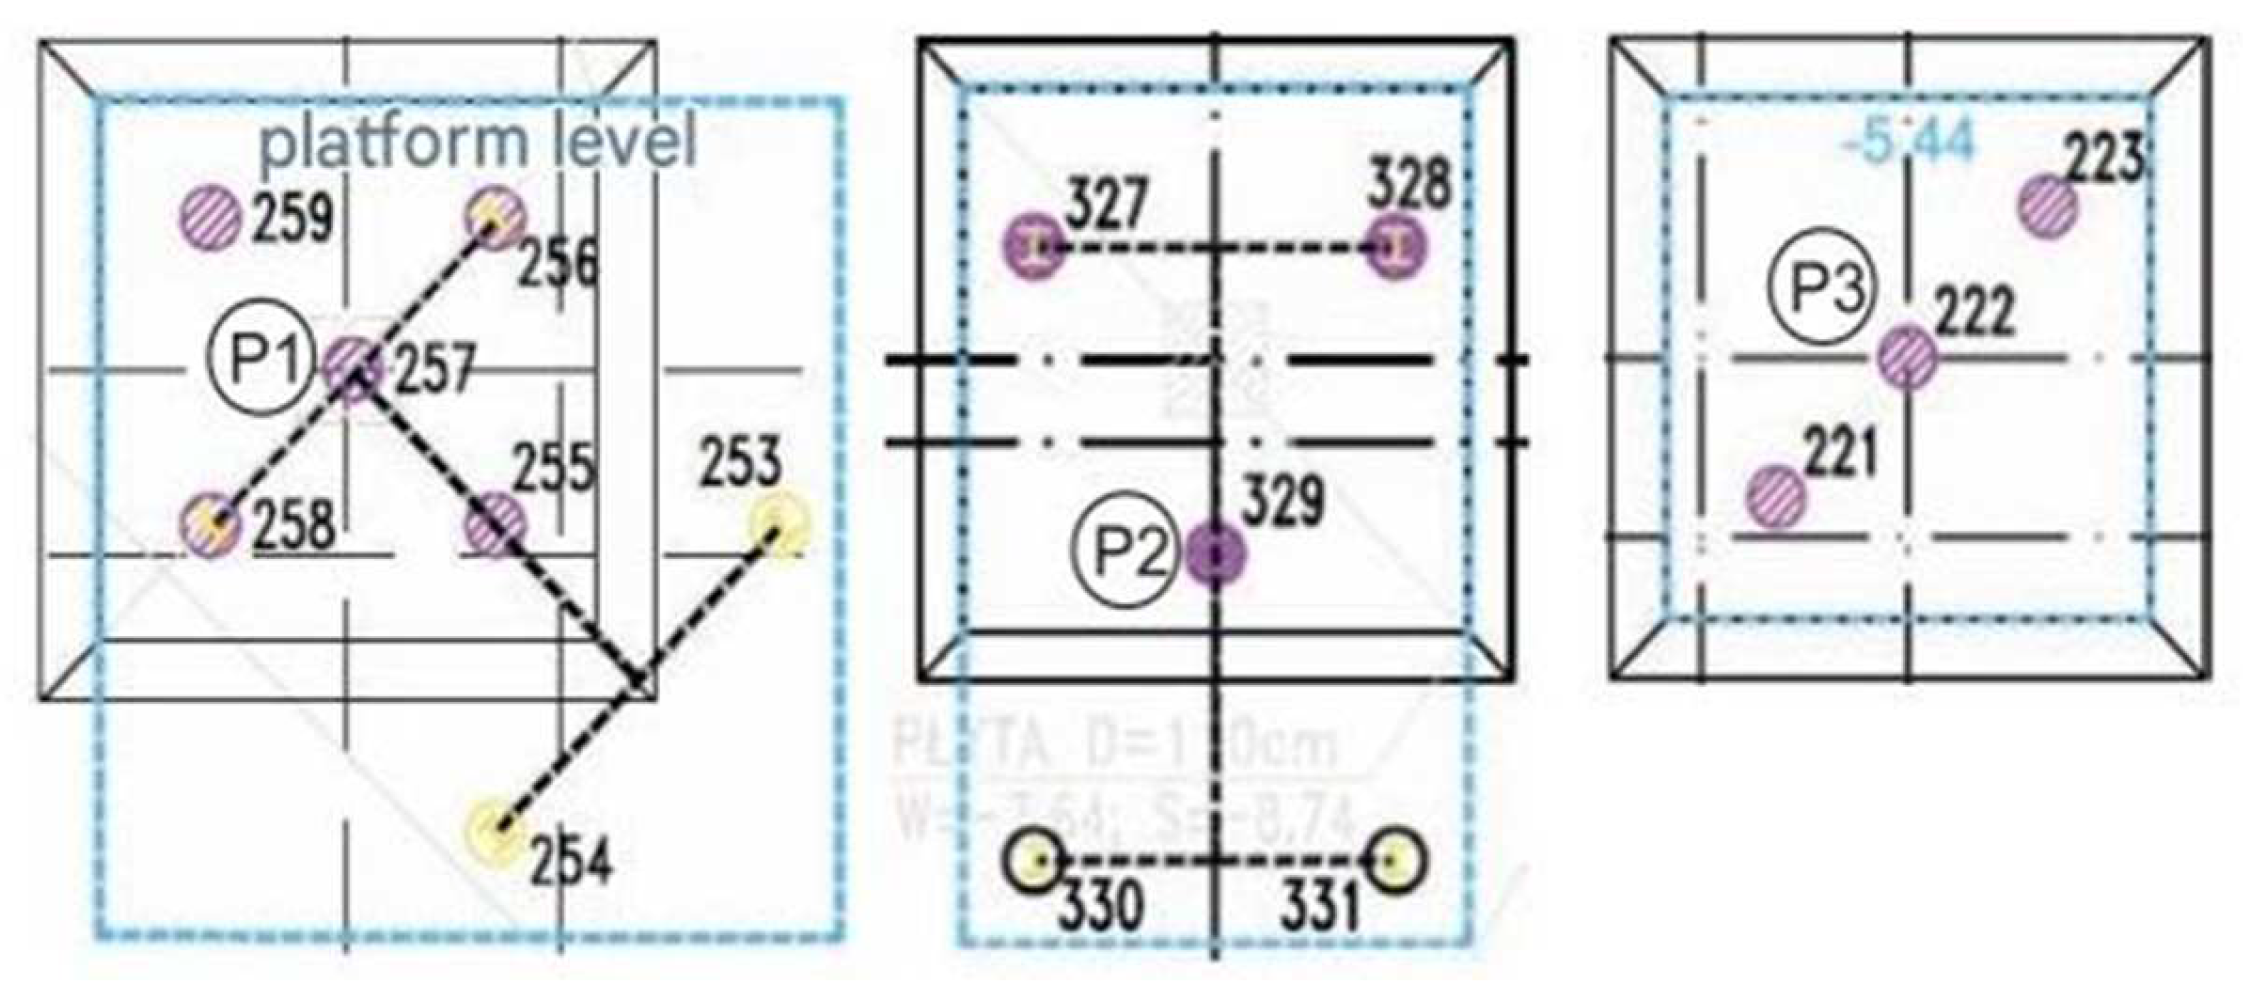
Figure 26.
Distribution of force along columns a) P1 and b) P2 during the test load and for the last reading during the construction of the building (solid black line).
Figure 26.
Distribution of force along columns a) P1 and b) P2 during the test load and for the last reading during the construction of the building (solid black line).
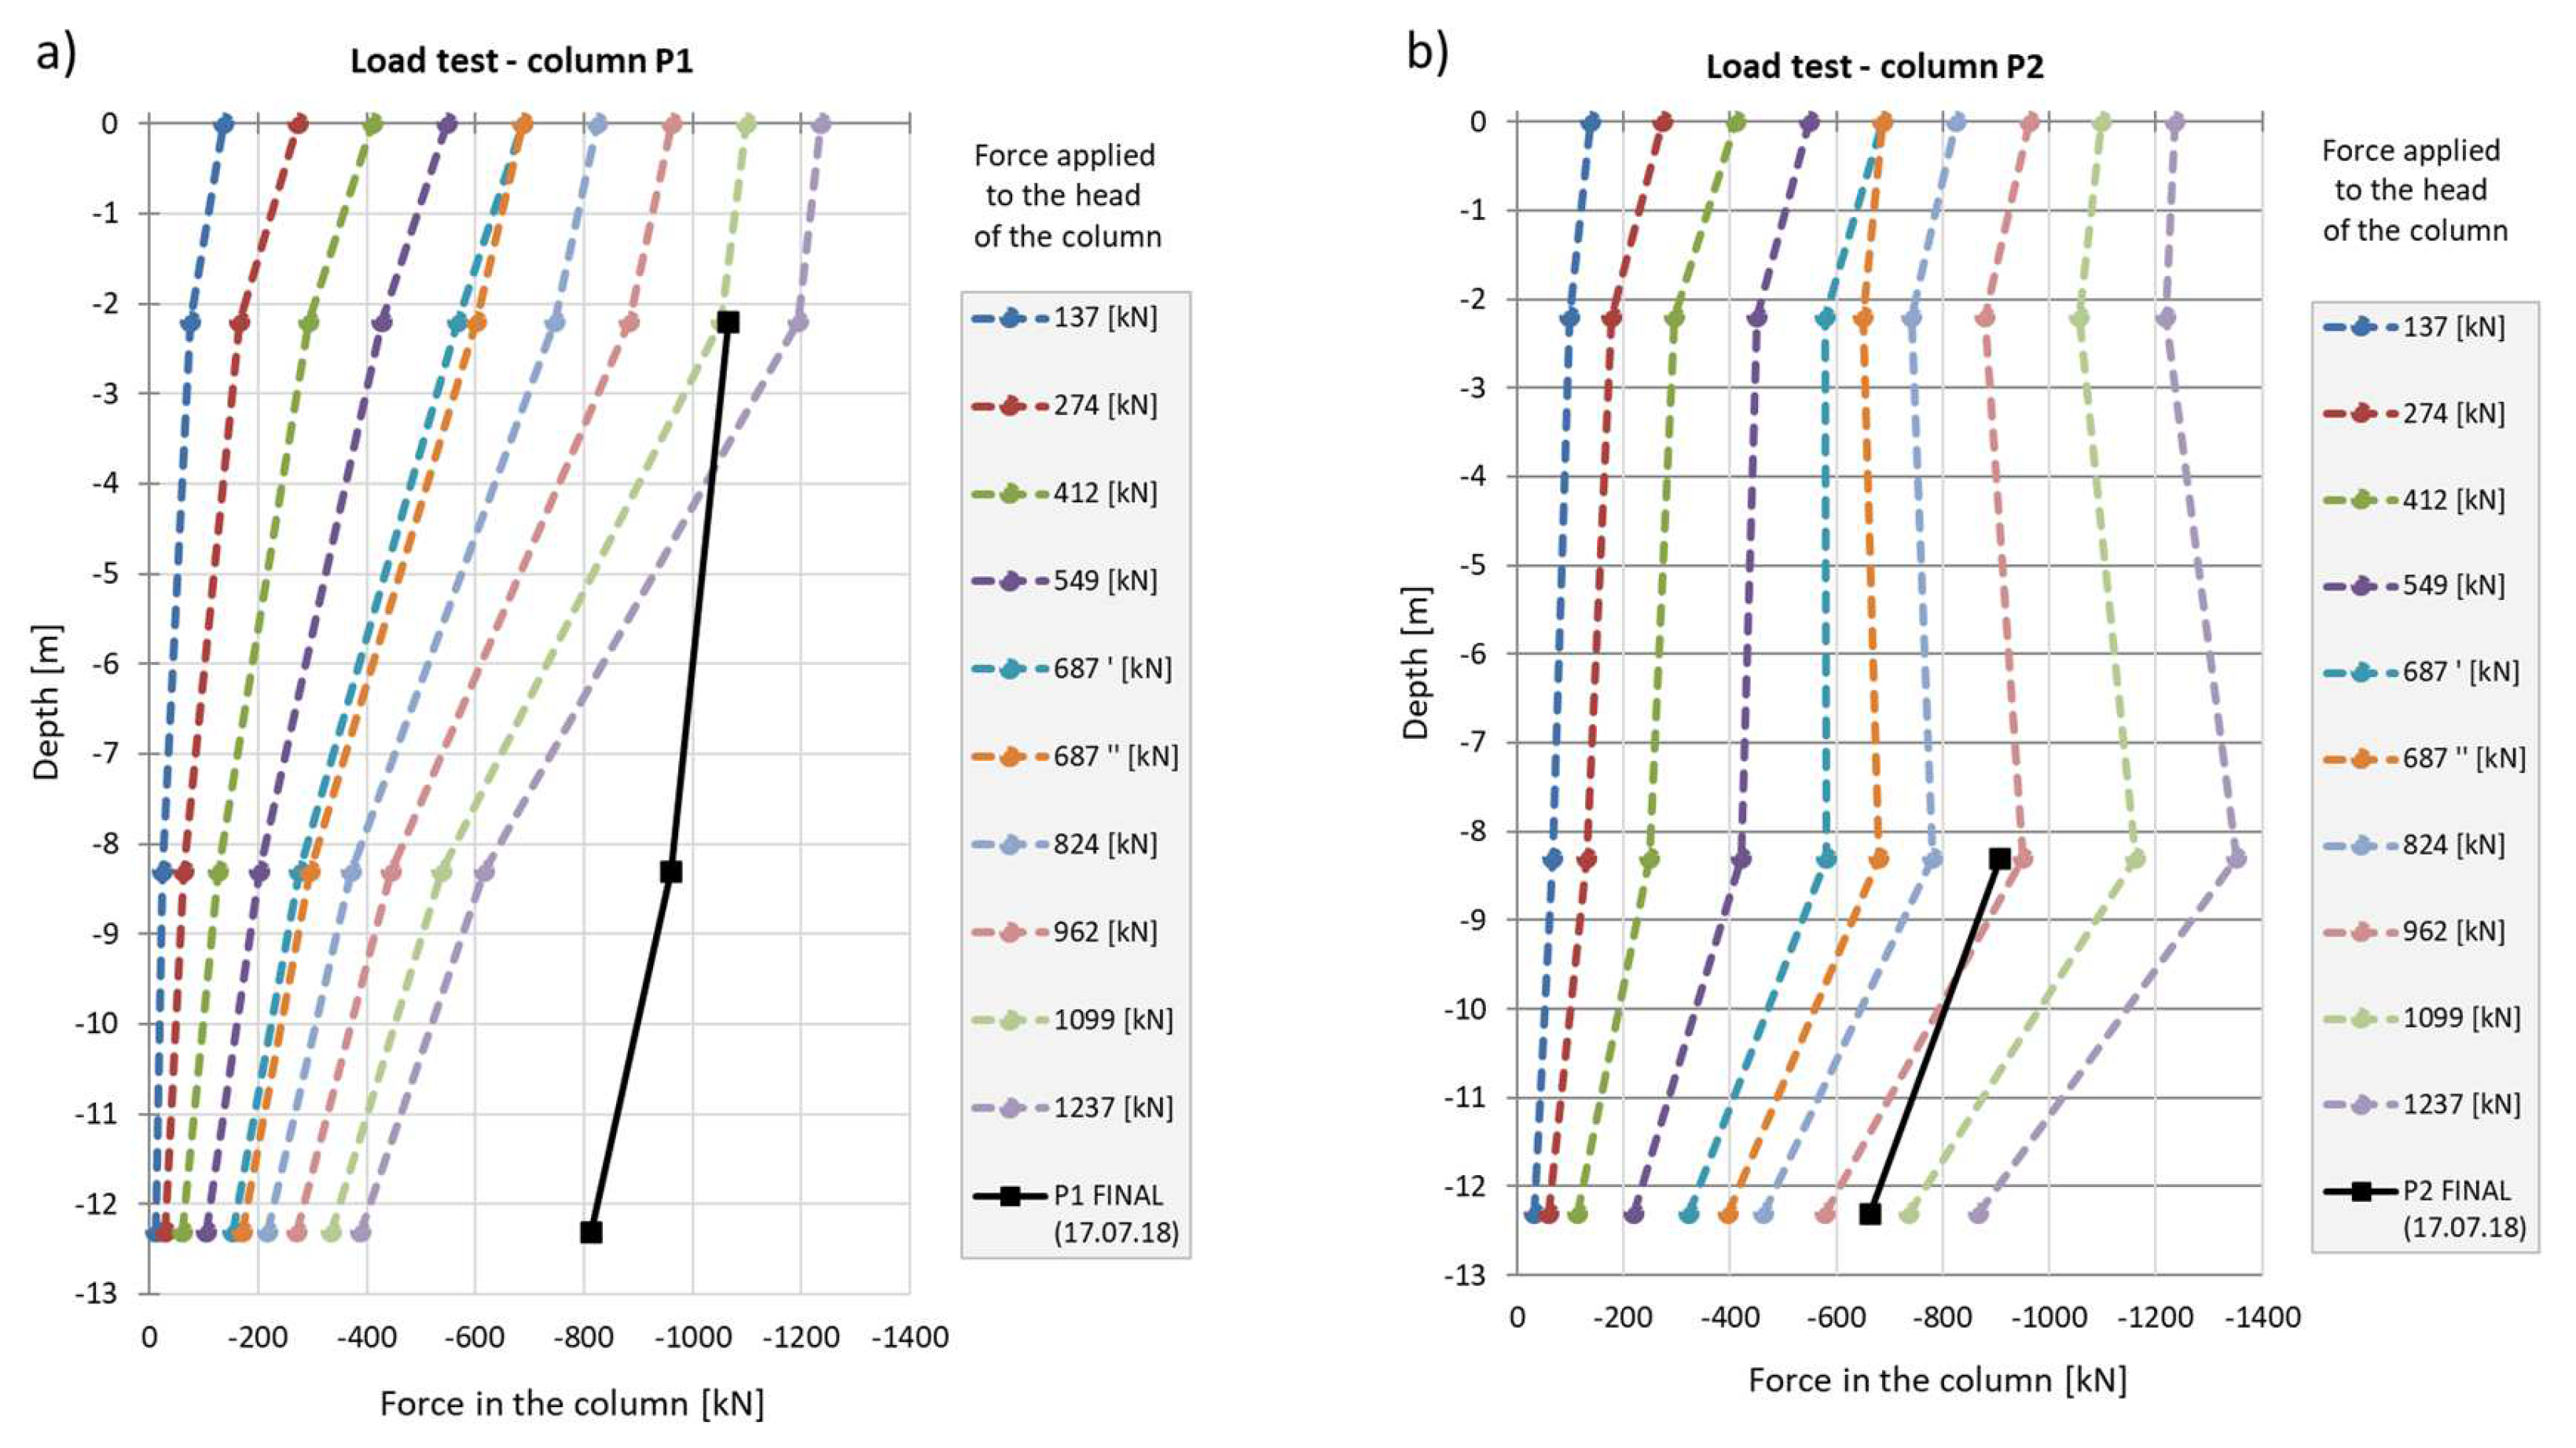
Figure 27.
Arrangement of columns around columns P4 (No. 300), P5 (No. 315) and P6 (No. 318).
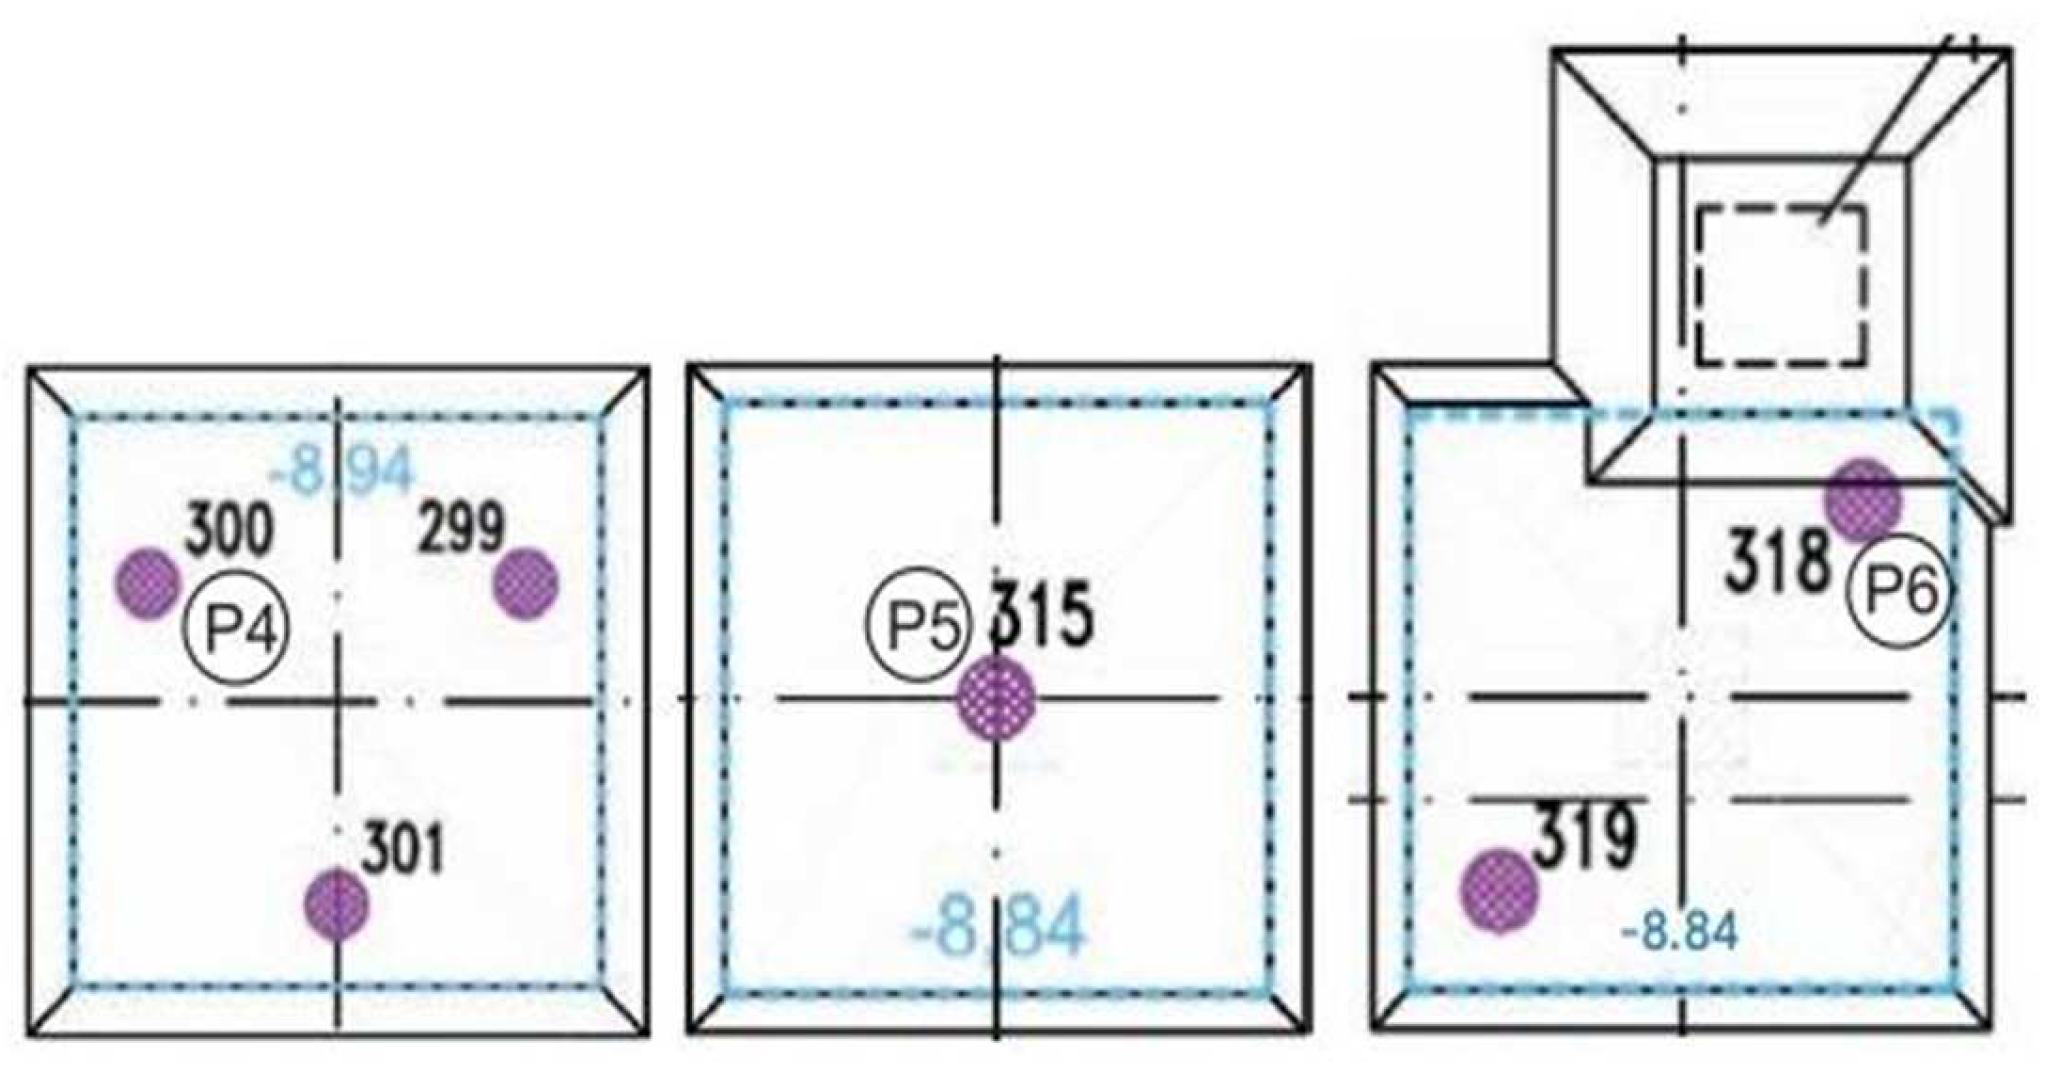
Figure 28.
FEM model (ZSoil) of the selected part of the building.
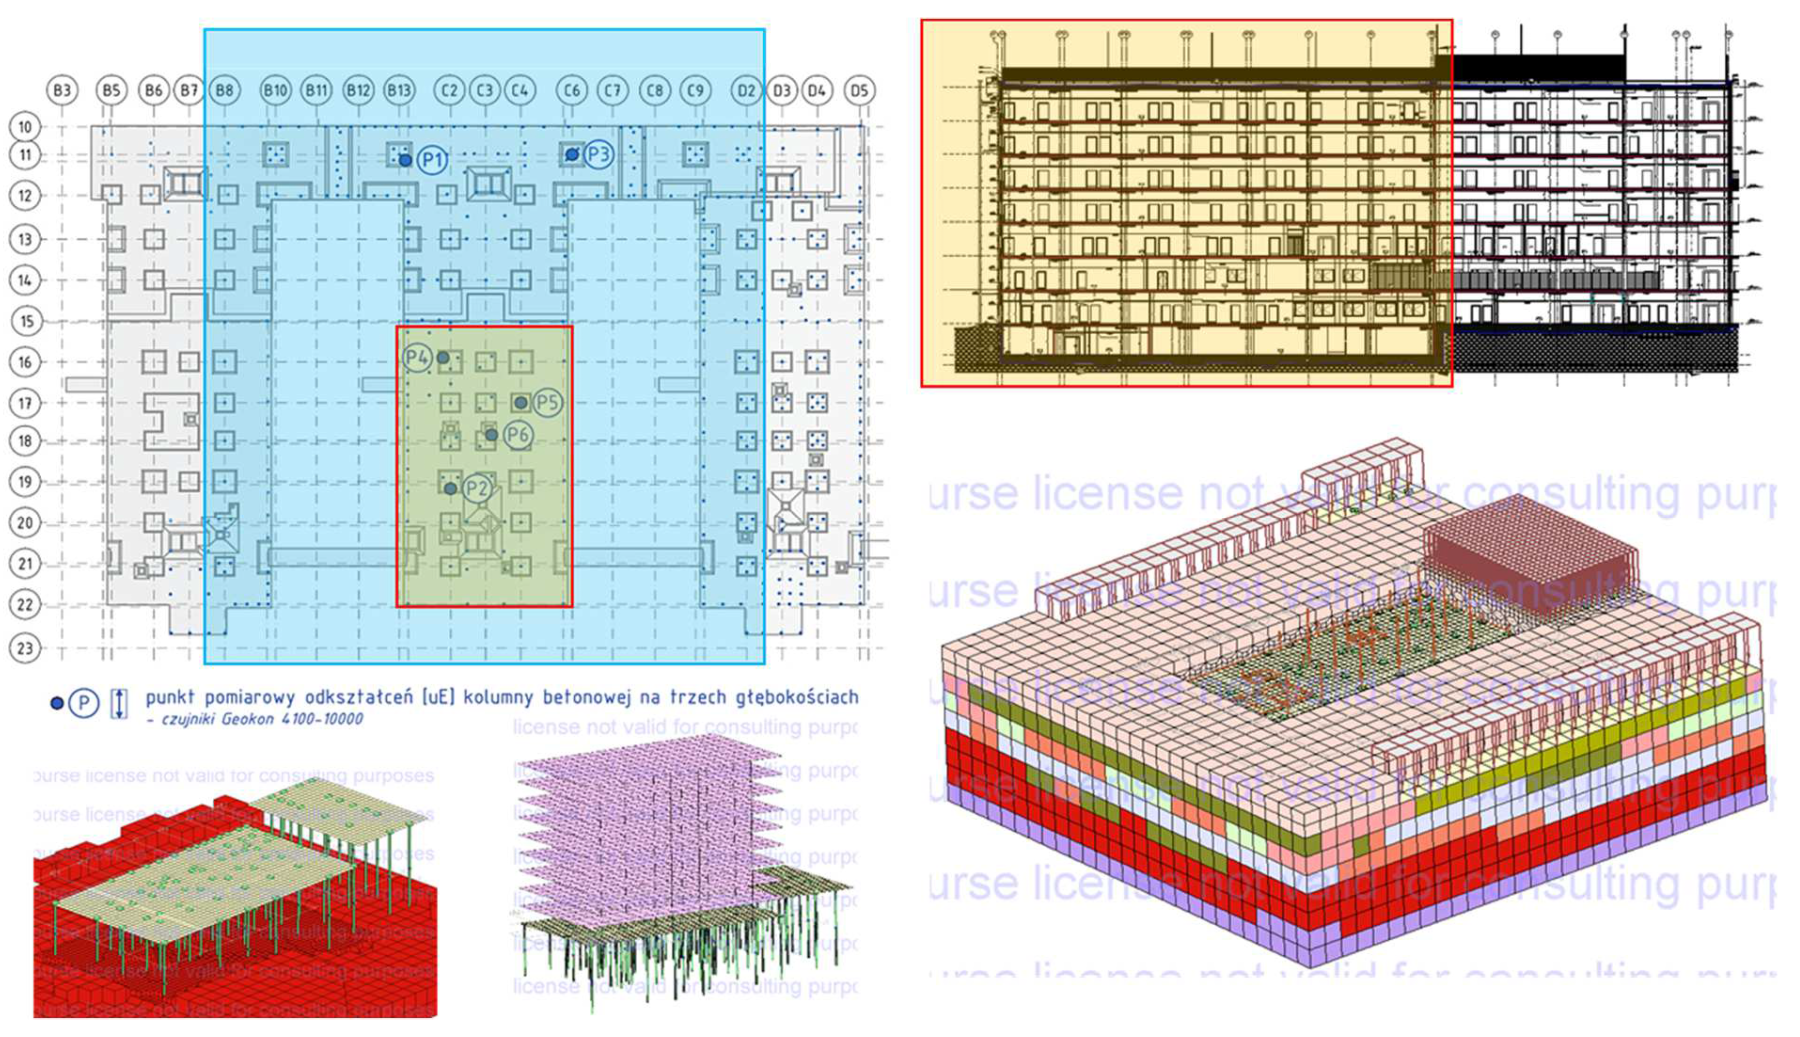
Figure 29.
Load-settlement relationship of the P2 column head. Comparison of actual measurements with FEM simulation (ZSoil P2).
Figure 29.
Load-settlement relationship of the P2 column head. Comparison of actual measurements with FEM simulation (ZSoil P2).
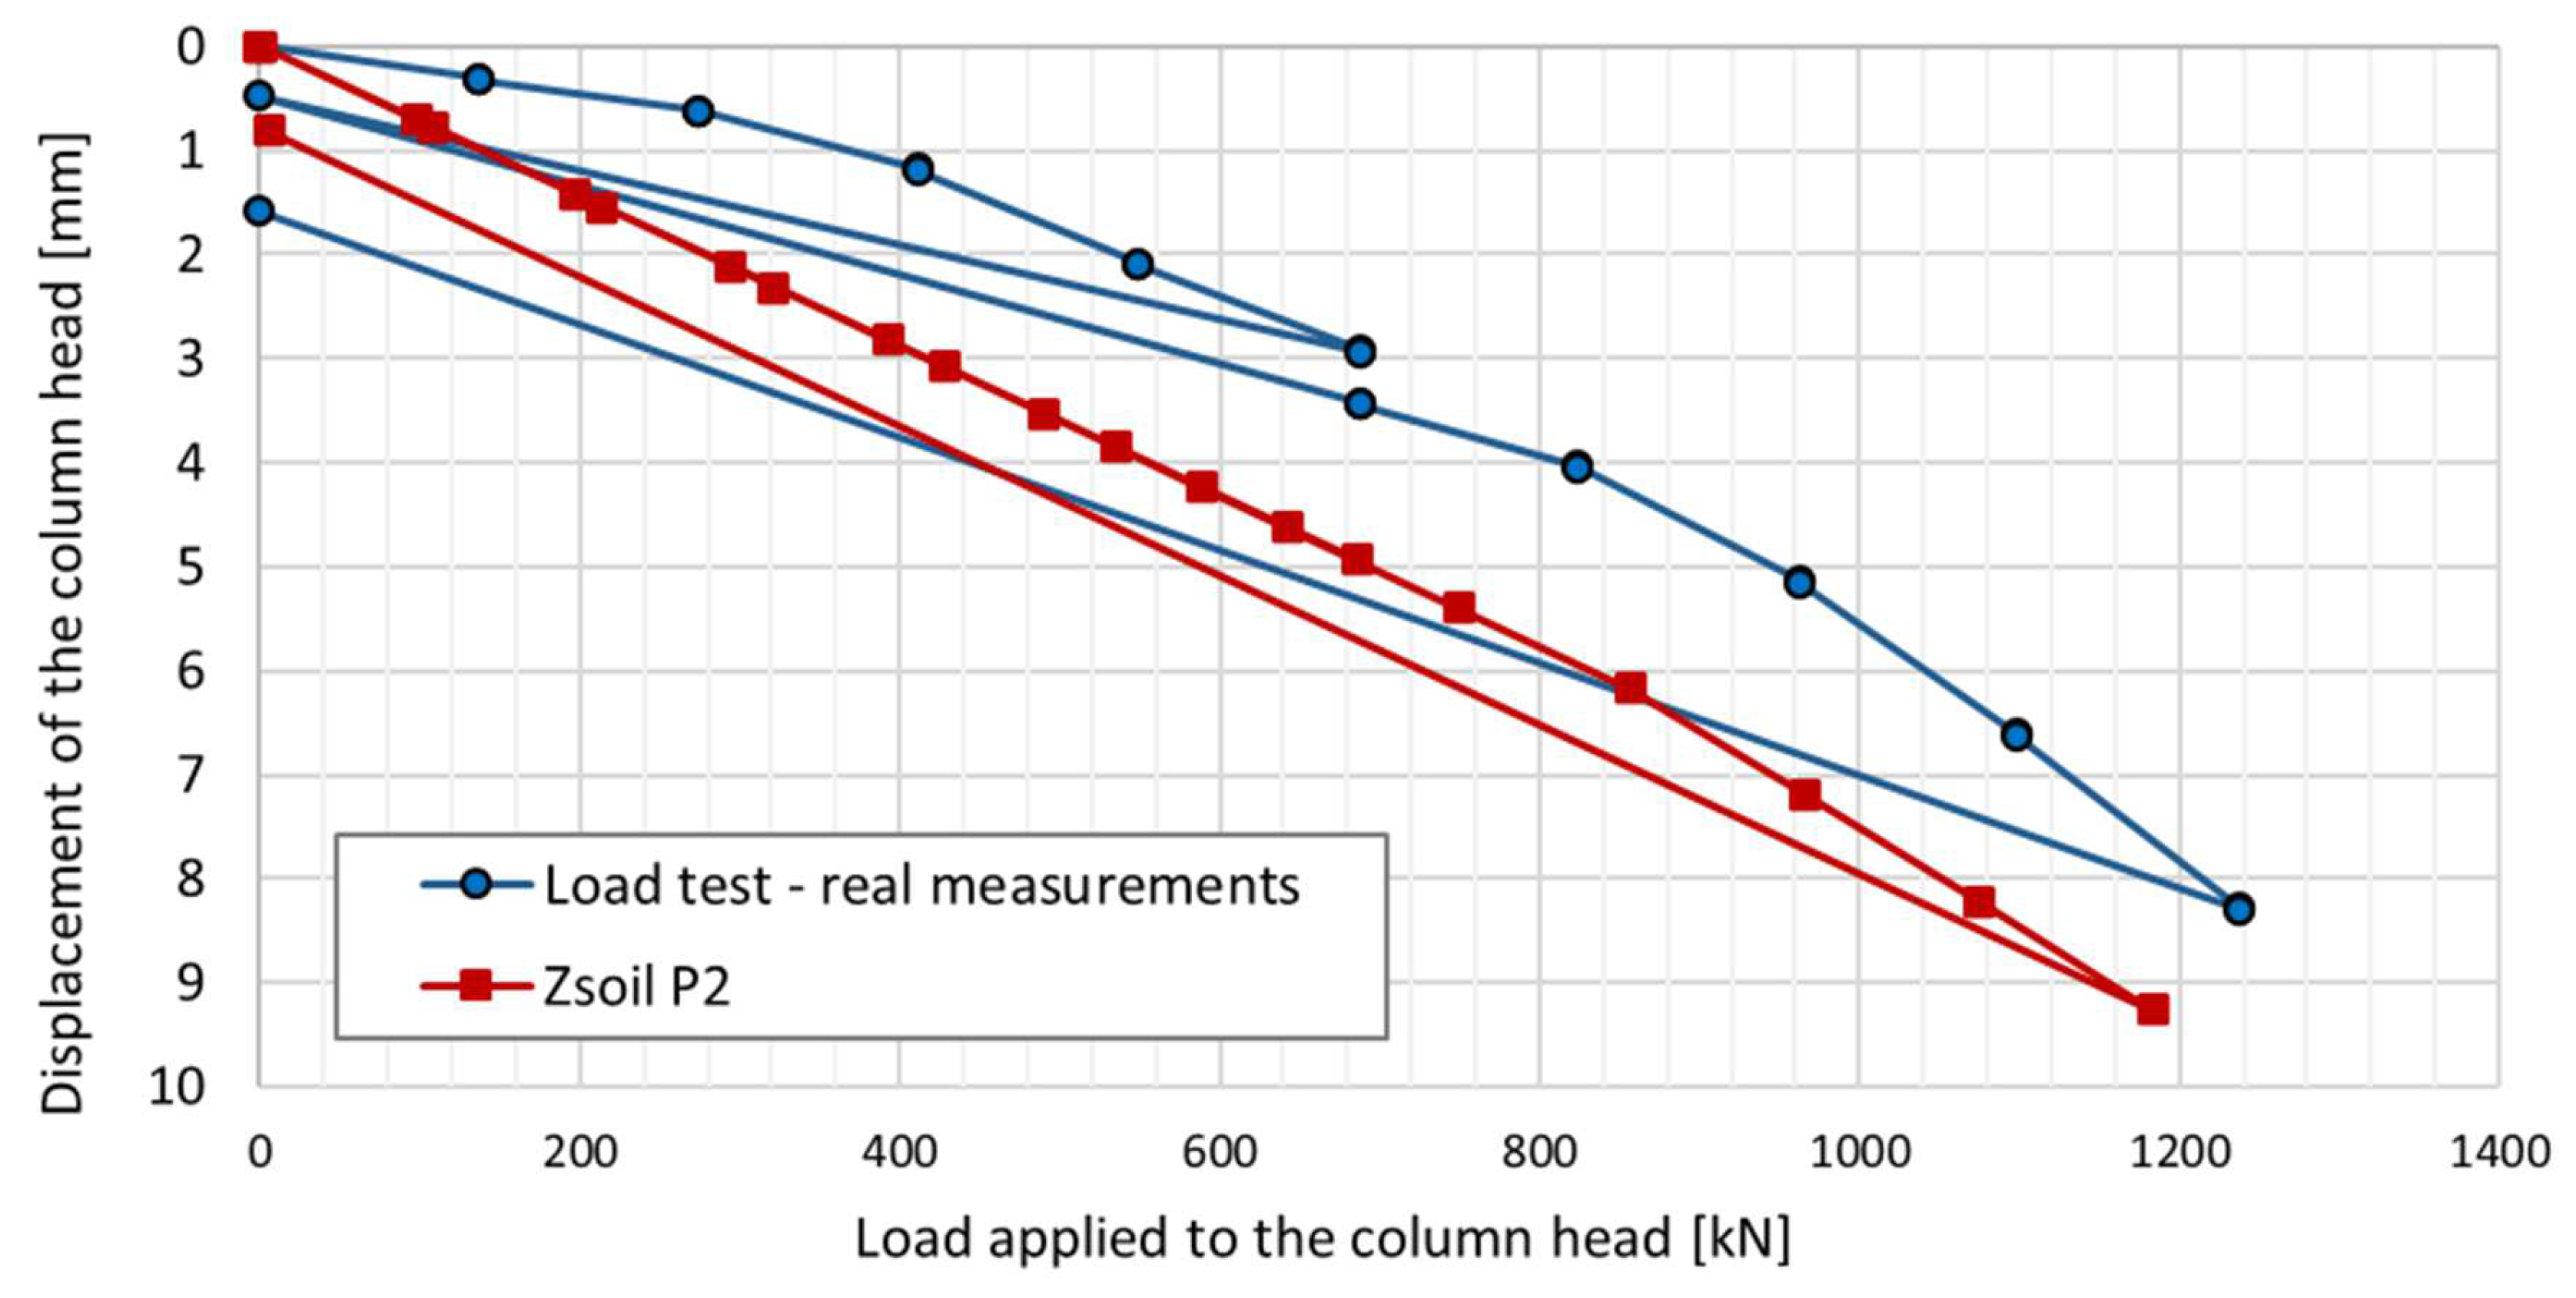
Figure 30.
Comparison of the foundation slab settlements based on the results of A) geodetic monitoring (last measurement from 12/06/2018, identical as on 30/01/2017) and FEM analysis (ZSoil) B) for 60% load and C) for 100% load.
Figure 30.
Comparison of the foundation slab settlements based on the results of A) geodetic monitoring (last measurement from 12/06/2018, identical as on 30/01/2017) and FEM analysis (ZSoil) B) for 60% load and C) for 100% load.
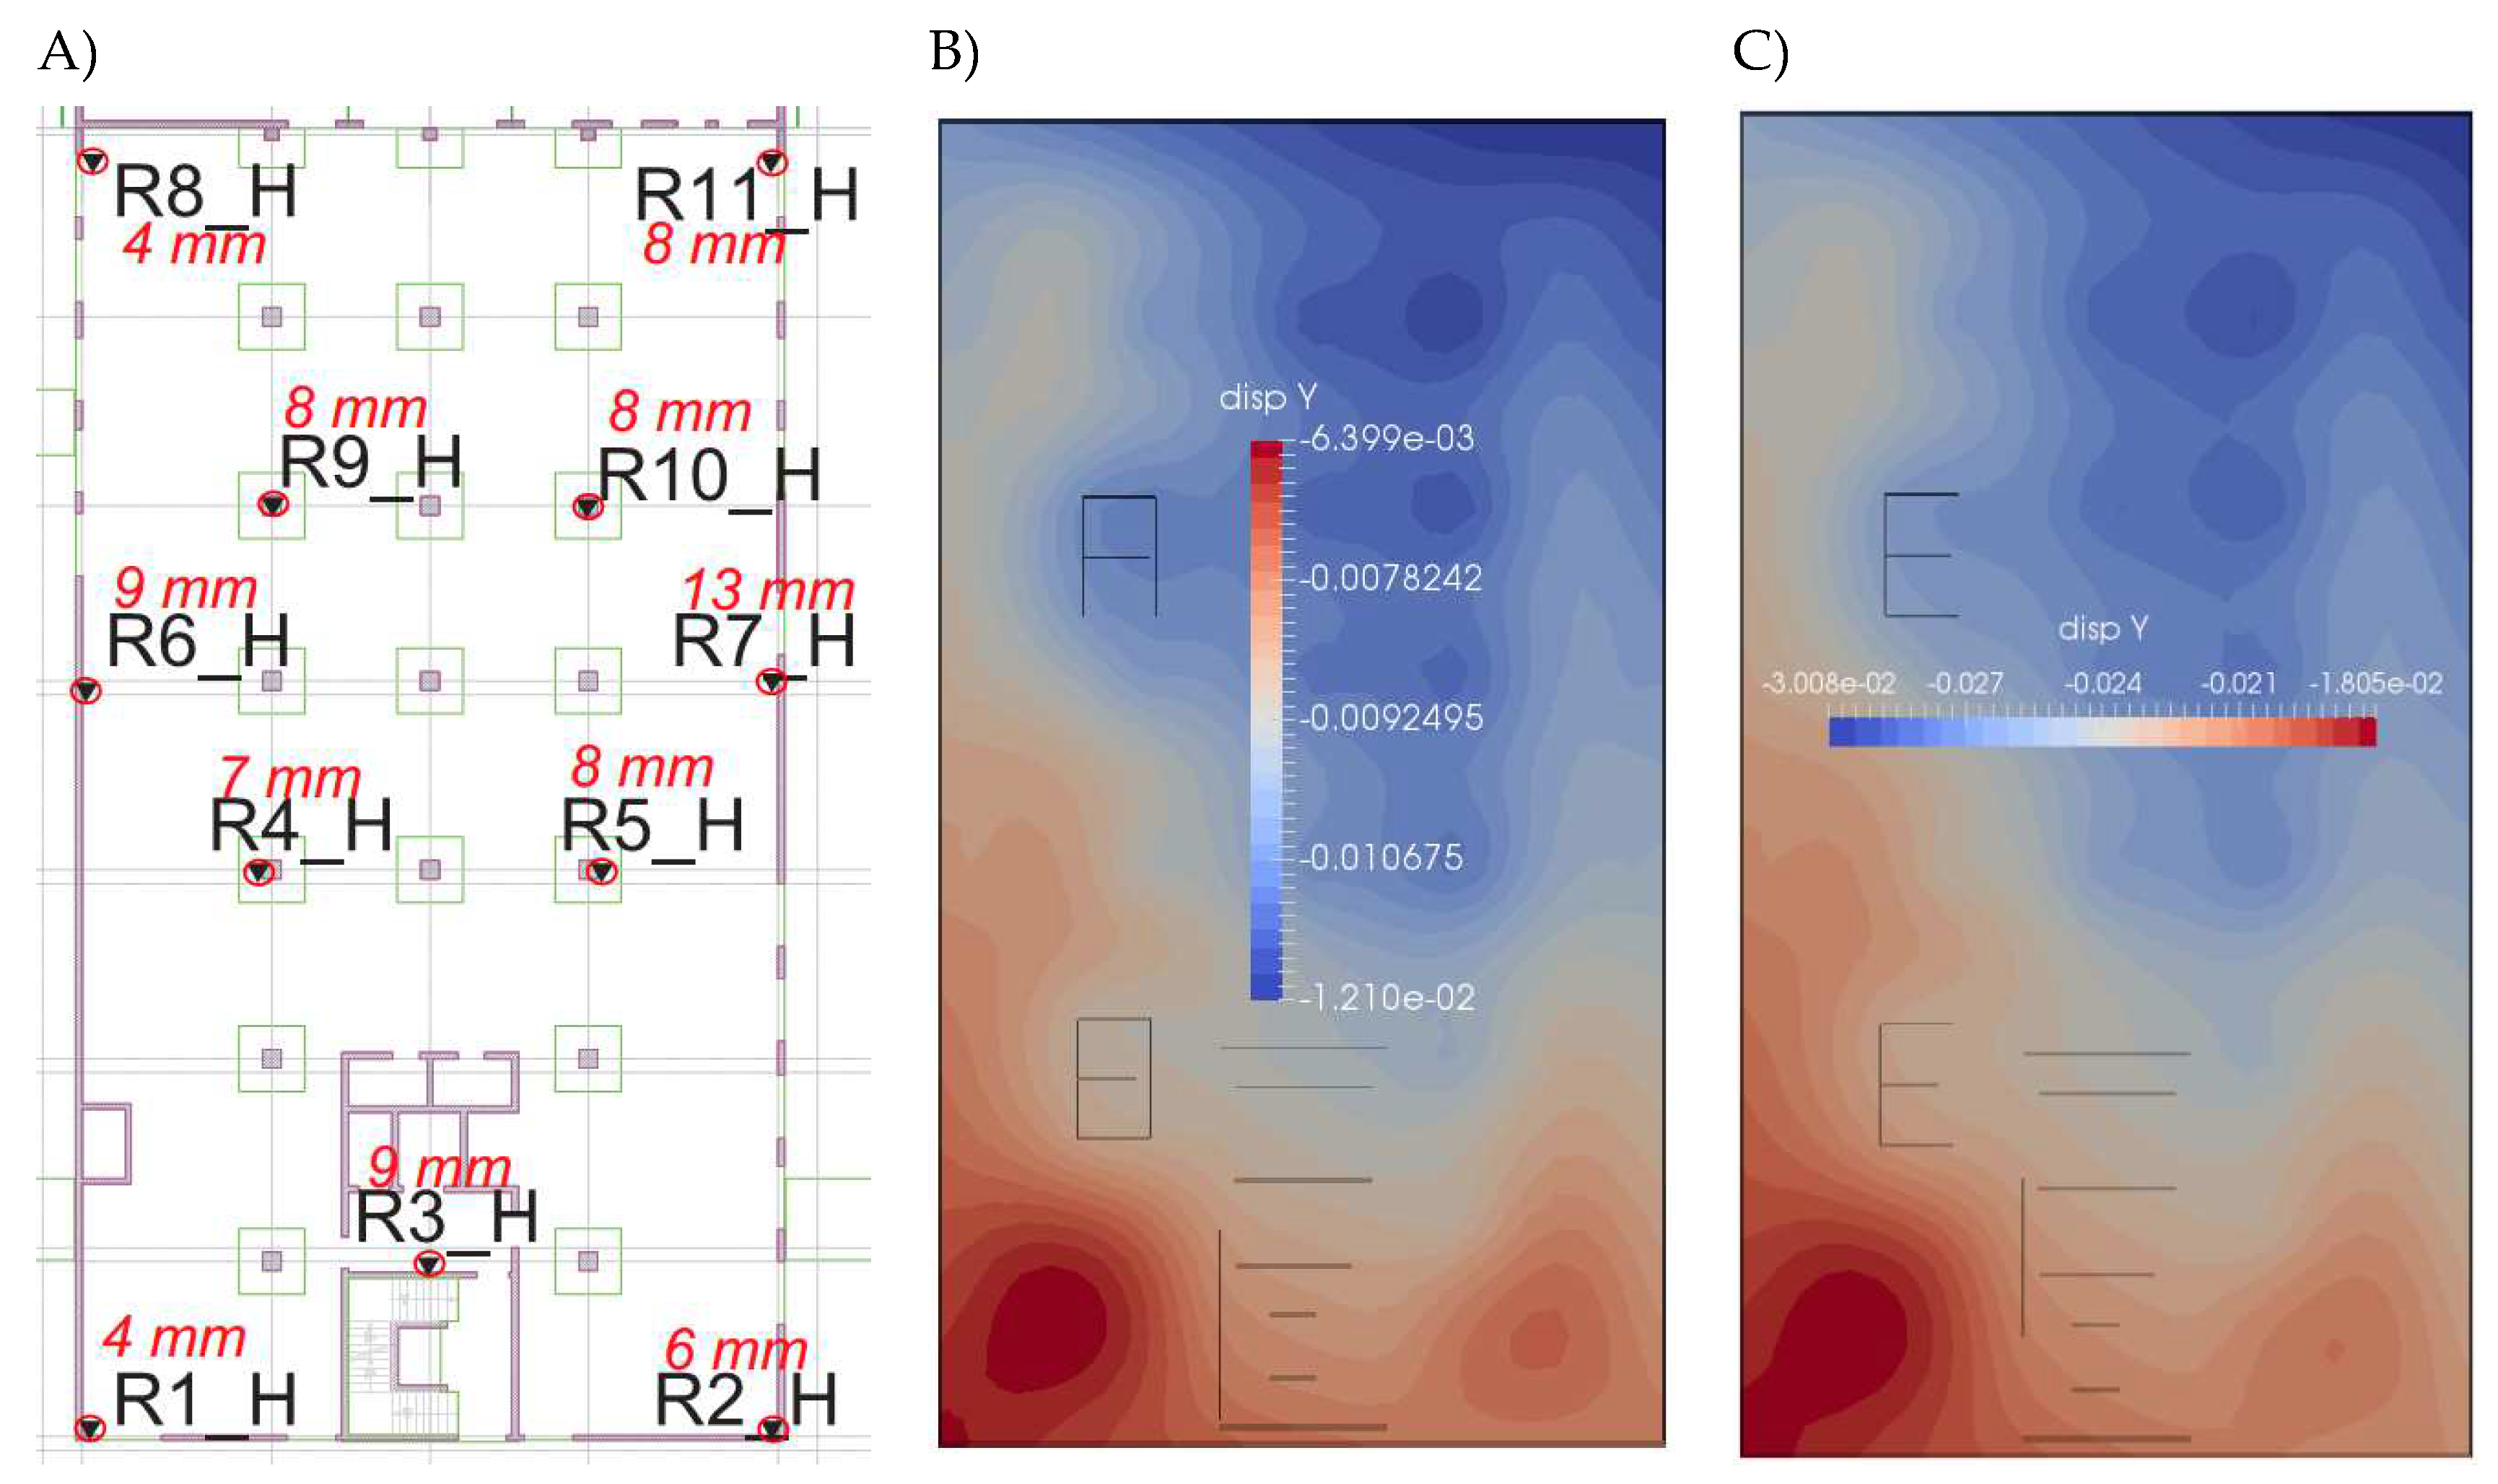
Figure 31.
Change of axial force values as a function of time in column P2 for three depths. Force values estimated from field tests and read after correction from the FEM model (ZSoil).
Figure 31.
Change of axial force values as a function of time in column P2 for three depths. Force values estimated from field tests and read after correction from the FEM model (ZSoil).
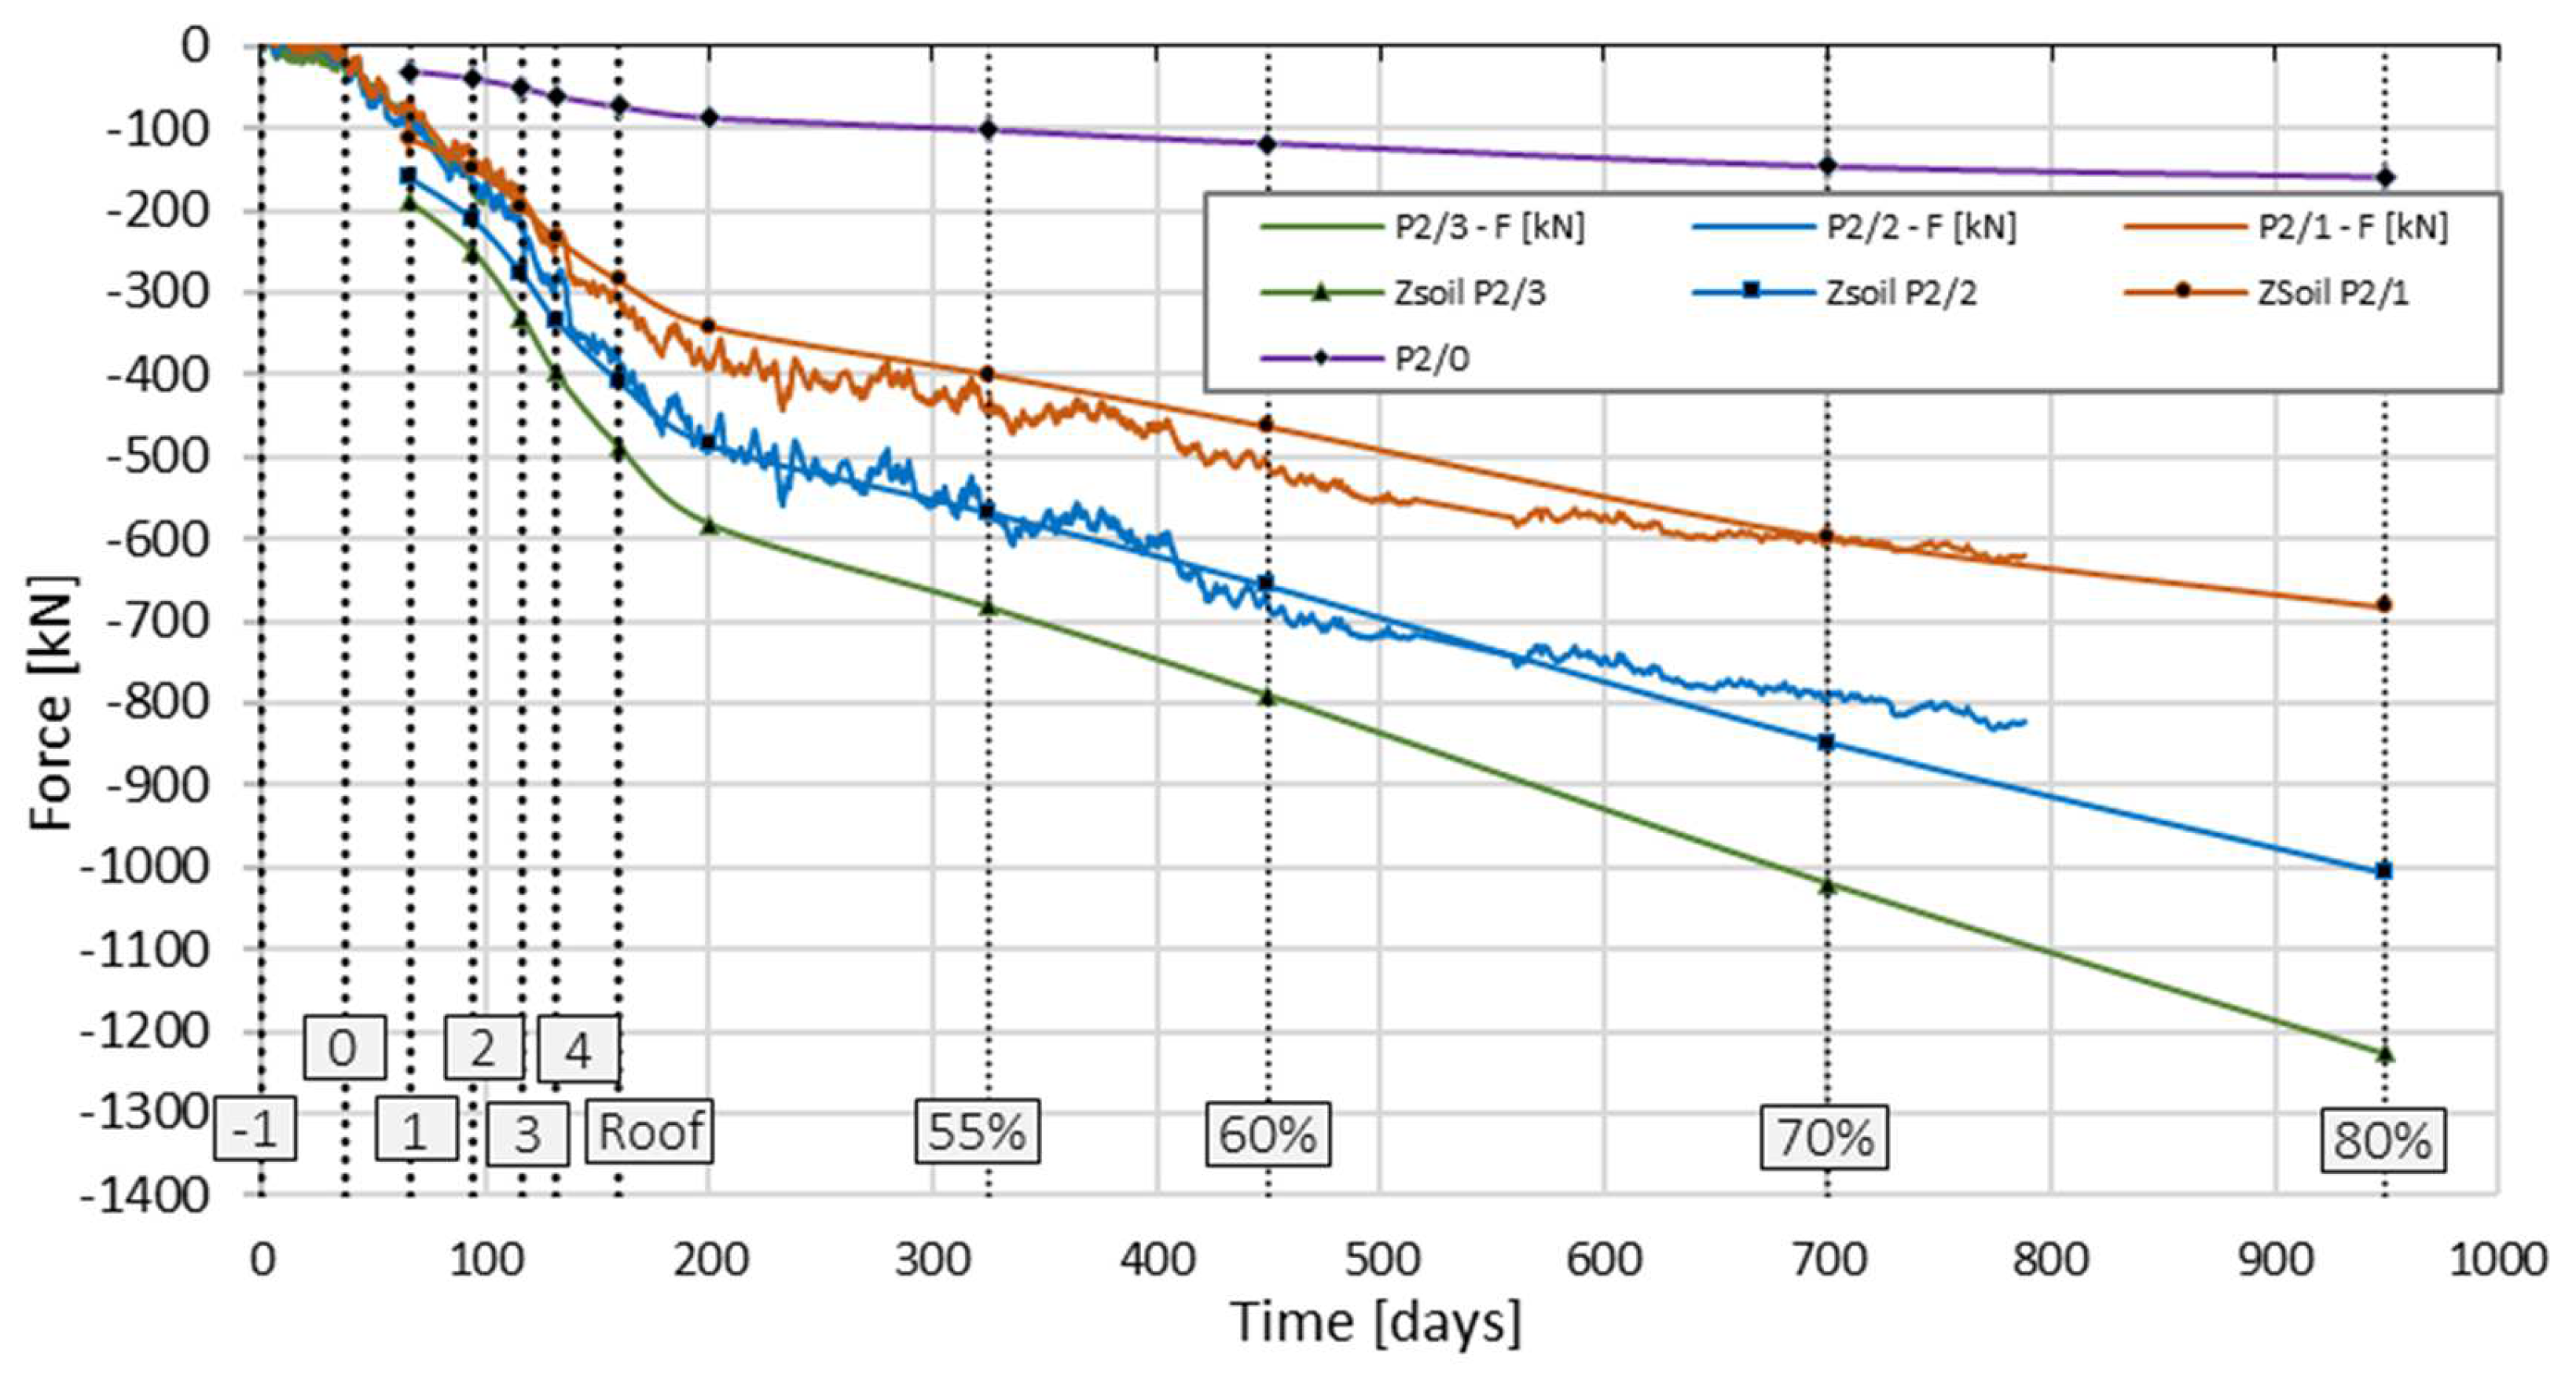
Figure 32.
Load–settlement relationship of the P2 column head (for a column working alone vs. for a column in a slab–pile foundation). Actual measurements from the column test (continuous line, empty circle marker); FEM simulation of the test (ZSoil Test Load P2, dotted line).
Figure 32.
Load–settlement relationship of the P2 column head (for a column working alone vs. for a column in a slab–pile foundation). Actual measurements from the column test (continuous line, empty circle marker); FEM simulation of the test (ZSoil Test Load P2, dotted line).
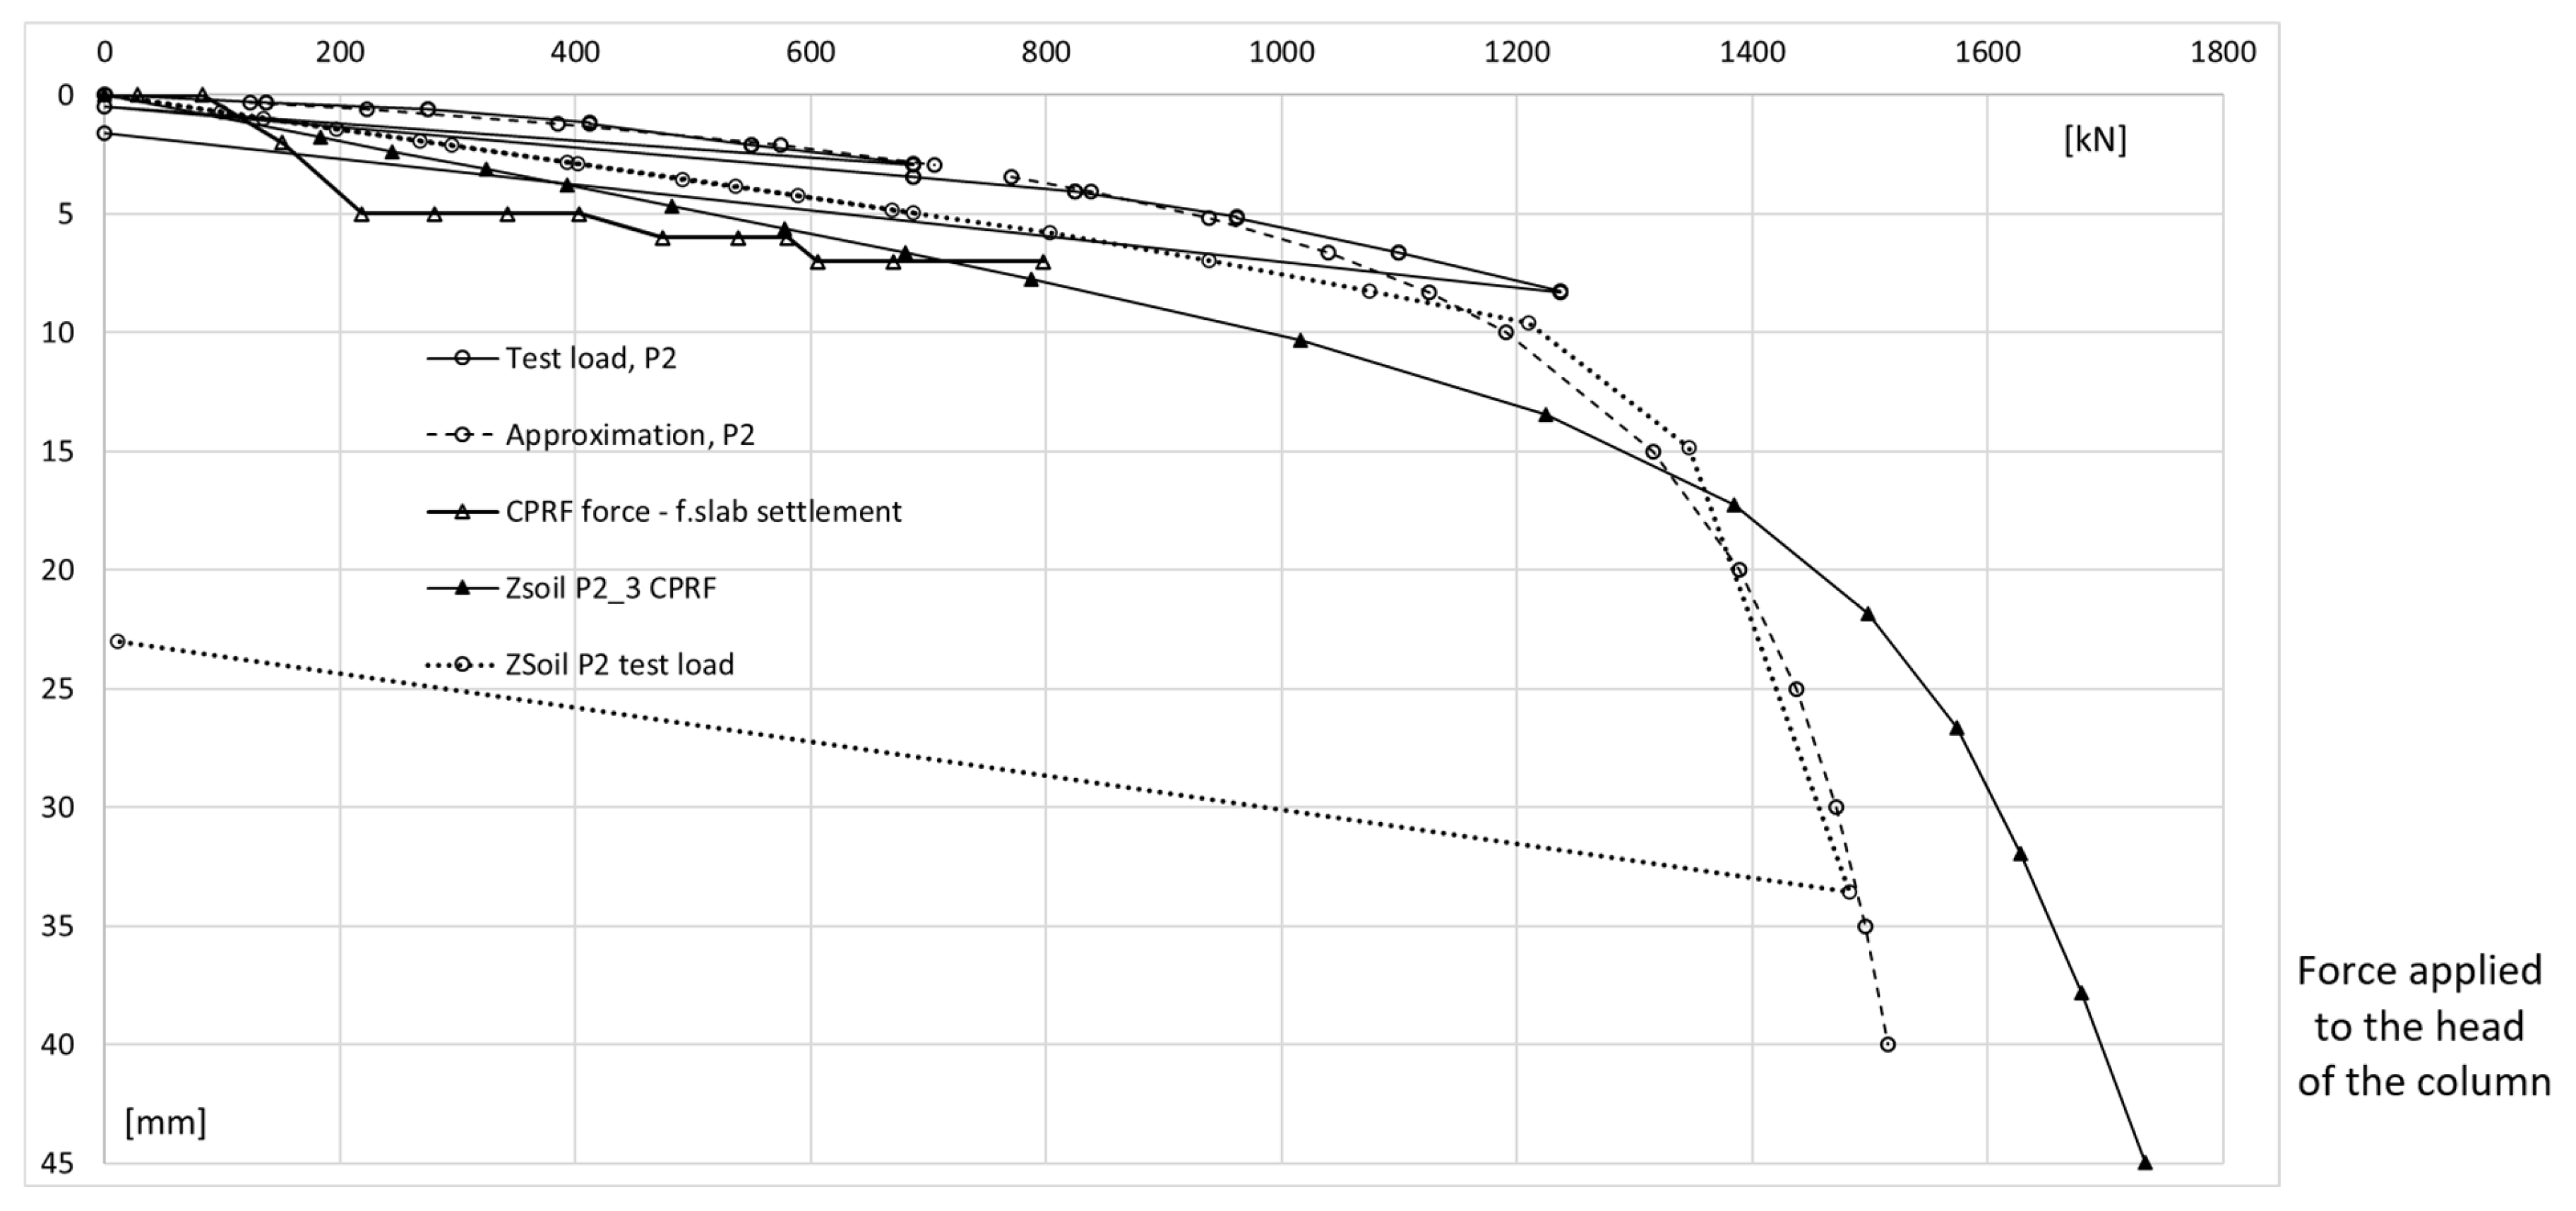
Figure 33.
Distribution of force along column P2 during test load (actual results) and during the construction of the building based on the FEM analysis (ZSoil).
Figure 33.
Distribution of force along column P2 during test load (actual results) and during the construction of the building based on the FEM analysis (ZSoil).
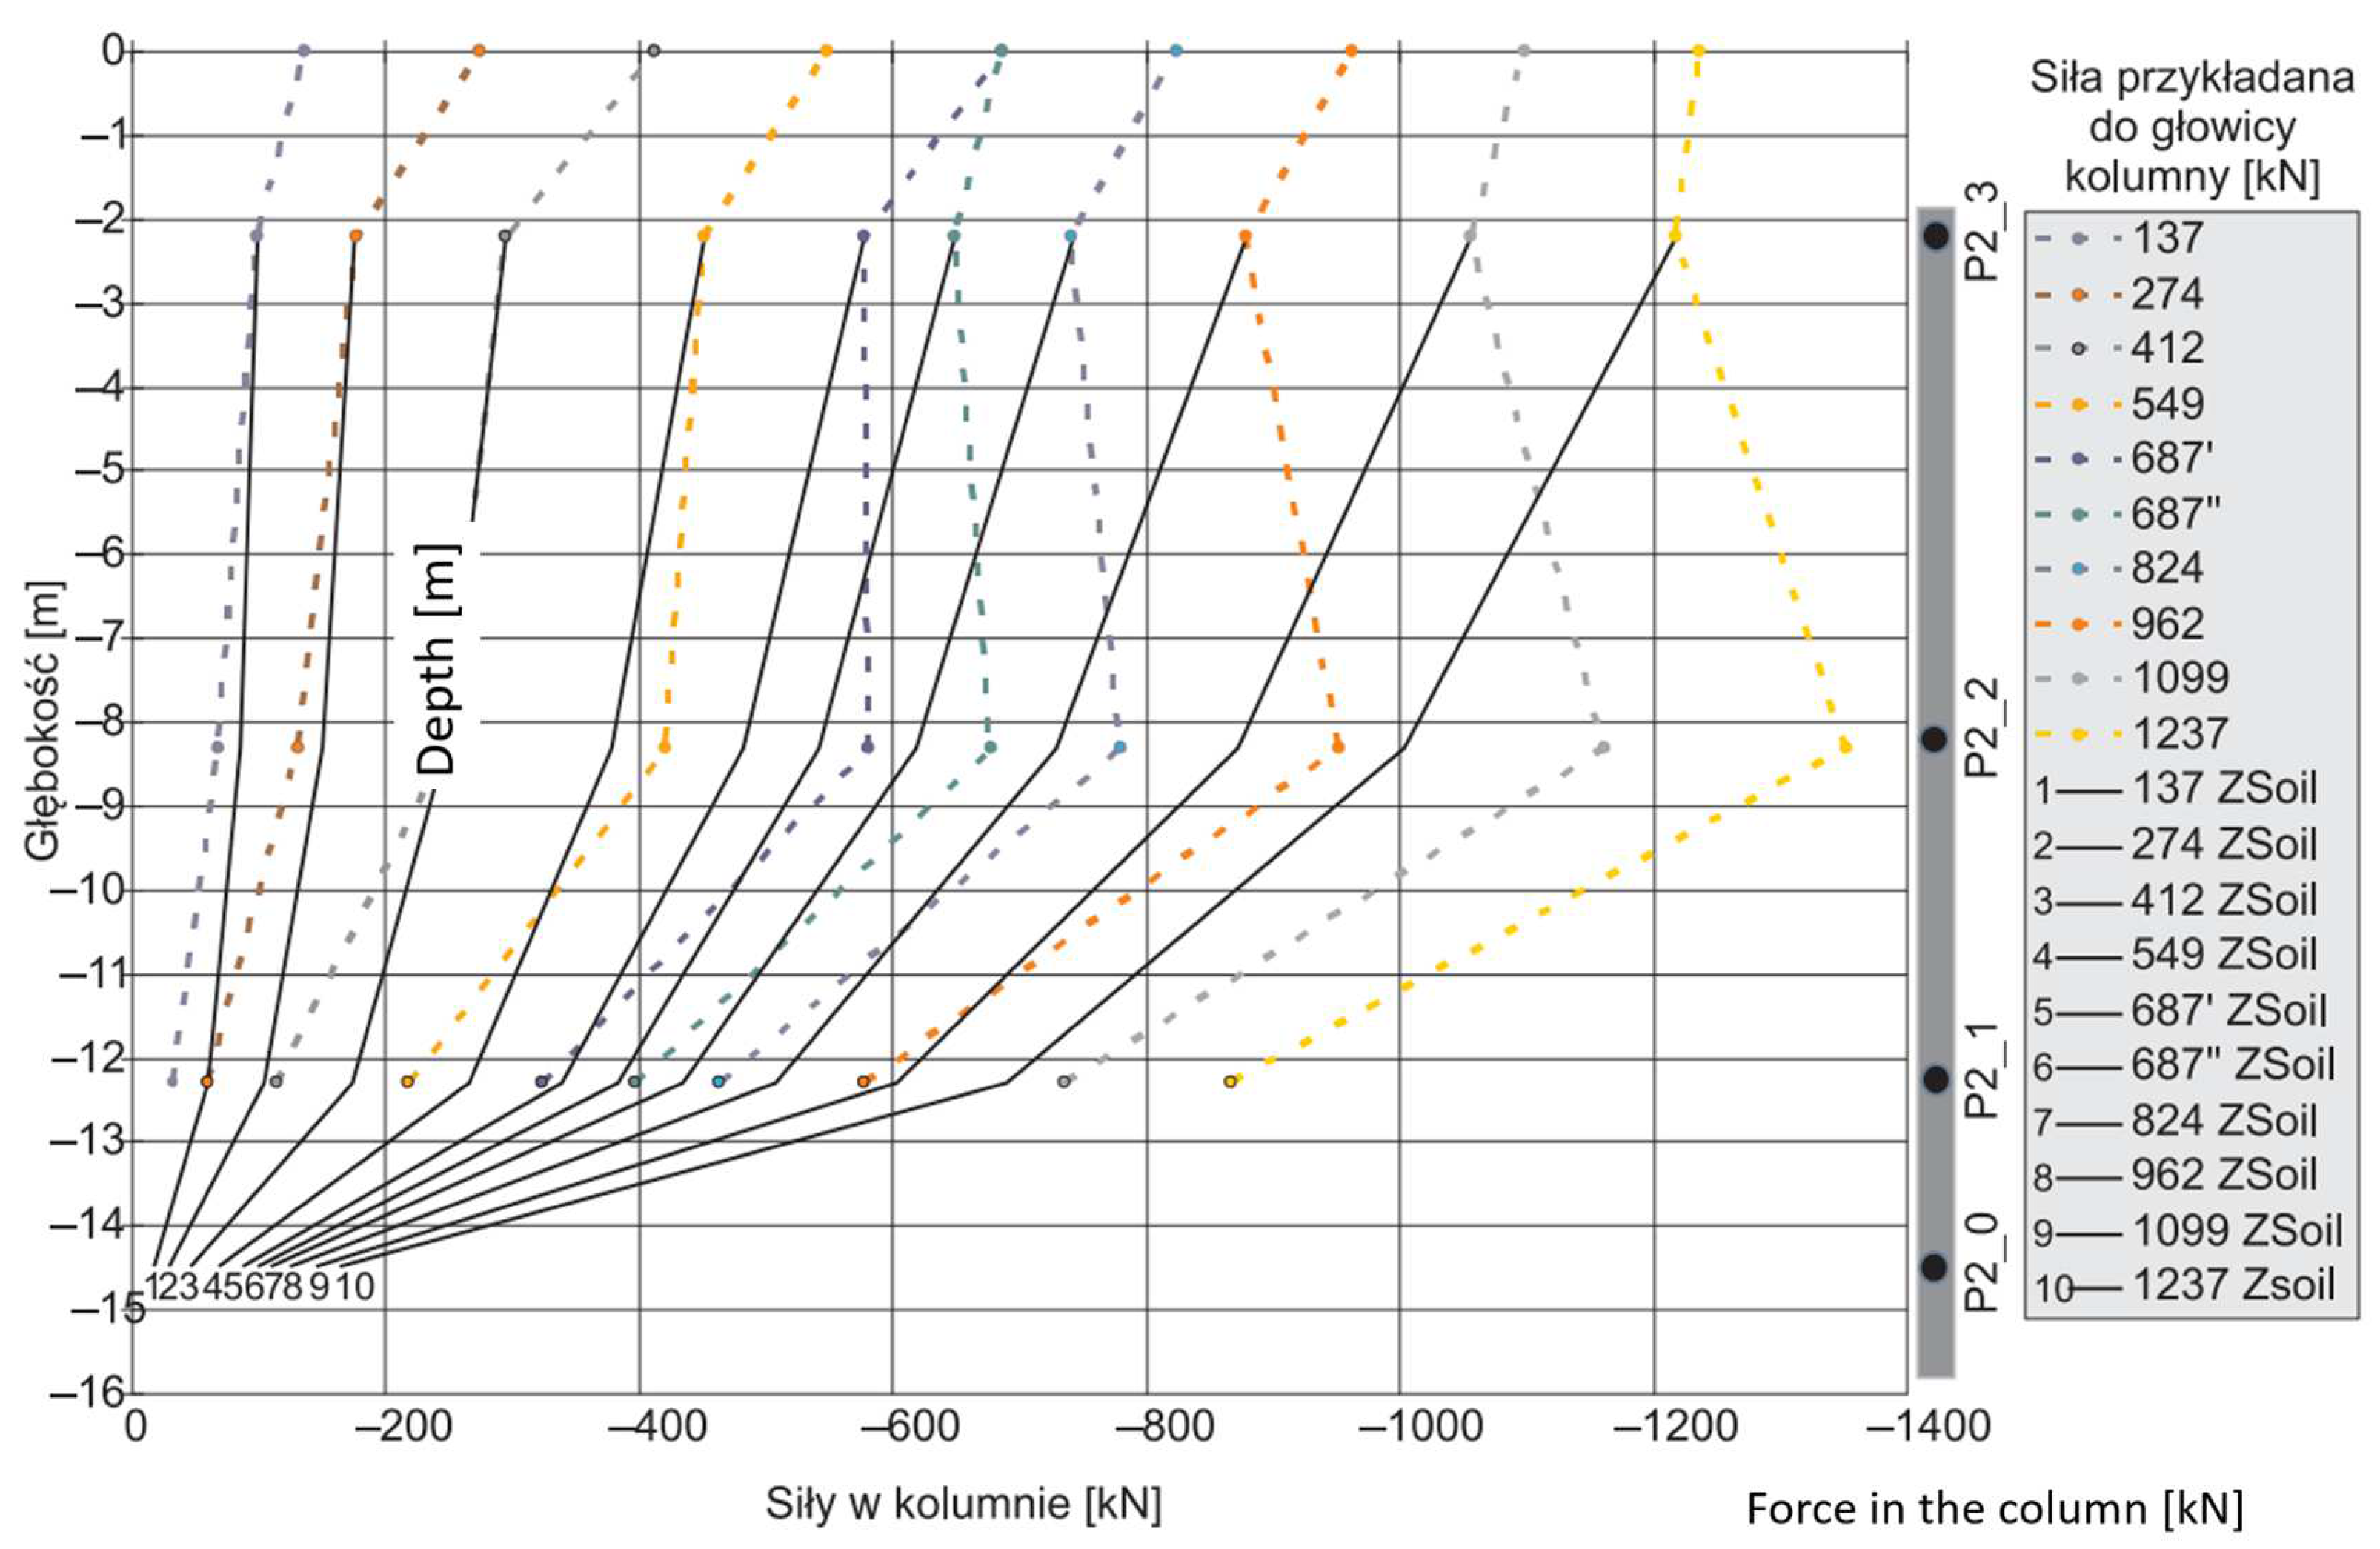

Table 1.
Concreting schedule by the Construction Journal records and an indicative layout of the floors in the analyzed building.
Table 1.
Concreting schedule by the Construction Journal records and an indicative layout of the floors in the analyzed building.
| Time [days] | Start of concreting | Time between stages | % of total load | Stage |  |
| 2016-03-18 | 0 | 0.00 | Foundation slab | ||
| 2016-04-26 | 39 | 0.11 | –2 | ||
| 0 | 2016-05-20 | 24 | 0.16 | Kick-off automatic measurements | |
| 0 | 2016-05-20 | 0 | 0.16 | –1 | |
| 38 | 2016-06-27 | 38 | 0.21 | 0 | |
| 67 | 2016-07-26 | 29 | 0.26 | +1 | |
| 95 | 2016-08-23 | 28 | 0.31 | +2 | |
| 117 | 2016-09-14 | 22 | 0.35 | +3 | |
| 132 | 2016-09-29 | 15 | 0.40 | +4 | |
| 160 | 2016-10-27 | 28 | 0.45 | Roof (R) | |
| 201 | 2016-11-24 | 41 | 0.50 | Contractual completion of the shell stage |
Table 2.
Technical parameters of the Geokon 4800 pressure sensor.
| Transducer type | String |
|---|---|
| Measurement range | 170 kPa |
| Overload | 150% range |
| Resolution | ± 0.025 % of range |
| Accuracy | ± 0.1% of range |
| Linearity | < 0.5 % of range |
| Chamber dimensions | 6 mm×230 mm |
| Transducer dimensions | 150 mm×25 mm |
| Material | Stainless steel |
| Temperature range | -20 to + 80ÿC |
Table 3.
Technical parameters of the Geokon 4100 strain sensor.
| Sensor type | String |
|---|---|
| Measurement range | 9,000 µe |
| Resolution | 0.4 µe |
| Accuracy | ±0.1% of range |
| Linearity | <0.5% of range |
| Temperature range | 20 to + 80°C |
| Active sensor length | 51mm |
| Soil layer | |||||||||
|---|---|---|---|---|---|---|---|---|---|
| Parameter | IIb | IIIb | IVa | IVb | IVc | IVd | Va | VI | W |
| E0ref (kPa) | 408000 | 276000 | 312000 | 120000 | 252000 | 336000 | 168000 | 516000 | 500000 |
| γ0,7 (×l0-4) | 1.61 | 2.28 | 1.63 | 1.68 | 2.14 | 1.82 | 4.50 | 1.43 | 1.43 |
| Eurref (kPa) | 90000 | 60000 | 75000 | 20000 | 50000 | 70000 | 32000 | 110000 | 110000 |
| E50ref (kPa) | 27000 | 16000 | 25000 | 6000 | 13000 | 22000 | 10000 | 35000 | 35000 |
| σref (kPa) | 80 | 99 | 86.8 | 59.4 | 104.5 | 110.5 | 135 | 112.5 | 100 |
| m (-) | 0.5 | 0.6 | 0.5 | 0.55 | 0.6 | 0.6 | 0.75 | 0.5 | 0.5 |
| vur (-) | 0.2 | 0.2 | 0.2 | 0.2 | 0.2 | 0.2 | 0.2 | 0.2 | 0.2 |
| Rf (-) | 0.9 | 0.9 | 0.9 | 0.9 | 0.9 | 0.9 | 0.9 | 0.9 | 0.9 |
| c’ (kPa) | 0 | 2 | 0 | 0.5 | 4 | 5 | 6.5 | 0 | 0 |
| φ’ (°) | 39 | 35 | 36 | 32 | 34 | 36 | 23 | 41 | 41 |
| ψ (°) | 7 | 6 | 5 | 2 | 6 | 2 | 0 | 10 | 10 |
| emax (-) | 0.85 | 1.2 | 0.85 | 2.2 | 1.4 | 1.2 | 2.0 | 0.85 | 0.85 |
| ft (kPa) | 0 | 0 | 0 | 0 | 0 | 0 | 0 | 0 | 0 |
| D (-) | 0.25 | 0.25 | 0.25 | 0.25 | 0.25 | 0.25 | 0.25 | 0.25 | 0.25 |
| Eoedref (kPa) | 27000 | 16000 | 25000 | 6000 | 13000 | 70000 | 10000 | 35000 | 35000 |
| σoedref (kPa) | 216.2 | 232.4 | 266.3 | 126.3 | 237.0 | 268.3 | 221.0 | 331.0 | 294.1 |
| K0NC (-) | 0.37 | 0.426 | 0.41 | 0.47 | 0.44 | 0.41 | 0.61 | 0.34 | 0.34 |
| qPOP (kPa) | 200 | 200 | 200 | 200 | 200 | 200 | 200 | 200 | 30 |
| K0SR (-) | 0.37 | 0.426 | 0.41 | 0.47 | 0.44 | 0.41 | 0.61 | 0.34 | 0.34 |
| K0 (-) | 2 | 1.5 | 0.78 | 0.9 | 0.95 | 0.85 | 1.5 | 0.75 | 0.5 |
Disclaimer/Publisher’s Note: The statements, opinions and data contained in all publications are solely those of the individual author(s) and contributor(s) and not of MDPI and/or the editor(s). MDPI and/or the editor(s) disclaim responsibility for any injury to people or property resulting from any ideas, methods, instructions or products referred to in the content. |
© 2025 by the authors. Licensee MDPI, Basel, Switzerland. This article is an open access article distributed under the terms and conditions of the Creative Commons Attribution (CC BY) license (http://creativecommons.org/licenses/by/4.0/).
Copyright: This open access article is published under a Creative Commons CC BY 4.0 license, which permit the free download, distribution, and reuse, provided that the author and preprint are cited in any reuse.


