
Submitted:
31 March 2025
Posted:
02 April 2025
You are already at the latest version
Abstract
This study examined the effects of farming system (intensive vs. extensive) and lactation stage on the physicochemical characteristics, SCC, TBC, and mineral content of Skopelos goat milk over two years. The intensive system exhibited significantly higher milk yield (0.98 kg/day) than the extensive system (0.85 kg/day; p < 0.01). However, extensive farming resulted in higher protein (3.57% vs. 3.47%; p < 0.001) and casein content (2.72% vs. 2.57%; p < 0.001), beneficial for cheese production. Fat content was unaffected by farming system but peaked in mid-lactation (4.83%; p < 0.05). Lactose declined from 4.74% in early lactation to 4.42% in late lactation (p < 0.001). SCC and TBC were significantly higher in extensive systems (p < 0.001), likely due to hand-milking and other environmental factors. Mineral levels varied, with Mg (149.80 vs. 143.57 mg/kg) and Fe (0.42 vs. 0.36 mg/kg) being higher in extensive systems (p < 0.001), while Ca was unaffected by farming system but declined in mid-lactation (p < 0.001). While extensive farming systems offer some benefits in protein and casein content, the overall differences in milk composition were not substantial. The presumed superiority of extensive systems should be re-evaluated, considering hygiene concerns. A balanced approach is needed to optimize production, quality, and sustainability.
Keywords:
goat milk
; farming system
; lactation stage
; milk composition
; mineral content
; Skopelos goat breed
1. Introduction
Dairy goats play a crucial role in global milk production, and especially in the Mediterranean, where they contribute significantly to local economies and food security [1]. Over the past few decades, these sectors have undergone substantial transformations, with a growing emphasis on sustainable and agroecological production systems [2]. In key dairy-producing countries such as Greece, Italy, and Spain, goat farming systems range from small-scale traditional operations to intensive commercial farms, reflecting the diversity of management approaches and economic strategies within the sector [1]. In Greece, dairy goat farming is predominantly characterized by semi-extensive systems adapted to mountainous and semi-mountainous landscapes. These systems are based on traditional grazing practices that optimize the use of natural resources, making them an essential component of sustainable rural development [3].
The growing interest in goat dairy products, particularly cheese, has been influenced by evolving farming practices that impact both the intrinsic and extrinsic characteristics of milk quality, as well as consumer perception [4]. Goat milk has gained popularity due to its unique nutritional profile and potential health benefits. Its composition closely resembles human breast milk, making it a viable alternative for individuals with cow milk allergies [5]. Compared to cow milk, goat milk typically contains higher levels of fat, protein, and ash but less lactose, making it easier to digest for lactose-intolerant individuals [6]. Moreover, it is rich in essential fatty acids, such as omega-3 and conjugated linoleic acid, particularly when goats are raised on pasture-based systems [7]. However, milk quality is influenced by various factors, including breed, health status, lactation stage, and management practices [8,9]. The physicochemical and microbiological properties of goat milk are crucial in determining its suitability for dairy processing and human consumption [10].
Among the key factors affecting milk quality, the farming system plays a significant role. Research indicates that organic and grazing-based systems produce milk with higher levels of unsaturated fatty acids and lower saturated fat content compared to conventional intensive systems [11]. Additionally, grazing systems have been associated with improved milk composition, including higher fat, protein, and total solids (TS) content, as well as enhanced nutritional indices [12]. However, the overall impact of farming systems on milk composition is influenced by management practices, including nutrition, breed selection, and milking techniques [13,14]. Furthermore, extensive farming systems have been linked to lower rates of intramammary infections compared to intensive systems, although this relationship is not always consistent across different studies [4,15].
While numerous studies have examined the effects of farming systems on milk composition, limited research has investigated the combined influence of farming systems and lactation stage in goats of the same breed, particularly in commercial settings. Additionally, the genetic relatedness between intensively and extensively raised goats is often overlooked, despite its potential to provide valuable insights into milk quality variations.
In this study, we examine the effect of farming system and lactation stage on goat milk composition, utilizing a unique dataset in which all goats in the intensive system originated from an extensive farm. This genetic connection strengthens the validity of our findings and enhances our understanding of the interplay between production methods and milk quality in dairy goats. The objective of this study was to evaluate the combined effects of farming systems (intensive vs. extensive) and lactation stage over two years on the chemical and physical characteristics, somatic cell count (SCC), and mineral content of goat milk from two commercial farms rearing the Skopelos goat breed.
2. Materials and Methods
2.1. Farms and Animals
The study was conducted from February 2022 to August 2023 on two goat farms in Greece: one extensive on the island of Skopelos (latitude 39.09°, longitude 23.73°) and one intensive in the Attica region (latitude 37.95°, longitude 23.95°). The farms were classified as ’extensive’ or ’intensive’ based on differences in input utilization, including farm characteristics, management practices, labor force, and infrastructure.
Two hundred thirty-seven goats were randomly selected for the study, including 132 from an extensive farming system and 105 from an intensive farming system. All goats were in their 2nd or 3rd lactation and had similar parturition dates. The goats belonged to the Skopelos breed, an indigenous Greek breed known for its adaptation to dry and hot climates. The annual milk yield for the Skopelos breed ranges from 250 to 450 kg per 210-day lactation, with prolificacy ranging from 1.2 to 1.6 kids per doe.
Extensively reared goats were kept indoors at night in permanent sheds with ventilation openings, adequate floor space per animal, and floors that can absorb humidity and rainwater. Goats were hand-milked, and grazed on natural grasslands, shrublands, and cultivated pastures throughout the year. During the winter period, when pasture availability decreased, the goats received 0.5 to 1.0 kilograms per day of supplementary concentrated feed and 0.0 to 0.5 kg of alfalfa hay. In contrast, the intensively reared goats had no access to grazing and were kept in a permanent, well-ventilated stable with controlled temperature and humidity, and straw bedding on the floor. These goats were fed 1.0 to 1.2 kilograms per day of commercial concentrated feed mixtures and 0.9 to 1.8 kilograms per day of alfalfa hay. The intensive farm was equipped with a 2 × 24 parallel milking parlor and ample feed storage facilities. There was genetic relatedness between the animals, as all the goats in the intensive farm originated from the other farm on Skopelos Island.
2.2. Milk Sample Collection
Milk samples were collected during the morning milking (am_MY) from the same individual goats across two consecutive years. In each lactation period, sampling began in February, approximately 80 days postpartum, and continued at 45-day intervals until the end of the lactation in August. Each sampling corresponded to a specific lactation stage (LS), which was divided into four: the 1st stage (days in milk, (DIM), 80 days), the 2nd stage (DIM 125 days), the 3rd stage (DIM 145 days), and the 4th stage (DIM 215 days). To ensure accuracy and consistency, this process was carried out by trained personnel, including animal scientists and veterinarians.
Milk samples were collected in 50 mL screw-capped flasks, cooled to 4–6°C with ice packs, and transported to the laboratory in isothermal containers for analysis within 24 hours. Over the two lactation periods, a total of 1,828 milk samples from the two farms were collected and analyzed for chemical composition (fat, protein, lactose, total solid (TS) and casein (Cas) content), physical characteristics (pH, electrical conductivity (EC), refractive index (RI) and Brix value), somatic cell count (SCC), and total bacterial count (TBC). To preserve the samples for TBC analysis, sodium azide (0.01 g/100 mL) was added as a preservative.
Additionally, throughout the two years, 200 milk samples from 25 goats per farm, collected during the 1st and 3rd lactation stages, were analyzed for mineral content (calcium (Ca), magnesium (Mg), iron (Fe), zinc (Zn), and phosphorus (P)). These samples were also placed in isothermal containers, transported to the laboratory, and stored frozen for the analysis.
2.3. Milk Chemical Composition, Milk Physical Properties, SCC and TBC
The milk samples were allowed to reach room temperature and then placed in a heated water bath. After that, they were thoroughly mixed by gently inverting the sample container multiple times, ensuring no frothing occurred.
Chemical composition analysis was conducted using the Foss MilkoScan FT-plus fully automatic milk FTIR analyser (Foss Electric A/S, Hillerød, Denmark) following the ISO/IDF method [16]. Milk pH was measured with a portable pH/conductivity meter SG23-FIELD-KIT2 (51302602) (Mettler Toledo, Schwerzenbach, Switzerland) using an electrode equipped with a built-in temperature sensor (pH InLab® Expert-Go-ISM (IP67), 1.8 m cable, Schwerzenbach, Switzerland). The pH meter was calibrated using standard pH 4.0 and 7.0 buffer solutions, following the manufacturer’s guidelines. The EC of the milk samples was also assessed with a pH/conductivity meter SG23-FIELD-KIT2 (51302602) (Mettler Toledo, Schwerzenbach, Switzerland) and an In-Lab®738-ISM (IP67), 1.8 m cable, electrode, which was calibrated with buffer solutions of 147 µS/cm, 1413 µS/cm, and 12.88 mS/cm. The RI and Brix value were measured using a digital hand-held refractometer PAL- BX.RI (ATAGO CO., LTD, Tokyo, Japan) set to 20°C.
SCC and TBC were determined using a Fossomatic 5000 instrument and a BactoScan FC150 analyzer, respectively, developed by Foss Electric (Hillerød, Denmark). The data obtained were transformed into logarithmic forms to normalize their frequency distribution before performing statistical analysis.
2.4. Statistical Analysis
Principal Component Analysis (PCA) was performed to identify potential relationships among milk composition variables and reduce the dataset’s dimensionality while preserving the maximum variance. PCA was performed in R (version 4.4.2; R Foundation for Statistical Computing, Vienna, Austria) [19] using the FactoMineR package for computation and the factoextra package for visualization [20,21].
Before PCA, the dataset was standardized (mean-centered and scaled to unit variance) to ensure comparability among variables with different units. The eigenvalues and screen plots were examined to determine the number of significant principal components, with components retaining eigenvalues greater than 1 considered for interpretation (Kaiser’s criterion). Individual samples were color-coded in the PCA scatterplot to explore potential differences between farming systems (Extensive vs. Intensive), with confidence ellipses representing group variability. Statistical analyses were performed in R, and results were considered significant at α = 0.05.
The effect of farming system, lactation stage and year on am_milk yield (am_MY) and milk quality traits, accounting for random variability among individual animals, was assessed with the following Linear mixed-effects model (1); each trait was analyzed separately:
where Yijkl denotes the dependent variable (am_MY, chemical composition, physical properties and mineral content); μ the overall mean; FSi the fixed effect of farming system (i = 1–2); LSj the fixed effect of the LS (j = 1–4) (j = 1–2 in the case of mineral content); Yk the fixed effect of the year (k=1-2); (LSj *Yk) the interaction effects of LS and year within each farming system (FSi); Al the random effects of the animal within farming system; eijkl the residual error associated with observation ijkl.
Yijkl = μ + FSi + LSj + Yk +(LSj *Yk)FSi + Al + eijkl
The model was fitted using the linear mixed-effects (lmer()) function from the lme4 package [22] in R [19]. Fixed effects included farm, lactation stage (each sampling corresponded to a specific lactation stage), year of sampling, and interaction effects of year and lactation stage within the farming system, while animals were included as a random intercept to account for repeated measures and inter-individual variability. Model assumptions were assessed by inspecting residual plots, ensuring normality and homoscedasticity. Model significance was evaluated using likelihood ratio tests, and estimated marginal means were obtained using the emmeans package [23] for post hoc comparisons.
3. Results
3.1. Principal Component Analysis (PCA)
Principal Component Analysis (PCA) was performed to investigate the relationships among physicochemical, SCC and TBC parameters of goat milk and to evaluate the differences between extensive and intensive farming systems. The first two principal components (Dim1 and Dim2) explained 31.6% and 18.5% of the total variance, respectively, effectively summarizing the main sources of variation in the dataset.
The PCA biplot (Figure 1a) provides insights into the relationships between milk quality parameters. The angles between these variables serve as indicators of correlation; specifically, a smaller angle signifies a strong positive correlation, while variables that point in opposite directions indicate a negative relationship. In this analysis, SCC_log10, TBC_log10, and EC are closely aligned, suggesting a strong positive correlation among these variables. Conversely, milk composition traits, including fat, protein, and total solids (TS), show a different directional contribution, highlighting their influence on a separate component of variability. The cos2 values, represented by the color gradient, indicate how well each variable is explained by Dim1 and Dim2.
The PCA individual plot (Figure 1b) visualizes the distribution of milk samples, with each point representing an individual sample, classified by the farming system (Extensive vs. Intensive). Each point represents a milk sample, and the grouping is indicated by color-coded markers (red for extensive and blue for intensive). The confidence ellipses (95% confidence interval) surrounding each group illustrate the variation within each system, showing how individual samples are distributed along the first two principal components. The overlap of extensive and intensive samples suggests no clear distinction between extensive and intensive samples based on the first two principal components alone. However, the confidence ellipses indicate that intensive samples are slightly more clustered, while extensive samples show greater dispersion along Dim1; this implies that milk from Extensive systems exhibits greater compositional variability, potentially due to dietary differences or seasonal variations in grazing conditions.
3.2. Effect of Farming System, and Lactation Stage on Milk Yield and Composition Across the Two Lactation Periods
The effects of farming system, year and LS on am_MY and composition were presented in Table 1. The results indicate that the farming system significantly influenced several milk composition parameters. In detail, am_MY was significantly higher in the intensive system (0.98 kg/day) compared to the extensive system (0.85 kg/day) (p < 0.01). In contrast, protein content was significantly higher in the extensive system (3.57%) than in the intensive system (3.47%) (p < 0.001), and similar results were observed for Cas content (2.72% vs. 2.57%, p < 0.001). However, no significant differences were found between farming systems for fat (4.76% vs. 4.75%) or lactose content (4.58% vs. 4.57%), indicating that farming conditions did not influence these components.
Additionally, yearly variations (Table 1) were observed in protein, lactose content and TS, with protein levels being significantly higher in 2022 (3.59%) than in 2023 (3.45%) (p < 0.001). Similarly, lactose and TS followed the same trend, with higher values in 2022 (4.63% for lactose and 13.04% for TS) compared to 2023 (4.52% and 12.83%, respectively) (p < 0.01). However, am_MY, fat content, TS, and Cas levels remained stable between the two years, suggesting that environmental or possible dietary differences had a limited effect on these parameters.
Regarding the effect of the LS (Table 1), a highly significant impact was observed on all analyzed milk parameters (p < 0.001). Specifically, am_MY was highest during the 1st LS (1.05 kg/day), after which it progressively declined in the 2nd (0.96 kg/day), 3rd (1.01 kg/day), and 4th LSs (0.67 kg/day). In terms of fat content, a slight increase was observed during the 2nd LS (4.83%), while the 1st, 3rd, and 4th stages showed relatively comparable values, ranging between 4.69% and 4.78% (p < 0.05). Similarly, protein content was at its peak in early lactation (3.58%) but exhibited a significant reduction in the 3rd (3.43%) and 4th stages (3.51%, p < 0.001). Likewise, lactose content declined, gradually decreasing from 4.74% in early lactation to 4.42% in late lactation (p < 0.001). Moreover, both TS content and Cas levels were significantly influenced by the LS, with the highest concentrations recorded during early lactation, followed by a consistent decline in the subsequent stages (p < 0.001).
Significant interactions were observed between the year and LS within each farming system. Table 2 presents the effect of LS on milk yield and composition across both extensive and intensive farming systems for 2022 and 2023, while Figure 2 highlights the differences in milk composition at specific LS between the two years within each system.
In the extensive system, am_MY (Table 2) exhibited a significant decline (p < 0.001) across LSs, with the highest production recorded in the 1st LS (1.09 kg in 2022, 0.99 kg in 2023) and the lowest in the 4th LS (0.34 kg in 2022, 0.61 kg in 2023). When comparing lactation curves (Figure 1a) between the two years, the 1st LS did not show any statistical differences. However, in the 2nd LS, milk yield was significantly lower in 2023 (0.95 kg) compared to 2022 (1.04 kg) (p < 0.001). This declining trend continued into the 3rd LS, where yield further dropped in 2023 (0.84 kg) compared to 2022 (0.99 kg) (p < 0.001).
In contrast, the intensive system (Table 2) showed a different pattern. In 2022, the highest milk yield was recorded during the 1st LS (1.16 kg), while the lowest occurred in the 4th LS (0.80 kg). In 2023, milk yield remained more stable across LSs, with no significant differences between the 1st and 2nd stages. Significant differences were observed between 2022 and 2023 in the 1st, 2nd, and 3rd LSs (Figure 1a), with lower values in 2023. However, the fluctuations observed between the years seemed to diminish in the fourth LS, where the differences became less pronounced.
The protein content (Table 2) showed a consistent decline in the extensive farming system as lactation progressed, decreasing from 3.75% in the first stage of 2022 to 3.56% in the fourth. Similar results were observed in 2023, where values dropped from 3.63% to 3.36%. When considering the effect of the year (Figure 2c), significant differences were noted in the 1st and 4th LSs, with higher protein levels recorded in 2022. A comparable pattern was seen in the intensive farming system, with protein levels starting at 3.71% in the 1st LS of 2022, before slightly declining to 3.24% in 2023 (Table 2, Figure 2c). A further reduction was observed in the 2nd LS, with values dropping from 3.54% in 2022 to 3.40% in 2023. However, in contrast to earlier stages, the protein content stabilized or increased slightly in the 3rd and 4th LSs. Notably, in 2022, the 4th LS showed an increase of 0.19%, while in 2023, it rose by 0.09% from the 3rd LS (p < 0.001), highlighting a potential compensatory effect in late lactation.
Similarly, the lactose content in milk from the extensive farming system followed a consistent downward curve (Table 2), corresponding with the decline in milk yield. In 2022, lactose concentration gradually decreased from 4.68% in early lactation to 4.42% in late lactation. A comparable pattern was observed in the intensive farming system, where lactose content progressively declined as lactation progressed, with significant reductions across later LSs (p < 0.001). This downward progression was even more pronounced in 2023, with lactose levels dropping from 4.77% to 4.37% in the extensive system and from 4.72% to 4.36% in the intensive system. These findings emphasize the LS’s substantial influence on protein and lactose content, with a more pronounced decline in 2023, possibly reflecting changes in milk composition due to environmental or physiological factors.
TS (Table 2) gradually declined as lactation progressed, with the extensive system showing slightly higher values than the intensive system. In the extensive system, TS started at 13.29% in the 1st LS and dropped to 12.99% in 2022 and 12.25% in 2023. In the intensive system, TS started at 12.79%, briefly increased to 13.08% in the 2nd stage in 2022, but then declined, reaching 12.42% in the 4th stage in 2023. When comparing LSs between the two years (Figure 2d,e), TS in early lactation remained stable, while lactose levels exhibited greater fluctuations. A significant decrease (p < 0.001) in lactose content was observed in the 1st, 2nd and 3rd LSs in 2023 for the extensive system, while in the intensive system, lactose levels declined significantly in the 2nd, 3rd, and 4th stages. Cas (Table 2) also declined with lactation. In the extensive system, levels dropped from 2.97% in the 1st stage to 2.66% in the 4th stage in 2022, and from 2.83% to 2.52% in 2023 (p < 0.001). In the intensive system, Cas levels fluctuated slightly, with an increase in the 2nd stage, but still showed a general decline in later lactation. In 2023, Cas increased in the 2nd stage but later decreased, showing a different pattern from 2022 (p < 0.001). When comparing 2022 and 2023 (Figure 2f), the extensive system had higher Cas in early lactation, but a sharper decline over time, especially in the 4th stage (0.14% lower in 2023, p < 0.001). In contrast, the intensive system showed more fluctuations, with some increases observed in later LSs in 2023 compared to 2022.
3.3. Effect of Farming System, Year and LS on Milk Physical Properties, SCC and TBC
Table 3 presents the physical properties, SCC, and TBC of goat milk under different farming systems (extensive vs. intensive), years (2022 vs. 2023), and LSs (1st – 4th LS). The pH values remained stable across farming systems and years, with no significant differences observed (p > 0.05). However, LS had a highly significant effect (p < 0.001), with the highest pH recorded during the fourth LS (6.75), while the other stages exhibited consistent values (6.65–6.66).
Regarding EC, values ranged from 5.70 to 5.88 mS/cm, with no significant differences between farming systems or years (p > 0.05). However, EC was significantly influenced by the LS (p < 0.05), with the highest value recorded during the 3rd LS (5.88 mS/cm) and the lowest in the 2nd LS (5.70 mS/cm). Similar observations were found for RI values, with no significant effects of farming system or year (p > 0.05). RI decreased slightly but significantly (p < 0.001) from the 1st (1.349) to the 4th LS (1.347). In contrast, Brix values were influenced by both farming system (p < 0.01) and LS (p < 0.001). The extensive system had slightly higher Brix values (10.51°Bx) compared to the intensive system (10.74°Bx). Across LSs, Brix values decreased progressively, with the highest value recorded in the 1st LS (10.11°Bx) and the lowest in the 4th stage (9.86°Bx).
The results for SCC (Table 3) indicated significant differences between farming system, year, and LS. The extensive farming system (5.687 log10 SCC/ml) showed significantly higher SCC values compared to the intensive system (5.504 log10 SCC/ml) (p < 0.001). The SCC values were also significantly influenced by year (p < 0.05), with the 2023 data (5.705 log10 SCC/ml) being higher than 2022 data (5.487 log10 SCC/ml). Across LSs, SCC progressively increased from the 2nd stage (5.439 log10 SCC/ml) to the 4th stage (5.792 log10 SCC/ml), with the 4th stage showing the highest value (p < 0.001). For TBC, significant differences were observed between farming systems, and LSs (Table 3). The extensive farming system had a higher bacterial count (1.592 log10 cfu/ml) compared to the intensive system (1.285 log10 cfu/ml) (p < 0.001). Across LSs, TBC was significantly affected (p < 0.001), with the highest count recorded during the 1st stage (1.704 log10 cfu/ml) and the lowest in the 2nd stage (1.238 log10 cfu/ml.
3.4. Effect of Farming System, Year and LS on Milk Mineral Content
The data presented in Table 4 show the concentrations of minerals in goat milk across the two farming systems, years, and LSs. The concentration of Ca was slightly higher in the intensive farming system (1274.76 mg/kg) compared to the extensive system (1246.72 mg/kg); however, this difference was not statistically significant (p > 0.05). In contrast, the LS had a highly significant effect on Ca levels (p < 0.001), with the 1st LS exhibiting higher values (1295.17 mg/kg) than the 3rd LS (1226.31 mg/kg). Moreover, the interaction between year and LS (Y*LS) was significant (p < 0.001), indicating variability in how Ca content changed across LSs between years. This variability was observed only in the extensive farming system (Figure 3a), with higher Ca levels in early lactation.
Regarding Mg concentration, milk produced from goats reared in the extensive system exhibited significantly higher levels (149.80 mg/Kg) compared to the intensive system (143.57 mg/Kg), (p< 0.001). LS also significantly affected magnesium levels (p < 0.001), with higher magnesium concentrations observed in the 3rd stage (151.51 mg/Kg) compared to the 1st stage (141.86 mg/Kg) but within farming systems this difference was observed only in the intensive farming system (Figure 3b).
The concentration of Fe was significantly higher (p<0.001) in the extensive farming system (0.42 mg/Kg) compared to the intensive system (0.36 mg/Kg) (Table 3). In contrast LS and year did not show a significant effect on Fe levels (p > 0.05). The interaction (Y*LS) also had a significant impact (p < 0.001), although significant changes between LSs across 2022 and 2023 were observed only in the extensive farming system (Figure 3c).
For Zn, no significant differences were observed between the farming systems, years, or LSs (p > 0.05). The values for zinc were nearly identical across both years and farming systems, with concentrations ranging between 3.71 mg/Kg and 3.74 mg/Kg. Finally, for P, a highly significant effect of LS (p < 0.001) was observed (Table 4, Figure 3e), with higher P levels in the 3rd LS (1023.77 mg/Kg) compared to the 1st stage (949.11 mg/Kg).
4. Discussion
This study evaluated the combined effects of farming systems (intensive vs. extensive) and LS across two lactation periods on the chemical and physical characteristics, SCC, and mineral content of Skopelos goat milk derived from two commercial farms. The study demonstrated that milk yields are consistently higher in the intensive farming system These results are in agreement with those reported in other breeds, including Italian local goat breeds [24]) and Baladi goats [25], indicating that controlled feeding as is often the case in intensive farming systems improves productivity in dairy goats. In addition to farming system, the LS significantly affects milk yields. Milk output gradually declines from the beginning to the end of lactation with relatively fast reduction towards the end. As lactation progresses, the decline in mammary gland synthesis efficiency leads to a reduction in milk yield. As observed in our study, am_MY decreases by 30% and 36% in the 3td and 4th LSs, respectively, compared to the 1st stage. The farming system in this study did not influence fat content of milk. These results are in agreement with Morand-Fehr et al. [26] who reported that grazing-based systems do not significantly affect fat content and Goetsch et al. [27] who noted that in goats with moderate to low milk production potential, such as the Skopelos breed, farming systems have a relatively minor influence on fat content. Regardless of farming system, LS significantly affects the fat content of milk with the higher values occurring during mid-lactation. This peak coincides with the spring season, where goats in the extensive farming system have access to fresh, high-quality pasture, while those in the intensive system benefit from higher availability and lower prices of alfalfa [28].
Protein content was significantly higher in the extensive system compared to the intensive system. This suggests that grazing may enhance the nutritional profile of milk, and particularly its protein fraction, as observed in another study [29]. This supports the idea that while intensive farming maximizes milk volume, extensive systems may provide milk with superior protein content, which is particularly valuable for cheese production and dairy product formulation. Lactation stage also influences protein content of milk), with lower values during mid-lactation. Similar findings have also been reported with higher productivity breeds such as the Alpine and Nubian breeds [30]. Caseins are the predominant proteins in milk, accounting for approximately 80% of total milk proteins [31]. Caseins play a crucial role in calcium transport and absorption and they are precursor for bioactive peptides, which have various potential health benefits [32]. Additionally, caseins are fundamental in cheese manufacturing affecting both cheese yield and texture. They are the major proteins involved in coagulation during renneting. In this study, Cas content was similarly affected by farming system and LS as total protein level. Goats in the extensive system produced milk with higher Cas levels (2.72%) than those from the intensive system (2.57%). These findings are consistent with the results of Inglingstad et al. [33] who studied Norwegian dairy goats under grazing. Cas content was also affected by LS with higher levels in early and mid-lactation compared to later stages. These findings are in agreement with previous studies [34], suggesting that early lactation supports higher casein synthesis, which gradually decreases as lactation progresses due to metabolic shifts prioritizing energy and lipid production over protein synthesis.
Lactose content of milk is not affected by farming systems but significantly and consistently declines during lactation. The decrease in lactose content during lactation has been previously attributed to changes in prolactin activity. While prolactin plays a crucial role in stimulating lactose synthesis by enhancing the activity of enzymes involved in its production, its regulatory effects may decline as lactation progresses [35]; this, combined with the increasing metabolic demand for lipid synthesis and energy production in the mammary gland, may contribute to the observed reduction in lactose concentration over time [36]. Farming systems do not affect TS in milk. However, as is the case with protein and lactose content, TS decrease progressively during lactation.
In the present study milk pH ranged from 6.65 to 6.75, with no significant differences across farming systems or years, similarly to what have been previously reported in other studies [14,37,38,39]. pH remained also stable during early and mid-lactation. However, a significant pH increase was observed at the end of lactation similarly to what have been reported in another study. EC in milk is influenced by the presence and concentration of electrically charged ions, including sodium (Na⁺), potassium (K⁺), chloride (Cl⁻), and calcium (Ca²⁺) [40]. These ions are crucial in determining the milk’s ability to conduct electrical current, making EC a useful parameter for evaluating milk composition and udder health. PCA (Figure 1a, Table 3), demonstrated that variations in SCC and TBC were reflected in EC values, indicating that milk with higher bacterial and SCC also tends to have increased EC, likely due to udder inflammation and compromised milk quality. Since SCC and TBC are key indicators of udder health, their influence on EC suggests that monitoring conductivity alongside these parameters provides a comprehensive assessment of milk quality. EC is a commonly used parameter for detecting subclinical mastitis [10,41,42], while refractive index and Brix values offer insights into the TS content of milk [43]. Using these physical parameters as rapid assessment Point-Of-Service tools could enhance monitoring practices, facilitating early detection of health issues and milk quality optimization.
SCC and TBC are key indicators of milk quality, udder health, and hygiene practices [44,45]. The results of this study suggest that SCC and TBC are significantly higher in the extensive farming system compared to the intensive system (Table 3), findings which are in agreement with other studies [12,13]. The results presented herein may be attributed to hand-milking in the extensive system. It is also widely accepted that non-infectious factors such as management practices significantly influence SCC and TBC levels in goats [27,46,47]. LS had a strong effect (p < 0.001), with SCC progressively increasing from the first to fourth LS, which agrees with other data in the literature [27,44,47,48]. TBC followed a similar trend, being significantly higher in the extensive system (p < 0.001), but remained stable between years (p > 0.05), suggesting consistent hygiene practices. However, the LS strongly influenced TBC (p < 0.001), with the highest value observed in early lactation, possibly due to colostrum residues and/or increased susceptibility to contamination due to environmental factors such as rainfall and increased humidity.
Regarding the analysis within farming system significant interactions were observed among, year, and LS, indicating complex interdependencies among these factors.
In the extensive system, milk yield, protein and lactose gradually decline across lactation stages, while fat content increases. These trends are stable across both years, indicating that extensive farming provides a predictable milk composition over time but with variations among individual goats, as shown in PCA analysis. These results are consistent with findings by Idamokoro et al. [49] in Nguni goats, Manousidis et al. [50] in goats grazing Mediterranean woody rangelands and Paschino et al. [48] in goats reared in extensive farms.
In contrast, the intensive system milk yield and milk composition appears more stable in 2023 compared to 2022, these variations suggesting that factors such as management practices, diet formulation and feeding regimes, play a significant role variations in milk composition [14,38,51,52,53]. The PCA analysis confirms this by showing a more compact cluster for intensive farming, indicating tighter control over milk traits. This suggests that while intensive farming allows for higher production, maintaining consistent milk composition requires precise and adaptive management strategies.
The mineral composition of goat milk is affected by various factors, including diet, breed, and farming system. In this study, the observed mineral content ranged from 0.70% to 0.85% with Ca being the most abundant mineral. This findings are consistent with previous studies on Greek and Italian goat breeds [54,55]. However, our results showed slightly lower Ca concentrations, suggesting that differences in farming practices and environmental conditions may influence mineral levels in milk. A significant effect of the farming system on Mg, and Fe levels was observed, suggesting that environmental and feeding factors play a crucial role in mineral content in milk. Specifically, goats raised in extensive systems showed higher concentrations of Mg and Fe, suggesting grazing-based diets contribute to an increased mineral content in milk due to the diversity of the available forage. Mg is essential for enzymatic functions, metabolic regulation, and bone development, and its higher concentration in milk from extensive systems may be attributed to the rich mineral content of natural pastures. Fe plays a crucial role in oxygen transport, immune function, and cellular metabolism, and its higher content in extensive systems may be due to the availability of iron-rich plants and soil ingestion while grazing. This aligns with previous studies highlighting the influence of grazing on milk mineral composition [55,56,57].
LS also played a crucial role in mineral fluctuations. A significant decrease in Ca concentration was observed in mid-lactation in agreement with other studies [45,49,57,58]. The observed reduction in Ca concentration in our study during mid-lactation (3rd LS) can be linked to the concurrent decrease in fat, casein, and protein content. Pan et al. [57] demonstrated that Ca in milk from Laoshan goats is closely associated with casein micelles, fat, and whey protein fractions. The decrease in these components from early to mid-lactation has been linked to a reduction in total Ca content. In contrast, Mg and phosphorus (P) levels increased during the 3rd LS, likely due to metabolic adjustments in the mammary gland. These variations indicate that mineral metabolism is highly dynamic during lactation and should be considered when formulating rations.
5. Conclusions
The results confirm that intensive farming supports higher milk yield, likely due to controlled feeding, while extensive farming enhances the protein and casein content, suggesting a superior nutritional profile for dairy product processing. The lack of influences on fat content across systems indicates that dietary differences primarily impact protein rather than lipid synthesis. Additionally, LS plays a crucial role in shaping milk composition, with a decline in milk yield and lactose content observed as lactation progresses, while fat concentration increases. SCC and TBC, varied between farming systems, with higher values in the extensive system, likely due to milking practices and environmental exposure. The significant interactions observed between year, LS, and farming systems suggest that multiple factors contribute to milk quality variations, emphasizing the need for tailored management strategies. The mineral composition of goat milk was also influenced by farming systems and LS, with higher concentrations of magnesium (Mg) and iron (Fe) in milk from the extensive system, possibly reflecting enhanced mineral availability for grazing animals. The decline in calcium (Ca) content during mid-lactation suggests increased metabolic demands for milk synthesis, while fluctuations in phosphorus (P) and magnesium levels across LS indicate dynamic mineral utilization.
Author Contributions
Conceptualization, Z.B. and I.B.; methodology, Z.B., G.M. and I.B; software, Z.B.; validation, Z.B. and I.B.; formal analysis, Z.B. and I.S.; investigation, Z.B. G.A., G.M. and I.B.; resources, Z.B., G.A. and I.B.; data curation, Z.B. and I.S.; writing—original draft preparation, Z.B.; writing—review and editing, I.B., G.A. and G.M.; visualization, Z.B.; supervision, Z.B.; project administration, I.B.; funding acquisition, I.B. All authors have read and agreed to the published version of the manuscript.
Funding
This study was financially supported by the Horizon 2020 European Union project Code Re-farm “Consumer-driven demands to reframe farming systems”, funded under the call H2020-FNR-2020, with grant agreement No. 101000216.
Institutional Review Board Statement
The animal studies were approved by the Research and Ethics Committee of the Aristotle University of Thessaloniki, Greece (No 277235/2020). The collection of milk samples during milking are not within the context of relevant EU legislation for animal experimentations (Directive 86/609/EC) and are routinely performed on a farm to identify milk quality. The animals were handled by trained personnel.
Informed Consent Statement
Informed consent was acquired from all the farmers involved in this study.
Data Availability Statement
Data available upon request.
Acknowledgments
The farmers agreed to participate in the consortium of project code Re-farm under grant agreement No. 101000216
Conflicts of Interest
The authors declare no conflicts of interest
Abbreviations
The following abbreviations are used in this manuscript:
| DIM | Days in milk |
| PCA | Principal components analysis |
| am_MY | Am milk yield |
| LS | Lactation stage |
| TS | Total Solid |
| CAS | Total Casein |
| EC | Electrical Conductivity |
| RI | Refractive Index |
| SCC | Somatic Cell Count |
| TBC | Total Bacterial Count |
References
- Pulina, G.; Milán, M.J.; Lavín, M.P.; Theodoridis, A.; Morin, E.; Capote, J.; Thomas, D.L.; Francesconi, A.H.D.; Caja, G. Invited Review: Current Production Trends, Farm Structures, and Economics of the Dairy Sheep and Goat Sectors. Journal of Dairy Science 2018, 101, 6715–6729. [CrossRef]
- Dubeuf, J.-P.; Ruiz Morales, F.D.A.; Guerrero, Y.M. Evolution of Goat Production Systems in the Mediterranean Basin: Between Ecological Intensification and Ecologically Intensive Production Systems. Small Ruminant Research 2018, 163, 2–9. [CrossRef]
- Arsenos, G.; Gelasakis, A.; Pinopoulos, S.; Giannakou, R.; Amarantidis, I. Description and Typology of Dairy Goat Farms in Greece. 2014.
- Lopez, A.; Vasconi, M.; Battini, M.; Mattiello, S.; Moretti, V.M.; Bellagamba, F. Intrinsic and Extrinsic Quality Attributes of Fresh and Semi-Hard Goat Cheese from Low- and High-Input Farming Systems. Animals 2020, 10, 1567. [CrossRef]
- Getaneh G.; Mebrat A.; Wubie A.; Kendie H. Review on Goat Milk Composition and Its Nutritive Value. Journal of Nutrition and Health Sciences 2016, 3. [CrossRef]
- Park, Y.; Jeanjulien, C.; Siddique, A. Factors Affecting Sensory Quality of Goat Milk Cheeses: A Review. J Adv Dairy Res 2017, 05. [CrossRef]
- Tripathi Comforts in Quality and Production of Goat Milk. J Adv Dairy Res 2015, 03. [CrossRef]
- Cyrilla, L.; Purwanto, B.P.; Atabany, A.; Astuti, D.A.; Sukmawati, A. Improving Milk Quality for Dairy Goat Farm Development. Med Pet 2015, 38, 204–211. [CrossRef]
- Park, Y. Improving Goat Milk. In Improving the Safety and Quality of Milk; Elsevier, 2010; pp. 304–346 ISBN 978-1-84569-806-5.
- Cruz, A.V.D.; Oliveira, A.L.B.D.; Silva, B.D.S.D.; Silva, E.A.C.D.; Lima, A.L.A. Physicochemical and Microbiological Aspects of Goat Milk. Rev. Sci. Agr. Paranaensis 2021, 1–6. [CrossRef]
- Tzamaloukas, O.; Neofytou, M.C.; Simitzis, P.E.; Miltiadou, D. Effect of Farming System (Organic vs. Conventional) and Season on Composition and Fatty Acid Profile of Bovine, Caprine and Ovine Milk and Retail Halloumi Cheese Produced in Cyprus. Foods 2021, 10, 1016. [CrossRef]
- Paskaš, S. The Influence of Grazing and Indoor Systems on Goat Milk, Brined Cheese and Whey Quality. Mljekarstvo 2023, 73, 143–154. [CrossRef]
- Kucevic, D.; Pihler, I.; Plavsic, M.; Vukovic, T. The Composition of Goat Milk in Different Types of Farmings. Bio Anim Husb 2016, 32, 403–412. [CrossRef]
- Pazzola, M.; Amalfitano, N.; Bittante, G.; Dettori, M.L.; Vacca, G.M. Composition, Coagulation Properties, and Predicted Cheesemaking Traits of Bulk Goat Milk from Different Farming Systems, Breeds, and Stages of Production. Journal of Dairy Science 2022, 105, 6724–6738. [CrossRef]
- Kyozaire, J.K.; Veary, C.M.; Petzer, I.-M.; Donkin, E.F. Microbiological Quality of Goat’s Milk Obtained under Different Production Systems. J. S. Afr. Vet. Assoc. 2005, 76, 69–73. [CrossRef]
- ISO:Milk and Liquid Milk Products, Guidelines for the Application of Mid-Infrared Spectrometry. In International Standard ISO 9622: 2013/IDF 141: 2013. International Dairy Federation; 2013.
- European Standard EN 16943:2017 Foodstuffs - Determination of Calcium, Copper, Iron, Magnesium, Manganese, Phos-Phorus, Potassium, Sodium, Sulfur and Zinc by ICP-OES. 2017.
- AOAC Official Method 2011.14 Calcium, Copper, Iron, Magnesium, Manganese, Po-Tassium, Phosphorus, Sodium, and Zinc in Fortified Food Products Microwave Digestion and Inductively Coupled Plasma-Optical Emission Spectrometry. 2011.
- R Core Team R: A Language and Environment for Statistical Computing_. R Foundation for Statistical Computing, Vienna, Austria. <https://Www.R-Project.Org/ 2024.
- Kassambara, A. and Mundt, F. Factoextra: Extract and Visualize the Results of Multivariate Data Analyses. R Package Version 1.0.7. Https://CRAN.R-Project.Org/Package=factoextra.
- Lê, S.; Josse, J.; Husson, F. FactoMineR: An R Package for Multivariate Analysis. J. Stat. Soft. 2008, 25. [CrossRef]
- Bates, D.; Mächler, M.; Bolker, B.; Walker, S. Fitting Linear Mixed-Effects Models Using Lme4. J. Stat. Soft. 2015, 67. [CrossRef]
- Lenth, R Emmeans: Estimated Marginal Means, Aka Least-Squares Means. R Package Version 1.8.5, Https://CRAN.R-Project.Org/Package=emmeans. 2023.
- Currò, S.; Manuelian, C.; De Marchi, M.; Claps, S.; Rufrano, D.; Neglia, G. Effects of Breed and Stage of Lactation on Milk Fatty Acid Composition of Italian Goat Breeds. Animals 2019, 9, 764. [CrossRef]
- El-Tarabany, M.S.; El-Tarabany, A.A.; Roushdy, E.M. Impact of Lactation Stage on Milk Composition and Blood Biochemical and Hematological Parameters of Dairy Baladi Goats. Saudi Journal of Biological Sciences 2018, 25, 1632–1638. [CrossRef]
- Morand-Fehr, P.; Fedele, V.; Decandia, M.; Le Frileux, Y. Influence of Farming and Feeding Systems on Composition and Quality of Goat and Sheep Milk. Small Ruminant Research 2007, 68, 20–34. [CrossRef]
- Goetsch, A.L.; Zeng, S.S.; Gipson, T.A. Factors Affecting Goat Milk Production and Quality. Small Ruminant Research 2011, 101, 55–63. [CrossRef]
- Kawas, J.R.; Lopes, J.; Danelon, D.L.; Lu, C.D. Influence of Forage-to-Concentrate Ratios on Intake, Digestibility, Chewing and Milk Production of Dairy Goats. Small Ruminant Research 1991, 4, 11–18. [CrossRef]
- Isidro-Requejo, L.M.; Meza-Herrera, C.A.; Pastor-López, F.J.; Maldonado, J.A.; Salinas-González, H. Physicochemical Characterization of Goat Milk Produced in the Comarca Lagunera, Mexico. Animal Science Journal 2019, 90, 563–573. [CrossRef]
- Zeng, S.S.; Escobar, E.N. Effect of Breed and Milking Method on Somatic Cell Count, Standard Plate Count and Composition of Goat Milk. Small Ruminant Research 1996, 19, 169–175. [CrossRef]
- Bär, C.; Sutter, M.; Kopp, C.; Neuhaus, P.; Portmann, R.; Egger, L.; Reidy, B.; Bisig, W. Impact of Herbage Proportion, Animal Breed, Lactation Stage and Season on the Fatty Acid and Protein Composition of Milk. International Dairy Journal 2020, 109, 104785. [CrossRef]
- Mohanty, D.P.; Mohapatra, S.; Misra, S.; Sahu, P.S. Milk Derived Bioactive Peptides and Their Impact on Human Health – A Review. Saudi Journal of Biological Sciences 2016, 23, 577–583. [CrossRef]
- Inglingstad, R.A.; Steinshamn, H.; Dagnachew, B.S.; Valenti, B.; Criscione, A.; Rukke, E.O.; Devold, T.G.; Skeie, S.B.; Vegarud, G.E. Grazing Season and Forage Type Influence Goat Milk Composition and Rennet Coagulation Properties. Journal of Dairy Science 2014, 97, 3800–3814. [CrossRef]
- Qin, Y.S.; Jiang, H.; Wang, C.F.; Cheng, M.; Wang, L.L.; Huang, M.Y.; Zhao, Q.X.; Jiang, H.H. Physicochemical and Functional Properties of Goat Milk Whey Protein and Casein Obtained during Different Lactation Stages. Journal of Dairy Science 2021, 104, 3936–3946. [CrossRef]
- Canul-Medina, G.; Fernandez-Mejia, C. Morphological, Hormonal, and Molecular Changes in Different Maternal Tissues during Lactation and Post-Lactation. J Physiol Sci 2019, 69, 825–835. [CrossRef]
- Oppat, C.A.; Rillema, J.A. Characteristics of the Early Effect of Prolactin on Lactose Biosynthesis in Mouse Mammary Gland Explants. Experimental Biology and Medicine 1988, 188, 342–345. [CrossRef]
- Morgan, F.; Massouras, T.; Barbosa, M.; Roseiro, L.; Ravasco, F.; Kandarakis, I.; Bonnin, V.; Fistakoris, M.; Anifantakis, E.; Jaubert, G.; et al. Characteristics of Goat Milk Collected from Small and Medium Enterprises in Greece, Portugal and France. Small Ruminant Research 2003, 47, 39–49. [CrossRef]
- Mayer, H.K.; Fiechter, G. Physical and Chemical Characteristics of Sheep and Goat Milk in Austria. International Dairy Journal 2012, 24, 57–63. [CrossRef]
- Akbulut Çakır, Ç.; Teker, E. A Comparison of the Acid Gelation Properties of Nonfat Cow, Sheep, and Goat Milk with Standardized Protein Contents. Food Processing Preservation 2022, 46. [CrossRef]
- Fox, P.F.; Uniacke-Lowe, T.; McSweeney, P.L.H.; O’Mahony, J.A. Physical Properties of Milk. In Dairy Chemistry and Biochemistry; Springer International Publishing: Cham, 2015; ISBN 978-3-319-14891-5.
- Díaz, J.R.; Romero, G.; Muelas, R.; Alejandro, M.; Peris, C. Effect of Intramammary Infection on Milk Electrical Conductivity in Murciano-Granadina Goats. Journal of Dairy Science 2012, 95, 718–726. [CrossRef]
- Paterna, A.; Contreras, A.; Gómez-Martín, A.; Amores, J.; Tatay-Dualde, J.; Prats-van Der Ham, M.; Corrales, J.C.; Sánchez, A.; De La Fe, C. The Diagnosis of Mastitis and Contagious Agalactia in Dairy Goats. Small Ruminant Research 2014, 121, 36–41. [CrossRef]
- Kasapidou, E.; Basdagianni, Z.; Papadopoulos, V.; Karaiskou, C.; Kesidis, A.; Tsiotsias, A. Effects of Intensive and Semi-Intensive Production on Sheep Milk Chemical Composition, Physicochemical Characteristics, Fatty Acid Profile, and Nutritional Indices. Animals 2021, 11, 2578. [CrossRef]
- Smistad, M.; Inglingstad, R.A.; Skeie, S. Seasonal Dynamics of Bulk Milk Somatic Cell Count in Grazing Norwegian Dairy Goats. JDS Communications 2024, 5, 205–209. [CrossRef]
- Desidera, F.; Skeie, S.B.; Devold, T.G.; Inglingstad, R.A.; Porcellato, D. Fluctuations in Somatic Cell Count and Their Impact on Individual Goat Milk Quality throughout Lactation. Journal of Dairy Science 2025, 108, 152–163. [CrossRef]
- Jiménez-Granado, R.; Sánchez-Rodríguez, M.; Arce, C.; Rodríguez-Estévez, V. Factors Affecting Somatic Cell Count in Dairy Goats: A Review. Span. j. agric. res. 2014, 12, 133–150. [CrossRef]
- Lianou, D.T.; Michael, C.K.; Vasileiou, N.G.C.; Liagka, D.V.; Mavrogianni, V.S.; Caroprese, M.; Fthenakis, G.C. Association of Breed of Sheep or Goats with Somatic Cell Counts and Total Bacterial Counts of Bulk-Tank Milk. Applied Sciences 2021, 11, 7356. [CrossRef]
- Paschino, P.; Stocco, G.; Dettori, M.L.; Pazzola, M.; Marongiu, M.L.; Pilo, C.E.; Cipolat-Gotet, C.; Vacca, G.M. Characterization of Milk Composition, Coagulation Properties, and Cheese-Making Ability of Goats Reared in Extensive Farms. Journal of Dairy Science 2020, 103, 5830–5843. [CrossRef]
- Idamokoro, E.; Muchenje, V.; Masika, P. Yield and Milk Composition at Different Stages of Lactation from a Small Herd of Nguni, Boer, and Non-Descript Goats Raised in an Extensive Production System. Sustainability 2017, 9, 1000. [CrossRef]
- Manousidis, T.; Parissi, Z.M.; Kyriazopoulos, A.P.; Malesios, C.; Koutroubas, S.D.; Abas, Z. Relationships among Nutritive Value of Selected Forages, Diet Composition and Milk Quality in Goats Grazing in a Mediterranean Woody Rangeland. Livestock Science 2018, 218, 8–19. [CrossRef]
- Olechnowicz, J.; Sobek, Z. Factors of Variation Influencing Production Level,SCC and Basic Milk Composition in Dairy Goats. J. Anim. Feed Sci. 2008, 17, 41–49. [CrossRef]
- Noutfia, Y.; Zantar, S.; Ibnelbachyr, M.; Abdelouahab, S.; Ounas, I. Effect of Stage of Lactation on the Physical and Chemical Composition of Drâa Goat Milk. AJFAND 2014, 14, 9181–9191. [CrossRef]
- Ibnelbachyr, M.; Boujenane, I.; Chikhi, A.; Noutfia, Y. Effect of Some Non-Genetic Factors on Milk Yield and Composition of Draa Indigenous Goats under an Intensive System of Three Kiddings in 2 Years. Trop Anim Health Prod 2015, 47, 727–733. [CrossRef]
- Kondyli, E.; Katsiari, M.C.; Voutsinas, L.P. Variations of Vitamin and Mineral Contents in Raw Goat Milk of the Indigenous Greek Breed during Lactation. Food Chemistry 2007, 100, 226–230. [CrossRef]
- Currò, S.; De Marchi, M.; Claps, S.; Salzano, A.; De Palo, P.; Manuelian, C.; Neglia, G. Differences in the Detailed Milk Mineral Composition of Italian Local and Saanen Goat Breeds. Animals 2019, 9, 412. [CrossRef]
- Stergiadis, S.; Nørskov, N.P.; Purup, S.; Givens, I.; Lee, M.R.F. Comparative Nutrient Profiling of Retail Goat and Cow Milk. Nutrients 2019, 11, 2282. [CrossRef]
- Pan, J.; Yu, Z.; Jiang, H.; Shi, C.; Du, Q.; Fan, R.; Wang, J.; Bari, L.; Yang, Y.; Han, R. Effect of Lactation on the Distribution of Mineral Elements in Goat Milk. Journal of Dairy Science 2024, 107, 2774–2784. [CrossRef]
- Mestawet, T.A.; Girma, A.; Ådnøy, T.; Devold, T.G.; Narvhus, J.A.; Vegarud, G.E. Milk Production, Composition and Variation at Different Lactation Stages of Four Goat Breeds in Ethiopia. Small Ruminant Research 2012, 105, 176–181. [CrossRef]
Figure 1.
Principal components (PCA) analysis of milk composition in relation to farming systems (extensive- extensive) (a) Represents the correlation between milk traits through a PCA plot; (b) Displays the distribution of individual samples across the two principal components, with the extensive and intensive systems color-coded.
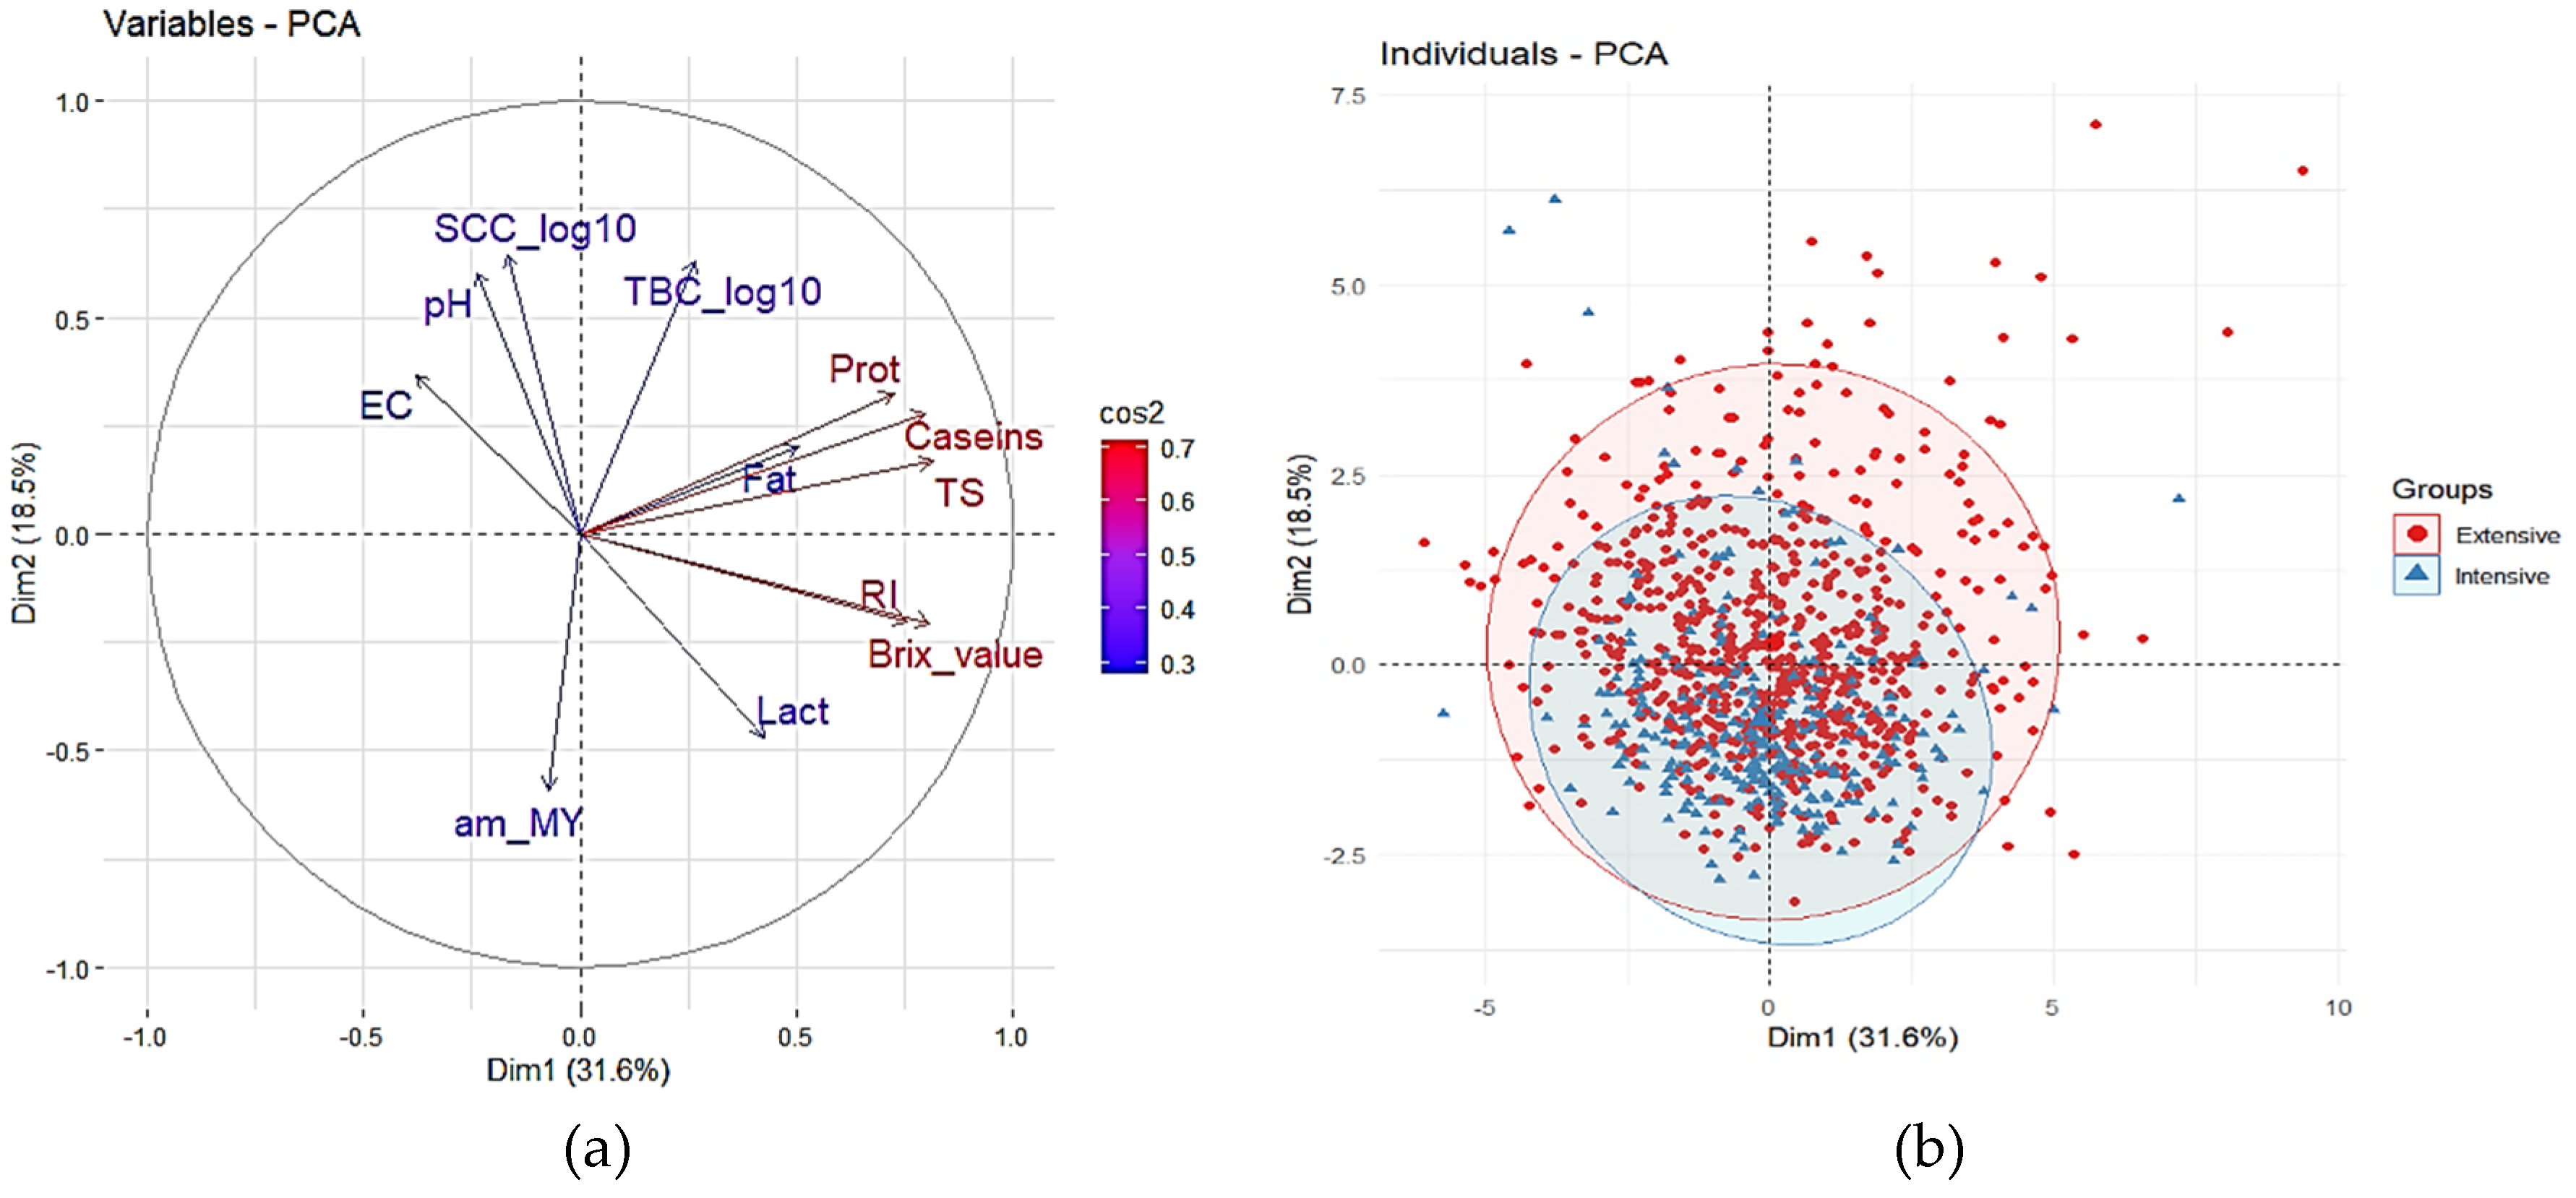
Figure 2.
Chemical composition of milk across the four LSs within farming systems (Extensive and Intensive) over the two years (2022 and 2023). (a) am_milk yield; (b) Fat; c) Protein; (d) Lactose; (e) Total solid (f) Caseins.
Figure 2.
Chemical composition of milk across the four LSs within farming systems (Extensive and Intensive) over the two years (2022 and 2023). (a) am_milk yield; (b) Fat; c) Protein; (d) Lactose; (e) Total solid (f) Caseins.
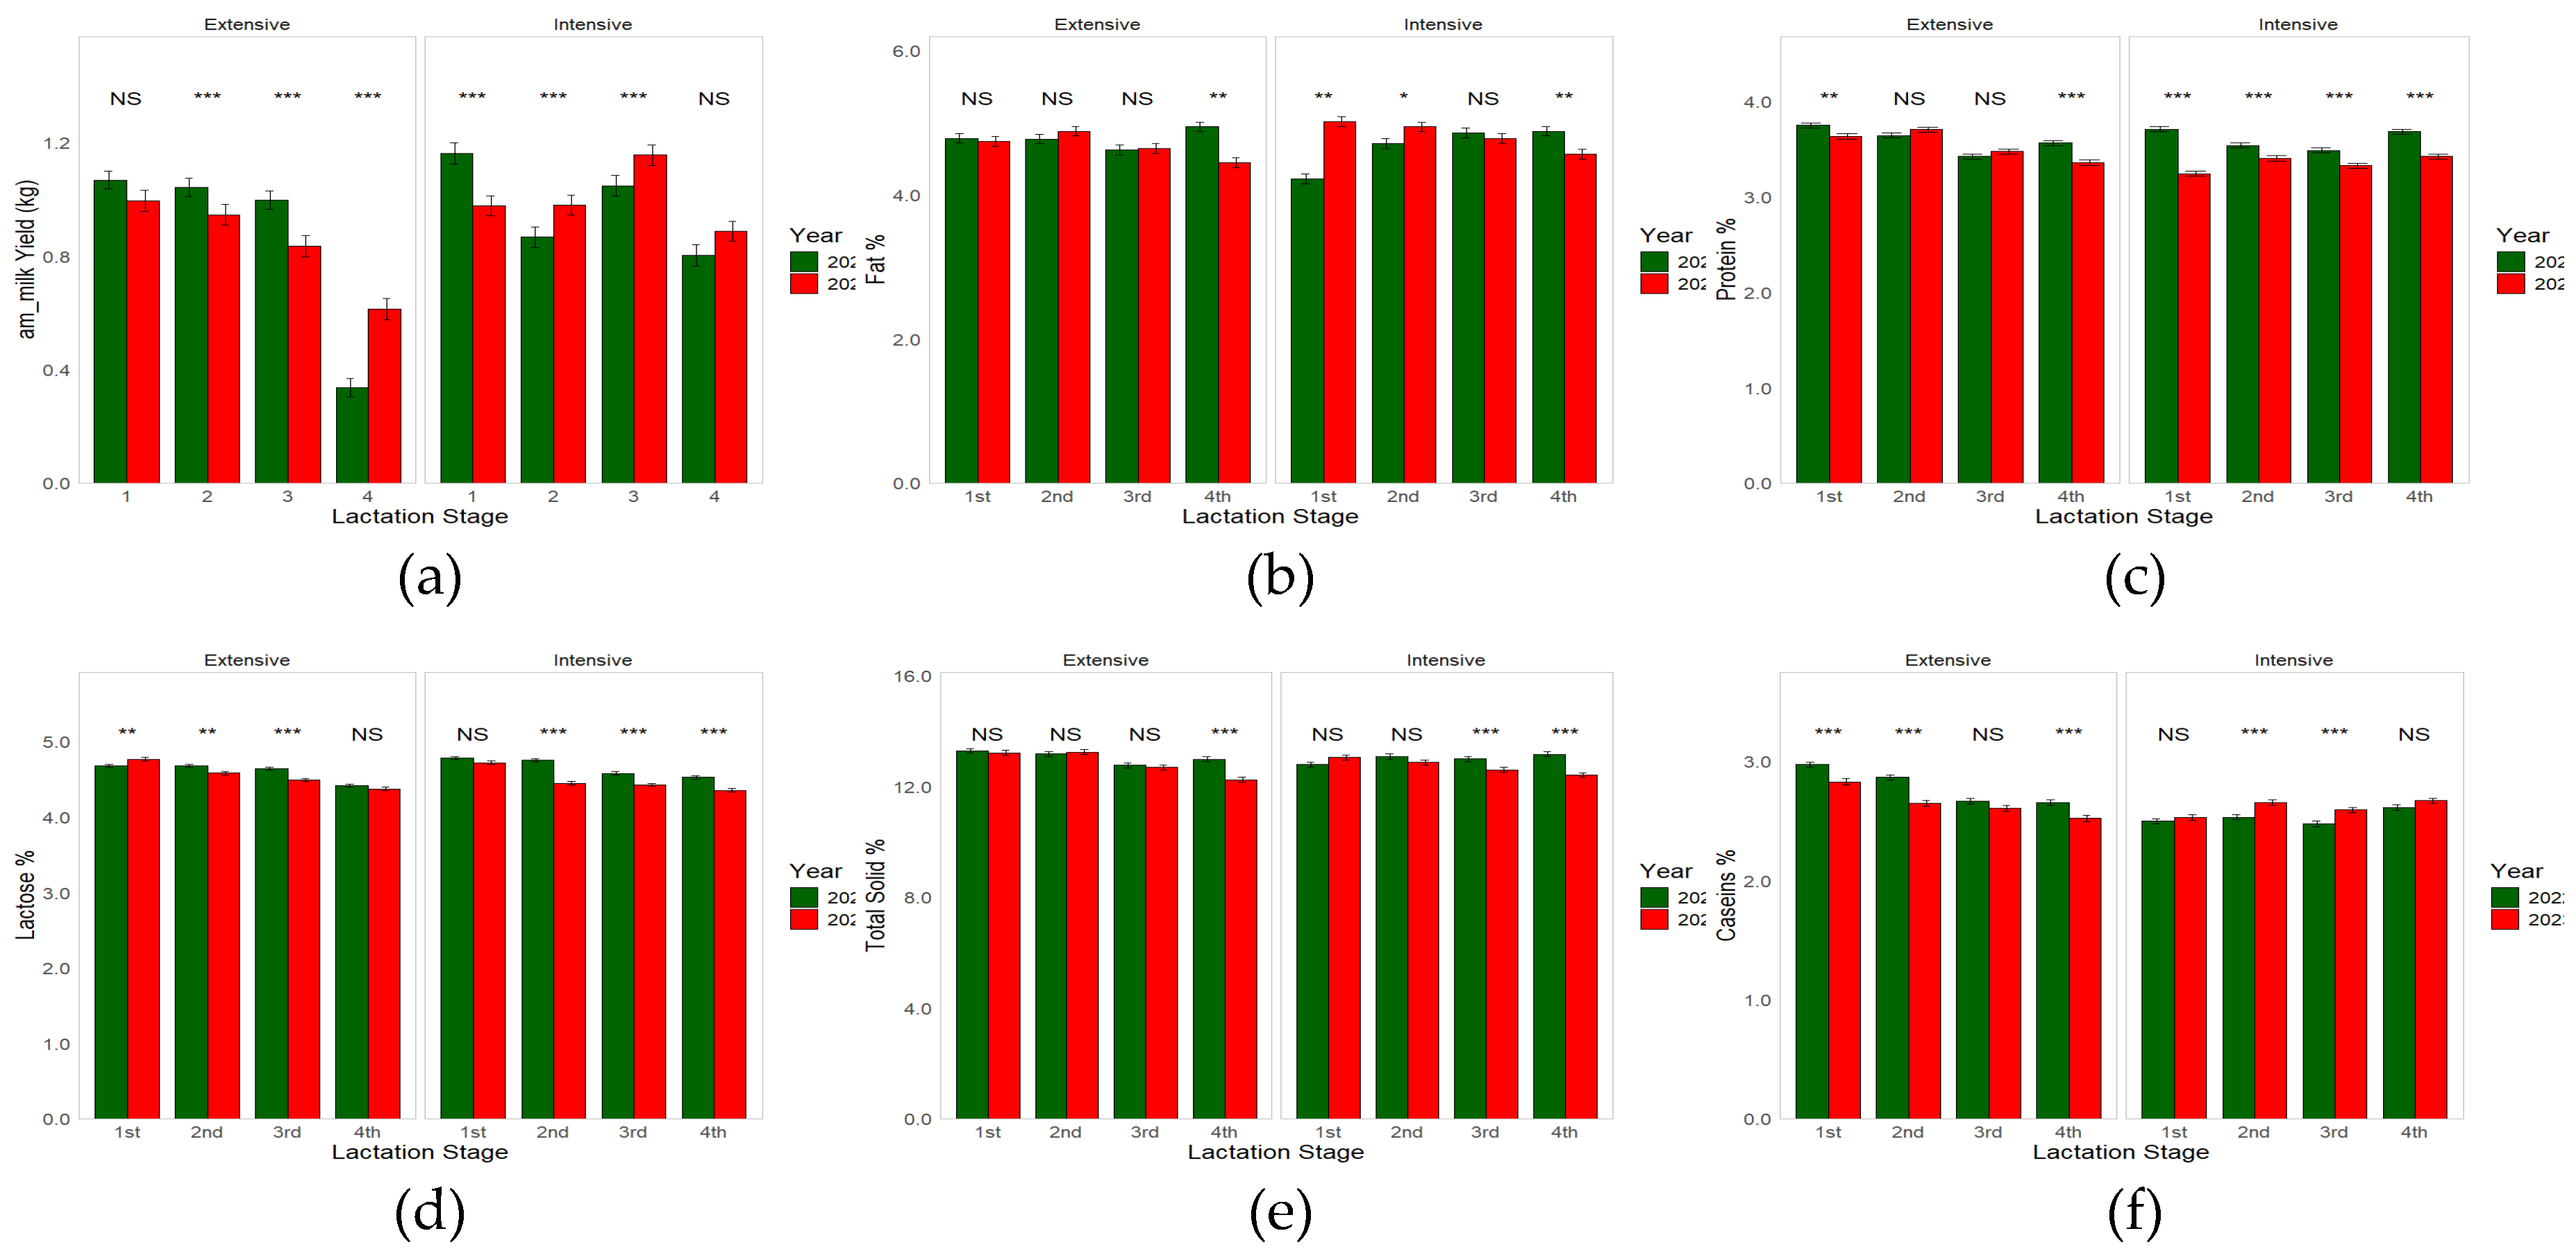
Figure 3.
Mineral content of milk across the four LSs within farming systems (Extensive and Intensive) over the two years (2022 and 2023). (a) Ca: Calcium; (b) Mg: Magnesium; (c) Fe: Iron; (d) Zn: Zing; (e) P: Phosphorus.
Figure 3.
Mineral content of milk across the four LSs within farming systems (Extensive and Intensive) over the two years (2022 and 2023). (a) Ca: Calcium; (b) Mg: Magnesium; (c) Fe: Iron; (d) Zn: Zing; (e) P: Phosphorus.
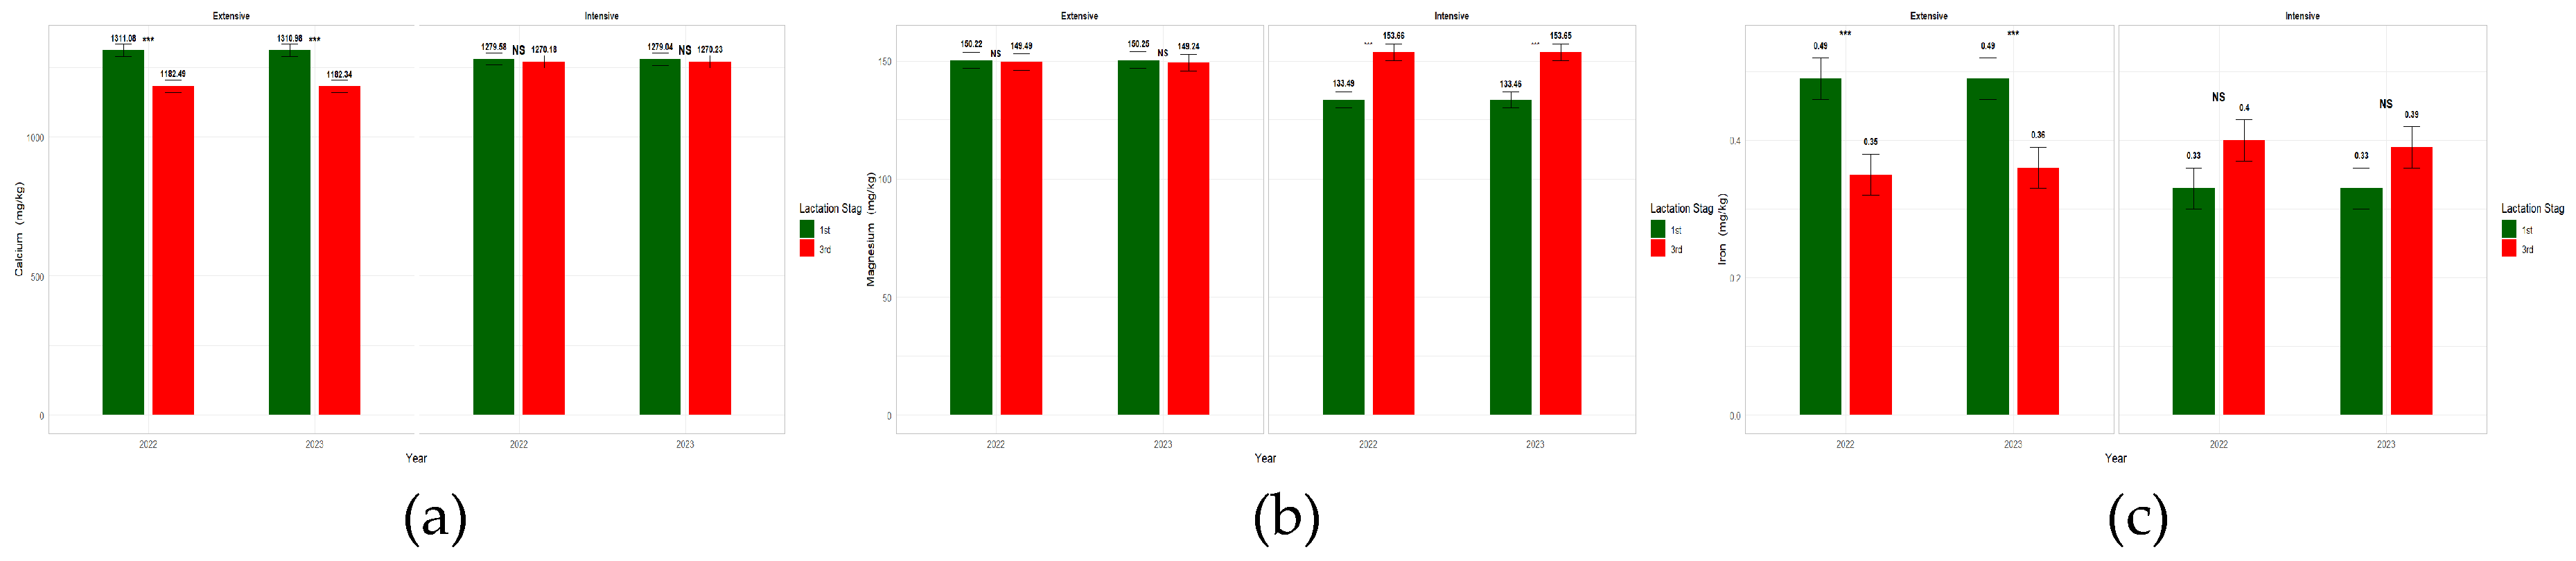
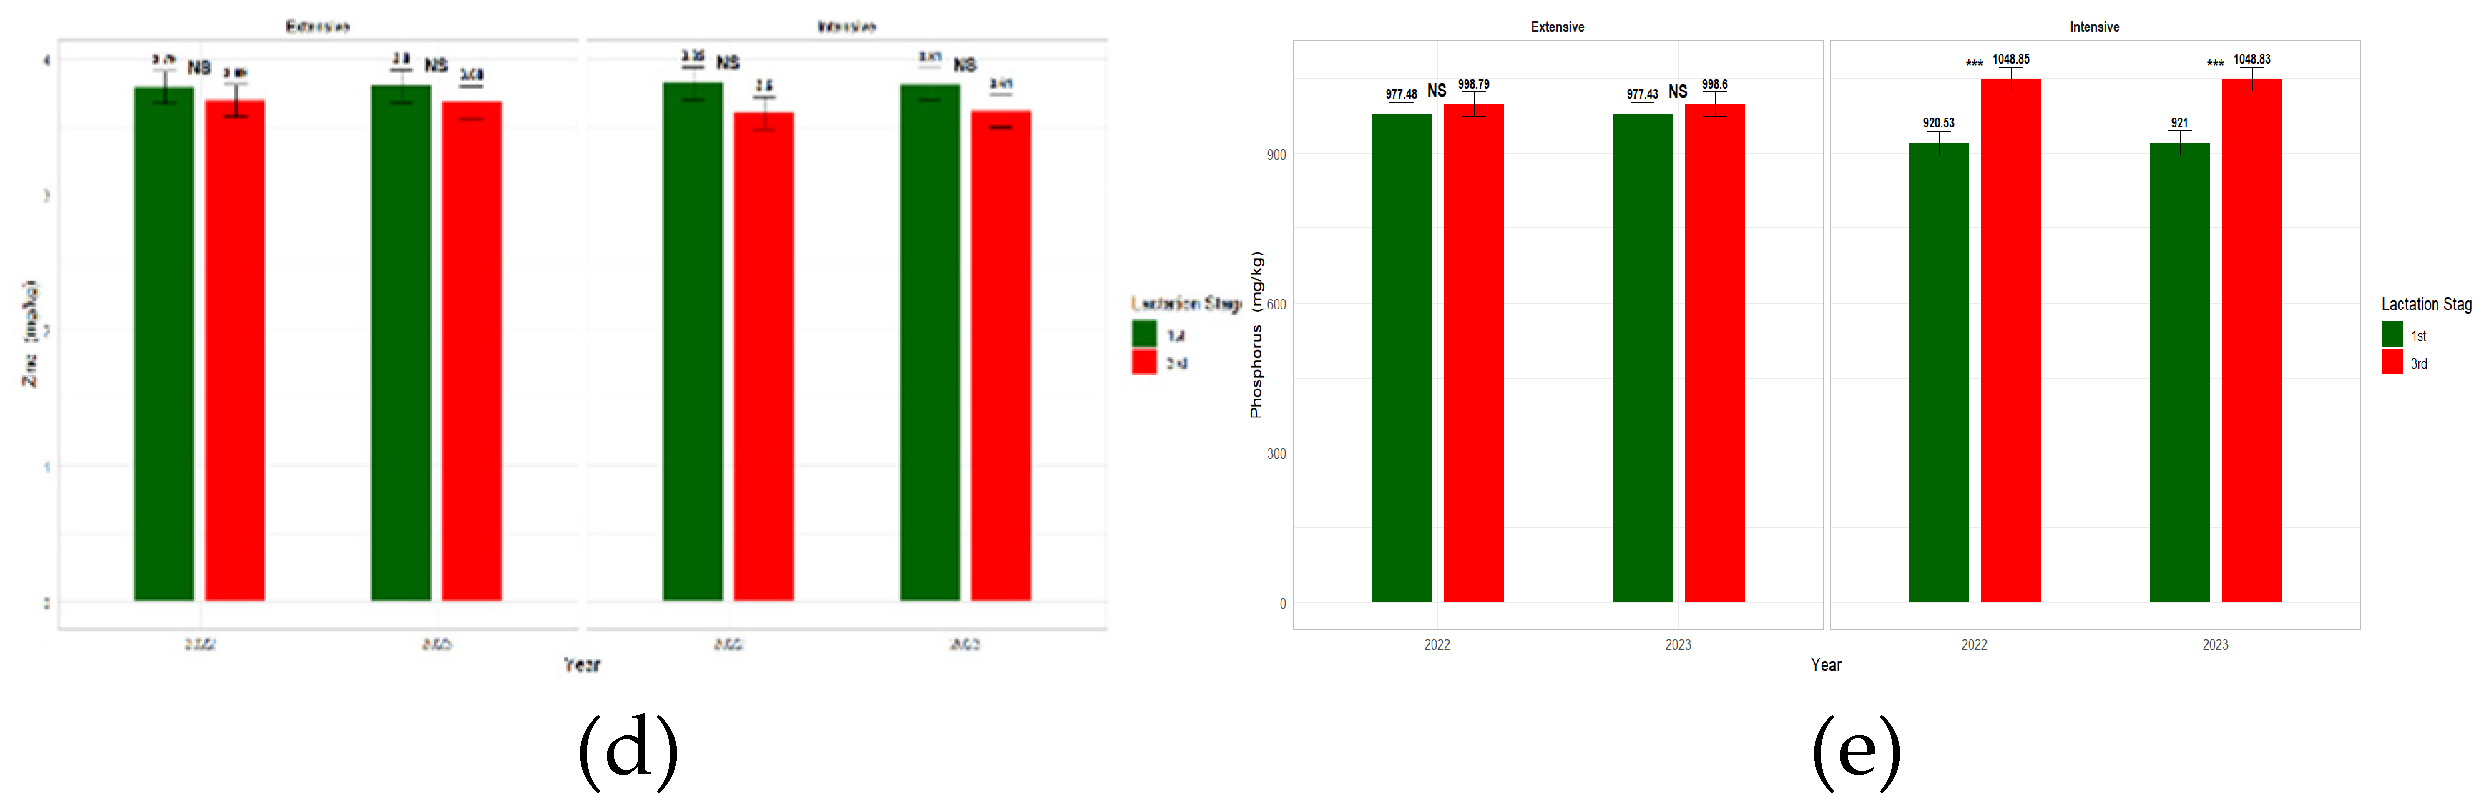

Table 1.
Effect of Farming system and Lactation stage on milk yield and chemical composition of milk across the two years.
Table 1.
Effect of Farming system and Lactation stage on milk yield and chemical composition of milk across the two years.
| Farming System | Year | Lactation Stage | Significance | ||||||||||||
| Variable | E1 n=919 |
I2 n=909 |
SED3FS | 2022 n=938 |
2023 n=890 |
SED3Y | 1stn=458 | 2ndn=472 | 3rdn=450 | 4thn=448 | SED3LS | FS | Y | LS | YxLS |
| am_MY (kg) | 0.85a | 0.98b | 0.015 | 0.92 | 0.93 | 0.012 | 1.05a | 0.96b | 1.01a | 0.67c | 0.017 | ** | NS | *** | *** |
| Fat (%) | 4.76 | 4.75 | 0.034 | 4.72 | 4.75 | 0.033 | 4.69a | 4.83b | 4.74a | 4.78a | 0.048 | NS | NS | * | ** |
| Protein (%) | 3.57a | 3.47b | 0.012 | 3.59a | 3.45b | 0.011 | 3.58a | 3.57a | 3.43b | 3.51c | 0.017 | *** | *** | *** | *** |
| Lactose (%) | 4.58 | 4.57 | 0.009 | 4.63a | 4.52b | 0.008 | 4.74a | 4.62b | 4.54c | 4.42d | 0.013 | NS | ** | *** | *** |
| TS (%) | 12.95 | 12.88 | 0.034 | 13.04a | 12.83b | 0.033 | 13.09a | 13.09a | 12.77b | 12.71b | 0.046 | NS | *** | *** | *** |
| Cas (%) | 2.72a | 2.57b | 0.009 | 2.66a | 2.63b | 0.008 | 2.71a | 2.68a | 2.58b | 2.62b | 0.012 | *** | *** | *** | *** |
1 E: Extensive; 2 I: Intensive; 3 Standard error of the difference among means; Within a raw and group, means without a common superscript differ (a, b, c) differ at P<0.05; * = P<0.05;** = P<0.01; *** = P<0.001; NS = non- significant; TS: Total solid; Cas: Total casein.
Table 2.
Effect of Lactation stage on milk yield and chemical composition of milk across the two years within farming system.
Table 2.
Effect of Lactation stage on milk yield and chemical composition of milk across the two years within farming system.
| Year | 2022 | 2023 | |||||||||||
| Lactation Stage | 1stn=458 | 2ndn=472 | 3rdn=450 | 4thn=448 | SED1 | Sig | 1stn=458 | 2ndn=472 | 3rdn=450 | 4thn=448 | SED1 | Sig | |
| Extensive | |||||||||||||
| am_MY (kg) | 1.09ab | 1.04b | 0.99ab | 0.34d | 0.03 | *** | 0.99a | 0.95a | 0.84b | 0.61c | 0.03 | *** | |
| Fat (%) | 4.78ab | 4.77ab | 4.62a | 4.94b | 0.05 | *** | 4.74ab | 4.88a | 4.64bc | 4.44c | 0.05 | *** | |
| Protein (%) | 3.75a | 3.64b | 3.42c | 3.56d | 0.02 | *** | 3.63a | 3.70a | 3.47b | 3.36c | 0.02 | *** | |
| Lactose (%) | 4.68a | 4.68a | 4.64a | 4.42b | 0.02 | *** | 4.77a | 4.59b | 4.49c | 4.37d | 0.02 | *** | |
| TS (%) | 13.29a | 13.18a | 12.77b | 12.99b | 0.08 | *** | 13.22a | 13.24a | 12.69b | 12.25c | 0.08 | *** | |
| Cas (%) | 2.97a | 2.87b | 2.67c | 2.66c | 0.02 | *** | 2.83a | 2.65b | 2.61b | 2.52c | 0.02 | *** | |
| Intensive | |||||||||||||
| am_MY (kg) | 1.16a | 0.87b | 1.05c | 0.80b | 0.03 | *** | 0.98a | 0.98a | 1.16b | 0.89a | 0.03 | *** | |
| Fat (%) | 4.22a | 4.71b | 4.86b | 4.88b | 0.05 | *** | 5.01a | 4.94abc | 4.78cd | 4.56d | 0.05 | *** | |
| Protein (%) | 3.71a | 3.54b | 3.49b | 3.68a | 0.02 | *** | 3.24a | 3.40b | 3.33c | 3.42b | 0.02 | *** | |
| Lactose (%) | 4.78a | 4.76a | 4.58b | 4.53b | 0.02 | *** | 4.72a | 4.45b | 4.43b | 4.36c | 0.02 | *** | |
| TS (%) | 12.79a | 13.08b | 13.00ab | 13.17b | 0.08 | *** | 13.06a | 12.88a | 12.61b | 12.42b | 0.08 | *** | |
| Cas (%) | 2.50ab | 2.53b | 2.48ac | 2.61d | 0.02 | *** | 2.53a | 2.65bd | 2.59ab | 2.67cd | 0.02 | *** | |
1 Standard error of the difference among means; Within a raw and group, means without a common superscript differ (a, b, c) differ at P<0.05; * = P<0.05; ** = P<0.01; *** = P<0.001; NS = non-significant; TS: Total solid; Cas: Total casein.
Table 3.
Effect of Farming system and Lactation stage on physical properties, SCC, and TBC of milk across the two years.
Table 3.
Effect of Farming system and Lactation stage on physical properties, SCC, and TBC of milk across the two years.
| Farming System | Year | Lactation Stage | Significance | ||||||||||||
| Variable | E1 n=919 |
I2 n=909 |
SED3FS | 2022 n=938 |
2023 n=890 |
SED3Y | 1st n=458 |
2nd n=472 |
3rd n=450 |
4th n=448 |
SED3LS | FS | Y | LS | Y*LS |
| pH | 6.67 | 6.68 | 0.004 | 6.68 | 6.67 | 0.005 | 6.65a | 6.66a | 6.65a | 6.75b | 0.007 | NS | NS | *** | NS |
| EC (mS/cm) | 5.77a | 5.74b | 0.020 | 5.77 | 5.74 | 0.020 | 5.73a | 5.70a | 5.88b | 5.72a | 0.037 | *** | NS | * | NS |
| RI | 1.348 | 1.349 | 0.001 | 1.349 | 1.348 | 0.001 | 1.349a | 1.349a | 1.348a | 1.347b | 0.001 | NS | NS | *** | NS |
| Brix (°Bx) | 10.51a | 10.11b | 0.043 | 10.51 | 10.26 | 0.003 | 10.72a | 10.44b | 10.23c | 9.86d | 0.061 | ** | NS | *** | NS |
| log10 SCC/ml | 5.687a | 5.504b | 0.024 | 5.487a | 5.705b | 0.020 | 5.529a | 5.439b | 5.623c | 5.792d | 0.028 | *** | * | *** | NS |
| log10 TBC ((cfu/ml) | 1.592a | 1.285b | 0.032 | 1.450 | 1.448 | 0.026 | 1.704a | 1.238b | 1.391c | 1.449c | 0.037 | *** | NS | *** | NS |
1 E: Extensive; 2 I: Intensive; 3 Standard error of the difference among means; Within a raw and group, means without a common superscript differ (a, b, c) differ at P<0.05; * = P<0.05;** = P<0.01; *** = P<0.001; NS = non- significant; EC: Electrical Conductivity; RI: Refractive Index.
Table 4.
Effect of farming system, year and LS on milk mineral content.
| Farming System | Year | Lactation Stage | Significance | ||||||||||
| Variable | E1 n=100 |
I2 n=100 |
SED3FS | 2022 n=100 |
2023 n=100 |
SED3Y | 1st n=100 |
3rd n=100 |
SED3LS | FS | Y | LS | Y*LS |
| Ca mg/Kg | 1246,72 | 1274,76 | 15.37 | 1260.83 | 1260.65 | 15.31 | 1295,17a | 1226,31b | 15.30 | NS | NS | *** | *** |
| Mg mg/Kg | 149,80a | 143,57b | 2.40 | 146,72 | 146,65 | 2.40 | 141,86a | 151,51b | 2.40 | *** | NS | *** | *** |
| Fe mg/Kg | 0.42a | 0.36b | 0.023 | 0.39 | 0.39 | 0.024 | 0.41 | 0.36 | 0.023 | *** | NS | NS | *** |
| Zn mg/Kg | 3.74 | 3.71 | 0.082 | 3.73 | 3.72 | 0.082 | 3.81 | 3.65 | 0.081 | NS | NS | NS | NS |
| P mg/Kg | 988.07 | 984.80 | 16.50 | 986.412 | 986.47 | 16.50 | 949.11a | 1023.77b | 16.51 | *** | NS | ** | *** |
1 E: Extensive; 2 I: Intensive; 3 Standard error of the difference among means; Within a raw and group, means without a common superscript differ (a, b, c) differ at P<0.05; * = P<0.05;** = P<0.01; *** = P<0.001; NS = non- significant; Ca: Calcium; Mg: Magnesium; Fe: Iron; Zn: Zinc; P: Phosphorus.
Disclaimer/Publisher’s Note: The statements, opinions and data contained in all publications are solely those of the individual author(s) and contributor(s) and not of MDPI and/or the editor(s). MDPI and/or the editor(s) disclaim responsibility for any injury to people or property resulting from any ideas, methods, instructions or products referred to in the content. |
© 2025 by the authors. Licensee MDPI, Basel, Switzerland. This article is an open access article distributed under the terms and conditions of the Creative Commons Attribution (CC BY) license (http://creativecommons.org/licenses/by/4.0/).
Copyright: This open access article is published under a Creative Commons CC BY 4.0 license, which permit the free download, distribution, and reuse, provided that the author and preprint are cited in any reuse.


