
Submitted:
04 April 2025
Posted:
07 April 2025
You are already at the latest version
Abstract
Artificial Intelligence (AI) has recently played a crucial role in improving bridge assessment through diverse methodologies to optimize maintenance strategies and reduce costs. Therefore, the current study proposed two different methods to estimate the current condition rating of R.C. bridges by 1) Fuzzy Decision-Making; and 2) Markov Chain Modelling. The purpose of this study is to investigate the more applicable and accurate technique due to AI for reinforced concrete bridge assessment. The current study focused on corrosion as the main defect used to estimate the bridge condition rating. The dual methods depend on visual inspection, applying field and laboratory tests, and reviewing the historical data of the inspected bridge to estimate its condition rating. The fuzzy decision model is applied to find a correlation between corrosion degree and concrete surface condition to estimate the condition rating. The Markov chain model is used to predict the future condition rating for the whole bridge and when it will reach the critical condition. The service life for each bridge element is calculated due to carbonation and chloride attack. The Life 365 model is applied to estimate the service life due to chloride ingress. The proposed system is validated through a real case study, and the results show that the fuzzy is less accurate compared to the Markov Chain. The introduced models are expected to provide proper Maintenance, Repair, and Replacement (MRR) decisions for the bridges.
Keywords:
AI
; Reinforced Concrete Bridges
; Assessment
; Visual Inspection
; Condition Rating Fuzzy
; Markov Chain
1. Introduction
Civil infrastructure systems are undergoing continued and accelerating deterioration over time. Most of them are owned by the government or large firms and could be classified into roadways, bridges, buildings, and water and sewer networks. Meanwhile, statistics show that 98% of its domestic cargo depends on this road network and bridges, which reflects their significant role in the national economy and people’s daily activities [1]. Deterioration and degradation are the most popular issues for the bridges, which are one of the core elements of infrastructure systems. In the United States, 22.7% of the bridges are either structurally deficient or functionally obsolete, according to the American Society of Civil Engineers (2017). In 2006, the cost of eliminating all existing bridge deficiencies was estimated at $850 billion [2,3]. In 2013, the United States found that 607,380 bridges have an average age of 42 years [4]. There are several factors that impact RC bridges; deterioration leads to different defects, which reflect the main challenge in bridge inspection programs. Some of them belong to design, techniques used for construction, materials, ageing, excessive loads, environmental exposure, and maintenance of the structure in service. Furthermore, accident effects such as fire, which is considered one of the most severe threats to which RC bridges may be exposed during their life service [5]. Inspection and performance assessment of bridges are important in many countries. There are several categories of bridge inspection that reflect the intensity of the inspection [6]. The AASHTO Manual for Bridge Evaluation (2018) [7] described the seven types of inspection, which may vary based on the useful life of bridges and the type of structures. Mainly, visual inspection is used to evaluate the service statuary of the bridges, which can be applied for condition assessment [8]. Generally, the diagnosis and evaluation of current conditions are the main tools for concrete structure management [9]. The authorities around the world have a desire to develop solutions to periodically inspect their bridges and to support maintenance activities. They used the bridge management system (BMS), which is visual inspection-based decision support tools to analyze engineering and economic factors and to assist the authorities in taking the decisions regarding maintenance, repair, and rehabilitation of bridge structures at a suitable time. The US and inside the EU have developed numerous bridge management systems (BMSs) to assist engineers on the condition assessment and prioritization of maintenance activities. Consequently, measuring the bridge deterioration by using several condition rating scales are indicators to take the best decision between maintenance, repair, and replacement (MRR) choices [10,11,12,13]. Generally, it is rare to find an effective, clear, and practical system to assess the bridge condition and predict its future deterioration to make a decision between three strategies: (a) maintenance, (b) repair, or (c) rehabilitation. Over the past years, a lot of studies were competing to integrate a comprehensive study for structural safety assessment. Abdelalim [14] proposed an approach for rehabilitated reinforced concrete buildings based on a probabilistic deterioration model. The model considered the impact of different options of maintenance due to the total cost of maintenance over a year. Abdelalim et al. [15] applied a Markov chain model to predict the future building condition during its life cycle. Alsharqawi et al. [16] integrated a condition rating index based on visual inspection for surface and ground-penetrating radar (GPR) technology for subsurface defects. The quality function deployment (QFD) theory was adopted for bridge condition assessment, and the k-means clustering technique was used to identify the thresholds between different ratings. Their assessment was relied on only one nondestructive evaluation techniques and one type of clustering algorithms that make it less accurate. Ali Mohamed et al. [9] introduced a framework for building condition assessment based on building information modelling (BIM). The system was divided into two models: the condition assessment model and the deterioration predictive model. Rhee et al. [17] presented a dielectric constant curve that can be applied to the assessment of asphalt condition-covered concrete bridge decks, taking into account the age of the concrete. Ground penetrating radar (GPR) technology was applied in the field survey for reliable condition assessment. Rogulj et al. [18] applied fuzzy analysis for bridge condition assessment. They depended only on visual inspection for bridges condition assessment. The bridge components are divided into three elements: superstructure, substructure, and equipment. Each element rating evaluated by experts was deffuzified according to defined fuzzy sets, membership functions, and linguistic values. Additionally, ratings for every element are assigned a fuzzy structural importance. Finally, the centroid method was applied for defuzzifying the component rating. Xia et al. [19] established an approach based on inspection reports to estimate the bridge condition rating. The bridge condition assessment was a composite of three levels: the component level, unit level, and system level. There were five levels for subjective condition rating: excellent, good, fair, serious, and failed. The long short-term memory (LSTM) neural network was applied to read information from inspection reports to extract the required feature to estimate the bridge condition rating. The considered features were sub-region, ADT, ADTT, age, length, structural type, max span, superstructure maintenance, substructure maintenance, and deck maintenance. The main limitation is related to the requirement of a large amount of data for training the neural networks. Bertagnoli et al. [20] used 3D global non-linear numerical analyses to assess the safety level of different damage scenarios for bridge decks. The ultimate limit state due to the safety loss of the damage level was used to evaluate the safety level of the deck. The damage threshold was defined in terms of measurable static parameters. Shivam [21] assessed the bridge based on a bridge inventory that includes the measurement and the number for each component type. The condition of each component due to its distress percentage was determined at the final stage to observe its severity.
Although there are different techniques employed for bridge condition assessment, it is still a challenge to determine the most effective method because there aren't enough studies that compare different approaches. Also, most of the literature studies applied their assessment methods on the bridge deck only and ignored the other parts of the bridge. Additionally, the previous studies are focusing on the visual inspection and inventory data to assess the current condition of the structure. They ignored that the inspectors may be required to carry out nondestructive and destructive tests, followed by laboratory tests to diagnose the structural condition to get an accurate condition rating. Thus, the present study has a desire to compare different techniques to assess the reinforced concrete bridges. Among the two methods compared in this paper, dual AI-based methods are selected in recognition of the significance of Artificial Intelligence (AI) in the evaluation of reinforced concrete bridges. The established techniques depend not only on visual inspection by bridge inspectors but also on applying field and laboratory tests and reviewing the historical data of the inspected bridge to estimate the bridge condition rating. The first technique relied on applying a fuzzy decision model to find a correlation between the corrosion degree and concrete surface condition to estimate the condition rating for each bridge element to find the overall bridge rating. The second technique adopted the Markov Chain model to predict the future condition for each bridge element and to determine when the inspected bridge will reach the critical condition. Also, it was taken into consideration to generate the transition probability matrix [TPM] of the Markov chain and customise it to specific conditions by optimization. Additionally, this paper estimates the bridge service life based on laboratory and field tests. The service life for the RC bridge is calculated due to carbonation attack and chloride-induced corrosion of the embedded steel bars. The proposed system aims to investigate the more applicable and accurate technique to diagnose the bridge condition state to take the proper decision.
2. Research Methodology
2.1. Method Overview
The introduced research is applied to compare the condition rating for R.C. bridges due to fuzzy decision model and Markov chain modelling. The data from the condition assessment contributes to create a deterioration model to predict the state of the whole bridge to decide the best strategy reaction. Corrosion of the embedded steel bars is considered in this paper as the main defect to estimate the bridge condition rating and its service life. The research procedure followed in this study is illustrated in Figure 1.
2.1. Condition Rating System and Bridge Element Weights
The National Bridge Inventory has the most common condition rating, which has been developed by the Federal Highway Administration (FHWA, 2012). It is used to evaluate three main components of bridges: deck, superstructure, and substructure. The scale ranged from 9, which presents excellent condition, to zero, which refers to failed condition, as shown in Table 1 [22]. The Federal Highway Administration classification system (FHWA, 2012) is adopted in this approach system to categorise the deterioration of reinforced concrete bridges.
On the other hand, the NY ranking system assigned relative weights for thirteen bridge elements as listed in Table 2. The current study used the Weighted Evaluation Method (WEM ASTM1957) to justify the weight importance of bridge elements. Weighted evaluation is a useful tool that helps decision-makers make suitable decisions.
A question of which component element is more important than others based on the thirteen elements mentioned in the NY ranking system was discussed with experts with rich knowledge in the bridge industry in Egypt, Saudi Arabia, and the United Arab Emirates. The aim of the question is to be used in WEM to capture the opinion of experts regarding the important elements affecting the bridge condition rating, especially for R.C. bridges, as shown in Table 3.
The weight of each element is compensated in equation (1) to evaluate the overall Bridge Condition Rating (BCR) [22].
2.2. Predicting the Condition Rating of Reinforced Concrete Bridges by Fuzzy Decision Model
In this technique, the corrosion is considered the common symptom of distress and bridge deterioration. The article adopted a fuzzy decision model to find a correlation between concrete surface condition and corrosion degree. Abdelalim, A. M. [24] defined four degrees of corrosion as shown in Table 4.
To create a correlation between corrosion degree and concrete surface condition, logic approach has been adopted with applying Mamdani’s Inference system. Concrete surface condition can be categorized into four conditions as shown in Table 5.
Fuzzy set theory is designed to deal with uncertainties that are not statistical in nature [25]. Fuzzy set theory is used by fuzzy inference systems (FIS) to map inputs to outputs. The two common inference systems are the Mamdani and the Sugeno. Trapezoidal and triangular shapes of membership functions are the most common. Some experts preferred the triangular membership function due to its narrow peak of absolute membership compared to the trapezoidal membership function, where the peak (absolute membership) is shown through the interval. Other studies preferred trapezoidal membership because of its flexibility and reliability compared to triangular membership [26]. Thus, the current study applies both trapezoidal and triangular shapes to compare the results between them.
2.2.1. The Membership Functions
The numerical value for corrosion degree is determined by the rate of corrosion based on the pH value. The corrosion degree is the first linguistic variable and takes linguistic values (low, moderate, significant, and critical) based on equations (2), (3), and (4) to be shown in Table 6.
The second linguistic variable is the concrete surface condition, which takes linguistic values (unchanged, slight, obvious, and deteriorated). Both variables are applied to create a correlation between corrosion degree and concrete surface condition to get the semi-quantitative condition for the bridge element.
- First case:
In the first case trapezoidal and triangular membership are applied for both inputs and output, as shown in the Figure 2.
To determine the membership value correctly for a specific quantity in a linguistic term is a challenge and requires an experiment in order to define it properly. Furthermore, it is possible to subjectively determine the membership functions: the closer an element is to meeting a set's conditions, the closer its membership grade is to 1, and vice versa [27]. The terms of corrosion degree are quantified with numerical values ranging from 0 to 1, while concrete surface conditions have values ranging from 2 to 7. It’s worth mentioning that the shapes of the corrosion degree values of the membership function are narrow compared with the concrete surface condition membership function. The explanation can be related to the fact that the range values of the corrosion degree are determined by applying the equations of the rate of corrosion based on the pH values. Whereas the concrete surface range values are uncertainties and determined based on expert judgements and trial and error. On the other hand, the output linguistic variables are related to FWHA (2012) [22] from rate 3 to 6, as shown in Table 7. Figure 3 shows the membership function of the output variable in the semi-quantitative condition.
- Second case:
The triangular shape is only applied in the second case for both input and output membership variables, and the range values for both inputs and output are shown in Figure 4.
- Third case:
Triangular and trapezoidal shapes are applied for input membership, while the output is only a triangular shape. The value ranges are shown in Figure 5.
2.2.2. Applying Fuzzy Decision Rules
The semi-quantitative condition rating is determined by two fuzzy variables: corrosion degree and concrete surface condition. Because each of these variables has four membership functions, there could be a total of 42 (16) precondition combinations that influence the condition rating. These preconditions are formed by a set of fuzzy if-then rules, as shown in Table 8. An example:
IFcorrosion degree is low (L),
Andconcrete surface condition is Unchanged (U),
Thenthe condition rating is Satisfactory
Defuzzifi
cation Stage:
Defuzzification is the last step in a fuzzy process that converts the fuzzy results into real-world values by applying several methods. The current study applied the center of gravity method, which is defined by equation (5)[27]. Table 9, Table 10 and Table 11 show the fuzzy process output after the diffuzification, which shows how the current proposed technique is working effectively.
Where:
U: control action
In: value of interval
n: total no. of intervals.
As illustrated in Figure 6, the fuzzy model produces the result output of each pair (corrosion degree, concrete surface condition) by applying rules. The three cases got approximately the same result.
2.3. Predicting the Condition Rating of Reinforced Concrete Bridges by Markov Chain Model
The Markov chain is a stochastic process applied to capture parameter dependency and uncertainty variables such as load and resistance. This model has been commonly used in the last decade for predicting the deterioration state of different infrastructure systems. It was applied based on the concept of predicting the deterioration of each element by accumulating its probability of transferring from one condition state to another at a given time. The model depends on the transition probability matrix [TPM] that is used to express the chance of changing from one condition state to another [29]. Later, the prediction model utilising the Markov chain for condition deterioration for the Indian Department of Highways (IDOH) was developed by Jiang et al. [30]. There are no [TPMs] in the literature that can be generalised to all bridges all over the world because there are many factors that could affect it, such as average daily traffic, age, rehabilitation or replacement activity, etc. However, the biggest challenge in the Markov chain is how to create a transition probability matrix for each component in the bridge and update it in case of the availability of new data. Therefore, it is important to generate this matrix and customise it to specific conditions by optimization. This study assumed that the condition rating would not decrease by more than one state in a single year. There are some points that should be considered while applying Markov analysis:
1- The initial state of the system and the probability distribution of the initial state are known.
2- The transition probabilities are assumed to be stationary over time and independent of how the state (i) was reached.
3- After construction, the condition rating was assumed to be (9) on the FHWA rating scale.
4- The system is defined by a set of finite states, and the system can be in only one state at a given time.
The maximum rating of bridge components (deck, superstructure, substructure) at age zero is 9, which represents a perfect condition of the bridge. Therefore, the initial state vector IP(0) for any component of a new bridge is [1, 0, 0, ….. 0]. The lowest condition rating to be considered is 3, because if it is less than that, the structure may be closed immediately. R is a vector of condition ratings [9 8 7 6 5 4 3], and R֨ is a transform of R' as shown in equation (6):
2.3.1. Spreadsheet Modelling for Markov Chains
A spreadsheet model for Markov chains has been structured, including all formulations required in cells of Excel 2013. The general model layout is shown in Figure 7.
The upper left is the [TPM], which is multiplied sequentially to raise it to the different powers from 1 to 35. The initial condition state [IP0] at the middle is multiplied by [TPM] to calculate the future condition state [FPt] at any age (t). Finally, the single value of the predicted condition rating is calculated by multiplying [FPt] by the column vector [R֨]. The (Act) is related to the actual condition rating each year.
2.3.2. Optimizing [TPM] Probabilities
Due to the initial [TPMs] arbitrary character, it is likely to produce an inaccurate condition rating. Thus, the objective of the optimization model is to find suitable values of the [TPM] in order to coincide the Markov predicted condition rating curve with the actual curve.
2.3.3. Objective Function
To achieve the optimized model the objective function is to minimize the error between the Markov precdicted condition rating and the actual rating from, summed among the age (A) of the instance being consideredas shown in equation (7)[28,29].
Subject to:
2.3.4. Variables
The diagonal probability values are the Pi,i values in the [TPM], as shown in equation (19). After optimisation was completed, the TPM reached the optimum values, and the Markov prediction became very close to the actual measure, as shown in Figure 8 and Figure 9 respectively.
The formula in the spreadsheet is non-linear; that is called a non-linear programming (NLP) problem and was solved by (SOLVER) which comes with the Excel software. For Non-Linear Programming (NLP), SOLVER uses the Generalised Reduced Gradient method [31].
2.4. Expected the Service Life for the Reinforced Concrete Bridge Elements
The main cause of bridge deterioration could be related to steel corrosion. Carbonation, chloride-induced, and sulphate attacks are the main causes of reinforcement corrosion [32]. This article considers both carbonation and chloride-induced corrosion to estimate the corrosion rate and to predict the bridge service life as shown in the following sections:
2.4.1. Service Life Prediction Based on Carbonation Attack
The corrosion process of embedded steel in concrete is a function of time. The corrosion operation can be divided into three stages. The first stage is called the initiation period, which is the amount of time needed for the carbonation front to reach the depth of the rebar level. The second stage started when the oxide (passive) layer over rebar was lost, which is called depassivation. The last period is the propagation state, which is started with depassivation to achieve the time for cracking or spalling of the concrete cover [33]. Carbonation models typically show a relationship between carbonation depth and structure age. The depth of carbonation depends on many factors, such as water-cement ratio, cement type, and time. Equation (12) is used to determine the depth of carbonation in (mm) [9].
Where;
D: depth of carbonation which is less than maximum carbonation depth with (5 mm-10 mm)
T: time for carbonation till reach embedded steel bars
C: coefficient of carbonation
The coefficient of carbonation can be found by the following equation (13) [24]:
Where;
w/c: water cement ratio
C1: constant based on type of cement as shown in Table 12
C2: constant based on the atmospheric condition of concrete as shown in Table 13
The time required for developing corrosion rate based on carbonation depth can be calculated using the following equation (14) [24]:
Where;
T2: the amount of time needed for corrosion to occur and for concrete to begin to spall.
c.c : thickness of concrete cover
ᵠ : steel bar diameter
f(x) : rate of corrosion (mm/year) that is estimated based on equations (2),(3),and(4).
T1 and T2 can be calculated as following;
Let’ assume
Thus;
2.4.2. Life-365 Model for Service Life Prediction Due to Chloride-Induced
The Life 365 model is used to estimate the service life and life cycle cost based on various methods of corrosion protection. This model predicted the service life for concrete structures exposed to chloride environments and not cover corrosion due to carbonation. Life-365 applies the ASTM C1556 [34] method, which uses computations from field data to estimate the maximum surface chloride concentration. The main parameters needed for the service life prediction are the concrete cover, the properties of concrete (mainly diffusion coefficient), chloride threshold, and surface chloride [35,36]. The corrosion initiation is the time for chlorides to penetrate concrete to the level of steel and reach the corrosion threshold, while the propagation time is the time to cracking (service life). The model predicts the initiation period based on Fickian diffusion. Life 365 considers the temperature-dependent changes in diffusion equation (21) [35]:
Where;
D(T): diffusion coefficient at time t and temperature T
Dref: diffusion coefficient at time tref =28 days and temperature Tref = 293K (20°C),
U: activation energy of the diffusion process (35000 J/mol),
R: gas constant, and
T: absolute temperature.
In the Life 365 model, the propagation period is fixed at 6 years, which is usually faster and shorter than the initiation period, unless epoxy coating is used to increase the period to 20 years [37]. This value is determined based on a previous study by Weyers and others [38,39], who found that the period required between corrosion to initiate and cracking was 3 to 7 years on bridge decks in the USA. Nevertheless, users can change the propagation period based on their expertise [39].
3. Discussion & Validation
The proposed approach to diagnosis and maintenance decision-making applies to a real bridge. The gathering data was taken from the General Authority for Roads and Bridges (GARB) and the Ministry of Transportation (MOT). The bridge is a reinforced concrete box girder located near the Suez Gulf in Egypt. It was built in 2004, and after 20 years, it shows several types of damage (cracks, spalling, etc.). In 2024, a special committee was formed to assess the bridge's performance and take appropriate action regarding its situation. The data gathering, visual inspection reports, and tests of this committee were studied carefully to apply the proposed method. The inspectors add the rate for each bridge element based on visual inspection, their expertise, measuring instruments such as calipers, and some tests. The experts found that after twenty years, the Bridge Condition Rating (BCR) dropped from 9 to 4.36. It should be mentioned here that the rehabilitation decision was taken by the revising committee, and the bridge has been in service since then. Investigating and estimating the condition rating of the R.C. box bridge due to the dual proposed models is shown in the following sections:
3.1. Data Gathering, Historical Data, Inventory of R.C. Bridge Elements
All the inventory, including bridge geometry, was collected from the General Authority for Roads and Bridges (GARB). Numerous photos are taken to reflect the bridge's general conditions from different elements (girders, abutments, slabs, and wing walls). The images in Figure 10 show that bridge elements are suffering from several defects, such as cracks, spalling, rebar exposure, and rust staining due to rebar corrosion. The images of any defects found in the bridge elements are collected and classified, such as cracks, spalling, etc. The required tests were applied and the results were reported, such as ground penetrating radar, ultrasonic pulse velocity, half-cell potential, compressive strength, chloride content, etc., to investigate and evaluate the damage for each defected element in the reinforced concrete bridge. For durability assessment tests, there should be combinations between destructive and nondestructive tests.
3.3. Expected the Service Life for Bridge Elements Due to Carbonation and Chloride-Induced
Carbonation, chloride ingress, and sulphate attack are the main causes of reinforcement corrosion. According to laboratory testing, the average sulfate content was lower than the allowable limits, therefore the sulfate attack will not have a significant effect on concrete. The R.C. bridge service life will be estimated due to carbonation and chloride-induced as shown in the following sections:
3.3.1. Corrosion Due to Carbonation for Bridge Elements
A carbonation test was applied for samples taken from the bridge to find the maximum carbonation depth to be applied in equation (11). Compensating with a parameter extracted from historical data to get the value of “C” and substitute in equation (12) to calculate T1. Also, T2 (propagation time), the time required for corrosion to cause spalling of concrete cover, can be calculated by equation (14). Hence, the total time of corrosion, T, must equal the sum of T1 and T2; refer to equation (20) and the summary in Appendix Table A1.
3.3.2. Chloride Induced Corrosion of Reinforcing Steel
3.4. Condition Assessment for R.C Bridges Due to Dual Approach, 1) Fuzzy Logic Analysis Technique, 2) Markov Chain Model
3.4.1. Fuzzy Decision Model
In this stage, a fuzzy analysis technique is implemented by MATLAB (R2021a) to estimate the bridge condition rating based on the relationship between concrete surface condition and corrosion degree, as discussed in the previous section. The triangular membership function is applied for both inputs and outputs, as shown in Figure 5, because of the narrow peak of its absolute membership compared to the trapezoidal membership function, where the peak (absolute membership) is shown through the interval. Triangular shape introduces fuzzy numbers, while fuzzy intervals are represented by trapezoidal shape.
For G1L1 :
The first input corrosion rate = 0.065 mm/yr The corrosion degree is Condition 1 (low)
The second input is Concrete surface condition (Obvious) Subjective assessment is 4.
Then the semi-quantitative condition rate = 4 as shown in in rule viewer Figure 11.
The result from fuzzy analysis for each element in the bridge is shown in Table 14.
3.4.2. Markov Chain Analysis
The bridge was built in 2004. In 2024, there is an evaluation and rehabilitation work. The service life of the bridge at the time of rehabilitation is 20 years. Markov chain analysis will be applied to determine the current and future conditions of the current bridge. The transition probability matrix for the deck, superstructure, and substructure of the three bridge parts was created in this model. Due to laboratory tests for carbonation and chloride profiles, the service life is calculated for each element, and found that the girder (G3L1) has the shortest service life of 20 years. To find the [TPM], Matlab R2021a is applied to solve the equation, as shown in Figure 12.
The summary of the condition rating for each element and the overall bridge condition rating based on FHWA (2012) [22] are shown in Table 15 and calculated based on each element weight as shown in Table 3 and equation (1).
Also, the difference between the actual condition rating from historical data for each year and the predicted condition rating from the model is shown for each previous element in Figure 13, Figure 14, Figure 15, Figure 16 and Figure 17.
Predicting the future condition rating based on the Markov Chain Model (MCM) has been discussed previously. The model predicted the deterioration of the slabs, girders, diaphragm, abutment, and wing wall of the current bridge study. The Table A2, Table A3, Table A4, Table A5 and Table A6 in the appendix show when each element will reach a condition rating of 3, which is the critical condition rating. The bridge will reach a condition rating of 3 after 78 years. The results from the dual artificial intelligence techniques differ from the result reported from the bridge expert report of the validated case, as shown in Figure 18. The fuzzy decision model and the Markov Chain model required both field and laboratory tests to find and calculate essential parameters such as carbonation depth, diffusion coefficient, surface chloride, and others. Nevertheless, fuzzy analysis is communicated with ranges that make it less accurate than other methods. Additionally, fuzzy is suffering from the redundancy, which is one of the problems of linguistic fuzzy IF-THEN rules. While MCM depends on field tests, laboratory tests, and historical data, which is required in optimization process to coincide the Markov predicted condition rating curve with the actual curve. Selection of the proper decision regarding the estimated condition rating of the inspected bridges relies on strategy maintenance options as per FHWA, 2012, as shown in Table 1. The two different results of the current condition rating show that the inspected bridge required major rehabilitation.
4. Conclusions
This research has aimed to apply artificial intelligence in assessing reinforced concrete bridges. The study compares two different methods that relied on visual inspection, historical data, bridge inventory and field and laboratory tests to diagnose the bridge reinforcement concrete diseases. The techniques applied in the study are fuzzy decision-making and Markov chain modelling to determine the overall bridge condition rating. The Federal Highway Administration classification system (FHWA, 2012) is adopted in the current study to categorise the deterioration of reinforced concrete bridges into ten ratings. The weight evaluation method (WEM) is applied to justify the NY rating system for ranking elements of R.C. bridges in Egypt. The corrosion is considered the main reason for bridge deterioration. Therefore, the service life for the bridge is estimated due to carbonation and chloride attack. The Life 365 model is used to determine the service life due to chloride ingress. The current method established a fuzzy decision-making model to find a correlation between concrete surface condition and corrosion degree to estimate the current rating for each bridge element. Then, the Markov chain model has been used for predicting the deterioration state for each element and the whole bridge. Finally, the inspector is able to estimate when the bridge will achieve the critical condition at scale 3 based on the FHWA, 2012 rating to take the proper decision. The different results from the dual models of condition rating are applicable. Although the fuzzy decision model depends on both field and laboratory tests, the technique is communicated with ranges that make it less accurate and is suffering from redundancy. In contrast, MCM depends on field tests, laboratory tests, and historical data, which is necessary for the optimisation process in order to minimise the error between the Markov predicted condition rating and the actual rating. Therefore, the assessment derived from MCM is the closest to that obtained by bridge inspector experts of the validated case. From the obtained results, the suggested models would assist the bridge inspector experts and decision-makers in the bridge management sector to achieve appropriate assessment to create a systematic plan for the bridge's eventual maintenance, repair, or rehabilitation. The future works are encouraged to apply other types of AI in bridge assessment and make a comparison between them to select the more applicable technique. Also, they are recommended to concentrate on selecting the proper action based on the cost, duration, efficiency, and urgency of the most deteriorated areas. The proposed techniques can be developed to be carried out on the other types of bridges, such as steel bridges, precast concrete, etc.
Author Contributions
Conceptualization, Ahmed Mohammed Abdelalim, GAMAL EBRAHIM and Mohamed Badawy; Data curation, Ahmed Mohammed Abdelalim, Yasmin Shalaby and Mohamed Badawy; Formal analysis, Ahmed Mohammed Abdelalim, Yasmin Shalaby and Mohamed Badawy; Funding acquisition, Ahmed Mohammed Abdelalim; Investigation, Ahmed Mohammed Abdelalim, Yasmin Shalaby and Mohamed Badawy; Methodology, Ahmed Mohammed Abdelalim, Yasmin Shalaby and Mohamed Badawy; Project administration, Ahmed Mohammed Abdelalim, GAMAL EBRAHIM and Mohamed Badawy; Resources, Ahmed Mohammed Abdelalim; Software, Ahmed Mohammed Abdelalim, Yasmin Shalaby and Mohamed Badawy; Supervision, Ahmed Mohammed Abdelalim, GAMAL EBRAHIM and Mohamed Badawy; Validation, Ahmed Mohammed Abdelalim, Yasmin Shalaby, GAMAL EBRAHIM and Mohamed Badawy; Visualization, Ahmed Mohammed Abdelalim, Yasmin Shalaby and Mohamed Badawy; Writing – original draft, Ahmed Mohammed Abdelalim, Yasmin Shalaby and Mohamed Badawy; Writing – review & editing, Ahmed Mohammed Abdelalim and Yasmin Shalaby.
Funding
Not applicable
Institutional Review Board Statement
Not applicable.
Informed Consent Statement
Not applicable.
Data Availability Statement
Any data used during the study can be accessed when request
Conflicts of Interest
The authors declare no conflict of interest.
Abbreviations
The following abbreviations are used in this manuscript:
| AI | Artificial Intelligence |
| MRR | Maintenance, Repair, and Replacement |
| RC | Reinforced concrete |
| BMS | Bridge Management System |
| GPR | Ground Penetrating Radar |
| AASHTO | American Association of State Highway and Transportation Officials |
| GARB | General Authority for Roads and Bridges |
| MCM | Markov Chain Modelling |
| WEM | Weight Evaluation Method |
| BCR | Bridge Condition Rating |
| TPM | Transition Probability Matrix |
| FHWA | Federal Highway Administration classification system |
| NY | New York ranking system |
Appendix A

Table A1.
Summary of corrosion characteristics for bridge elements.
| Element Parameter |
S1L1 | S6L1 | G1L1 | G2L1 | G3L1 | G4L1 | G5L1 | D1L1 | AB1 | AB2 | W21 | W22 | |
|---|---|---|---|---|---|---|---|---|---|---|---|---|---|
| Primary Evaluation | 4 | 5 | 4 | 4 | 5 | 4 | 4 | 4 | 4 | 4 | 4 | 5 | |
| pH-value | 7.38 | 12.28 | 7.28 | 13.41 | 13.12 | 7.18 | 13.66 | 8 | 13.99 | 11.98 | 12.71 | 13.12 | |
| Rate of corrosion due to pH (mm/yr.) | 0.13 | 0.08 | 0.25 | 0.03 | 0.042 | 0.25 | 0.02 | 0.25 | 0.01 | 0.095 | 0.06 | 0.042 | |
| Concrete resistivity (ohm.cm) | 8000 | 11500 | 8000 | 11800 | 11800 | 8000 | 11800 | 8500 | 11800 | 11200 | 11500 | 11800 | |
| C.C (mm) | 15 | 15 | 15 | 18 | 15 | 15 | 18 | 12 | 18 | 18 | 15 | 15 | |
| Measured carbonation test (mm) (Laboratory test) | 5 | 5 | 5 | 5 | 5 | 5 | 5 | 2 | 5 | 5 | 5 | 5 | |
| Uncarbonated depth (dc)=min cover-carbonation depth | 10 | 10 | 10 | 13 | 10 | 10 | 13 | 10 | 13 | 13 | 10 | 10 | |
| Steel Diameter | 14 | 14 | 22 | 22 | 22 | 22 | 22 | 22 | 25 | 25 | 18 | 18 | |
| T1: initiation period (years) | 25 | 25 | 25 | 42.25 | 25 | 25 | 42.25 | 25 | 42.25 | 42.25 | 25 | 25 | |
| T2: Propagation Period (years) | 0.659 | 1.071 | 0.218 | 2.182 | 1.299 | 0.218 | 3.273 | 0.175 | 5.760 | 0.606 | 1.111 | 1.587 | |
| Tt= T1+T2 (Due to carbonation) | 25.66 | 26.07 | 25.22 | 44.43 | 26.30 | 25.22 | 45.52 | 25.17 | 48.01 | 42.86 | 26.11 | 26.59 | |
| Service life due toChloride Induced (Life -365) | 26.80 | 28.10 | 23.50 | 23.60 | 20.30 | 21.30 | 26.30 | 24.50 | 39.60 | 38.40 | 23.80 | 27.70 |
Table A2.
Actual and predicted condition rating for Diaphragm.
| Time | Predicted CR | Actual CR | Error |
| 1 | 8.90 | 8.95 | 0.05 |
| 2 | 8.78 | 8.75 | 0.03 |
| 3 | 8.65 | 8.6 | 0.05 |
| 4 | 8.49 | 8.55 | 0.06 |
| 5 | 8.32 | 8.3 | 0.02 |
| 6 | 8.11 | 8.01 | 0.10 |
| 7 | 7.87 | 7.87 | 0.00 |
| 8 | 7.61 | 7.62 | 0.01 |
| 9 | 7.33 | 7.35 | 0.02 |
| 10 | 7.04 | 7.1 | 0.06 |
| 11 | 6.75 | 6.75 | 0.00 |
| 12 | 6.46 | 6.46 | 0.00 |
| 13 | 6.18 | 6.3 | 0.12 |
| 14 | 5.91 | 5.98 | 0.07 |
| 15 | 5.66 | 5.66 | 0.00 |
| 16 | 5.42 | 5.32 | 0.10 |
| 17 | 5.20 | 5 | 0.20 |
| 18 | 4.99 | 4.75 | 0.24 |
| 19 | 4.80 | 4.32 | 0.48 |
| 20 | 4.63 | 4 | 0.63 |
| 21 | 4.47 | ||
| 22 | 4.32 | ||
| 23 | 4.19 | ||
| 24 | 4.07 | ||
| 25 | 3.97 | ||
| 26 | 3.87 | ||
| 27 | 3.78 | ||
| 28 | 3.70 | ||
| 29 | 3.63 | ||
| 30 | 3.57 | ||
| 31 | 3.51 | ||
| 32 | 3.46 | ||
| 33 | 3.41 | ||
| 34 | 3.37 | ||
| 35 | 3.33 | ||
| 36 | 3.30 | ||
| 37 | 3.27 | ||
| 38 | 3.24 | ||
| 39 | 3.21 | ||
| 40 | 3.19 | ||
| 41 | 3.17 | ||
| 42 | 3.15 | ||
| 43 | 3.14 | ||
| 44 | 3.12 | ||
| 45 | 3.11 | ||
| 46 | 3.10 | ||
| 47 | 3.09 | ||
| 48 | 3.08 | ||
| 49 | 3.07 | ||
| 50 | 3.06 | ||
| 51 | 3.06 | ||
| 52 | 3.05 | ||
| 53 | 3.05 | ||
| 54 | 3.04 | ||
| 55 | 3.04 | ||
| 56 | 3.03 | ||
| 57 | 3.03 | ||
| 58 | 3.03 | ||
| 59 | 3.02 | ||
| 60 | 3.02 | ||
| 61 | 3.02 | ||
| Time | Predicted CR | Actual CR | Error |
| 62 | 3.02 | ||
| 63 | 3.02 | ||
| 64 | 3.01 | ||
| 65 | 3.01 | ||
| 66 | 3.01 | ||
| 67 | 3.01 | ||
| 68 | 3.01 | ||
| 69 | 3.01 | ||
| 70 | 3.01 | ||
| 71 | 3.01 | ||
| 72 | 3.01 | ||
| 73 | 3.01 | ||
| 74 | 3.00 |
Table A3.
Actual and predicted condition rating for wing wall.
| Time | Predicted CR | Actual CR | Error |
|---|---|---|---|
| 1 | 8.90 | 8.88 | 0.02 |
| 2 | 8.79 | 8.73 | 0.06 |
| 3 | 8.66 | 8.6 | 0.06 |
| 4 | 8.52 | 8.49 | 0.03 |
| 5 | 8.36 | 8.32 | 0.04 |
| 6 | 8.18 | 8.15 | 0.03 |
| 7 | 7.97 | 8 | 0.03 |
| 8 | 7.74 | 7.9 | 0.16 |
| 9 | 7.49 | 7.75 | 0.26 |
| 10 | 7.22 | 7.4 | 0.18 |
| 11 | 6.95 | 6.94 | 0.01 |
| 12 | 6.68 | 6.73 | 0.05 |
| 13 | 6.41 | 6.5 | 0.09 |
| 14 | 6.15 | 6.2 | 0.05 |
| 15 | 5.90 | 5.9 | 0.00 |
| 16 | 5.66 | 5.56 | 0.10 |
| 17 | 5.44 | 5.1 | 0.34 |
| 18 | 5.22 | 4.87 | 0.35 |
| 19 | 5.03 | 4.63 | 0.40 |
| 20 | 4.84 | 4.5 | 0.34 |
| 21 | 4.67 | ||
| 22 | 4.52 | ||
| 23 | 4.38 | ||
| 24 | 4.25 | ||
| 25 | 4.13 | ||
| 26 | 4.02 | ||
| 27 | 3.92 | ||
| 28 | 3.83 | ||
| 29 | 3.75 | ||
| 30 | 3.68 | ||
| 31 | 3.61 | ||
| 32 | 3.55 | ||
| 33 | 3.49 | ||
| 34 | 3.45 | ||
| 35 | 3.40 | ||
| 36 | 3.36 | ||
| 37 | 3.32 | ||
| 38 | 3.29 | ||
| 39 | 3.26 | ||
| 40 | 3.24 | ||
| 41 | 3.21 | ||
| 42 | 3.19 | ||
| 43 | 3.17 | ||
| 44 | 3.16 | ||
| 45 | 3.14 | ||
| 46 | 3.13 | ||
| 47 | 3.11 | ||
| 48 | 3.10 | ||
| 49 | 3.09 | ||
| 50 | 3.08 | ||
| 51 | 3.07 | ||
| 52 | 3.07 | ||
| 53 | 3.06 | ||
| 54 | 3.05 | ||
| 55 | 3.05 | ||
| 56 | 3.04 | ||
| 57 | 3.04 | ||
| 58 | 3.04 | ||
| 59 | 3.03 | ||
| 60 | 3.03 | ||
| 61 | 3.03 | ||
| 62 | 3.02 | ||
| 63 | 3.02 | ||
| Time | Predicted CR | Actual CR | Error |
| 64 | 3.02 | ||
| 65 | 3.02 | ||
| 66 | 3.02 | ||
| 67 | 3.01 | ||
| 68 | 3.01 | ||
| 69 | 3.01 | ||
| 70 | 3.01 | ||
| 71 | 3.01 | ||
| 72 | 3.01 | ||
| 73 | 3.01 | ||
| 74 | 3.01 | ||
| 75 | 3.01 | ||
| 76 | 3.01 | ||
| 77 | 3.00 |
Table A4.
Actual and predicted condition rating for abutment.
| Time | Predicted CR | Actual CR | Error |
|---|---|---|---|
| 1 | 8.91 | 8.88 | 0.03 |
| 2 | 8.80 | 8.69 | 0.11 |
| 3 | 8.68 | 8.56 | 0.12 |
| 4 | 8.54 | 8.45 | 0.09 |
| 5 | 8.38 | 8.4 | 0.02 |
| 6 | 8.20 | 8.25 | 0.05 |
| 7 | 7.99 | 8 | 0.01 |
| 8 | 7.75 | 7.77 | 0.02 |
| 9 | 7.50 | 7.65 | 0.15 |
| 10 | 7.23 | 7.43 | 0.20 |
| 11 | 6.96 | 6.96 | 0.00 |
| 12 | 6.69 | 6.75 | 0.06 |
| 13 | 6.42 | 6.5 | 0.08 |
| 14 | 6.17 | 6.24 | 0.07 |
| 15 | 5.92 | 5.87 | 0.05 |
| 16 | 5.69 | 5.55 | 0.14 |
| 17 | 5.47 | 5.3 | 0.17 |
| 18 | 5.26 | 4.75 | 0.51 |
| 19 | 5.07 | 4.52 | 0.55 |
| 20 | 4.89 | 4 | 0.89 |
| 21 | 4.73 | ||
| 22 | 4.58 | ||
| 23 | 4.44 | ||
| 24 | 4.31 | ||
| 25 | 4.19 | ||
| 26 | 4.09 | ||
| 27 | 3.99 | ||
| 28 | 3.90 | ||
| 29 | 3.82 | ||
| 30 | 3.82 | ||
| 31 | 3.68 | ||
| 32 | 3.62 | ||
| 33 | 3.56 | ||
| 34 | 3.51 | ||
| 35 | 3.46 | ||
| 36 | 3.42 | ||
| 37 | 3.38 | ||
| 38 | 3.35 | ||
| Time | Predicted CR | Actual CR | Error |
| 39 | 3.32 | ||
| 40 | 3.29 | ||
| 41 | 3.26 | ||
| 42 | 3.24 | ||
| 43 | 3.21 | ||
| 44 | 3.20 | ||
| 45 | 3.18 | ||
| 46 | 3.16 | ||
| 47 | 3.15 | ||
| 48 | 3.13 | ||
| 49 | 3.12 | ||
| 50 | 3.11 | ||
| 51 | 3.10 | ||
| 52 | 3.09 | ||
| 53 | 3.08 | ||
| 54 | 3.07 | ||
| 55 | 3.07 | ||
| 56 | 3.06 | ||
| 57 | 3.06 | ||
| 58 | 3.05 | ||
| 59 | 3.05 | ||
| 60 | 3.04 | ||
| 61 | 3.04 | ||
| 62 | 3.03 | ||
| 63 | 3.03 | ||
| 64 | 3.03 | ||
| 65 | 3.03 | ||
| 66 | 3.02 | ||
| 67 | 3.02 | ||
| 68 | 3.02 | ||
| 69 | 3.02 | ||
| 70 | 3.02 | ||
| 71 | 3.01 | ||
| 72 | 3.01 | ||
| 73 | 3.01 | ||
| 74 | 3.01 | ||
| 75 | 3.01 | ||
| 76 | 3.01 | ||
| 77 | 3.01 | ||
| 78 | 3.01 | ||
| 79 | 3.01 | ||
| 80 | 3.01 | ||
| 81 | 3.01 | ||
| 82 | 3.01 | ||
| 83 | 3.01 | ||
| 84 | 3.00 |
Table A5.
Actual and predicted condition rating for Girders.
| Time | Predicted CR | Actual CR | Error |
|---|---|---|---|
| 1 | 8.90 | 8.99 | 0.09 |
| 2 | 8.79 | 8.79 | 0.00 |
| 3 | 8.67 | 8.63 | 0.04 |
| 4 | 8.52 | 8.44 | 0.08 |
| 5 | 8.36 | 8.21 | 0.15 |
| 6 | 8.18 | 8.15 | 0.03 |
| 7 | 7.97 | 8 | 0.03 |
| 8 | 7.74 | 7.9 | 0.16 |
| 9 | 7.49 | 7.75 | 0.26 |
| 10 | 7.22 | 7.4 | 0.18 |
| 11 | 6.95 | 6.94 | 0.01 |
| 12 | 6.68 | 6.73 | 0.05 |
| 13 | 6.41 | 6.5 | 0.09 |
| 14 | 6.15 | 6.2 | 0.05 |
| 15 | 5.90 | 5.9 | 0.00 |
| 16 | 5.66 | 5.56 | 0.10 |
| 17 | 5.44 | 5.1 | 0.34 |
| 18 | 5.23 | 4.87 | 0.36 |
| 19 | 5.03 | 4.63 | 0.40 |
| 20 | 4.85 | 4.2 | 0.65 |
| 21 | 4.68 | ||
| 22 | 4.52 | ||
| 23 | 4.38 | ||
| 24 | 4.25 | ||
| 25 | 4.13 | ||
| 26 | 4.02 | ||
| 27 | 3.93 | ||
| 28 | 3.84 | ||
| 29 | 3.76 | ||
| 30 | 3.68 | ||
| 31 | 3.62 | ||
| 32 | 3.56 | ||
| 33 | 3.50 | ||
| 34 | 3.45 | ||
| 35 | 3.41 | ||
| 36 | 3.37 | ||
| 37 | 3.33 | ||
| 38 | 3.30 | ||
| 39 | 3.27 | ||
| 40 | 3.24 | ||
| 41 | 3.22 | ||
| 42 | 3.20 | ||
| 43 | 3.18 | ||
| 44 | 3.16 | ||
| 45 | 3.14 | ||
| 46 | 3.13 | ||
| 47 | 3.12 | ||
| 48 | 3.11 | ||
| 49 | 3.10 | ||
| 50 | 3.09 | ||
| 51 | 3.08 | ||
| 52 | 3.07 | ||
| 53 | 3.06 | ||
| 54 | 3.06 | ||
| 55 | 3.05 | ||
| 56 | 3.05 | ||
| 57 | 3.04 | ||
| 58 | 3.04 | ||
| 59 | 3.03 | ||
| 60 | 3.03 | ||
| 61 | 3.03 | ||
| 62 | 3.02 | ||
| Time | Predicted CR | Actual CR | Error |
| 63 | 3.02 | ||
| 64 | 3.02 | ||
| 65 | 3.02 | ||
| 66 | 3.02 | ||
| 67 | 3.01 | ||
| 68 | 3.01 | ||
| 69 | 3.01 | ||
| 70 | 3.01 | ||
| 71 | 3.01 | ||
| 72 | 3.01 | ||
| 73 | 3.01 | ||
| 74 | 3.01 | ||
| 75 | 3.01 | ||
| 76 | 3.01 | ||
| 77 | 3.01 | ||
| 78 | 3.00 |
Table A6.
Actual and predicted condition rating for Slabs.
| Time | Predicted CR | Actual CR | Error |
|---|---|---|---|
| 1 | 8.90 | 8.77 | 0.13 |
| 2 | 8.79 | 8.63 | 0.16 |
| 3 | 8.66 | 8.45 | 0.21 |
| 4 | 8.52 | 8.21 | 0.31 |
| 5 | 8.36 | 8.15 | 0.21 |
| 6 | 8.17 | 8 | 0.17 |
| 7 | 7.96 | 7.99 | 0.03 |
| 8 | 7.73 | 7.73 | 0.00 |
| 9 | 7.48 | 7.55 | 0.07 |
| 10 | 7.22 | 7.4 | 0.18 |
| 11 | 6.95 | 6.94 | 0.01 |
| 12 | 6.68 | 6.73 | 0.05 |
| 13 | 6.41 | 6.5 | 0.09 |
| 14 | 6.15 | 6.2 | 0.05 |
| 15 | 5.90 | 5.9 | 0.00 |
| 16 | 5.66 | 5.56 | 0.10 |
| 17 | 5.43 | 5.1 | 0.33 |
| 18 | 5.22 | 4.87 | 0.35 |
| 19 | 5.02 | 4.63 | 0.39 |
| 20 | 4.84 | 4.5 | 0.34 |
| 21 | 4.67 | ||
| 22 | 4.52 | ||
| 23 | 4.37 | ||
| 24 | 4.24 | ||
| 25 | 4.13 | ||
| 26 | 4.02 | ||
| 27 | 3.92 | ||
| 28 | 3.83 | ||
| 29 | 3.75 | ||
| 30 | 3.68 | ||
| 31 | 3.61 | ||
| 32 | 3.55 | ||
| 33 | 3.50 | ||
| 34 | 3.45 | ||
| 35 | 3.40 | ||
| 36 | 3.36 | ||
| 37 | 3.33 | ||
| 38 | 3.27 | ||
| 39 | 3.27 | ||
| 40 | 3.24 | ||
| 41 | 3.22 | ||
| Time | Predicted CR | Actual CR | Error |
| 42 | 3.19 | ||
| 43 | 3.18 | ||
| 44 | 3.16 | ||
| 45 | 3.14 | ||
| 46 | 3.13 | ||
| 47 | 3.12 | ||
| 48 | 3.10 | ||
| 49 | 3.09 | ||
| 50 | 3.08 | ||
| 51 | 3.08 | ||
| 52 | 3.07 | ||
| 53 | 3.06 | ||
| 54 | 3.06 | ||
| 55 | 3.05 | ||
| 56 | 3.04 | ||
| 57 | 3.04 | ||
| 58 | 3.04 | ||
| 59 | 3.03 | ||
| 60 | 3.03 | ||
| 61 | 3.03 | ||
| 62 | 3.02 | ||
| 63 | 3.02 | ||
| 64 | 3.02 | ||
| 65 | 3.02 | ||
| 66 | 3.02 | ||
| 67 | 3.01 | ||
| 68 | 3.01 | ||
| 69 | 3.01 | ||
| 70 | 3.01 | ||
| 71 | 3.01 | ||
| 72 | 3.01 | ||
| 73 | 3.01 | ||
| 74 | 3.01 | ||
| 75 | 3.01 | ||
| 76 | 3.01 | ||
| 77 | 3.00 |
References
- General authority for roads and bridges (GARB), Arab Republic of Egypt (July 2015). The project for improvement of the bridge management capacity. Project completion report.
- Figueiredo, E., Moldovan, I., & Marques, M. B. (2013). Condition Assessment of Bridges: Past, Present, and Future. A Comple mentary Approach. Universidade Católica Editora.
- AASHTO — American Association of State Highway and Transportation Officials (2008). Bridging the Gap: Restoring and Rebuilding the Nation’s Bridges. July.
- Herrmann AW. ASCE 2013 report card for america's infrastructure. International Association for Bridge and Structural Engineering; 2013:9-10.
- Omar, T., & Nehdi, M. L. (2018). Condition assessment of reinforced concrete bridges: Current practice and research challenges. Infrastructures, 3(3), 36. [CrossRef]
- Abdelalim, A. M., Shalaby, Y., Ebrahim, G. A., & Badawy, M. (2024). An Article Review on Vision-Based Defect Detection Technologies for Reinforced Concrete Bridges. Ann Civ Eng Manag, 1(1), 01-17. [CrossRef]
- Transportation Officials. Subcommittee on Bridges. (2018). The manual for bridge evaluation. AASHTO.
- Kim, H., Ahn, E., Shin, M., & Sim, S. H. (2019). Crack and noncrack classification from concrete surface images using machine learning. Structural Health Monitoring, 18(3), 725-738. [CrossRef]
- Ali Mohamed, N., Mohammed Abdel-Alim, A., Hamdy Ghith, H., & Gamal Sherif, A. (2020). Assessment and Prediction Planning of RC Structures Using BIM Technology. Engineering Research Journal, 167, 394-403. [CrossRef]
- Abdelalim, A.M. and Said, S.O.M., 2021. “Dynamic labor tracking system in construction project using BIM technology”, International Journal of Civil and Structural Engineering Research ISSN 2348-7607 (Online), Vol. 9, Issue 1, pp: (10-20), Month: April 2021 - September 2021.
- Shawky, K. A., Abdelalim, A. M., & Sherif, A. G. (2024). Standardization of BIM Execution Plans (BEP’s) for Mega Construction Projects: A Comparative and Scientometric Study. [CrossRef]
- Shehab, A., & Abdelalim, A. M. Utilization BIM for Integrating Cost Estimation and Cost Control Using BIM in Construction Projects, 2023.
- Abdelalim, A. M., & Abo. elsaud, Y. (2019). Integrating BIM-based simulation technique for sustainable building design. In Project Management and BIM for Sustainable Modern Cities: Proceedings of the 2nd GeoMEast International Congress and Exhibition on Sustainable Civil Infrastructures, Egypt 2018–The Official International Congress of the Soil-Structure Interaction Group in Egypt (SSIGE) (pp. 209-238). Springer International Publishing. [CrossRef]
- Abdelalim, A. M. (2019). A novel diagnostic prognostic approach for rehabilitated RC structures based on integrated probabilistic deterioration models. International Journal of Decision Sciences, Risk and Management, 8(3), 119-134. [CrossRef]
- Abdelalim, A.M., Nahla Ali Mohamed fahmy, Hatem Hamdy Ghith, Alaa Gamal sheriff (2020). Condition Assessment and Deterioration Prediction of RC Structures, International Journal of Civil and StructuralEngineering Research, 8(1), 173-181, available at: https://www.researchpublish.com/papers/condition-assessment-and-deterioration-prediction-of-rc-structures.
- Alsharqawi, M., Zayed, T., & Abu Dabous, S. (2020). Integrated condition-based rating model for sustainable bridgeManagement. Journal of Performance of Constructed Facilities, 34(5), 04020091. [CrossRef]
- Rhee, J. Y., Park, K. E., Lee, K. H., & Kee, S. H. (2020). A practical approach to condition assessment of asphalt-covered concrete bridge decks on Korean expressways by dielectric constant measurements using air-coupled GPR. Sensors, 20(9), 2497. [CrossRef]
- Rogulj, K., Kilić Pamuković, J., & Jajac, N. (2021). Knowledge-based fuzzy expert system to the condition assessment of historic road bridges. Applied Sciences, 11(3), 1021. [CrossRef]
- Xia, Y., Lei, X., Wang, P., & Sun, L. (2022). A data-driven approach for regional bridge condition assessment using inspection reports. Structural Control and Health Monitoring, 29(4), e2915. [CrossRef]
- Bertagnoli, G., Ferrara, M., Miceli, E., Castaldo, P., & Giordano, L. (2024). Safety assessment of an existing bridge deck subject to different damage scenarios through the global safety format ECOV. Engineering Structures, 306, 117859. [CrossRef]
- Shivam, S. (2024). Efficient Bridge Management System: A Comprehensive Approach for Sustainability of Bridge. Chemical Health Risks, JCHR (2024) 14(3), 1831-1845 (2251–6727).
- FHWA, N. (2012). Bridge inspector’s reference manual.
- Egyptian standard code for planning, designing, and constructing bridges and intersections (2015), No. (207/10).
- Abdelalim, A. M. (2010) ' Safety Assessment In The Rehabilitation Of RC Structures' Ain Shams University.
- Lin, S. S., Shen, S. L., Zhou, A., & Xu, Y. S. (2021). Risk assessment and management of excavation system based on fuzzy set theory and machine learning methods. Automation in Construction, 122, 103490.28. [CrossRef]
- Hachani, D., & Ounelli, H. (2008). Membership functions generation based on density function. Computational Intelligence and Security.
- Elbeltagi, E., Hosny, O. A., Elhakeem, A., Abd-Elrazek, M. E., & Abdullah, A. (2011). Selection of slab formwork system using fuzzy logic. Construction Management and Economics, 29(7), 659-670. [CrossRef]
- Bowman, M. D. (1988). The development of optimal strategies for maintenance, rehabilitation and replacement of highway bridges, Vol. 1: The elements of the Indiana bridge management system (IBMS). [CrossRef]
- Yeo, G. L., & Cornell, C. A. (2009). Building life-cycle cost analysis due to mainshock and aftershock occurrences. Structural safety, 31(5), 396-408.31. [CrossRef]
- Jiang, Y., Sinha, K. C., Saito, M., Murthy, S., Tee, A. B., & Bowman, M. D. (1990). The development of optimal strategies for maintenance, rehabilitation and replacement of highway bridges, Vol. 1: The elements of the Indiana bridge management system (IBMS).
- Elhakeem, A. A. (2005). An asset management framework for educational buildings with life-cycle cost analysis. Waterloo: University of Waterloo.
- Hu, J. Y., Zhang, S. S., Chen, E., & Li, W. G. (2022). A review on corrosion detection and protection of existing reinforced concrete (RC) structures. Construction and Building Materials, 325, 126718. [CrossRef]
- Ahmad, S. (2003). Reinforcement corrosion in concrete structures, its monitoring and service life prediction––a review. Cement and concrete . composites, 25(4-5), 459-471. [CrossRef]
- ASTM C 1556 – 04 (2009) ASTM C 1556: Standard Test Method for Determining the Apparent Chloride Diffusion Coefficient of Cementitious Mixtures by Bulk Diffusion.
- Riding, K. A., Thomas, M. D., & Folliard, K. J. (2013). Apparent diffusivity model for concrete containing supplementary cementitious materials. ACI Materials Journal, 110(6), 705-714.
- Mangat, P. S., and Molloy, B. T., “Prediction of Long Term Chloride Concentrations in Concrete,” Materials and Structures, V. 27, 1994, pp. 338-346. [CrossRef]
- Kirkpatrick, T. J., Weyers, R. E., Anderson-Cook, C. M., & Sprinkel, M. M. (2002). Probabilistic model for the chloride-induced corrosion service life of bridge decks. Cement and concrete research, 32(12), 1943-1960. [CrossRef]
- Weyers, R.E., Fitch, M.G., Larsen, E.P., Al-Quadi, I.L., Chamberlin, W.P., and Hoffman, P.C., 1993. Concrete Bridge Protection and Rehabilitation: Chemical Physical Techniques, Service Life Estimates, SHRP-S-668, Strategic Highway Research Program, National Research Council, Washington, D.C., 357 p.
- Weyers, R.E. 1998. “Service life model for concrete structures in chloride laden environments.” ACI Materials Journal, Vol. 95 (4), pp. 445-453.
- Ehlen, Mark A., Michael DA Thomas, and Evan C. Bentz. "Life-365 Service Life Prediction Model™ Version 2.2.3 " Concrete international 31, no. 5 (2020).
Figure 1.
Research procedure to apply dual techniques for detecting thr life cycle of RC bridges.
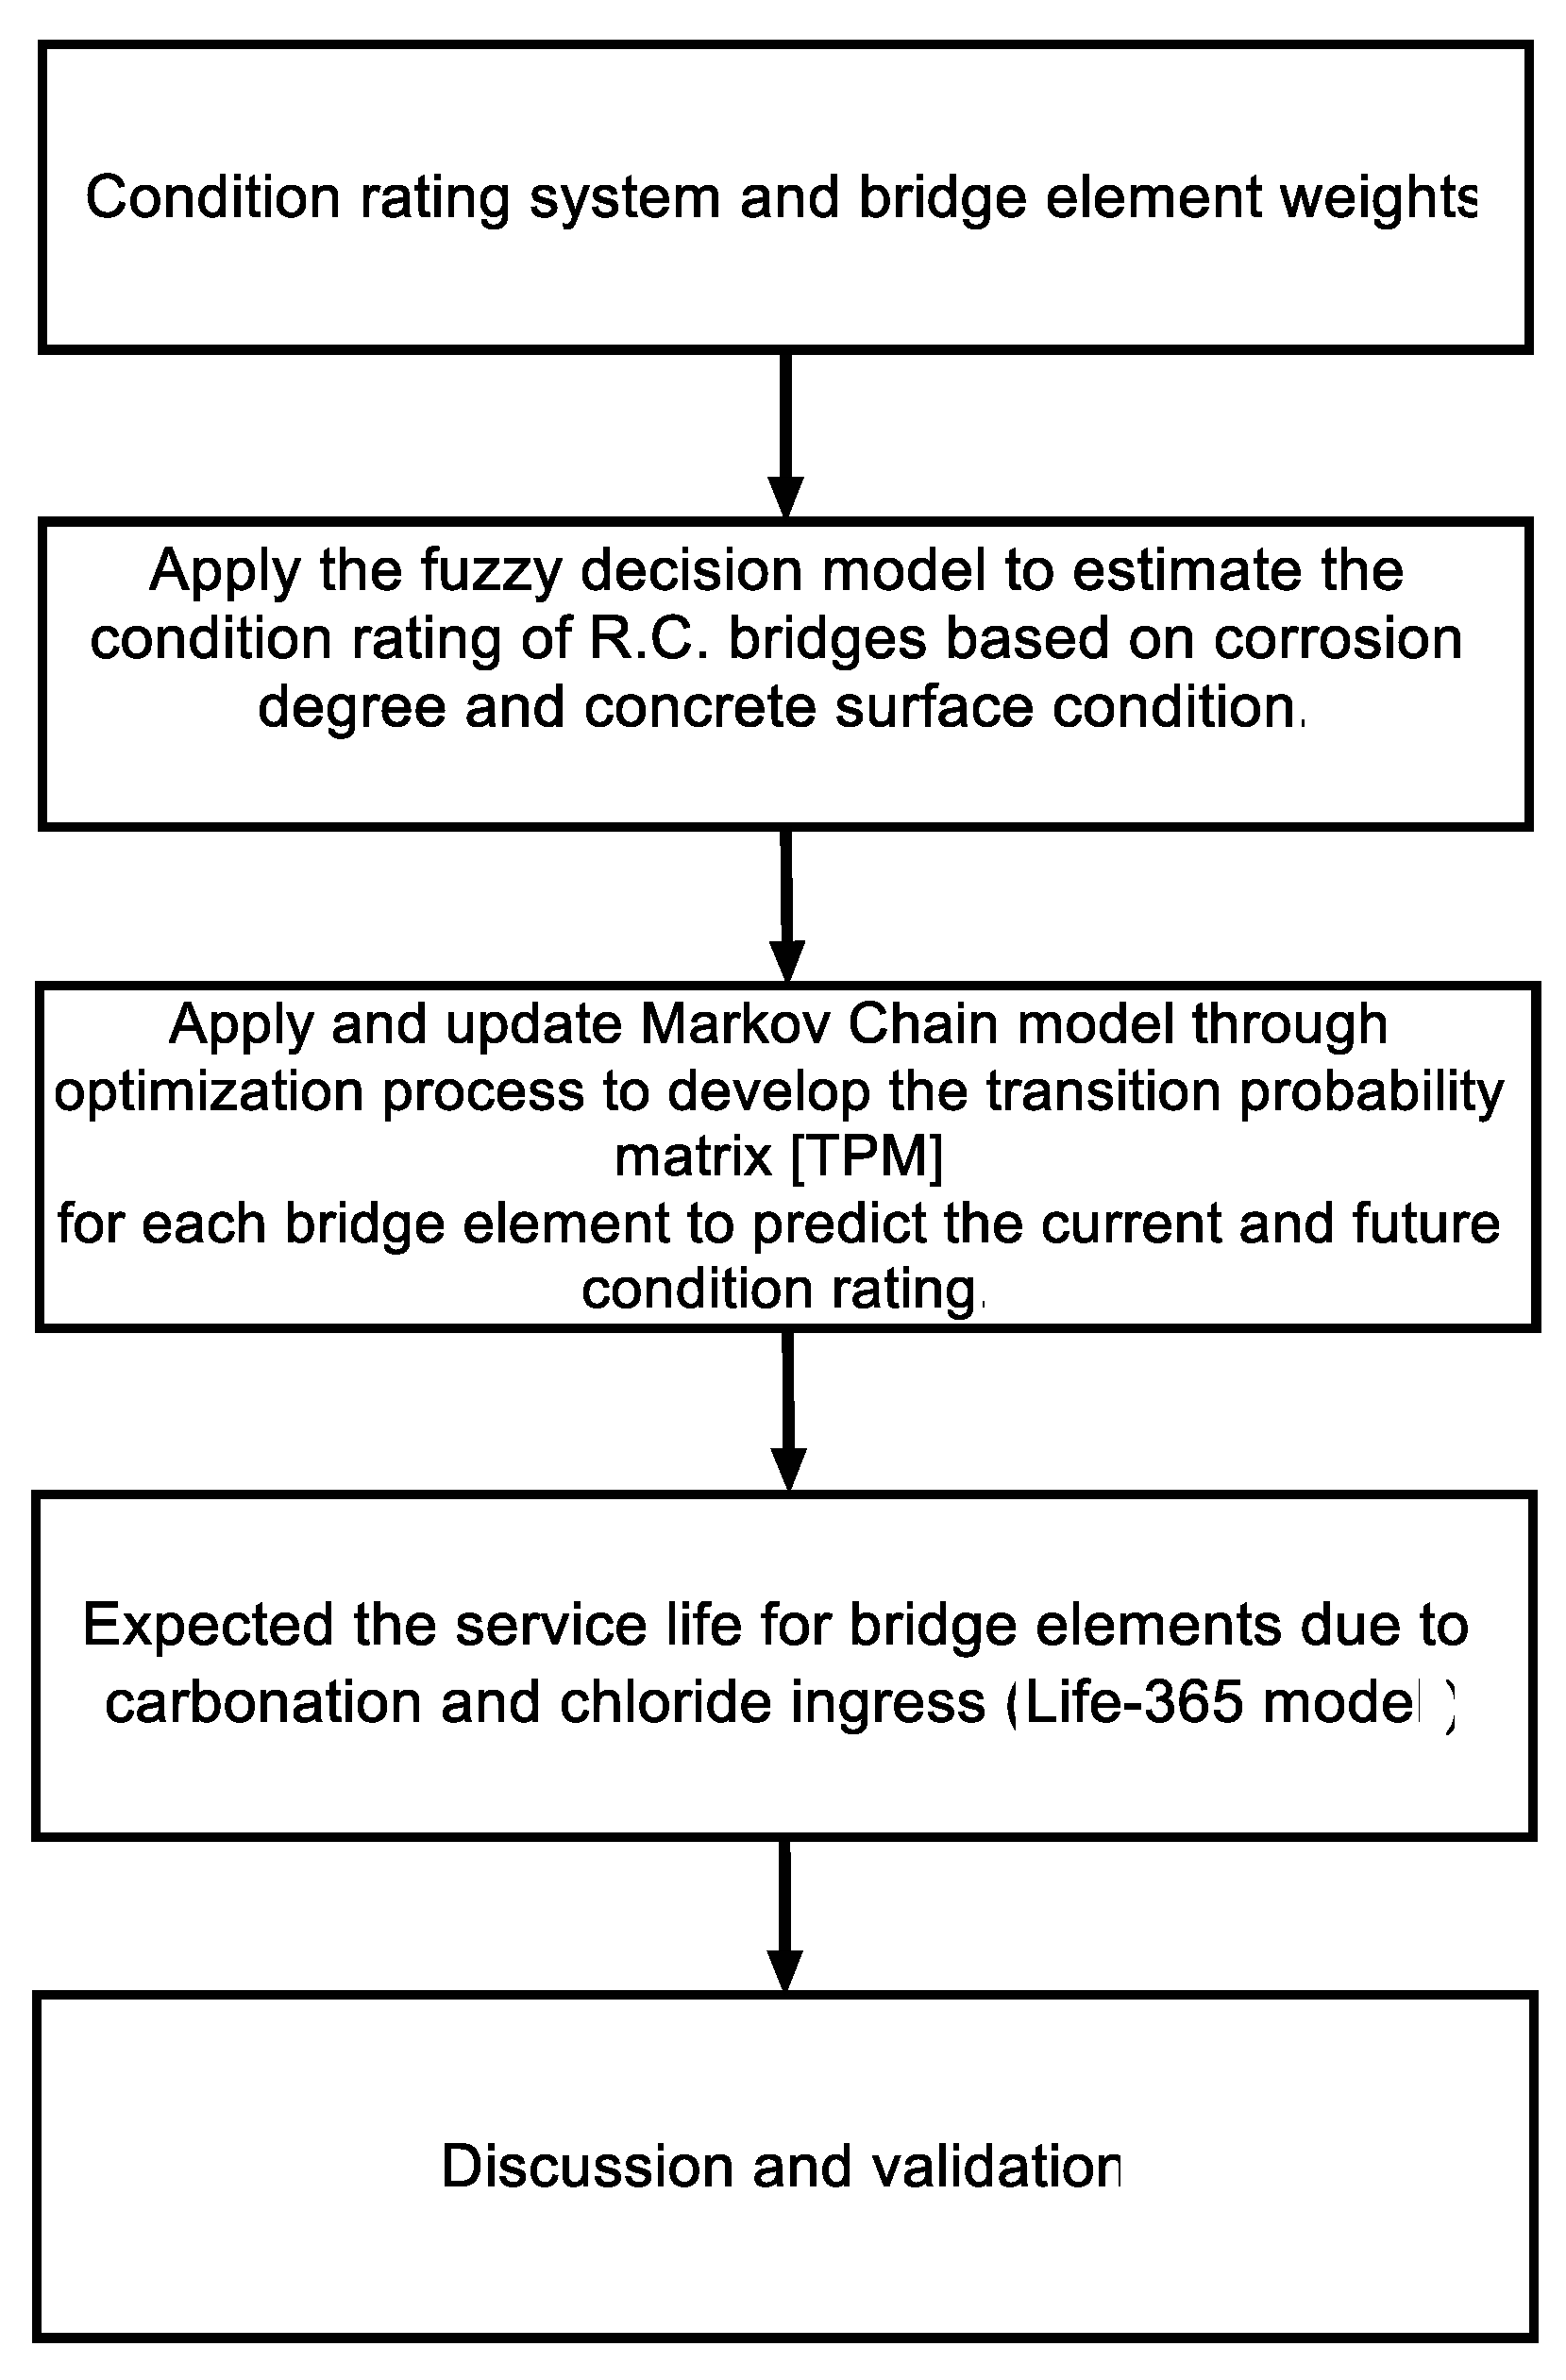
Figure 2.
Fuzzy sets of the input variables (first case) by MATLAB (R2021a): (a) Corrosion degree, (b) Concrete surface condition.
Figure 2.
Fuzzy sets of the input variables (first case) by MATLAB (R2021a): (a) Corrosion degree, (b) Concrete surface condition.
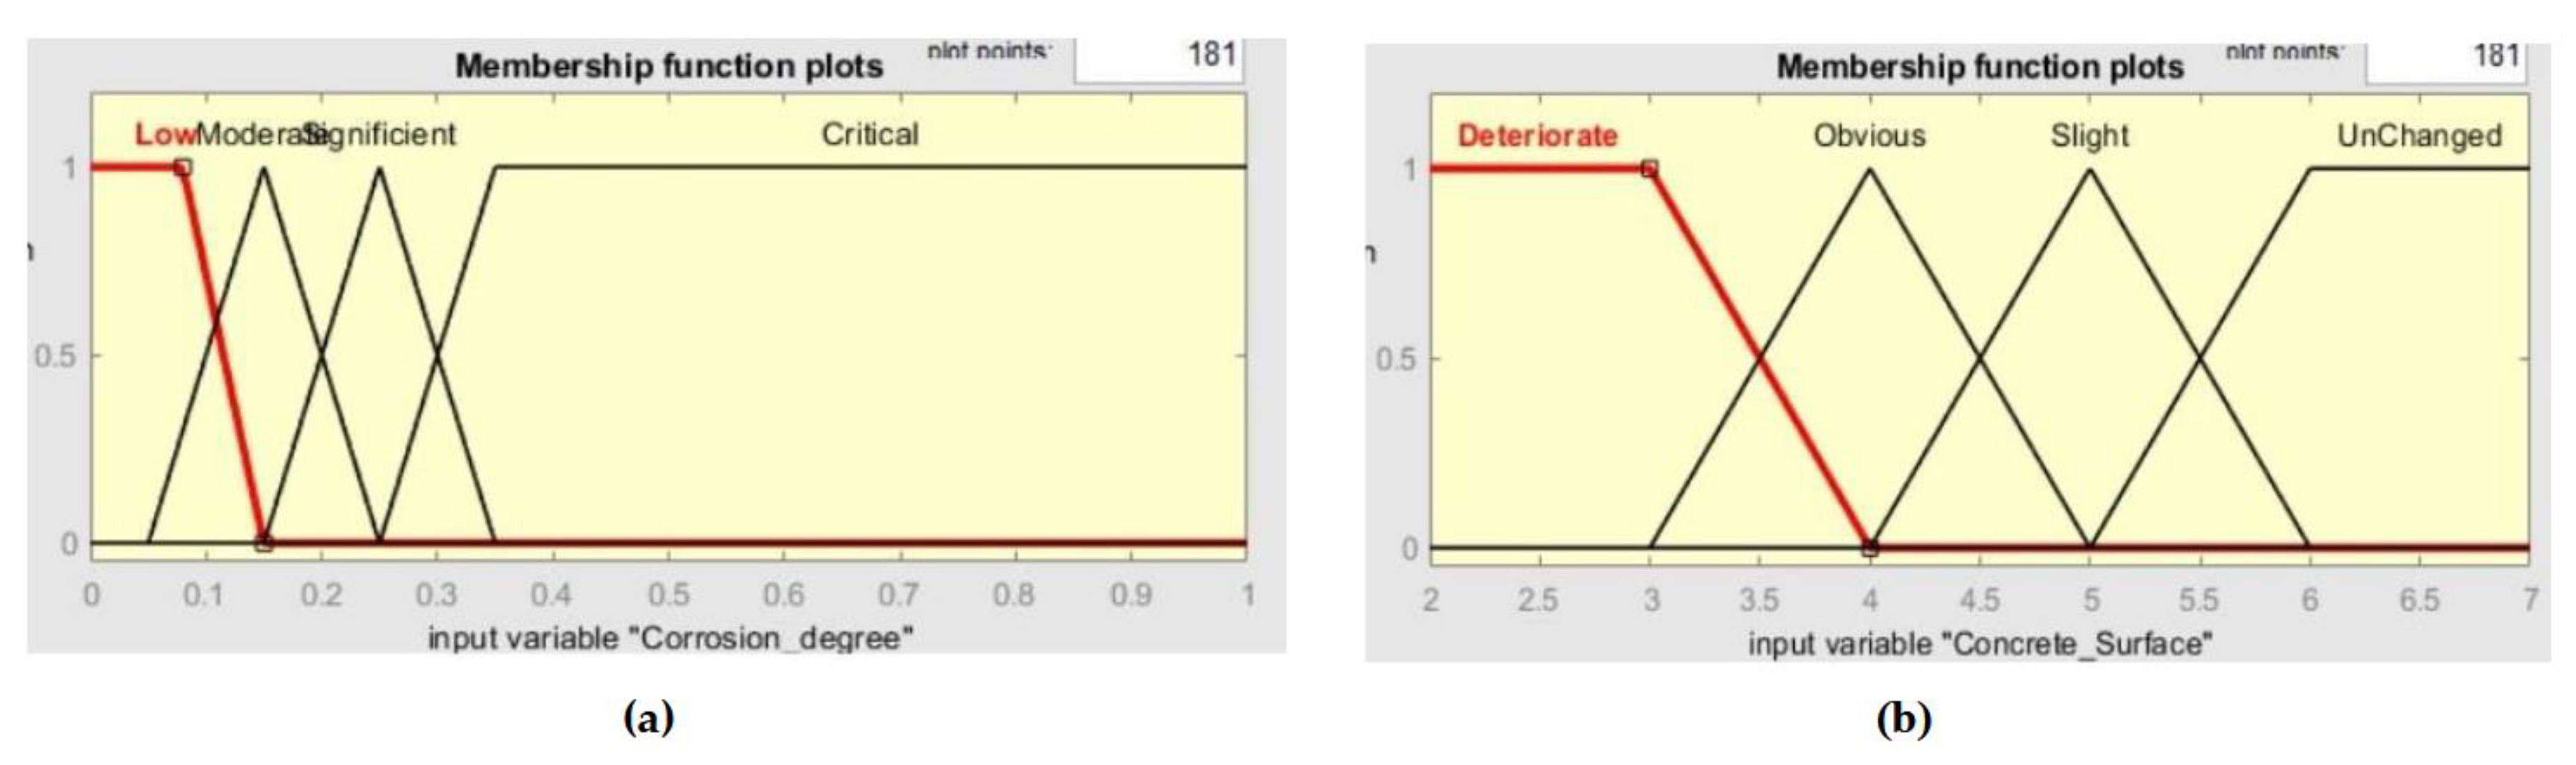
Figure 3.
Fuzzy sets of the output variables (first case) by MATLAB (R2021a).
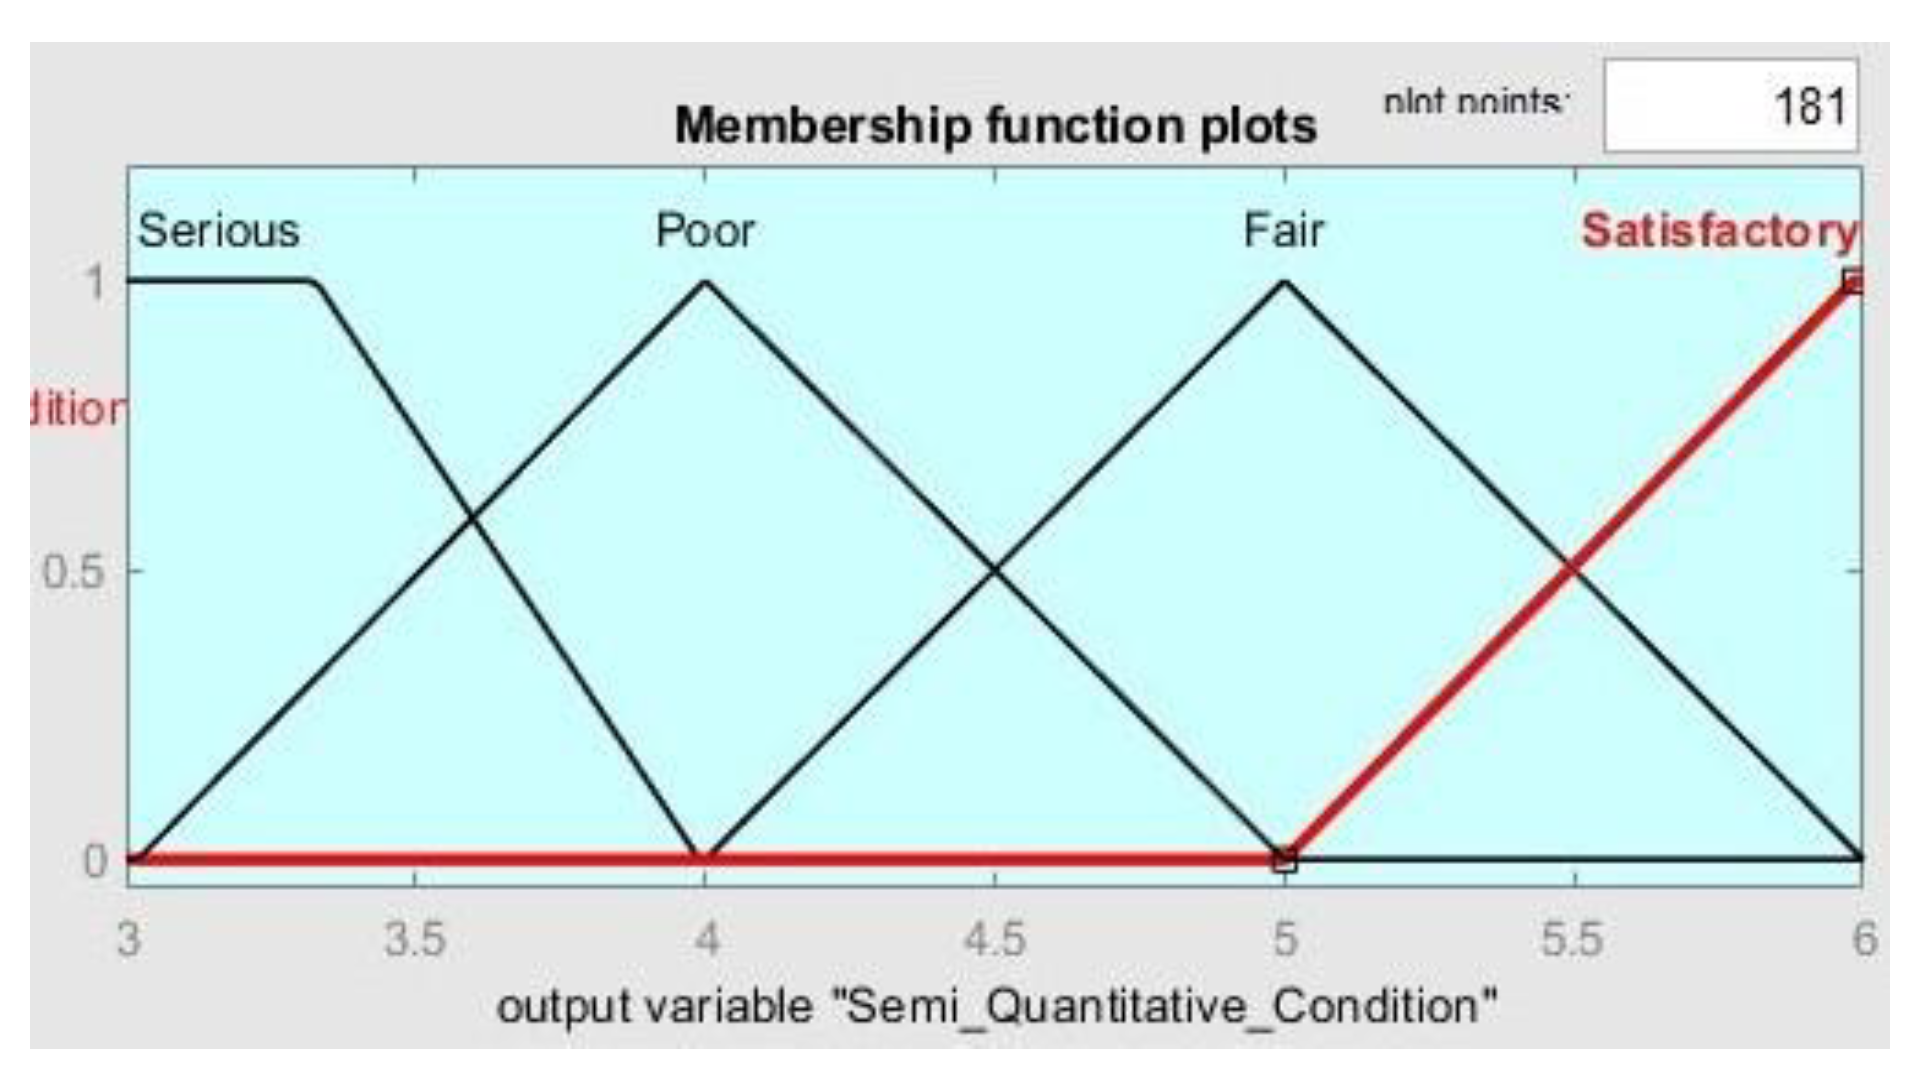
Figure 4.
Fuzzy set for both input and output variables (second case) by MATLAB (R2021a): (a) The first input variable is corrosion degree; (b) the second input variable is concrete surface condition; and (c) the output is semi-quantitative condition rating.
Figure 4.
Fuzzy set for both input and output variables (second case) by MATLAB (R2021a): (a) The first input variable is corrosion degree; (b) the second input variable is concrete surface condition; and (c) the output is semi-quantitative condition rating.
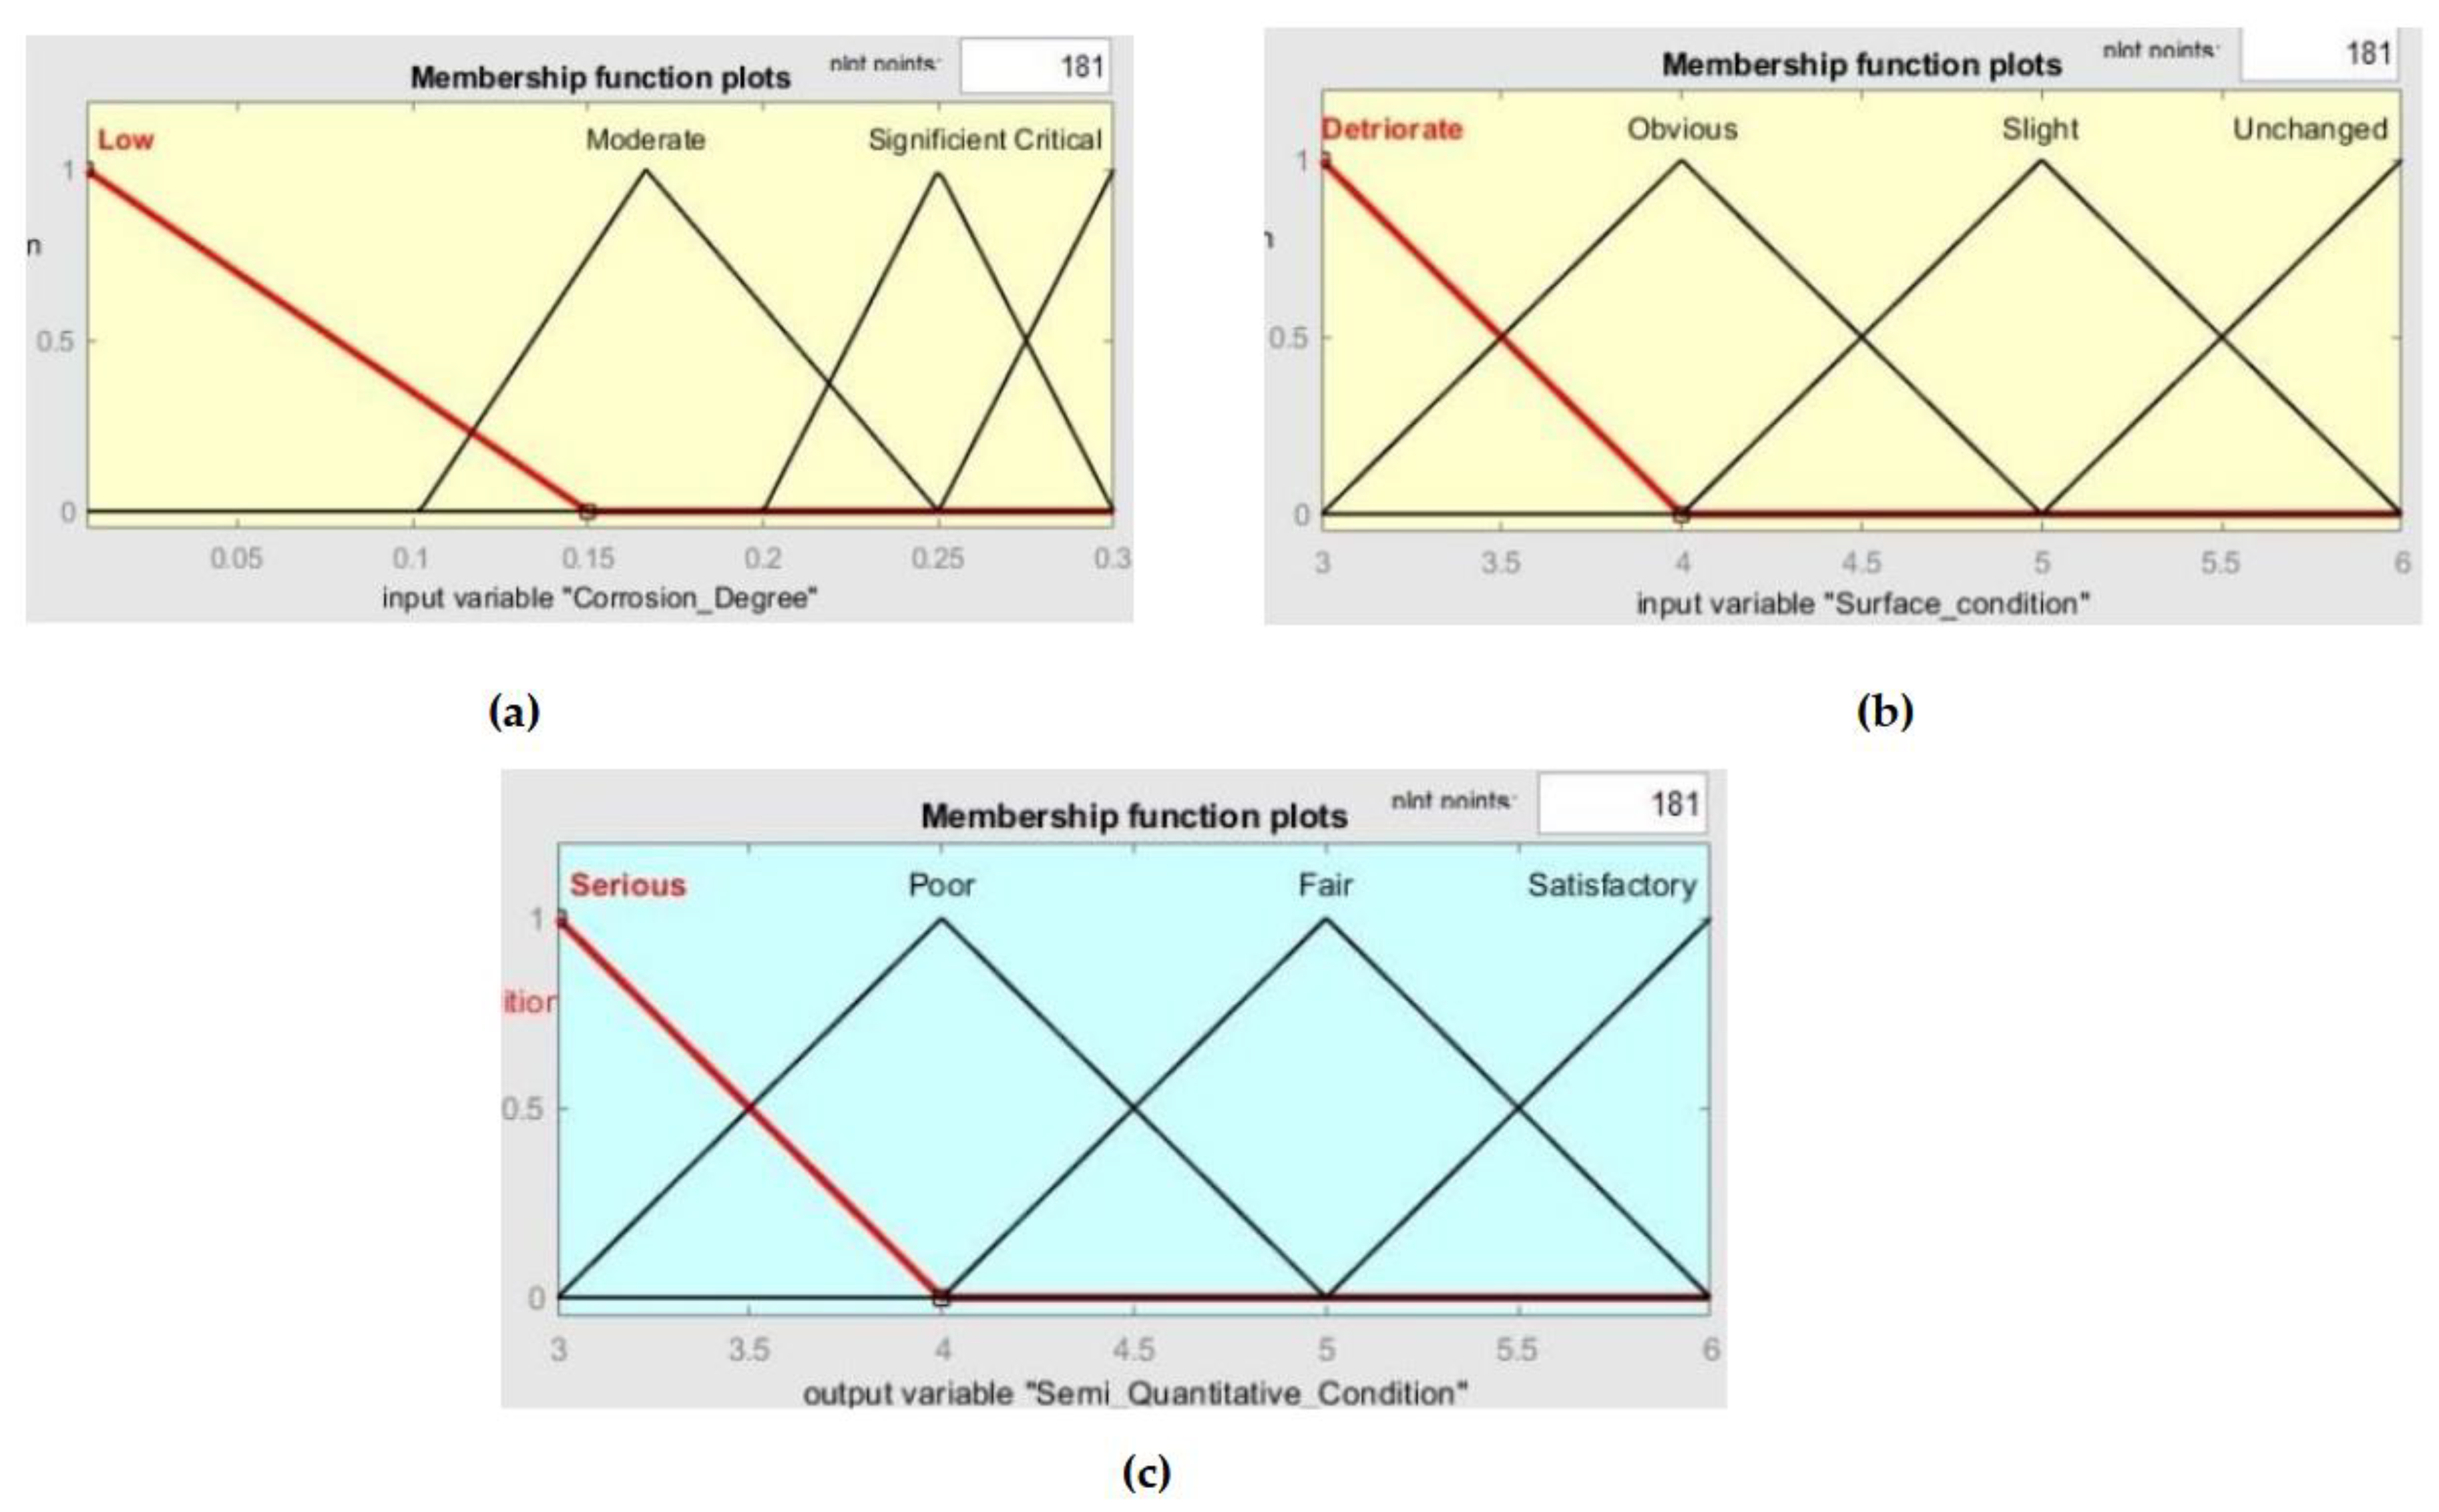
Figure 5.
Fuzzy set for both input and output variables (third case) by MATLAB (R2021a): (a) The first input variable is corrosion degree; (b) the second input variable is concrete surface condition; and (c) the output semi-quantitative condition rating.
Figure 5.
Fuzzy set for both input and output variables (third case) by MATLAB (R2021a): (a) The first input variable is corrosion degree; (b) the second input variable is concrete surface condition; and (c) the output semi-quantitative condition rating.
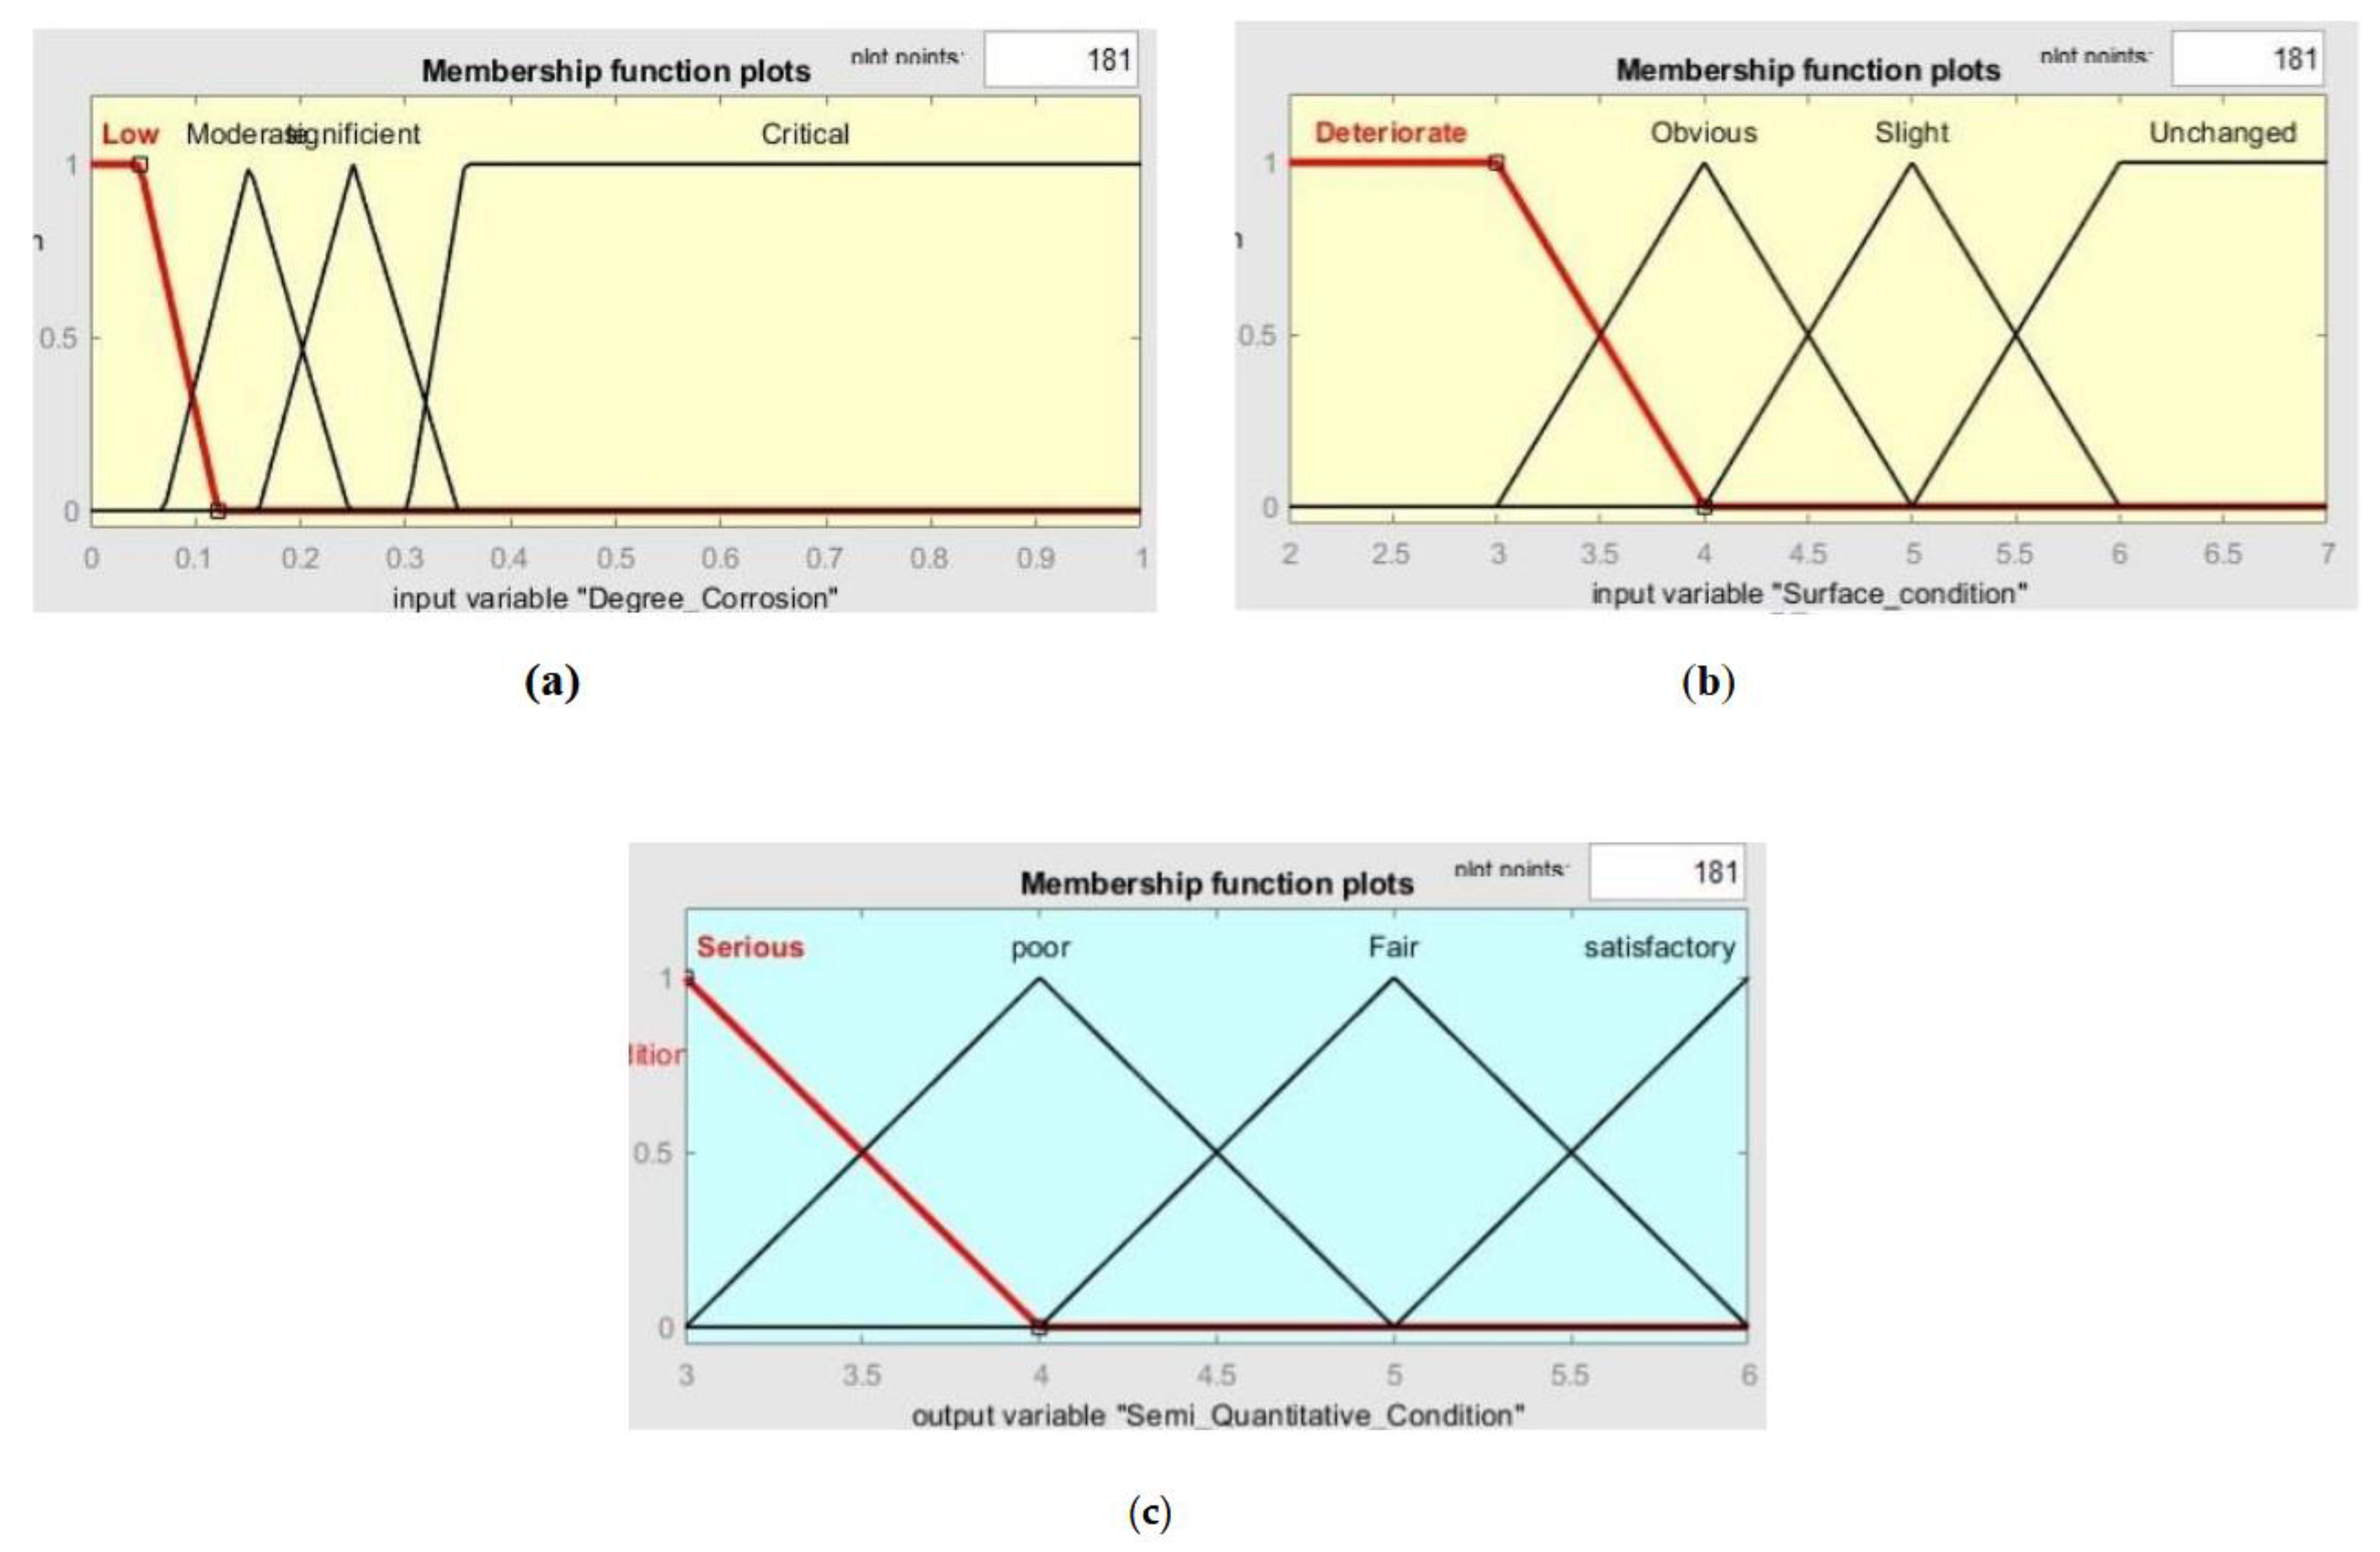
Figure 6.
Surface viewer by MATLAB (R2021a) for: (a) first case, (b) second case, and (c) third case.
Figure 6.
Surface viewer by MATLAB (R2021a) for: (a) first case, (b) second case, and (c) third case.
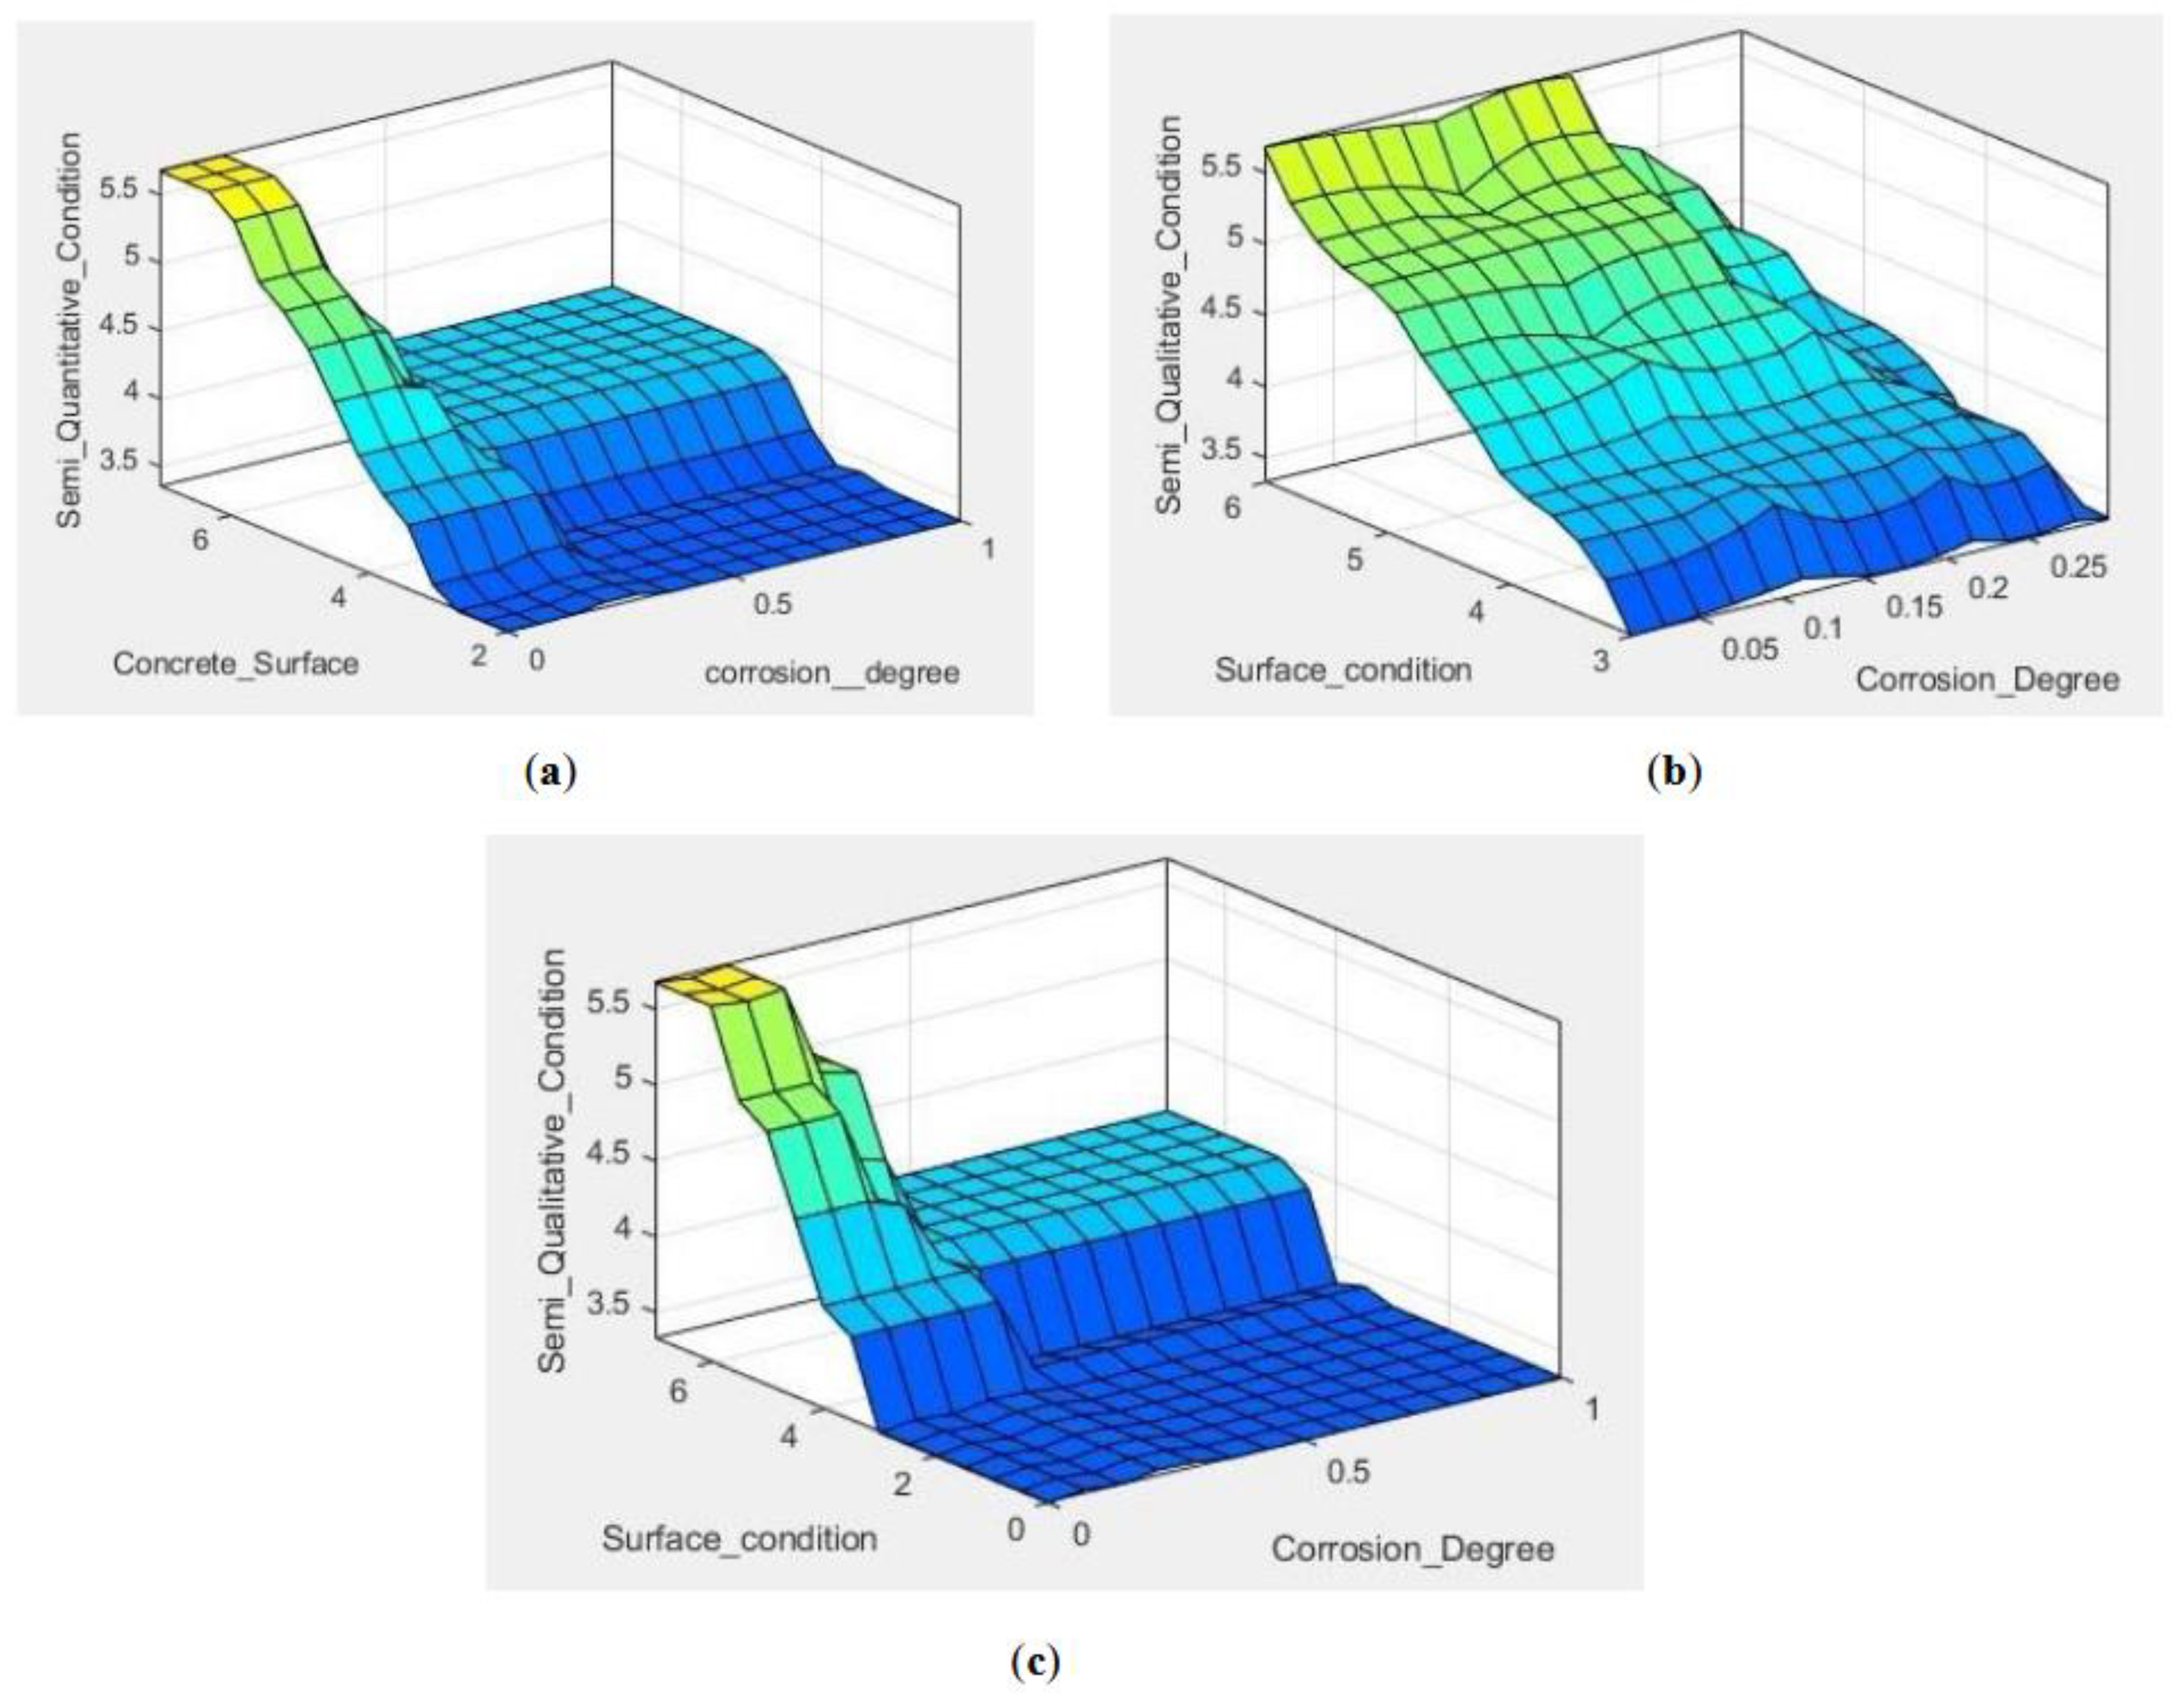
Figure 7.
Spreadsheet model for Markov chain.
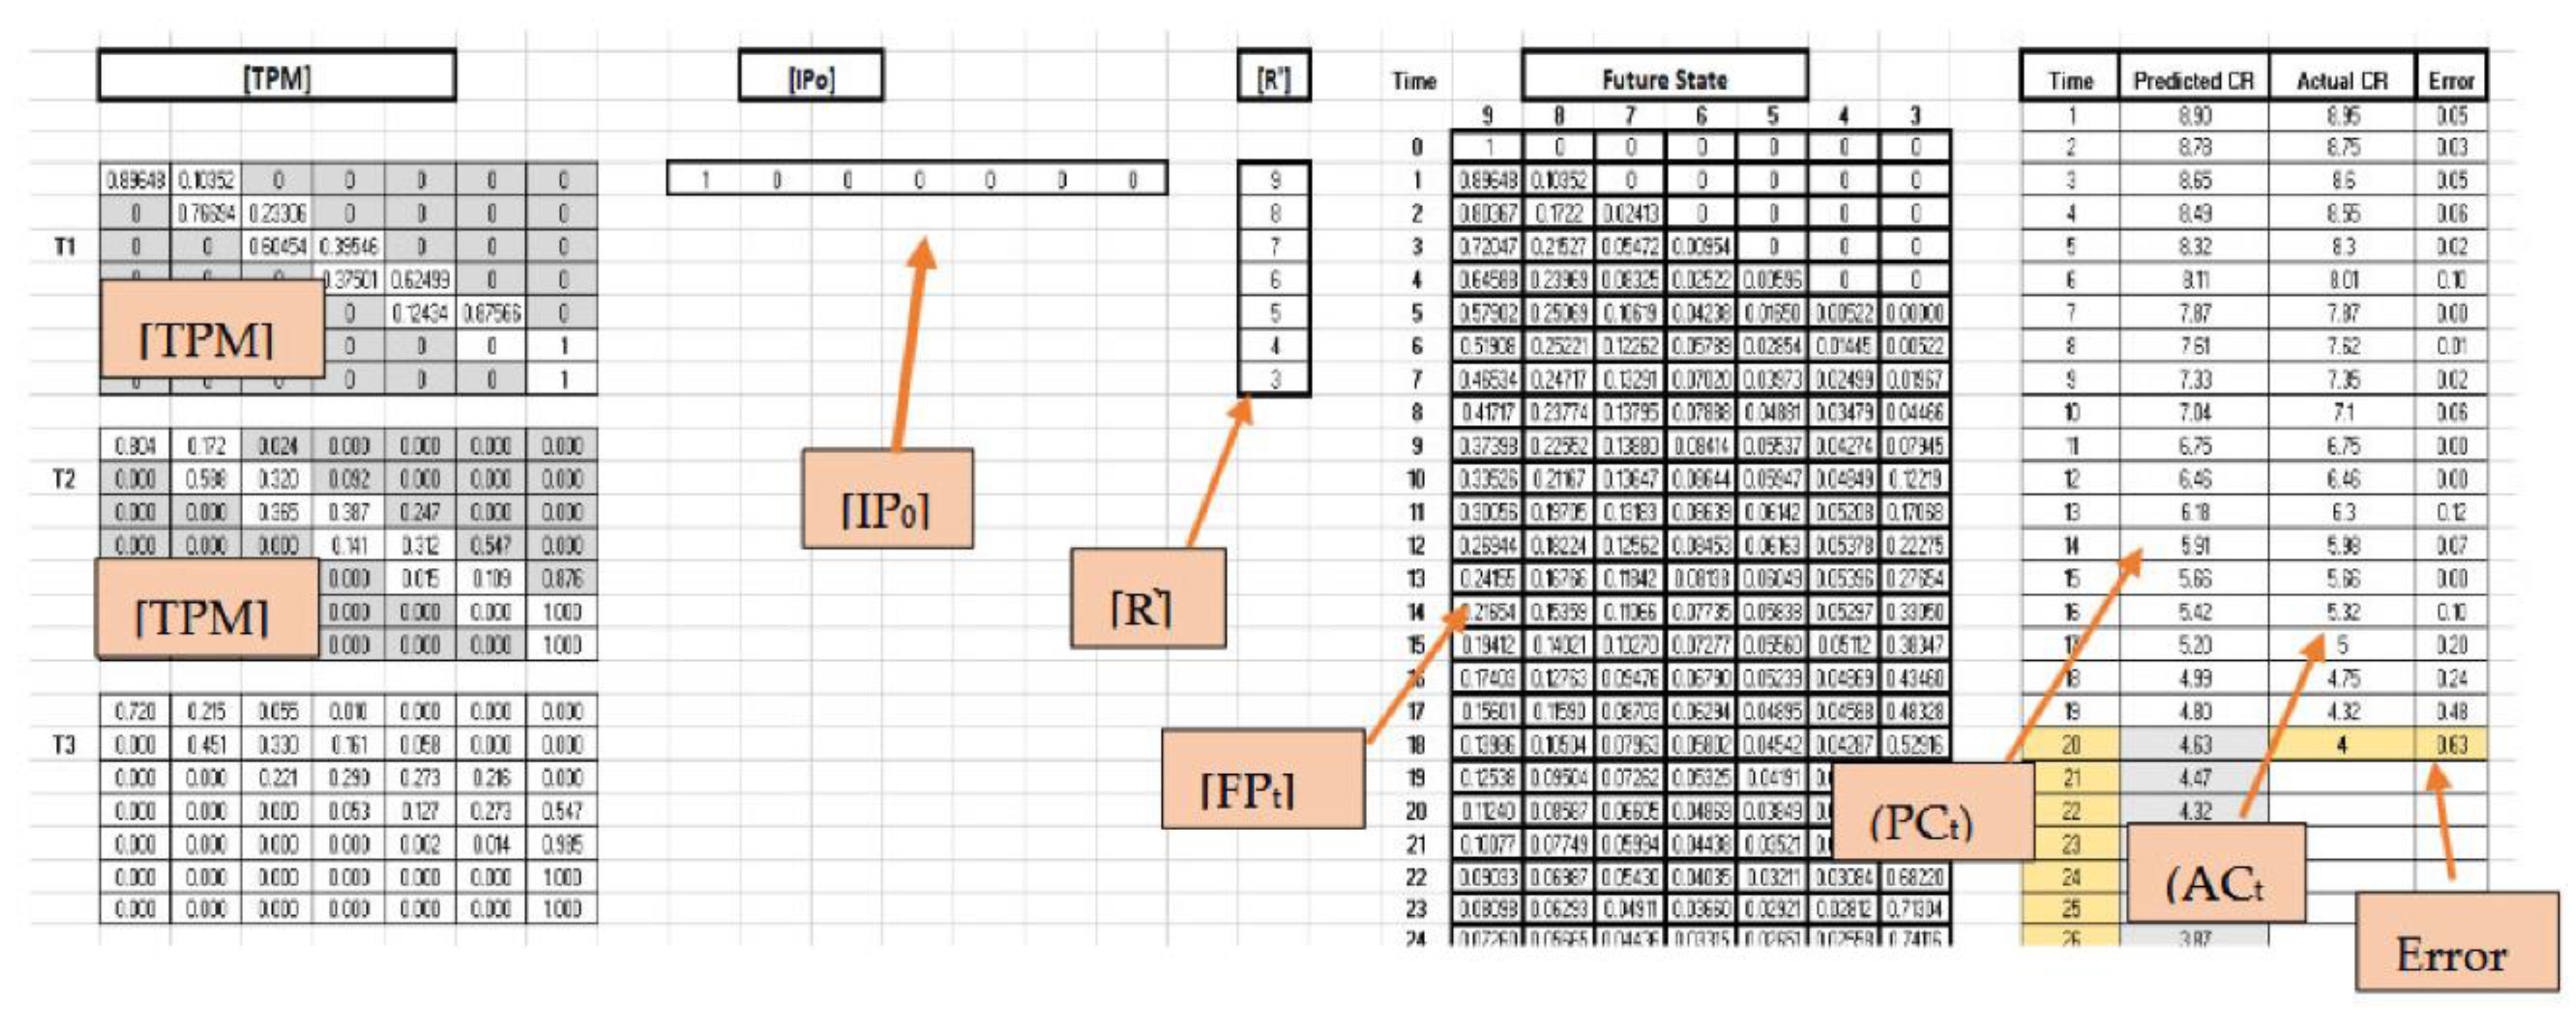
Figure 8.
Markov chain model before optimization.
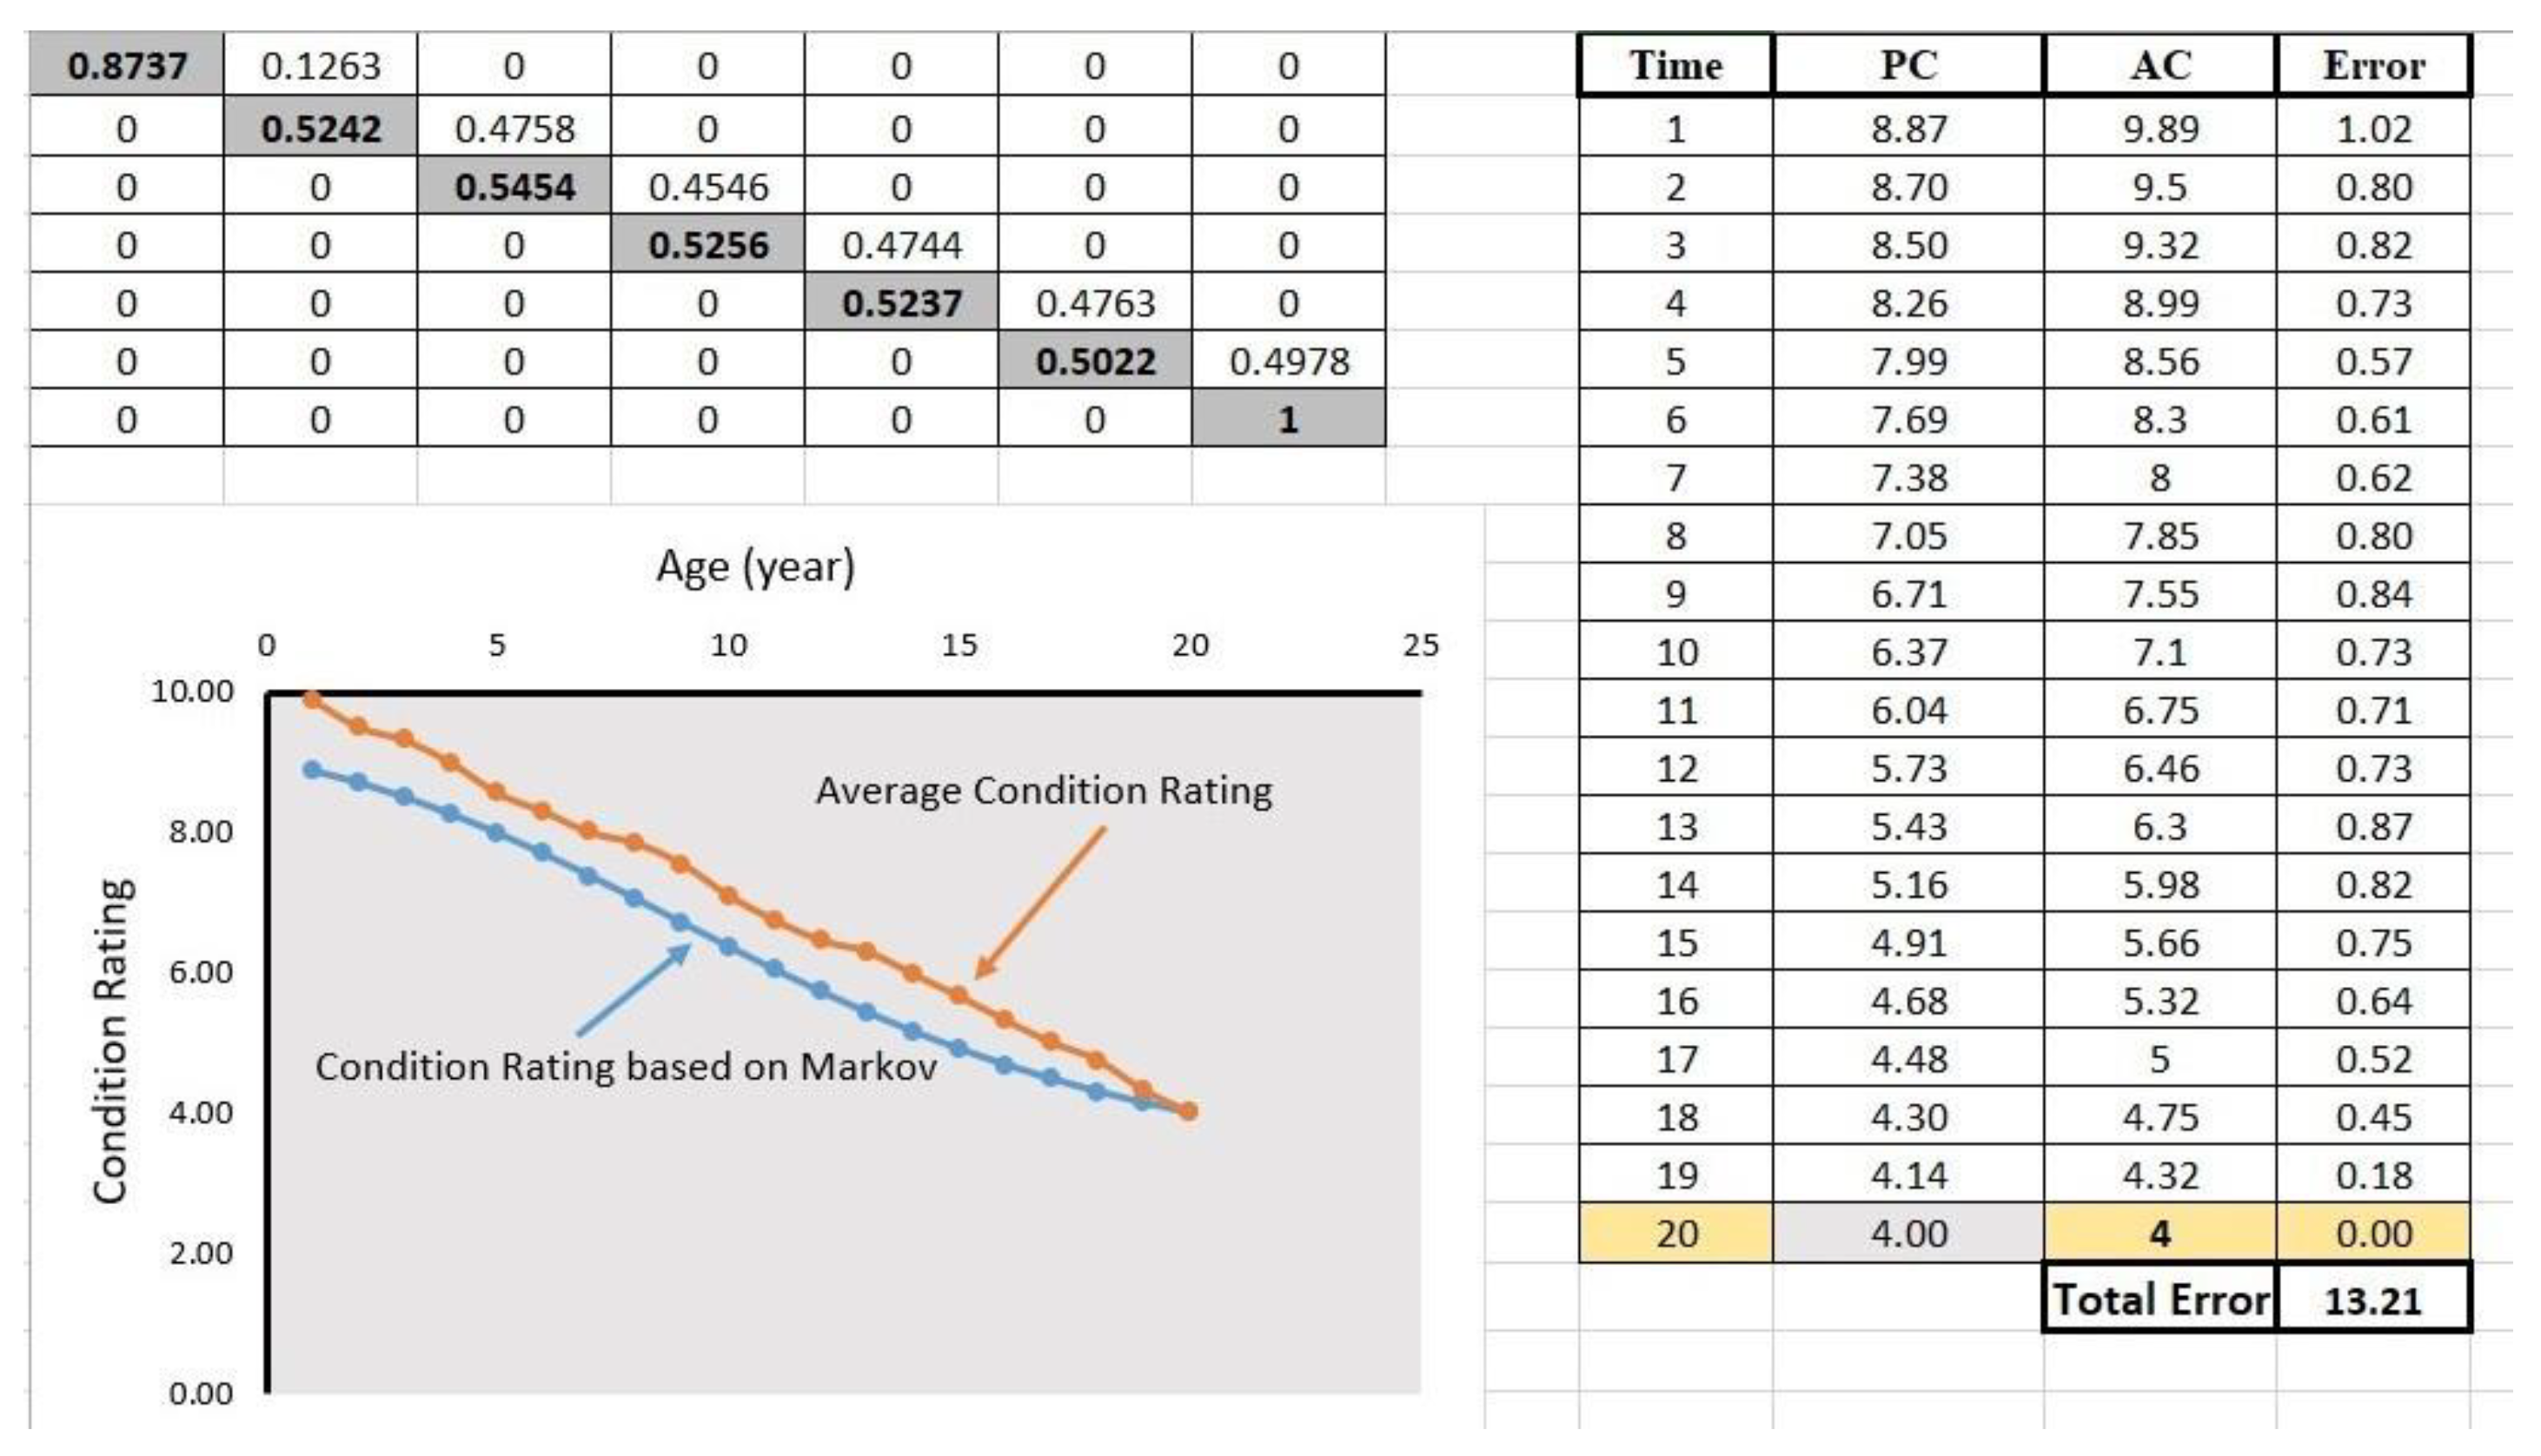
Figure 9.
Markov chain model after optimization.
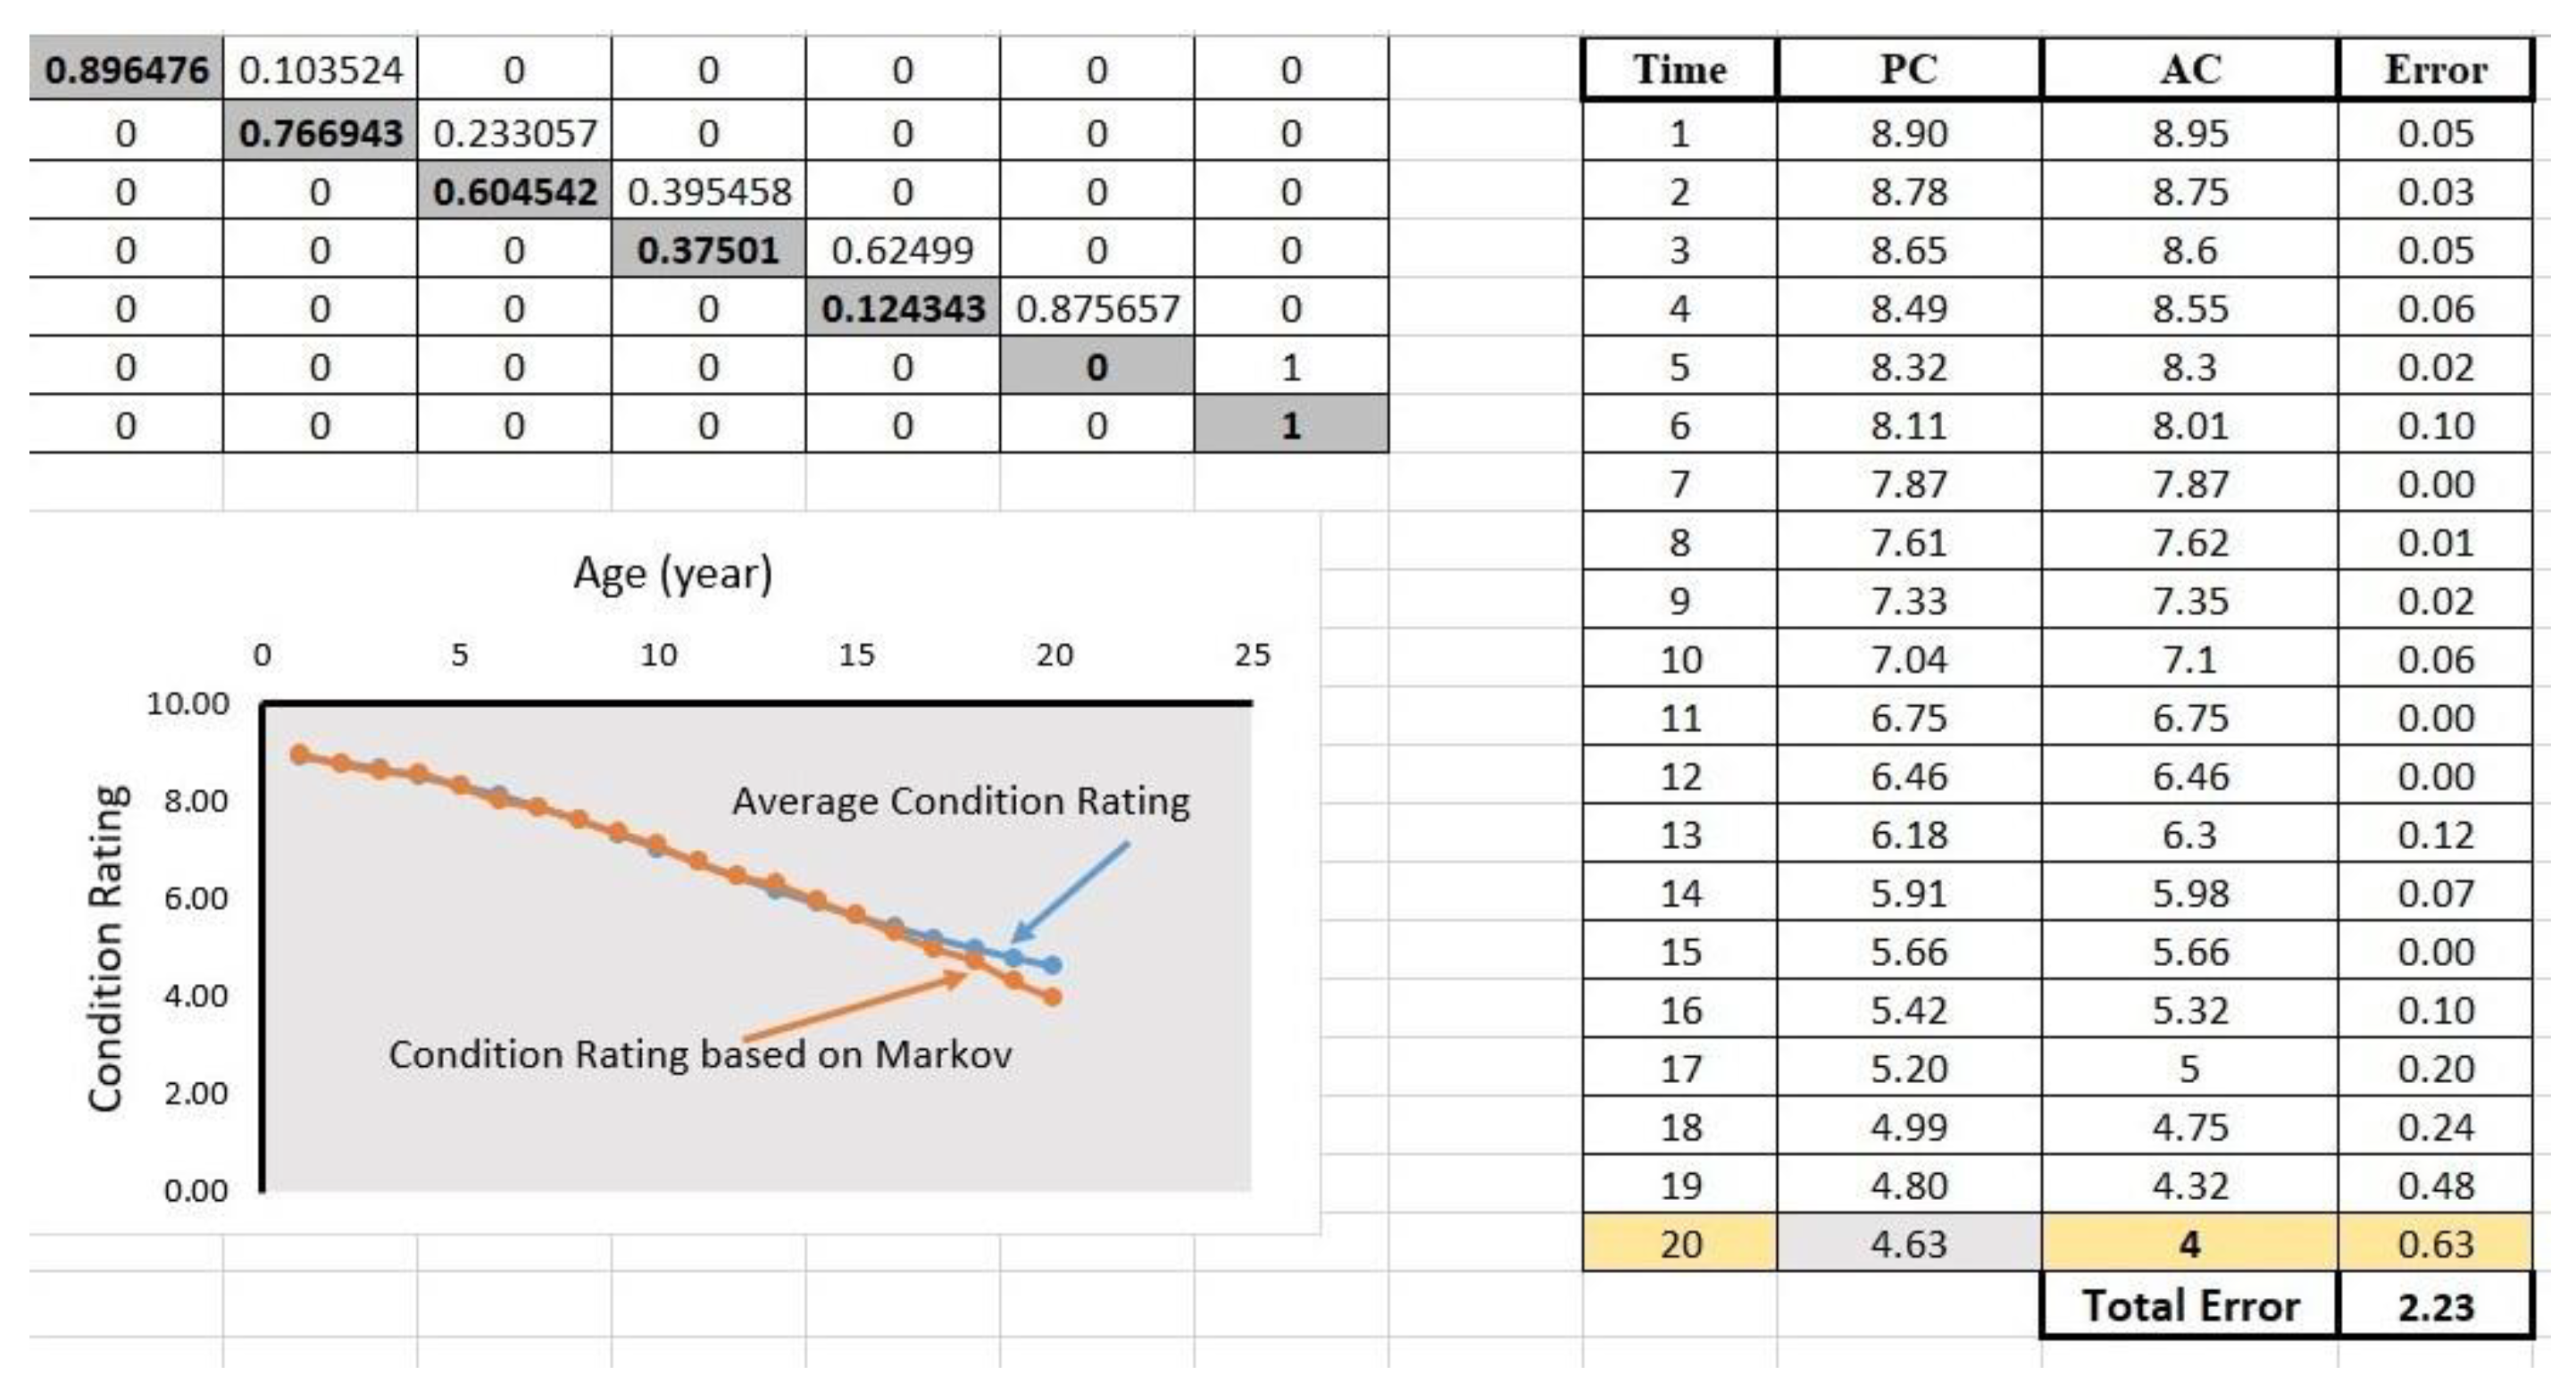
Figure 10.
Photos taken during inspection. (a) corrosion steel bar (b) spalling, and (c) cracks and exposed rebar.
Figure 10.
Photos taken during inspection. (a) corrosion steel bar (b) spalling, and (c) cracks and exposed rebar.
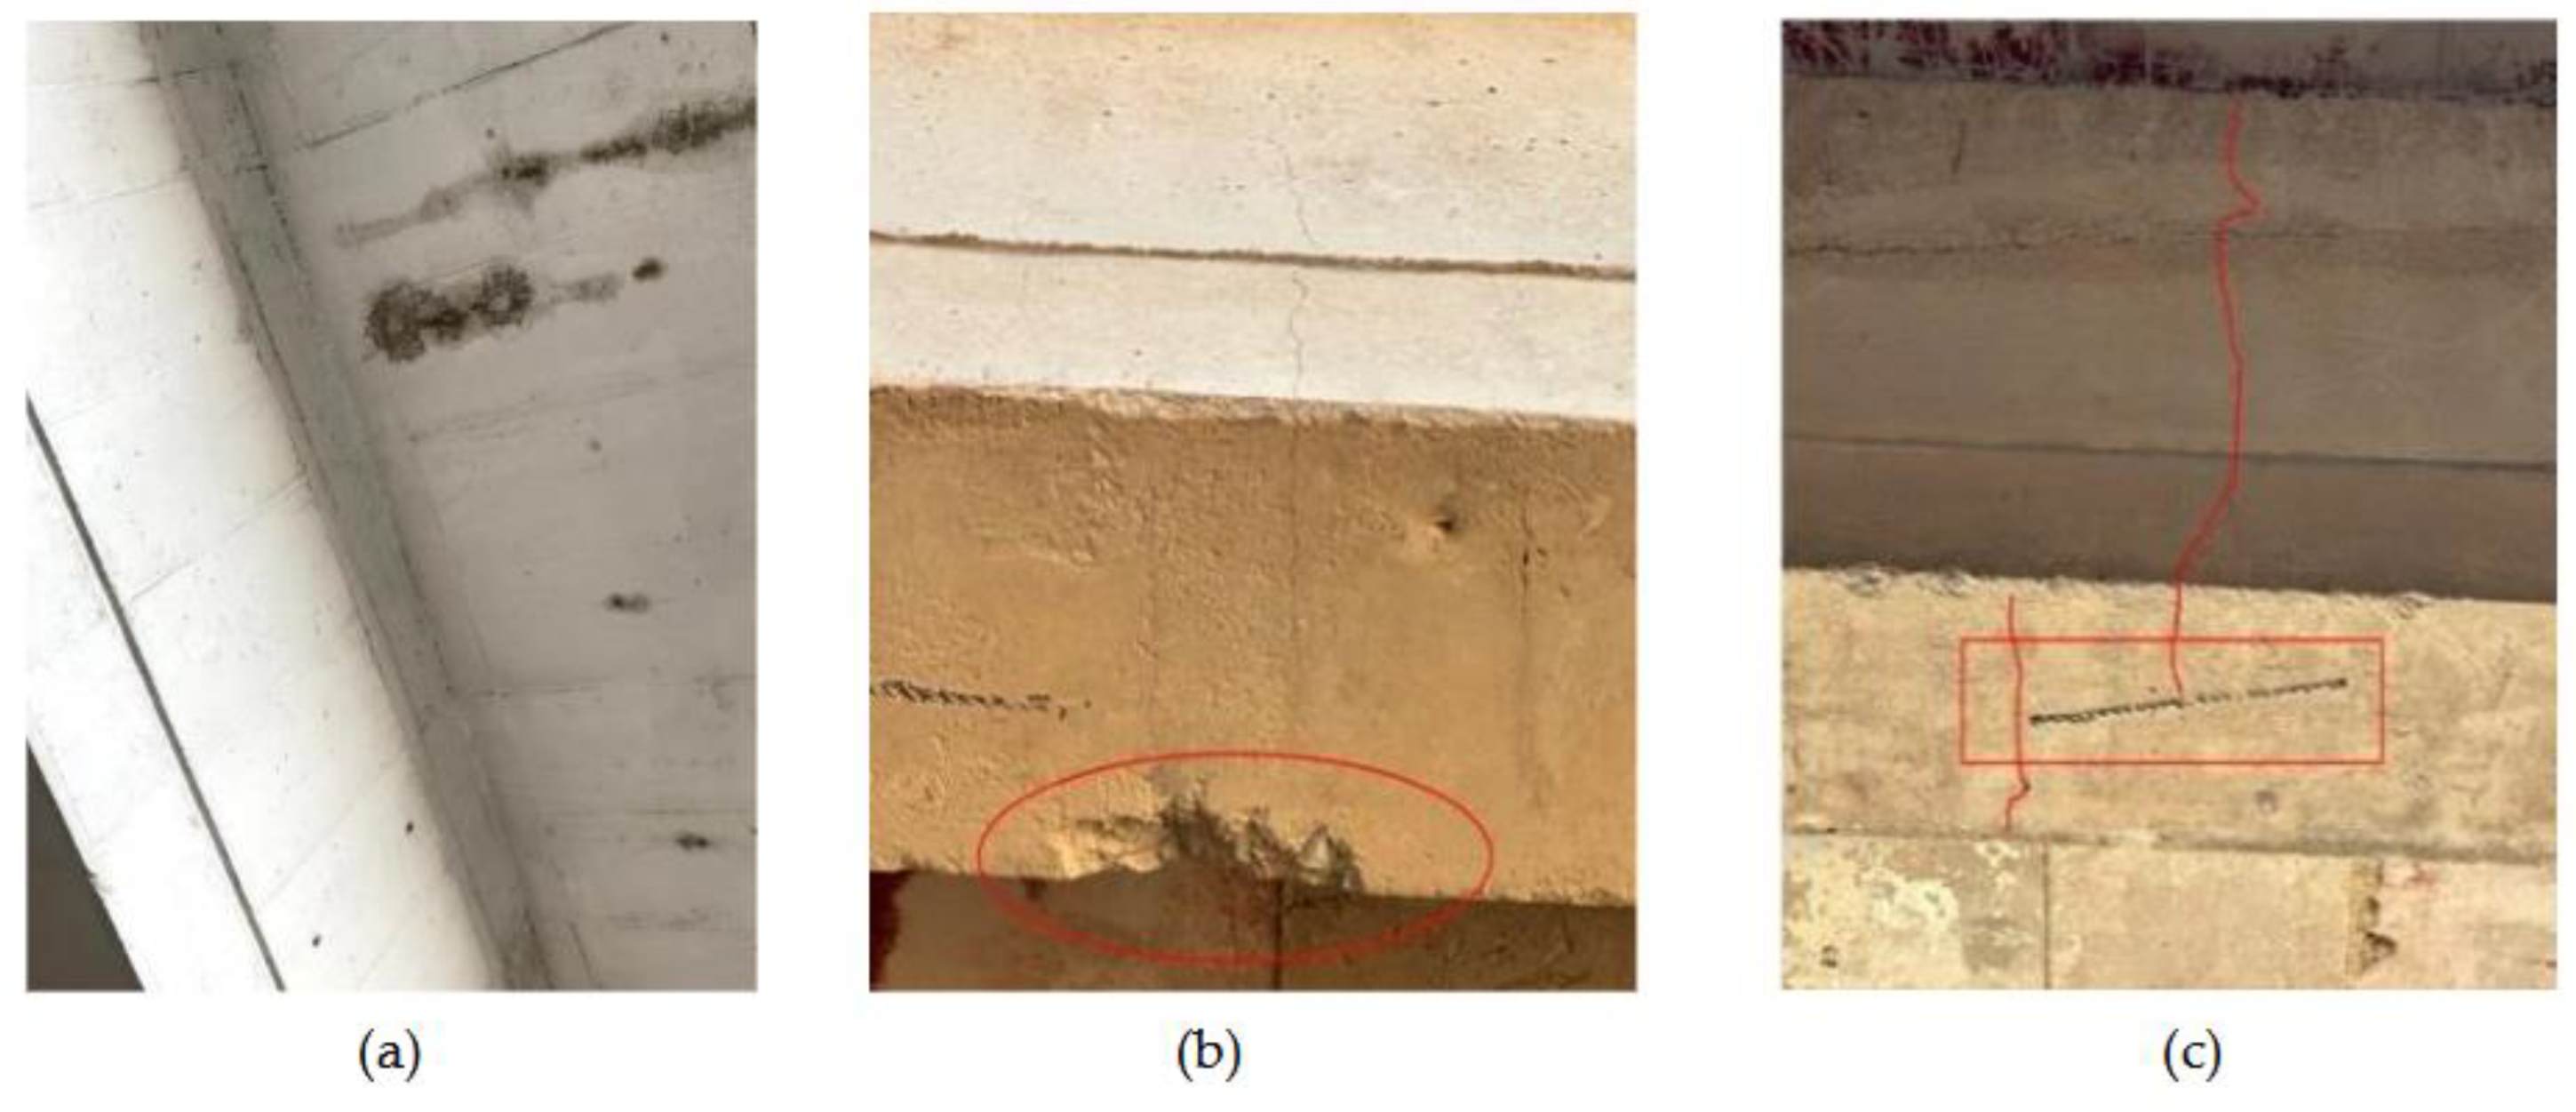
Figure 11.
The set of all rules with its output values for specified two inputs. MATLAB (R2021a).

Figure 12.
Screenshot of Matlab (R2021a) code to find unknown [TPM].
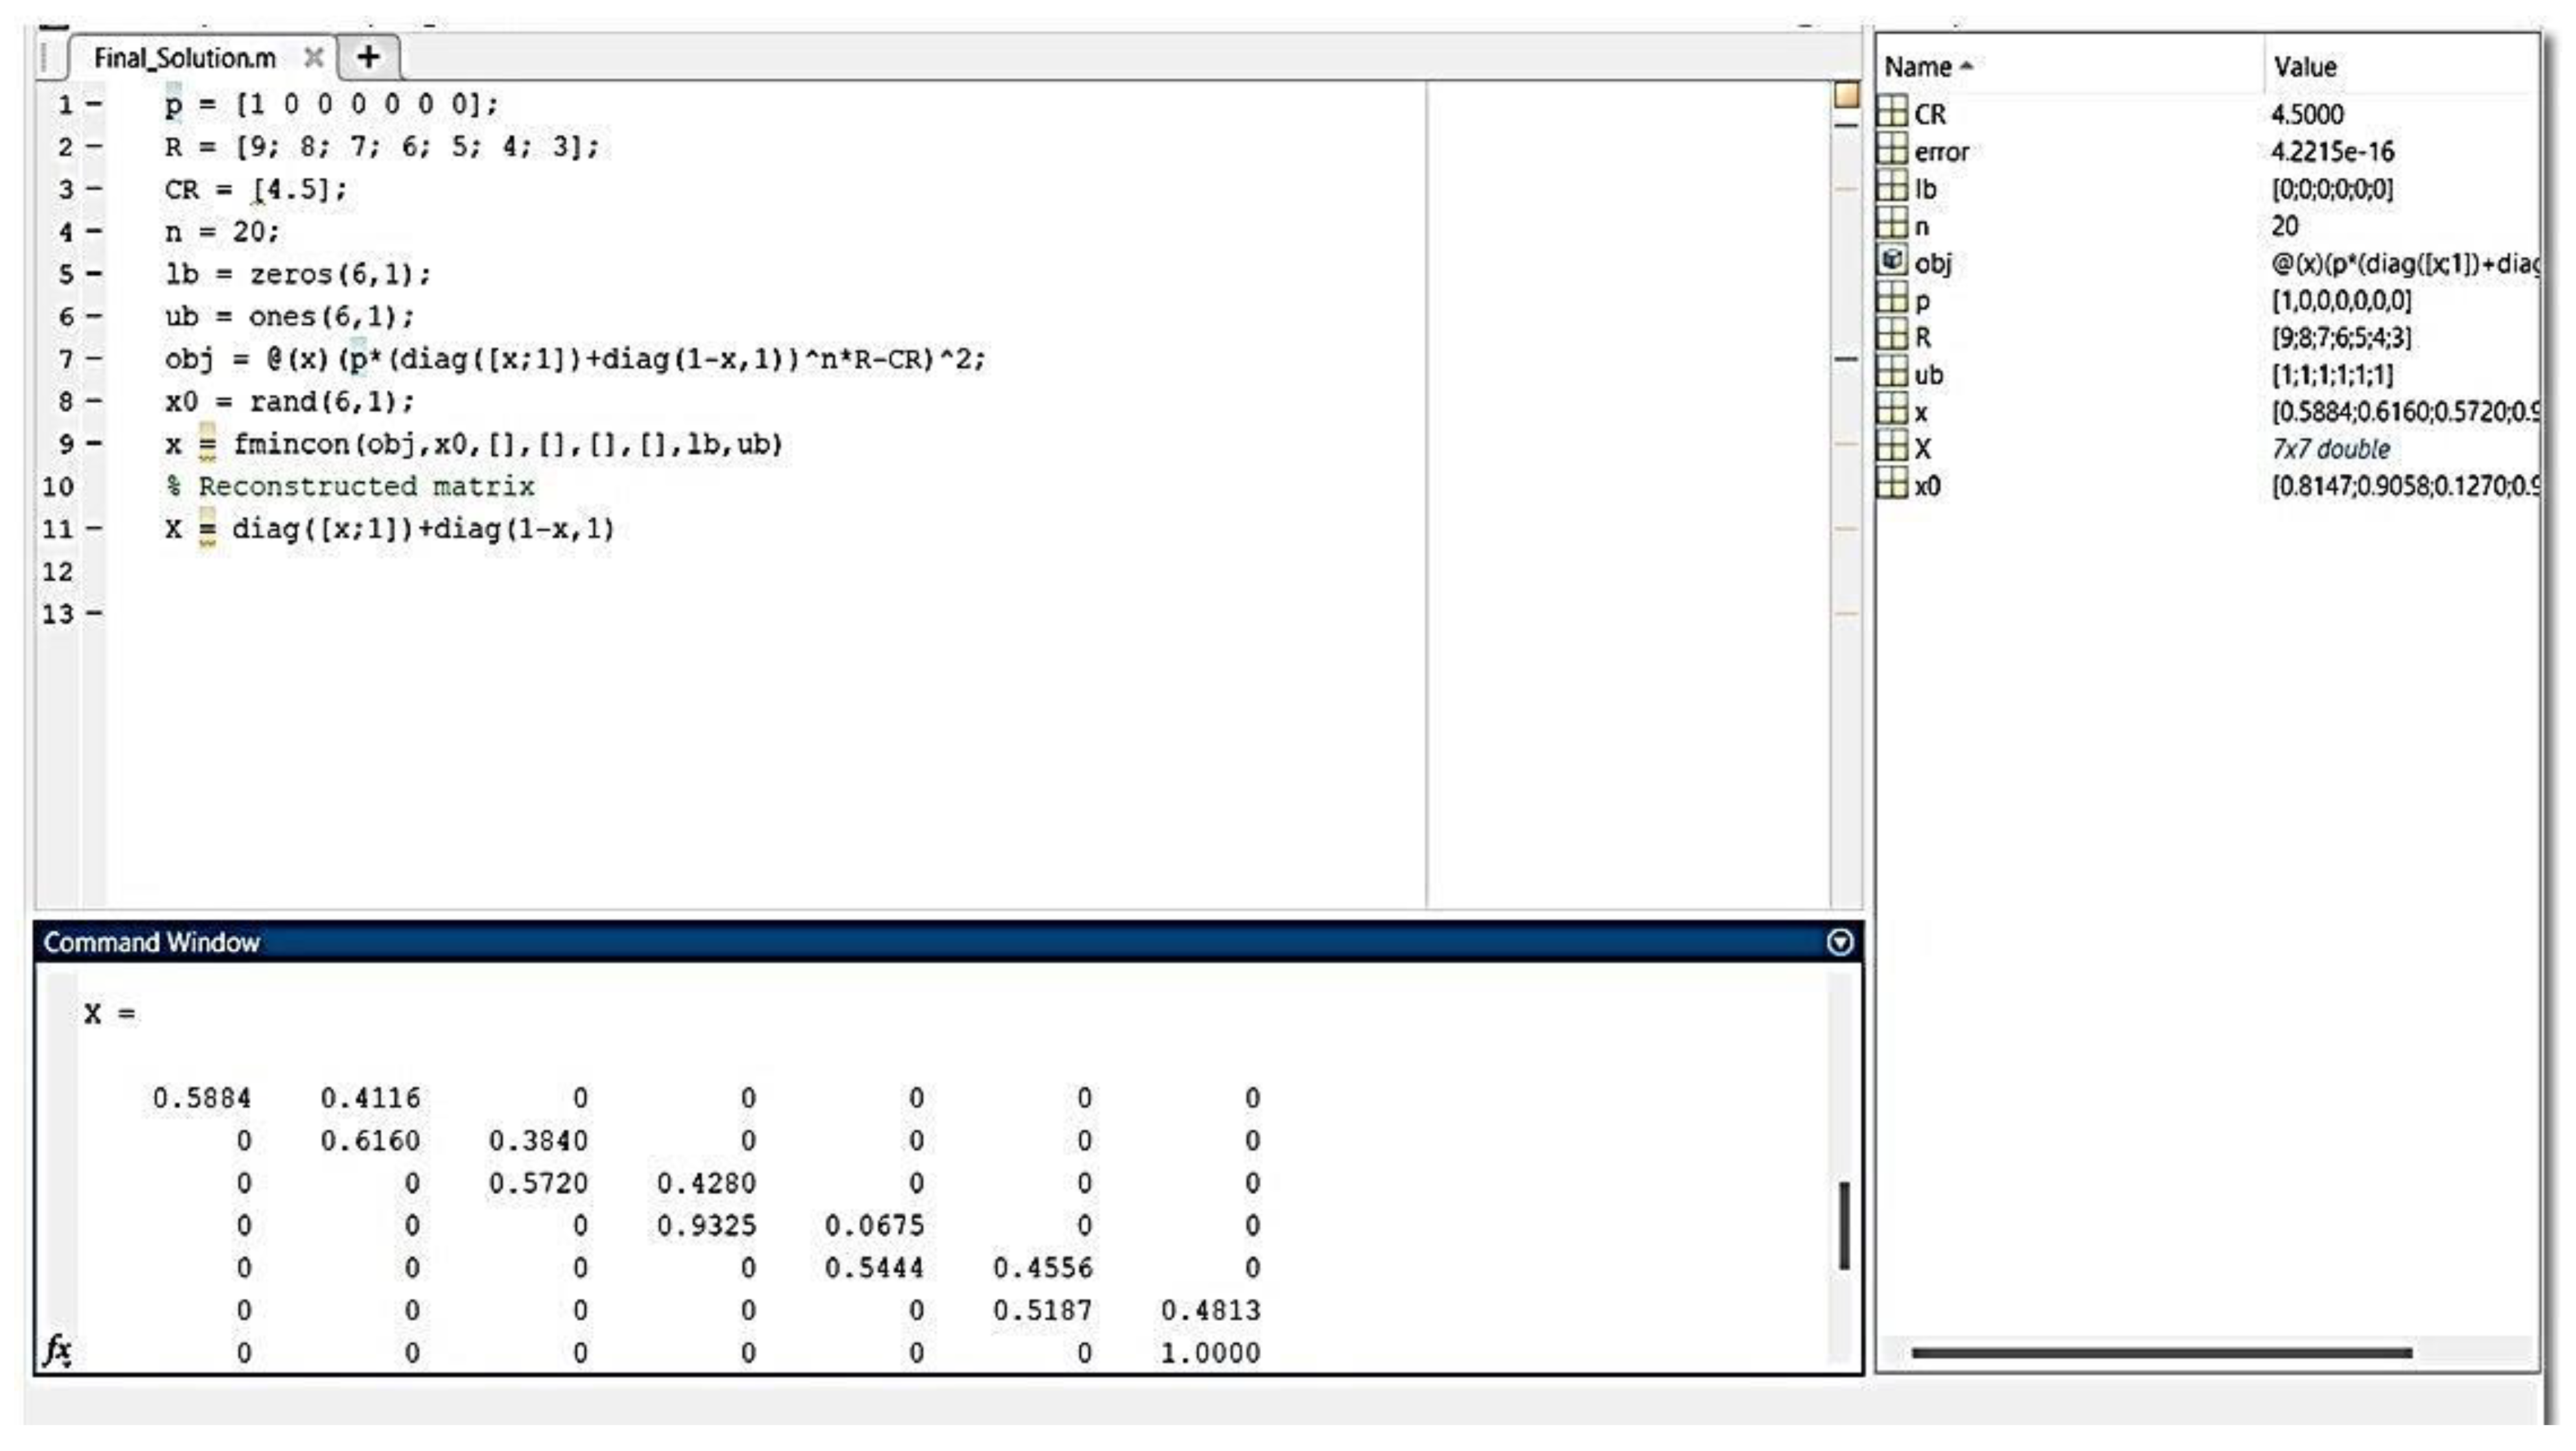
Figure 13.
Deterioration curve for diaphragm.
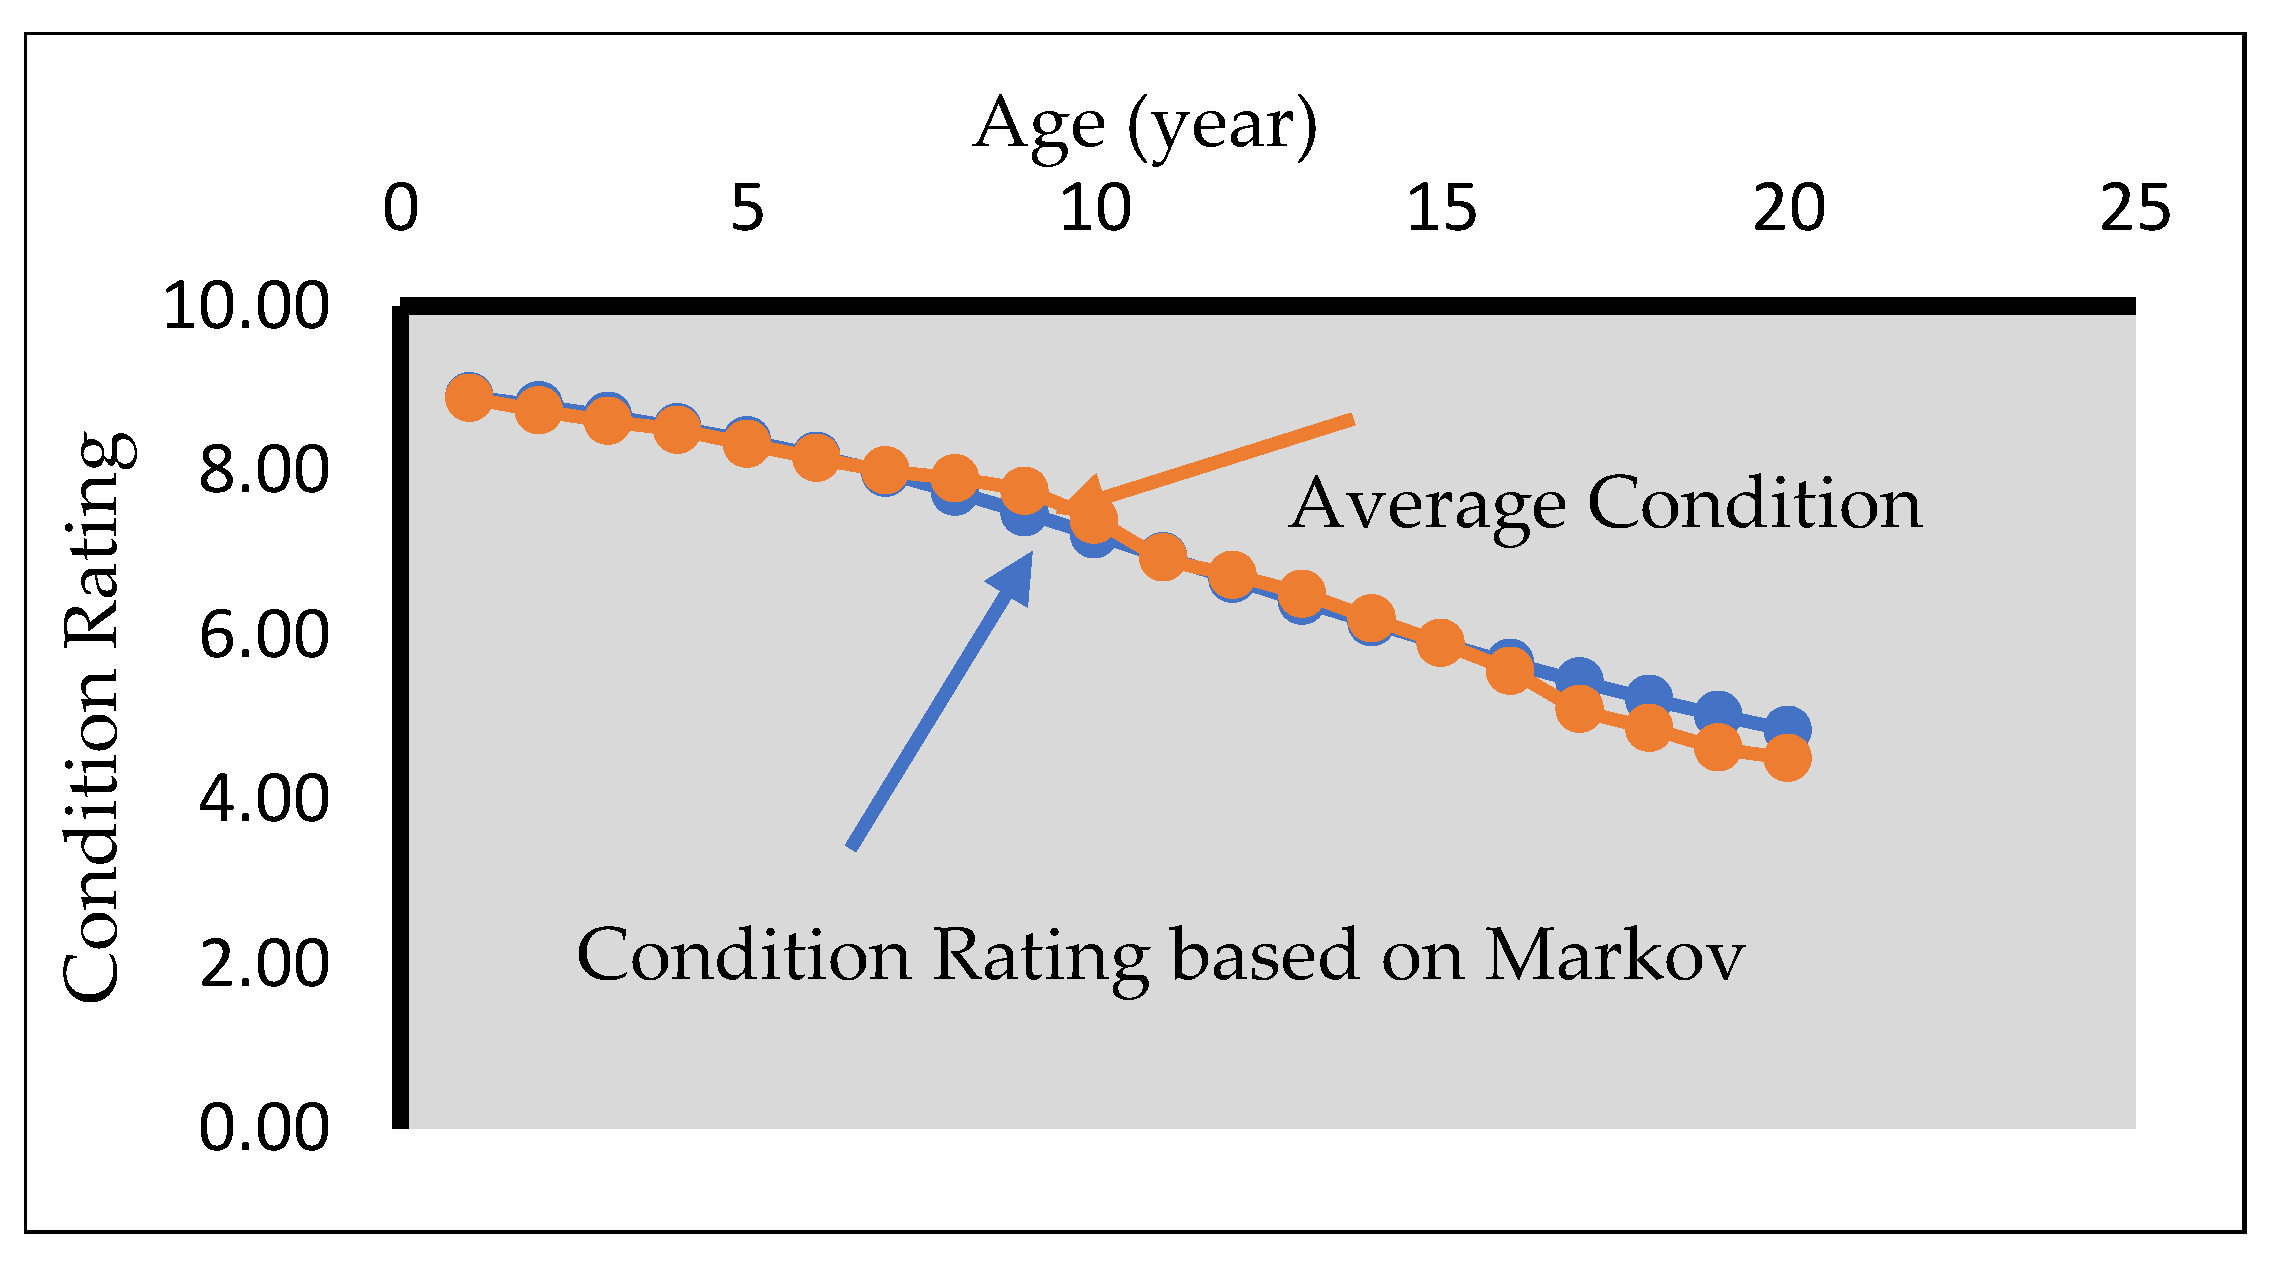
Figure 14.
Deterioration curve for wing wall.
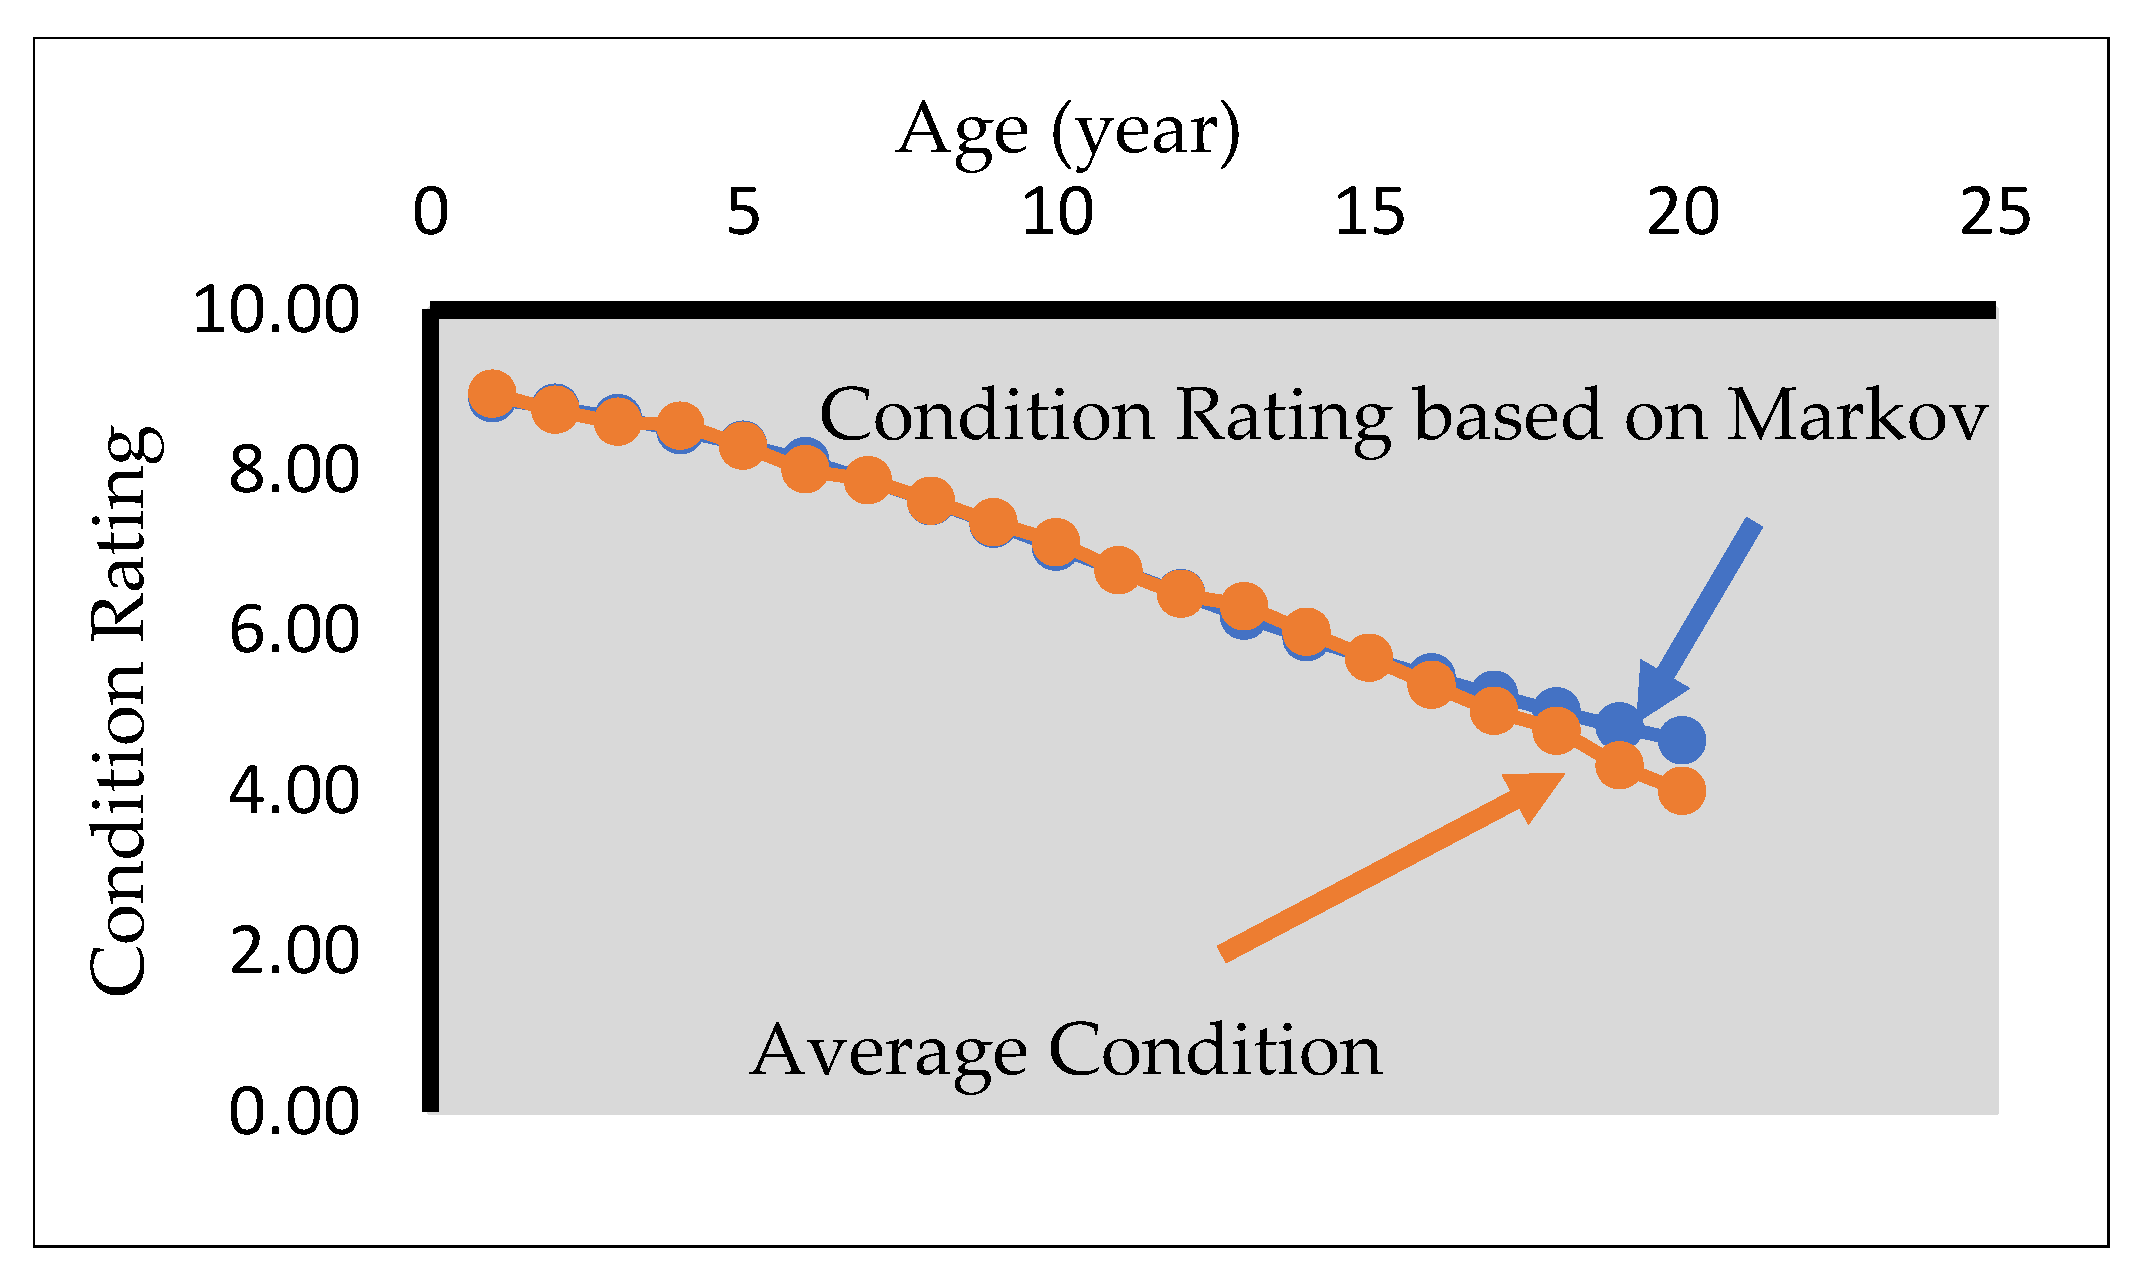
Figure 15.
Deterioration curve for abutment.
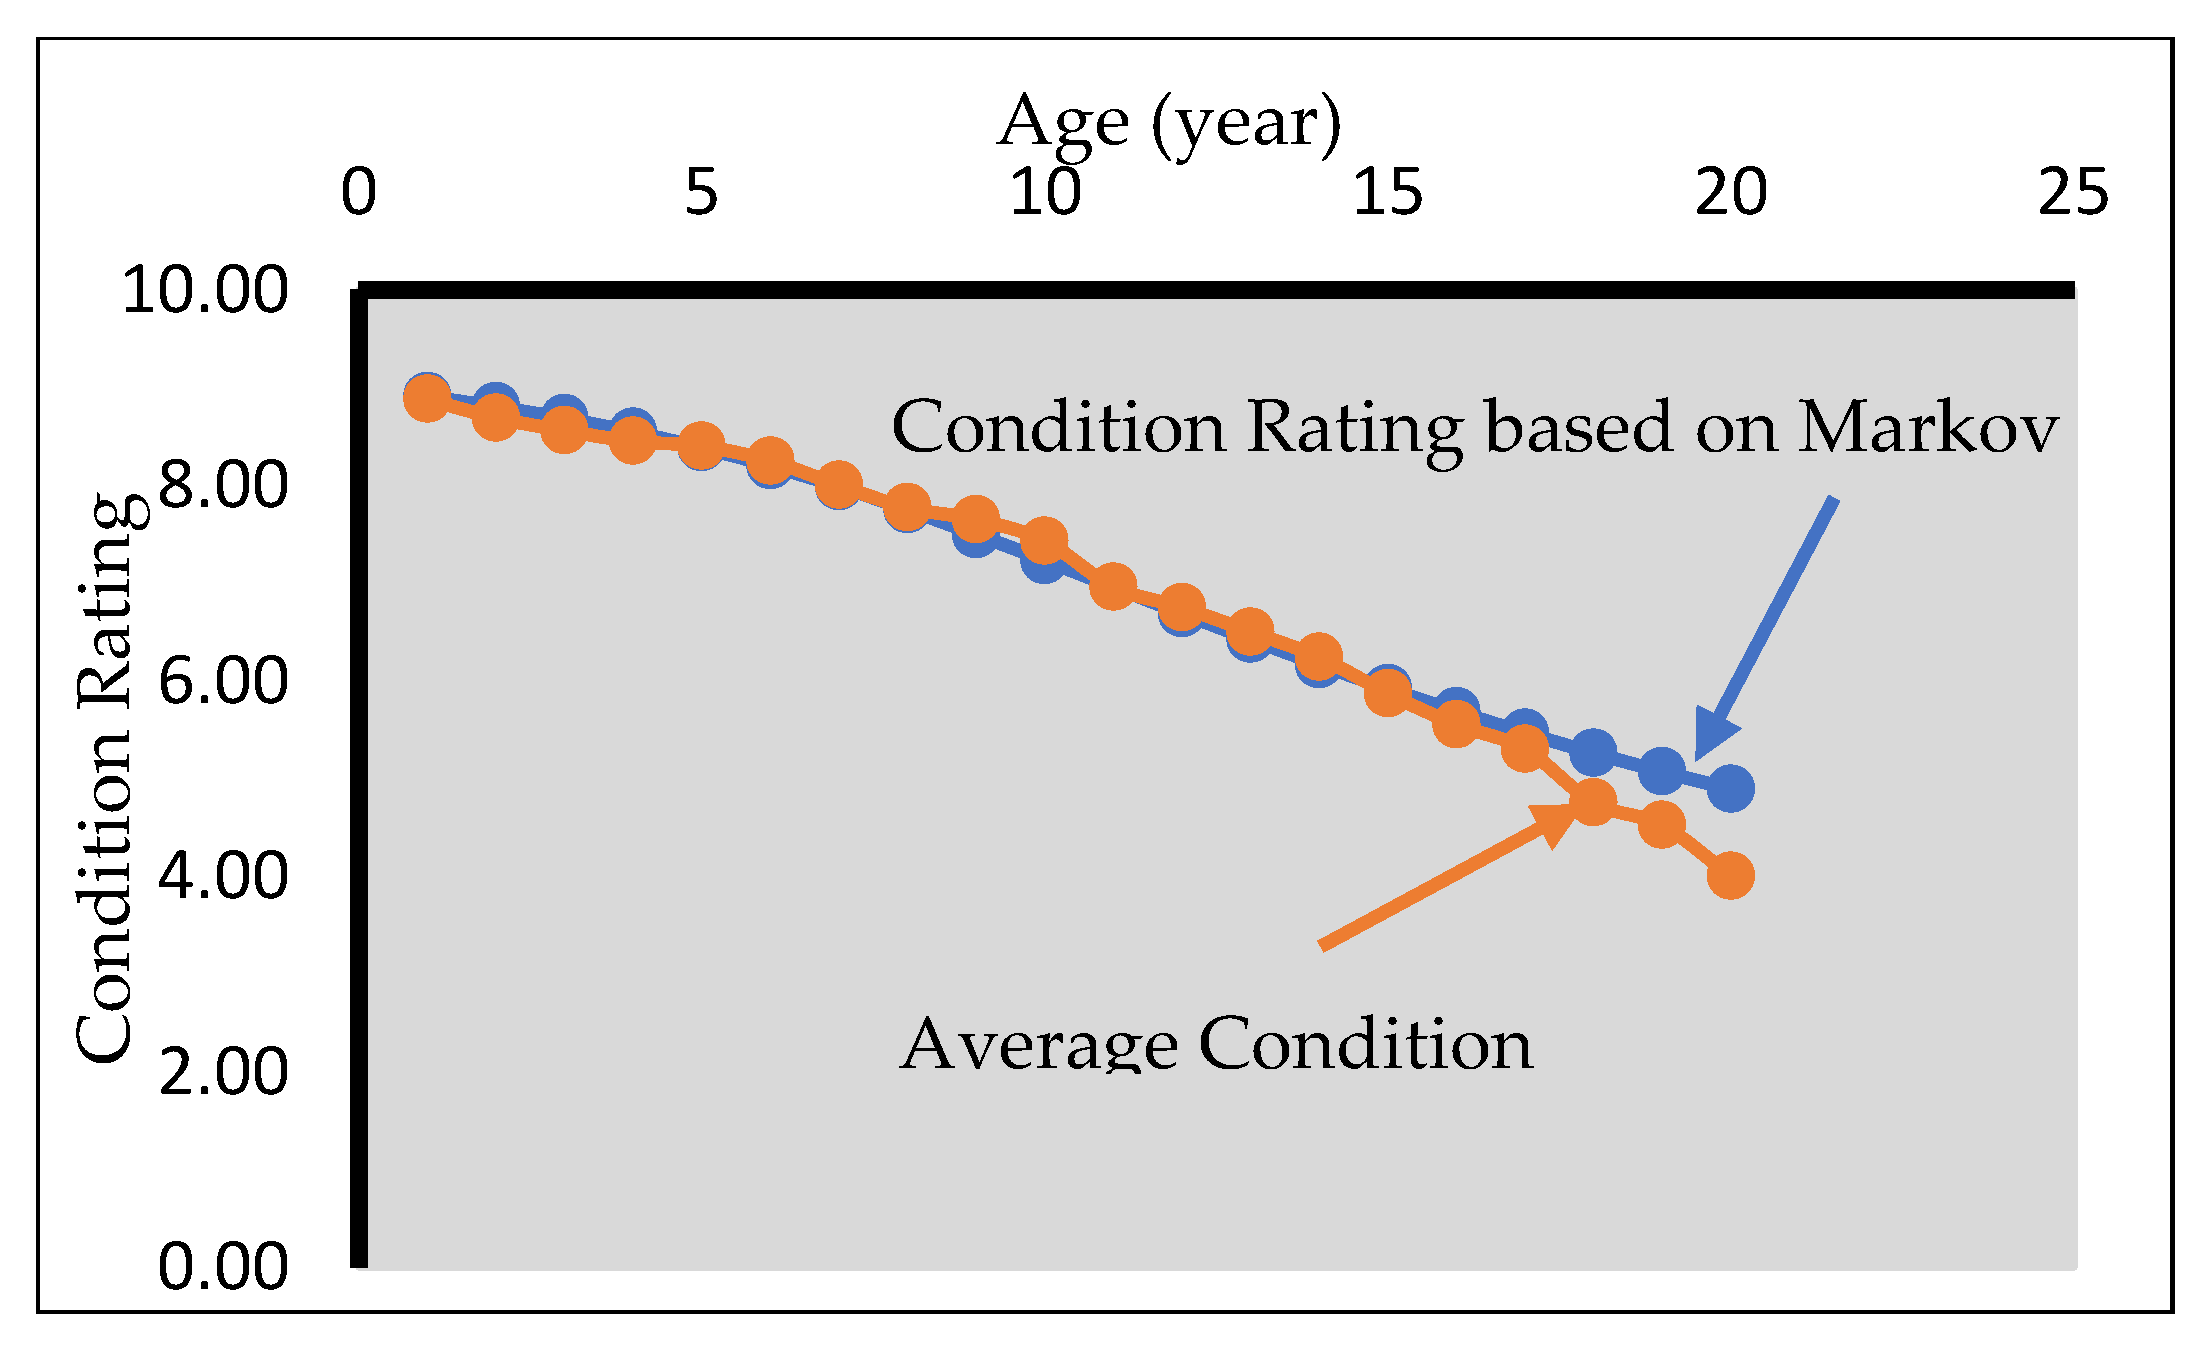
Figure 16.
Deterioration curve for girders.
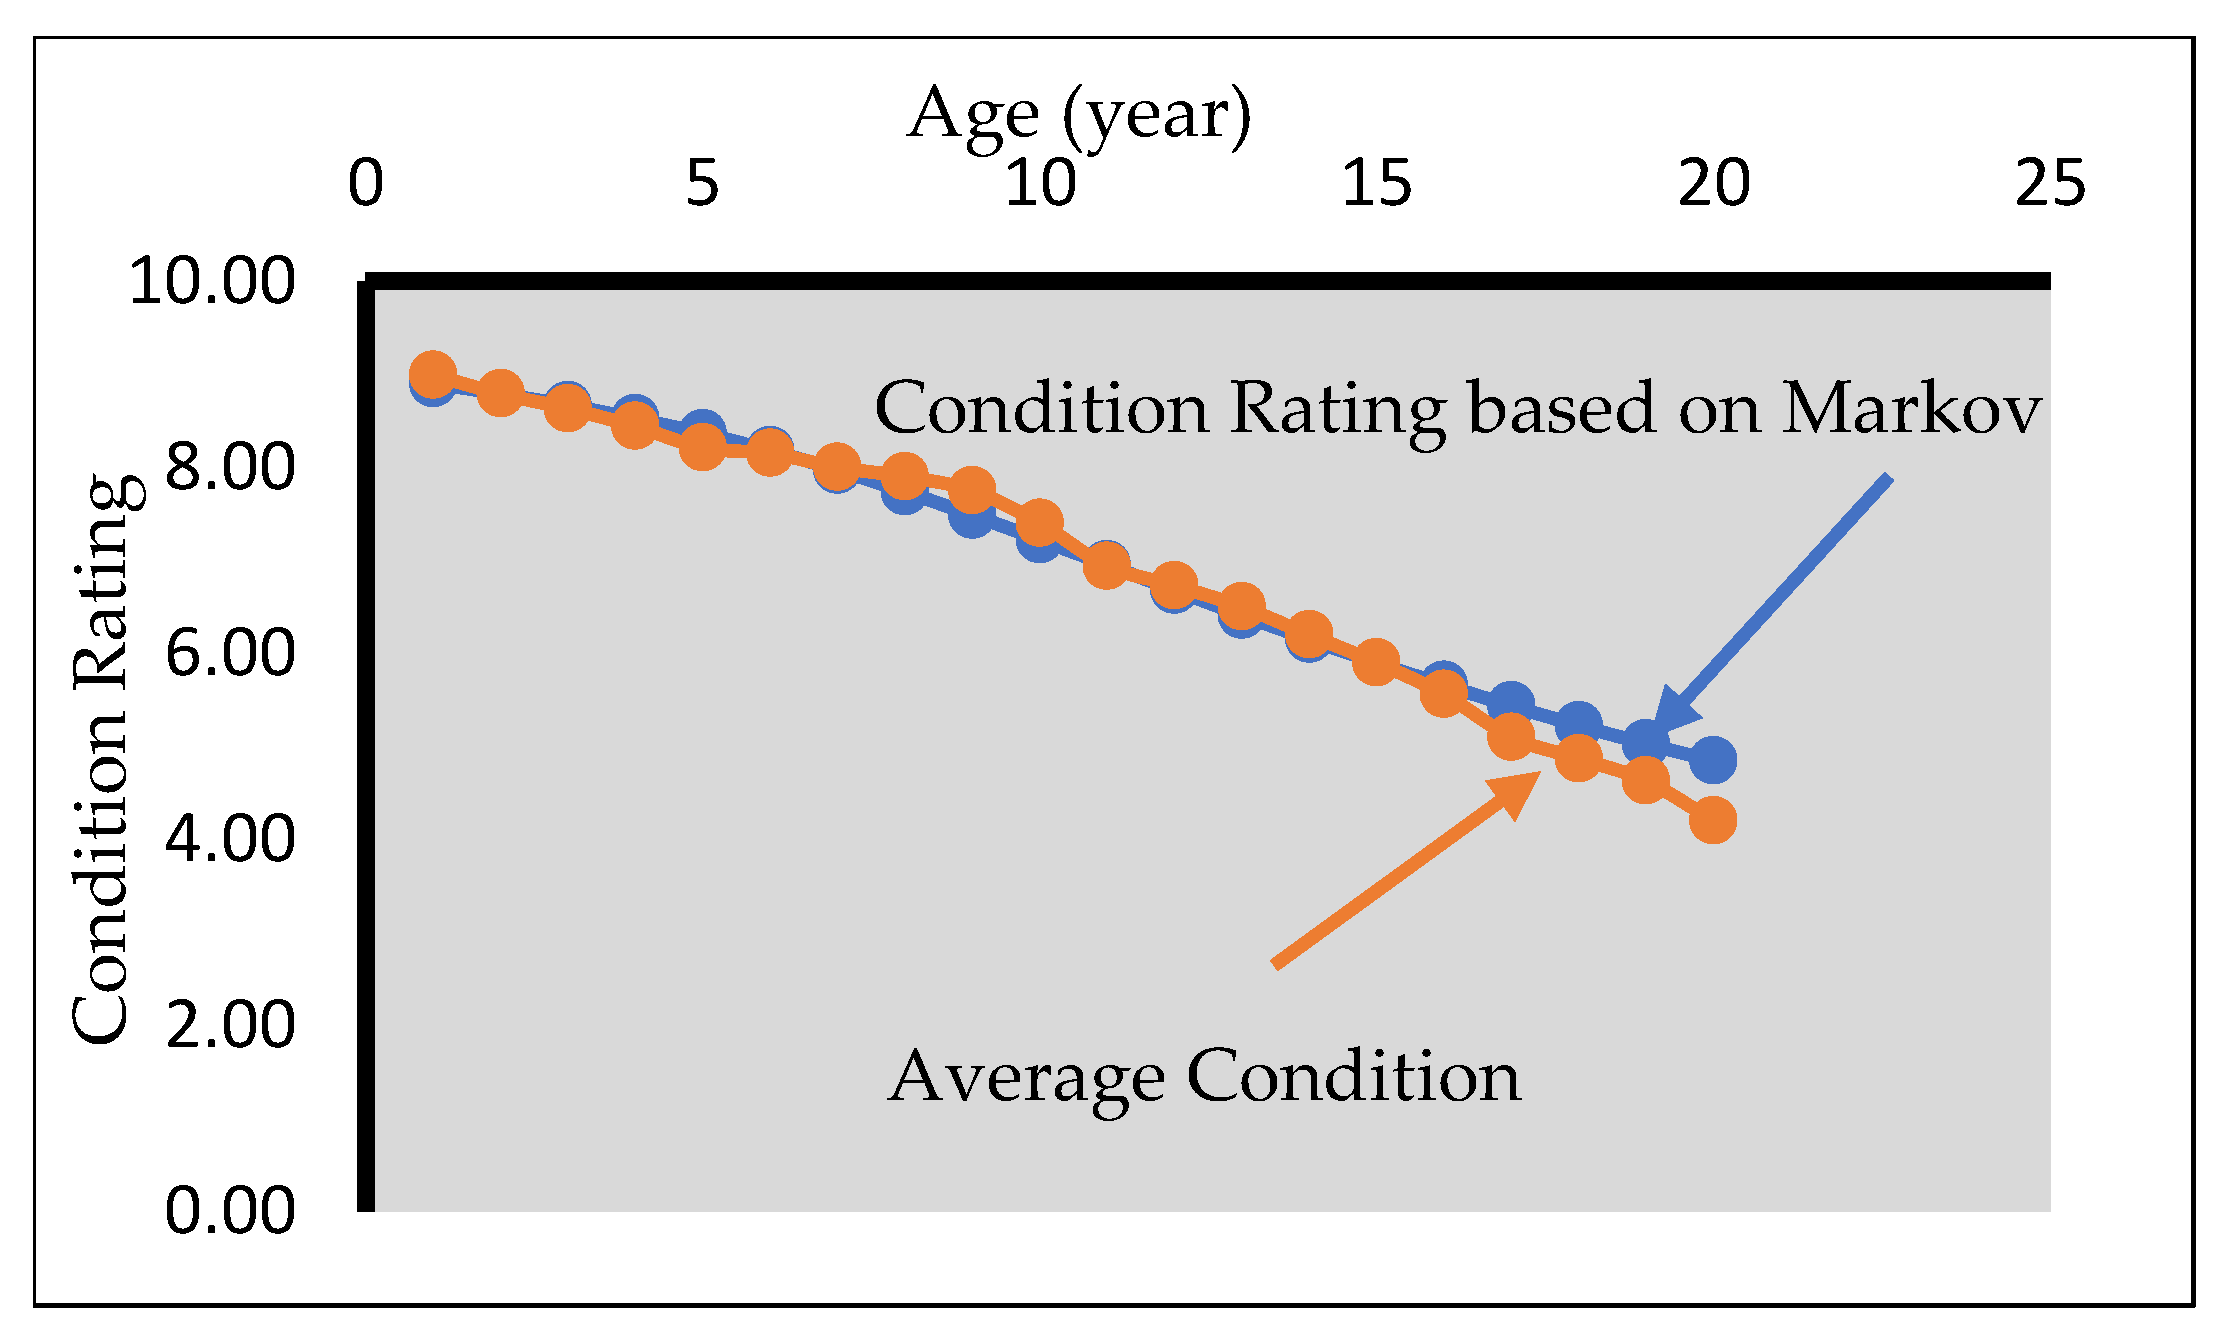
Figure 17.
Deterioration curve for slabs.
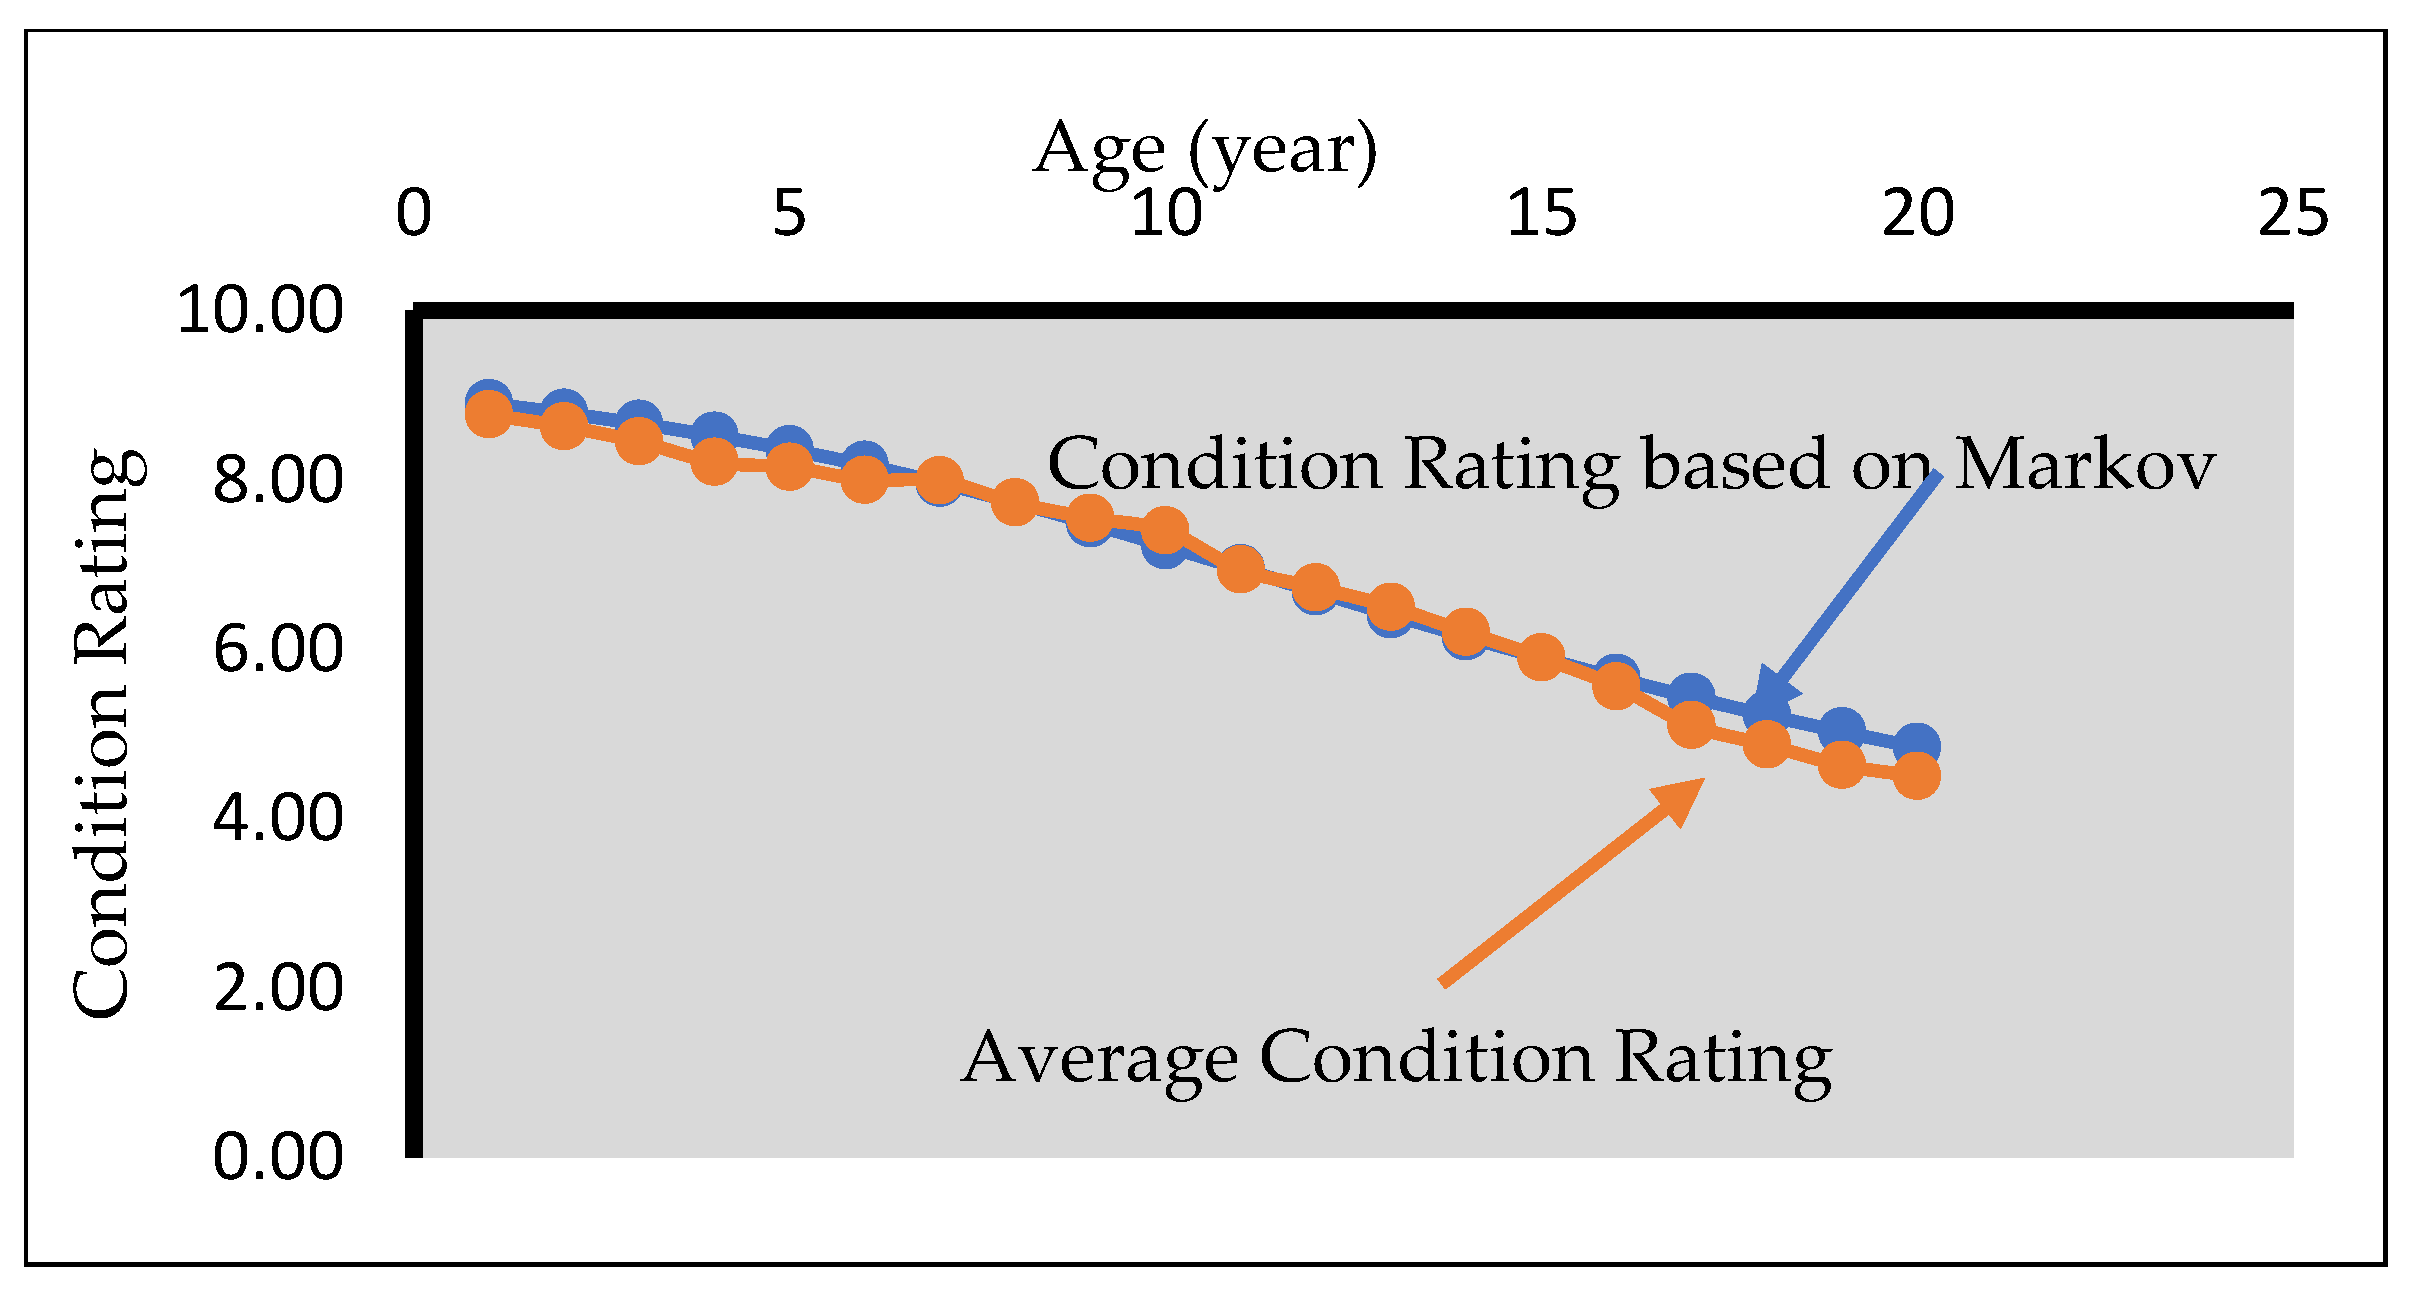
Figure 18.
Comparison of ranking the current Bridge Condition Rating by:(a)fuzzy decision model ,(b) MCM, and (c) bridge inspection experts report (actual condition rating).
Figure 18.
Comparison of ranking the current Bridge Condition Rating by:(a)fuzzy decision model ,(b) MCM, and (c) bridge inspection experts report (actual condition rating).
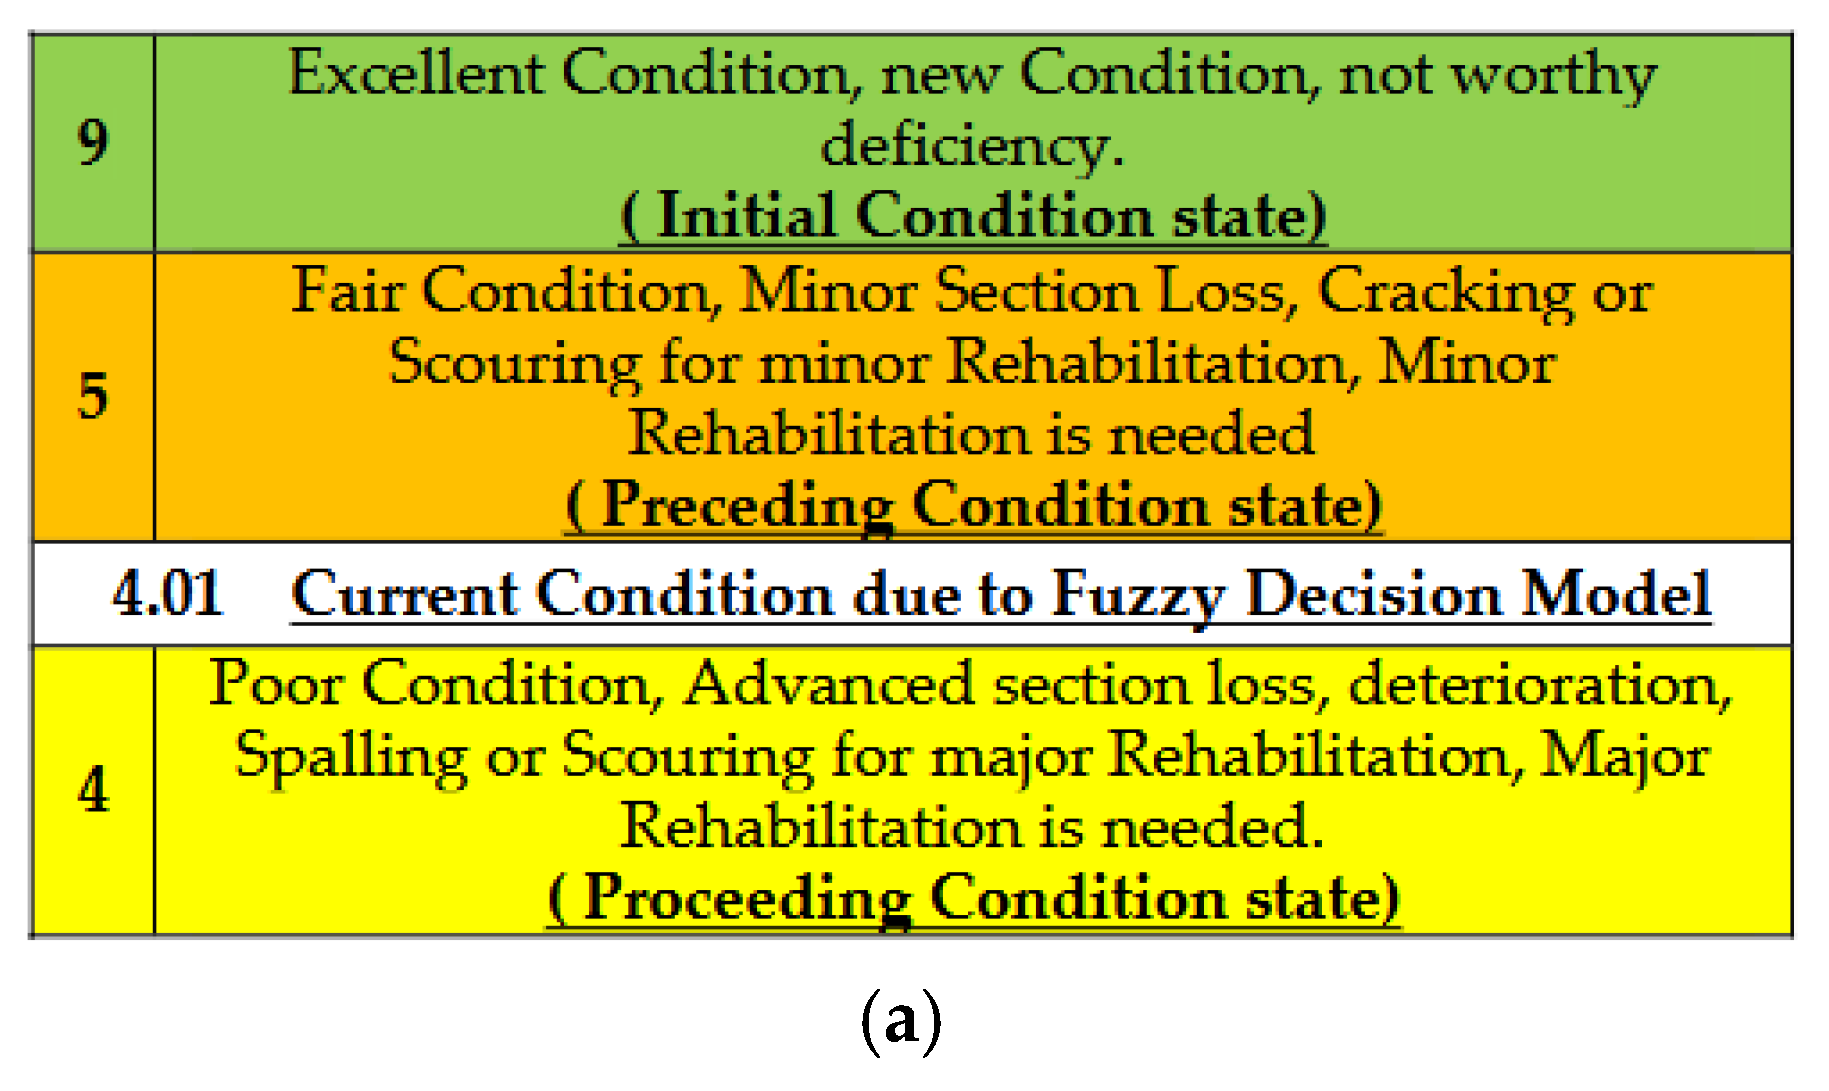
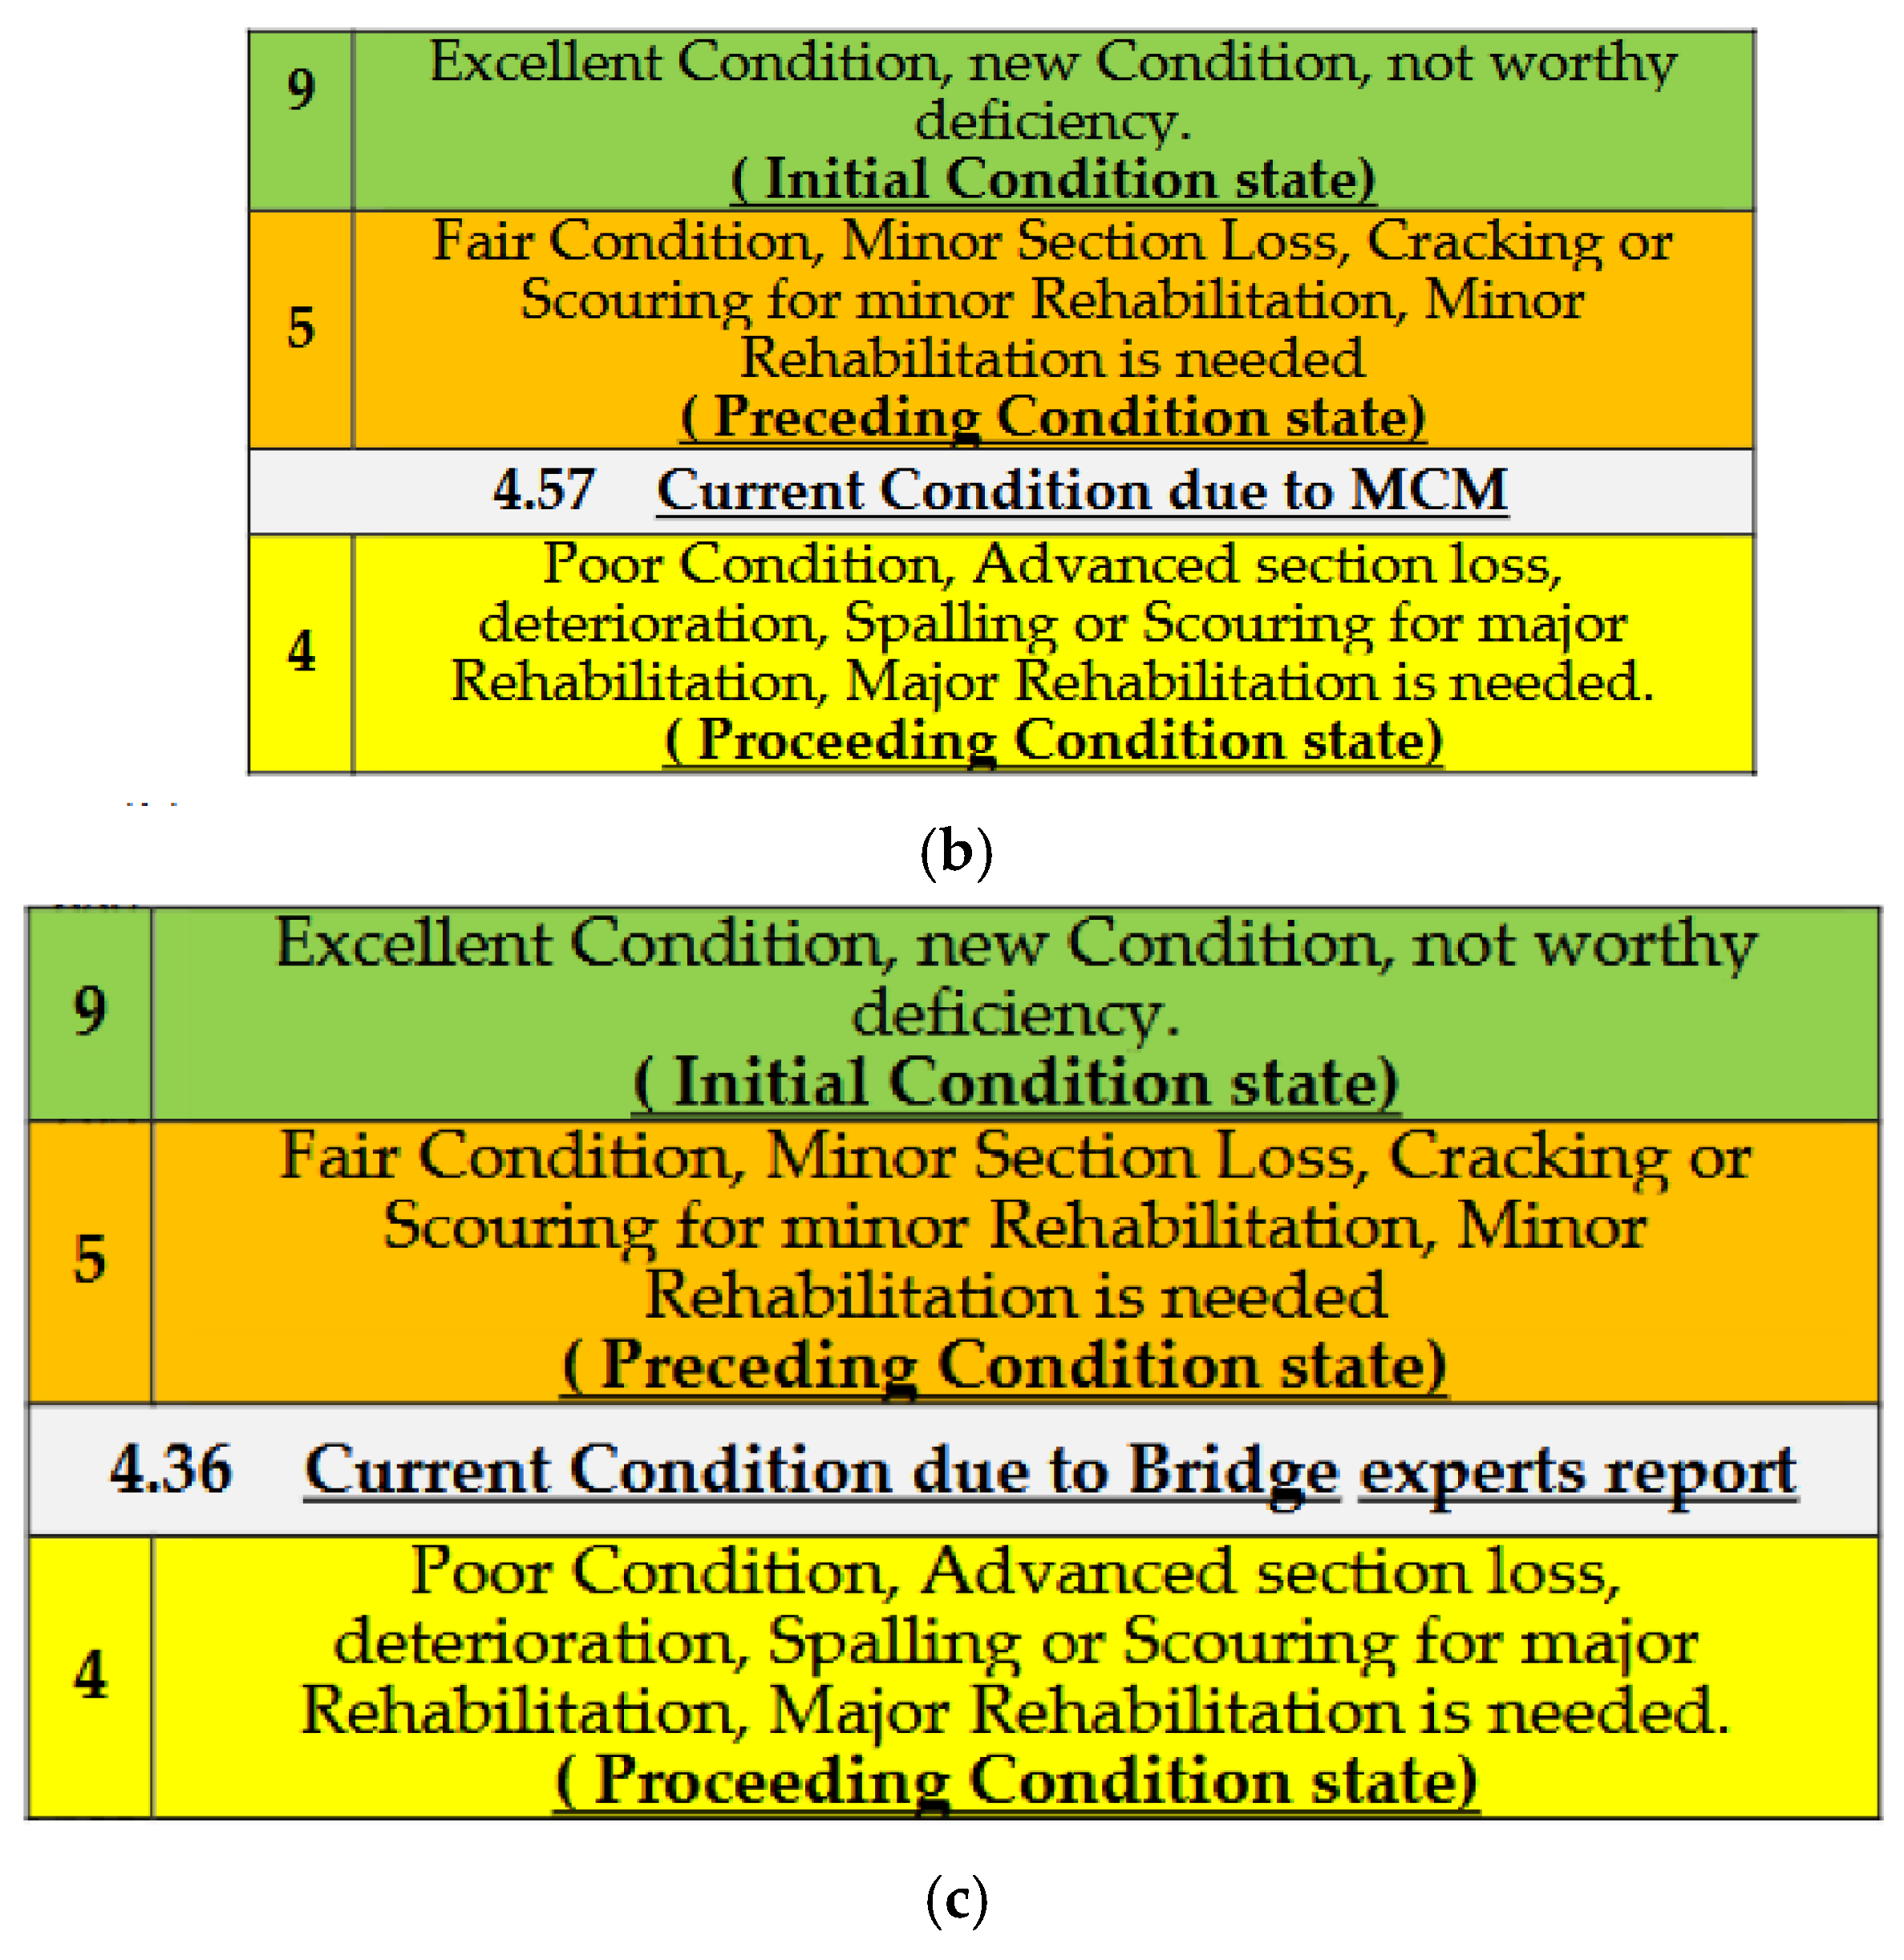
Table 1.
Scaling Deterioration as per FHWA, 2012 [22].
Table 1.
Scaling Deterioration as per FHWA, 2012 [22].
| Rating | Description |
|---|---|
| 10-N | Not applicable ( Just-Constructed) |
| 9 | Excellent Condition, new Condition, not worthy deficiency. |
| 8 | Very Good Condition, No repair is needed |
| 7 | Good Condition, Some minor Problems for Minor maintenance. |
| 6 | Satisfactory Condition, some minor deterioration for major maintenance. |
| 5 | Fair Condition, Minor Section Loss, Cracking or Scouring for minor Rehabilitation, Minor Rehabilitation is needed |
| 4 | Poor Condition, Advanced section loss, deterioration, Spalling or Scouring for major Rehabilitation, Major Rehabilitation is needed. |
| 3 | Serious Condition, Section Loss, Deterioration, Spalling or Scouring have seriously affected primary Structural components, Immediate Rehabilitation is needed. |
| 2 | Critical Condition, advanced deterioration of Primary Structural elements, Urgent Rehabilitation, the Structure may be closed until Corrective Actions taken. |
| 1 | Imminent Failure Condition, Major Deterioration or Section loss, Structure may be closed until Corrective actions which may put it back into light service. |
| 0 | Failed Condition, Beyond Corrective action, Out-of Service |
| Component | Weight | |
|---|---|---|
| 1 | Primary members | 15 |
| 2 | Deck | 12 |
| 3 | Abutment | 12 |
| 4 | Piers | 12 |
| 5 | Bearings | 9 |
| 6 | Bridge Seats | 9 |
| 7 | Wing walls | 7 |
| 8 | Back Wall | 7 |
| 9 | Secondary members | 6.5 |
| 10 | Joints | 4.5 |
| 11 | Wearing Surface | 4.5 |
| 12 | Sidewalks | 1 |
| 13 | Curb | 0.5 |
Table 3.
Proposed element weight.
| Component | Weight | |
|---|---|---|
| 1 | Primary members | 10 |
| 2 | Deck | 8 |
| 3 | Abutment | 8 |
| 4 | Piers | 8 |
| 5 | Bearings | 6 |
| 6 | Bridge Seats | 6 |
| 7 | Wing walls | 5 |
| 8 | Back Wall | 5 |
| 9 | Secondary members | 5 |
| 10 | Joints | 4 |
| 11 | Wearing Surface | 4 |
| 12 | Sidewalks | 2 |
| 13 | Curb | 1 |
Table 4.
Degrees of corrosion and how they affect surface condition of concrete [24].
Table 4.
Degrees of corrosion and how they affect surface condition of concrete [24].
| Corrosion Degree | Steel Bars Condition |
|---|---|
| Condition-1 | Mill scale remains on the surface of steel bars, rust forms on the surface of reinforcing bars, but it is "thin" and the bar is "solid" throughout; rust is not formed on the surface of concrete. |
| Condition-2 | Small region covered by the "partly floating rust" and the rust is spotty too |
| Condition-3 | "Floating rust" is seen across the the entire circumstance or length of the reinforcement bars, although there is no observable loss of cross section area. |
| Condition-4 | "Loss of cross sectional area" is observed in reinforcing bars. |
Table 5.
Degrees of corrosion /surface conditions.
| Corrosion Degree | Concrete Surface Condition | Subjective Assessment of Concrete Surface |
|---|---|---|
| Condition-1 | Unchanged | 6 |
| Condition-2 | Slight | 5 |
| Condition-3 | Obvious | 4 |
| Condition-4 | Deteriorated | 3 |
Table 6.
The numerical value of the corrosion rate based on pH values.
| pH value | f(x): Corrosion rate (mm/year) | Corrosion degree |
|---|---|---|
| 14 | 0.007214286 | Low |
| 13.6 | 0.022588235 | |
| 13.2 | 0.038893939 | |
| 12.8 | 0.05621875 | |
| 12.4 | 0.07466129 | |
| 12 | 0.094333333 | |
| 11.6 | 0.115362069 | Moderate |
| 11.2 | 0.137892857 | |
| 10.8 | 0.162092593 | |
| 10.4 | 0.188153846 | |
| 10 | 0.2163 | |
| 9.6 | 0.25 | Significant |
| 9.2 | 0.25 | |
| 8.8 | 0.25 | |
| 8.4 | 0.25 | |
| 8 | 0.25 | |
| 7.6 | 0.25 | |
| 7.2 | 0.25 | |
| 6.8 | 0.25 | |
| 6.4 | 0.25 | |
| 6 | 0.25 | |
| 5.6 | 0.25 | |
| 5.2 | 0.25 | |
| 4.8 | 0.25 | |
| 4.4 | 0.25 | |
| 4 | 0.25 | |
| 3.6 | 3.227719136 | Critical |
| 3.2 | 3.494957031 | |
| 2.8 | 3.854637755 | |
| 2.4 | 4.362368056 | |
| 2 | 5.12725 | |
| 1.6 | 6.392828125 | |
| 1.2 | 8.817472222 | |
| 0.8 | 14.8493125 | |
| 0.4 | 42.40525 |
Table 7.
Semi quantitative condition rating score based on FHWA, 2012 [22].
Table 7.
Semi quantitative condition rating score based on FHWA, 2012 [22].
| 6 | Satisfactory Condition |
| 5 | Fair Condition |
| 4 | Poor Condition |
| 3 | Serious Condition. |
Table 8.
Fuzzy decision rule.
| Rule no | Corrosion degree | Concrete surface condition | Semi-quantitative condition rating |
|---|---|---|---|
| 1 | Low (L) | Unchanged (UC) | Satisfactory (ST) |
| 2 | Low (L) | Slight (SL) | Fair (F) |
| 3 | Low (L) | Obvious (O) | Poor (P) |
| 4 | Low (L) | Deteriorate (D) | Serious (S) |
| 5 | Moderate (M) | Unchanged (UC) | Satisfactory (ST) |
| 6 | Moderate (M) | Slight (SL) | Fair (F) |
| 7 | Moderate (M) | Obvious (O) | Poor (P) |
| 8 | Moderate (M) | Deteriorate (D) | Serious (S) |
| 9 | Significant (SI) | Unchanged (UC) | Fair (F) |
| 10 | Significant (SI) | Slight (SL) | Poor (P) |
| 11 | Significant (SI) | Obvious (O) | Poor (P) |
| 12 | Significant (SI) | Deteriorate (D) | Serious (S) |
| 13 | Critical ( C) | Unchanged (UC) | Poor (P) |
| 14 | Critical ( C) | Slight (SL) | Poor (P) |
| 15 | Critical ( C) | Obvious (O) | Serious (S) |
| 16 | Critical ( C) | Deteriorate (D) | Serious (S) |
Table 9.
Defuzzification of the fuzzy set for the first case.
| Corrosion Rate( mm/yr) | Semi Quantitative Condition Rating Score | |||||||||
|---|---|---|---|---|---|---|---|---|---|---|
| 0.5 | 4.01 | 4.01 | 4.01 | 4.01 | 4.01 | 3.87 | 3.35 | 3.41 | 3.35 | 3.35 |
| 0.45 | 4.01 | 4.01 | 4.01 | 4.01 | 4.01 | 3.87 | 3.35 | 3.41 | 3.35 | 3.35 |
| 0.4 | 4.01 | 4.01 | 4.01 | 4.01 | 4.01 | 3.87 | 3.35 | 3.41 | 3.35 | 3.35 |
| 0.35 | 4.01 | 4.01 | 4.01 | 4.01 | 4.01 | 3.87 | 3.35 | 3.41 | 3.35 | 3.35 |
| 0.3 | 4.5 | 4.5 | 4 .5 | 4.5 | 4.01 | 3.87 | 3.86 | 3.87 | 3.41 | 3.41 |
| 0.25 | 5 | 5 | 5 | 4.5 | 4.01 | 4.01 | 4.01 | 3.87 | 3.35 | 3.35 |
| 0.2 | 5.13 | 5.13 | 5.13 | 4.51 | 4.5 | 4.51 | 4.01 | 3.87 | 3.41 | 3.41 |
| 0.15 | 5.68 | 5.68 | 5.68 | 5.12 | 5 | 4.51 | 4.01 | 3.87 | 3.35 | 3.35 |
| 0.1 | 5.65 | 5.65 | 5.65 | 5.12 | 5 | 4.51 | 4.01 | 3.87 | 3.38 | 3.38 |
| 0.05 | 5.68 | 5.68 | 5.68 | 5.12 | 5 | 4.51 | 4.01 | 3.87 | 3.35 | 3.35 |
| Concrete Surface Condition | 7 | 6.5 | 6 | 5.5 | 5 | 4.5 | 4 | 3.5 | 3 | 2.5 |
Table 10.
Defuzzification of the fuzzy set for the second case.
| Corrosion Degree | Semi Quantitative Condition Rating Score | ||||||
|---|---|---|---|---|---|---|---|
| 0.3 | 4 | 4 | 4 | 3.87 | 3.32 | 3.38 | 3.32 |
| 0.28 | 4.4 | 4.44 | 4 | 3.87 | 3.8 | 3.85 | 3.36 |
| 0.23 | 5.03 | 4.54 | 4.29 | 4.33 | 4 | 3.87 | 3.36 |
| 0.18 | 5.67 | 5.13 | 5 | 4.5 | 4 | 3.87 | 3.33 |
| 0.13 | 5.61 | 5.11 | 5 | 4.5 | 4 | 3.89 | 3.39 |
| 0.08 | 5.62 | 5.12 | 5 | 4.5 | 4 | 3.88 | 3.38 |
| 0.03 | 5.67 | 5.13 | 5 | 4.5 | 4 | 3.87 | 3.33 |
| Concrete Surface Condition | 6 | 5.5 | 5 | 4.5 | 4 | 3.5 | 3 |
Table 11.
Defuzzification of the fuzzy set for the third case.
| Corrosion Degree | Semi Quantitative Condition Rating Score | |||||||||
|---|---|---|---|---|---|---|---|---|---|---|
| 0.48 | 4 | 4 | 4 | 4 | 4 | 3.87 | 3.32 | 3.38 | 3.32 | 3.32 |
| 0.43 | 4 | 4 | 4 | 4 | 4 | 3.87 | 3.32 | 3.38 | 3.32 | 3.32 |
| 0.38 | 4 | 4 | 4 | 4 | 4 | 3.87 | 3.32 | 3.38 | 3.32 | 3.32 |
| 0.33 | 4.29 | 4.29 | 4.29 | 4.29 | 4 | 3.87 | 3.72 | 3.73 | 3.38 | 3.38 |
| 0.28 | 5 | 5 | 5 | 4.5 | 4 | 4 | 4 | 3.87 | 3.35 | 3.35 |
| 0.23 | 5.02 | 5.02 | 5.02 | 4.52 | 4.21 | 4.26 | 4 | 3.87 | 3..34 | 3.34 |
| 0.18 | 5.31 | 5.31 | 5.31 | 4.82 | 4.73 | 4.5 | 4 | 3.87 | 3.35 | 3.35 |
| 0.13 | 5.66 | 5.66 | 5.66 | 5.13 | 5 | 4.5 | 4 | 3.87 | 3.34 | 3.34 |
| 0.08 | 5.68 | 5.68 | 5.68 | 5.13 | 5 | 4.5 | 4 | 3.87 | 3.37 | 3.37 |
| 0.03 | 5.68 | 5.68 | 5.68 | 5.13 | 5 | 4.5 | 4 | 3.87 | 3.32 | 3.32 |
| Concrete Surface Condition | 7 | 6.5 | 6 | 5.5 | 5 | 4.5 | 4 | 3.5 | 3 | 2.5 |
Table 12.
Values of constant C1 due to type of cement [24].
Table 12.
Values of constant C1 due to type of cement [24].
| Type of cement | C1 |
|---|---|
| Ordinary Portland cement ( type I ) | 1 |
| Ordinary Portland cement (type II) | 0.6 |
| Ferrous cement (ferrous slag 30% - 40%) | 1.4 |
| Ferrous cement (ferrous slag 60%) | 2.2 |
Table 13.
Values of C2 due to concrete atmospheric condition [24].
Table 13.
Values of C2 due to concrete atmospheric condition [24].
| Concrete atmospheric condition | C2 |
|---|---|
| wet concrete | 0.3 |
| Externally exposed concrete members | 0.5 |
| Internally exposed members. | 1 |
Table 14.
The bridge component rating for bridge elements based on Fuzzy analysis technique.
| Component No | Corrosion rate based on PH value (mm/yr) | Corrosion Degree | Concrete Surface Condition | Subjective assessment of concrete surface | Semi-quantitative condition Semi-quantitative condition | Average rate | Component rate* Weight |
|---|---|---|---|---|---|---|---|
| S1L1 | 0.13 | 2 | 3 | 4 | 4 | 4.5 | 54 |
| S6L1 | 0.08 | 1 | 2 | 5 | 5 | ||
| G1L1 | 0.065 | 1 | 3 | 4 | 4 | 4.2 | 63 |
| G2L1 | 0.03 | 1 | 3 | 4 | 4 | ||
| G3L1 | 0.042 | 1 | 2 | 5 | 5 | ||
| G4L1 | 0.25 | 3 | 3 | 4 | 4 | ||
| G5L1 | 0.02 | 1 | 3 | 4 | 4 | ||
| AB1 | 0.01 | 1 | 3 | 4 | 4 | 4 | 48 |
| AB2 | 0.095 | 1 | 3 | 4 | 4 | ||
| W21 | 0.06 | 1 | 3 | 4 | 4 | 4.5 | 31.5 |
| W22 | 0.042 | 1 | 2 | 5 | 5 | ||
| D1L1 | 0.25 | 3 | 3 | 4 | 4 | 4 | 60 |
| BCR 1 = 4.01 | |||||||
Table 15.
Summary of condition rating based on proposed MCM.
| Element | Predicted condition rating | CR*Wt |
|---|---|---|
| Deck Slabs | 4.84 | 58.08 |
| Girder | 4.85 | 72.75 |
| abutment | 4.89 | 58.68 |
| wing wall | 4.84 | 33.88 |
| Diaphragm | 4.63 | 69.45 |
| Overall BCR 2= 4.576 | ||
Disclaimer/Publisher’s Note: The statements, opinions and data contained in all publications are solely those of the individual author(s) and contributor(s) and not of MDPI and/or the editor(s). MDPI and/or the editor(s) disclaim responsibility for any injury to people or property resulting from any ideas, methods, instructions or products referred to in the content. |
© 2025 by the authors. Licensee MDPI, Basel, Switzerland. This article is an open access article distributed under the terms and conditions of the Creative Commons Attribution (CC BY) license (http://creativecommons.org/licenses/by/4.0/).
Copyright: This open access article is published under a Creative Commons CC BY 4.0 license, which permit the free download, distribution, and reuse, provided that the author and preprint are cited in any reuse.


