
Submitted:
09 April 2025
Posted:
10 April 2025
Read the latest preprint version here
Abstract
Hyperspectral Remote Sensing allows the accurate analysis of the developmental stages of insects and their interactions with biocontrol agents. This study spectrally characterizes the life stages of Diatraea saccharalis and evaluates the physiological responses of larvae parasitized by Cotesia flavipes. For this, hyperspectral reflectance data were obtained with high-precision sensors. The experiments took place in the laboratory under controlled conditions to ensure reproducibility. The measurements cov-ered eggs, larvae, pupae and adults, with emphasis on parasitized larvae. Principal Component Analy-sis (PCA) was applied to identify relevant significant hyperspectral variations and distinguish biologi-cal groups. The results showed significant differences in hyperspectral reflectances between the developmental stages and the physiological state of the parasitism larvae. Newly laid eggs and newly formed pupae showed higher reflectance than pre-hatch eggs and old pupae. The larvae of the first stage were sig-nificantly distinguished from the other larval stages by their high reflectance. In adults, the dorsal sur-faces of males and females were similar, but the ventral surface of females exhibited a distinct pat-tern. Larvae parasitized by C. flavipes showed differentiated hyperspectral signatures, especially in the near-infrared (NIR) bands, reflecting biochemical and physiological changes caused by parasit-ism. Between 8 and 10 days after parasitism, the reflectance of the larvae became similar to that of dead larvae and different from those of live or newly parasitized larvae. PCA confirmed the efficacy of hyperspectral reflectance in discriminating the stages of D. saccharalis. The data generated in this study can integrate a hyperspectral bank for future applications in ento-mology and biological control, with this technology being able to integrate precision agriculture sys-tems, optimizing for characterization, pest management and reinforcing the sustainable use of agricul-tural resources.
Keywords:
Sugarcane
; spectroradiometer
; Proximal Remote Sensing
; Reflectance
; sugarcane borer
; parasitism
1. Introduction
O Proximal Remote Sensing refers to the acquisition and analysis of spectral data (reflectance or transmittance) of objects positioned less than 1 meter from the image sensor [1]. It is a fast and non-invasive imaging technique, in which target objects, such as insects, are positioned very close to the lens of a camera for a few seconds, and reflectance or transmittance data are collected using an image sensor [2,3,4].
The image sensor operates in distinct spectral bands: visible light (blue, green, and red), multispectral (5 to 12 bands), and hyperspectral (more than 50 bands) [5]. Modern Proximal Remote Sensing systems use multispectral and hyperspectral devices, which allow a high-precision synoptic view of areas of insect and disease cover or attack, surpassing conventional monitoring methods and data collection [6].
This technology represents a new approach to the detection, prediction, and control of agricultural pests [7,8]. Its applications in agriculture generally consist of analyzing and interpreting electromagnetic signals reflected by the body of insects or vegetation. These signals provide valuable information, allowing for more informed decisions [9]. The use of the near-infrared (NIR) band in spectroscopy has made it possible to obtain structural and compositional data from insect tissues. This methodology has demonstrated efficacy in studies on host responses to parasitism [6].
Several studies have illustrated the applications of proximal hyperspectral Remote Sensing, highlighting: insect parasitism, such as the distinction of immature species of Trichogramma spp. (Hymenoptera.: Trichogrammatidae), developing inside the host's eggs [10], age classification of mosquitoes (Anopheles spp.) and fruit fly species, Drosophila melanogaster Meigen, 1830 and D. simulans Sturtevant, 1919 (Diptera: Drosophilidae) [1], responses to terminal stress caused by exposure of maize weevils, Sitophilus zeamais (Motschulsky, 1855) (Coleoptera: Curculionidae), to aqueous plant extracts and infection of mealworms, Cynaeus angustus (LeConte, 1851) (Coleoptera: Tenebrionidae)), by entomopathogenic nematodes [6], estimates of initial growth and biomass of pea [11], evaluation of damage of apartment roofs after climatic disasters [12], comparison of physiological and agronomic measures in tomato leaves and identifying genotypes resistant to water stress [13]. This last study, for example, described how Proximal Remote Sensing can contribute to optimize the physiological and agronomic phenotyping processes of tomato plants. In addition, at the level of the Mississippi River Delta (USA), proximal Remote Sensing has been applied in determining the damage caused by aphid species and for detecting the most likely areas where insects could attack wheat crops [8]. The entomological applications of Proximal Remote Sensing materialize in the identification of insects and/or in the responses of plants attacked by pest insects [14]. These studies show that although certain damage to plants or insect species is indistinguishable to the naked eye, internal physiological changes and metabolic changes can be detected through body reflectance characteristics [2,15].
Sugarcane, Saccharum spp. L. (Poales: Poaceae), is one of the main sources of processed sugar and bioethanol. Brazil is the world's largest producer, with more than 10 million hectares under cultivation [16,17,18] and is responsible for 40% of global sugarcane production, 20% of world sugar consumption, and 90% of global bioethanol production [19]. Brazilian sugarcane production accounts for more than half of the world market, being a crop of great economic importance for the country [20,21]. Each year, agricultural production increases to meet the growing needs of the global population [22]. However, sugarcane cultivation faces significant challenges due to the attack of diseases and pests, especially species of the orders Lepidoptera, such as Hyponeuma taltula (Schaus, 1904) (Erebidae), Diatraea spp. (Crambidae) and Coleoptera such as Sphenophorus levis Vaurie, 1978 (Curculionidae) and Leucothyreus sp. (Scarabaeidae)) [23,24].
The sugarcane borer, D. saccharalis Fabricius, 1794 (Lepidoptera: Crambidae) is the main pest faced by producers, causing productivity losses (stem quality and yield). It is present in almost all sugarcane-producing regions, generating annual losses estimated at R$ 5 billion [20,25]. Several control methods are being used to combat this pest, including the use of chemical and biological insecticides [26]. In Brazil, biological control by natural enemies, such as parasitoids and predators, has grown rapidly, replacing chemical methods, whose harmful effects on human health and pest resistance present challenges [27].
Cotesia flavipes Cameron, 1891 (Hymenoptera: Braconidae) is one of the most effective parasitoids against lepidoptera, considerably reducing the populations of D. saccharalis [28]. This parasitoid acts in the larval stage of the host, with high rates of parasitism, although influenced by environmental factors and the age of the parasitoid [29]. The ability of C. flavipes to locate and parasitize D. saccharalis larvae makes it a strategic choice for biological control [30,31]. This potential has encouraged the massive production of C. flavipes in laboratories, not only to study its parasitism behavior and efficiency, but also for large-scale distribution in infested areas [3]. Currently, more than 3 million hectares of sugarcane in Brazil are under biological control by C. flavipes, making it the most widely released parasitoid in the country [32,33,34]. However, spectral information on the stages of development of this parasitoid inside the host larvae is still lacking. The efficient use of C. flavipes against D. saccharalis requires extensive knowledge and precise monitoring.
Methods currently used to characterize and identify insects in their different stages of development include PCR (Polymerase Chain Reaction) and gene transcription analysis. However, these processes often destroy samples, require skilled molecular biologists, are time-consuming, and are dependent on expensive equipment [1,2,3,35]. Given this limitation, it is essential to adopt innovative, fast and accurate methods, such as hyperspectral Remote Sensing applied in entomology [1]. This technique represents a promising and indispensable tool in precision agriculture (modern agriculture), contributing significantly to the detection, monitoring, and characterization of insects [36].
In addition, the use of hyperspectral reflectance data (images) for the diagnosis of target insects suggests that this technology could be applied in the characterization of the developmental stages of parasitoids and pest insects associated with sugarcane [37].
This study is based on the hypothesis that hyperspectral Remote Sensing can be used to acquire and analyze body reflectance characteristics (physiological) of insects, allowing to accurately differentiate the stages of eggs, larvae, pupae and adults of D. saccharalis. The objective was to characterize and easily identify the different life stages of D. saccharalis, as well as the developmental stages of larvae parasitized by C. flavipes.
2. Material and Methods
An integrated approach was adopted for the execution of this work, following a strict protocol for data collection.
2.1. Development Sites
The study was carried out at the Laboratory of the Center for Geomatics and Precision Agriculture (L-NGAP) of the Department of Engineering of FCAV/UNESP, Jaboticabal, SP, at the Laboratory of Biology and Insect Breeding (LBCI) of the Department of Plant Health of FCAV/UNESP, Jaboticabal, SP, and at the São Martinho Plant (USM) in Pradópolis, SP.
2.2. Insect Breeding
The insects (D. saccharalis and C. flavipes) were raised in the biofactory of Usina São Martinho (USM) under controlled conditions of temperature (25 ± 2°C), relative humidity (70 ± 10%) and with 14 hours of light and 10 hours of darkness. The rearing of D. saccharalis larvae was carried out in 20 ml flat-bottomed test tubes, containing the artificial diet, according to the USM rearing protocol, with a modified diet for rearing [38,39] (Table 1).
Laying was performed in PVC tubes 20 cm high and 15 cm in diameter. These tubes were lined with sheets of A4 paper, on which the females laid their eggs. Twenty-four hours after laying, the sheets of A4 paper containing the egg masses were removed, treated with a 10% copper sulfate solution and placed in plastic bowls for follow-up until the pre-hatch stage. At this stage, each egg mass was cut and transferred to tubes containing artificial diet, allowing the larvae to feed after hatching. The larvae were then followed for 20 days, with substrate changes performed as necessary, when they were used in the bioassays.
Cotesia flavipes was reared on larvae of D. saccharalis. Each larva, 20 days after hatching, was submitted to an adult female of Cotesia and, after parasitism, the larvae were placed in Petri dishes (7.0 cm x 1.5 cm) containing artificial diet and 4 individuals per dish.
2.3. Bioassay
The bioassays were conducted in the laboratory at USM. From the rearing kept in the laboratory, the following were removed for analysis: (i) 4 egg masses (replicates) with 24 hours and 6 days of incubation; (ii) 4 larvae (repeats) of the different stages (1 to 5) (larva 1: 7 DAH, larva2: 15 DAH, larva3: 20 DAH, larva4: 30 DAH, larva5: 40 DAH, where DAH is days after egg hatching); (iii) 4 groups (A, B, C, D) of 4 caterpillars with 20 days of development were parasitized by C. flavipes; (iv) 2 groups of 4 pupae per each group (new pupae 2 days after formation and old pupae 9 days after formation); and (vi) adults, 4 males and 4 females (repeats) with 5 days of longevity. All these analyses were carried out in duplicate.
2.4. Hyperspectral Remote Sensing
The collection of hyperspectral proximal Remote Sensing data was carried out based on the methods described by Nansen; Strand (2018) and Nansen et al. (2019). A hyperspectral pushbroom camera, model PIKA L (RESONON Inc., Bozeman, MT, USA), was used with the following specifications: which collects 160 spectral bands in the range of 300 to 1000 nm (visible and NIR spectrum). The camera lens has a focal length of 35 mm (maximum aperture of F1.4) and has the following specifications: Firewire interface (IEEE 1394b); digital output (12-bit); 7-degree angular field of view; Spectral resolution is 3.3 nm.
All hyperspectral data were collected in the laboratory using a specific illumination for the sensor. A voltage stabilizer (Tripp-Lite, PR-7b, www.radioreference.com) was used to keep the lighting steady. A calibration in the dark was performed by keeping the camera lid closed. Next, the cover was removed and a white Teflon plate (K-Mac Plastics) was used for the calibration of the white in the sample holder. "Relative reflectance" was referred to as proportional reflectance compared to that obtained in Teflon. For the acquisition of data from the samples in the laboratory, the hyperspectral camera was positioned at a height of 20 cm above the samples. A notebook with Spectronon Pro software, version 4.0, was used to collect and record the data (Figure 1).
2.5. Procedure and Data Collection
The acquisition of hyperspectral reflectance data was performed in three series according to the methods of [1,10].
2.5.1. First Series
It consisted of the acquisition of hyperspectral reflectance data from eggs (recently laid or new and pre-hatching eggs or old eggs), live larvae (stages 1 to 5 that form separated according to the days after hatching the eggs and according to the average days of development of each larval stage in the literature) and pupae (newly formed, with 2 days after formation and close to adult emergence, with 9 days after formation) of D. saccharalis (Figure 2).
4 individuals (replicates) of each stage were analyzed separately. Each sample was placed separately on the black sensor stage (allowing to eliminate any reflectance related to the substrate) under the hyperspectral camera for a few seconds (10 to 20 s) to collect the reflectance data. Data from each and the same sample were collected every 24 hours for 5 consecutive days.
2.5.2. Second Series
It consisted of sacrificing larvae (stage 4) with a drop of 70% ethanol (topical application); after treatment they were placed on filter paper for drying for 15 min underlaboratory conditions (25-27 °C: RH 70-80% and photophase 12 hours). The sacrificed and live pupae formed four replicates in each case.
Each adult (male and female), previously placed in a plastic cup, was killed by asphyxiation with 70% ethanol, lightly soaked in hydrophilic cotton placed on the lid in a small hole until their movements ceased. This method of sacrificing the insects has no negative influence on the evaluations of the samples because 70% ethanol is a solution that evaporates very quickly and does not leave any droplets that alter the reflectance of the samples. In each case, four replications were performed, and the samples were submitted to hyperspectral data acquisition every 24 hours for 5 consecutive days (Figure 3).
2.5.3. Third Series
Larvae of the 3rd stage (20 days after hatching) of development were subjected to parasitism by C. flavipes. The parasitized larvae were divided into four groups (A, B, C, and D) in Petri dishes, and each group consisted of four larvae: A – 4 parasitized 20-day-old larvae; B – 4 parasitized 20-day-old larvae; C – 4 parasitized 20-day-old larvae; and D – 4 parasitized 20-day-old larvae. 72 hours after parasitism, they were analyzed for 10 days every 72 hours (3rd and 6th days after parasitism) for A and B and every 48 hours (8th and 10th days after parasitism) for C and D. The parasitized larvae and the development of the parasitoid were monitored until their emergence and pupae formation (Figure 4).
2.6. Data Processing and Statistical Analysis
The parameters evaluated were the hyperspectral reflectances of the different life stages of D. saccharalis (egg, larva, pupa, and adults), of live and dead larvae, and of different stages of development of larvae parasitized by C. flavipes.
The spectral reflectance data obtained with the ViewSpecPro software were pre-processed to eliminate noise (low signal-to-noise ratio) (Figure 5), and the raw data was converted into BIL format and txt files using SpectrononPro, version 4.0 (Hyperspectral Imaging System Software). The data were imported and submitted to processing and analysis using the SAS software version 9.4 (SAS® OnDemand for Academics - SAS Institute, 2024) with the PROC MEANS, PROC ANOVA and PROC GLM packages. Appropriate radiometric filters were applied to the hyperspectral images of samples to respect the reflectance profiles. All statistical analyses were based on the average cuticle reflectance profiles and the physicochemical composition of insect samples (eggs, live larvae, dead larvae, live pupae, adults and parasitized larvae) (Figure 5). The Shapiro-Wilk and Kolmogorov-Smirnov tests were applied to verify the normality of the residuals, while the Bartlett and Leven tests were used to verify the homogeneity of variances. The means of the hyperspectral reflectances were discriminated using the Student Newman Keuls test (SNK) at the limit of 5%.
The classification of the different stages of development, dead larvae, live larvae and larvae parasitized by C. flavipes was performed by means of Principal Component Analysis (PCA) with variances explained in the "Google Colab in Pandas DataFrame with Python package upgrades and inclusions (statsmodels and scipy.stats)".
These steps seek to ensure reliable and reproducible results for the study of the spectral properties of the different stages of development of insects and hosts (parasitized larvae).
3. Results
3.1. Hyperspectral Signature of Diatraea saccharalis Eggs
Figure 6 presents the results of the analysis of the hyperspectral reflectance profiles of D. saccharalis eggs, comparing those 24 hours after laying (new eggs) and those in pre-hatching (old eggs), according to wavelengths (400-1000 nm).
The mean reflectance of new eggs, with confidence interval (CI), indicates the variability of the data and shows specific trends depending on each wavelength (Figure 6a). High reflectances were observed in the near-infrared (NIR, 700-950 nm) and low in the visible spectrum (450-600 nm). The narrow IC suggests good accuracy of reflectance measurements, while a wide reflected IC has greater variability. These results reveal a distinct spectral signature. In addition, the results of the average reflectance of the old eggs also show variations according to the wavelengths, probably due to physicochemical changes such as dehydration, coloration (due to the formation of larvae) or degradation of internal components. This distinct spectral signature, different from that of new eggs, allows differentiating the two phases of D. saccharalis eggs (Figure 6b).
The direct comparison of the reflectances highlights the wavelengths, where the differences in reflectance were most marked. Reflectance similarity was observed at wavelengths (400-430 nm) between the two phases of the eggs, while between 450 and 1000 nm (visible and NIR region), a significant difference in reflectance was observed (Figure 6c). These spectral differences indicate the possibility of detecting and classifying eggs according to the age of embryonic development. The results of the comparison, presented in the histogram (Figure 6d) show statistically significant differences (F = 9.70; P < 0.05), indicating that the spectral properties of new and pre-hatched eggs of D. saccharalis are distinct, demonstrating that new and pre-hatching eggs have different spectral signatures.
3.2. Hyperspectral Signature of Diatraea saccharalis Larvae
The curves in Figure 6 (a, b, c, d, e) illustrate the variations in hyperspectral reflectance, accompanied by confidence intervals, for the different larval stages of D. saccharalis in a range of wavelengths ranging from 400 to 1000 nm. Confidence intervals allow us to estimate the accuracy of the results and to understand the evolution of reflectance throughout larval development. The curves indicate the highest reflectance between 550 and 900 nm (visible and NIR spectrum regions), while the lowest reflectances are observed between 400 and 550 nm. These variations can be attributed to morphological, physiological, or biochemical that occur during larval development, such as thickening of the cuticle or changes in its composition, which influence the way light was reflected.
Figure 7f shows the overlapping of the curves of the mean reflectance of the five larval stages, allowing direct comparison between them. Between 400 and 650 nm, the curves show that the larval stages exhibit similar reflectances in this wavelength range. In contrast, between 650 and 900 nm, the curves diverge, revealing significant differences in reflectance between the stages, with the first instar larvae (stage 1) showing higher hyperspectral reflectance, allowing their distinction from the other larval stages, from larva 2 to larva 5.
The associated histogram (Figure 7g) shows the comparison of the reflectance averages for each stage of all wavelengths, accompanied by discrimination letters of the SNK statistical test (at the limit of 5%). These letters indicate highly significant differences (p < 0.0001), especially between stage 1 and the others. These differences can be explained by changes (morphological, physiological, or biochemical) that occur during larval development, such as cuticle thickening or variations in pigment content. These results show that hyperspectral reflectance can be used as an effective tool to identify and distinguish different larval stages of D. saccharalis.
3.3. Hyperspectral Signature of the Pupae of Diatraea saccharalis
Figure 8 (a, b, c) shows the average reflectance curves of young (newly formed) pupae and old pupae. For young (pupa-nova), the reflectance curve gradually increased from 0.05 to more than 0.4, especially at visible wavelengths (500-700 nm) and NIR (700-1000 nm). This higher reflectance is due to the physical and chemical structure of young pupae, which have a thinner and less pigmented cuticle, reflecting more light. In contrast, older pupae (pupa-velha) showed lower reflectance, especially at visible wavelengths (450-650 nm). This low reflectance can be explained by physiological and biochemical changes related to chitin, such as cuticle thickening, pigment accumulation, or tissue degradation. The confidence intervals show that the reflectance measurements were relatively accurate, with moderate variability around the means, which suggests that the differences observed between the two pupal phases are significant (p < 0.05).
Figure 8d shows the comparison of the mean reflectances of all wavelengths, showing the comparison of the distributions of the mean reflectance values between young and old pupae. For young pupae, the median reflectance was higher, confirming the observations in Figure 8c, with relatively low data dispersion, indicating homogeneity in the spectral properties of young pupae. In contrast, the median reflectance of the older pupae was lower, and the dispersion of the data was slightly greater, reflecting greater variability in spectral properties, with this variability being due to differences in the process of protein modification or degradation to allow tissue reorganization (renewal of synthesized proteins to ensure metamorphosis). In addition, the chitin present in the cuticle, which guarantees the protection of the pupa and the formation of the future exoskeleton of the adult, may also be at the origin of the reduction in spectral reflectance.
3.4. Hyperspectral Assisnatura of Adults of Diatraea saccharalis
Figure 9 illustrates the curves of the mean hyperspectral reflectance of the dorsal and ventral surfaces of adults of D. saccharalis in the wavelength range of 400-1000 nm (Figure 9 a, b, c), with the histogram (Figure 9 d) allowing to visually compare the mean reflectance between the different groups (males vs. females and dorsal vs. ventral The ventral side of adult females shows higher reflectance in the visible spectrum region (400-700 nm), while the dorsal side shows lower reflectance. In males, the reflectance of the dorsal surface was slightly higher between 400 and 550 nm, but without significant difference between 600 and 950 nm. The comparative analysis of the mean reflectance between the dorsal and ventral surfaces, as well as between the sexes, reveals that the reflectance of the ventral surface of females is generally higher than that of the ventral and dorsal surfaces of both sexes between 400 and 750 nm. Statistically no significant differences were observed between the dorsal surfaces of the females and those dorsal and ventral of the males, and only the mean reflectance of the ventral face of the females was significantly different (p < 0.05) between the different groups (males vs females; dorsal vs ventral).
Although adults are covered in scales, the difference in reflectance of the ventral face of females and the other faces may be related to their reproductive role, requiring low light absorption to provide better protection from light or more efficient thermoregulation for reproductive success..
3.5. Hyperspectral Signature of Dead and Live Larvae of Diatraea saccharalis
The analysis of the hyperspectral reflectance curves of live larvae (Lviva-day1 to Lviva-day4) and dead larvae (Lmorta-day1 to Lmorta-day4) of D. saccharalis highlighted significant spectral signature differences between these two groups over four days. These measurements of hyperspectral reflectances, performed over a wavelength range (400-1000 nm), suggest the physiological change of the larvae over four consecutive days and identify the factors responsible for the variations in reflectance (Figure 10). Live larvae exhibited relatively low reflectance in the visible spectrum (400-600 nm), which is characteristic of hydrated and metabolically active organisms. However, a slight increase in reflectance was observed, especially in the near-infrared region (700-900 nm). Overall, the mean hyperspectral reflectance recorded on day 1 (Lviva-day1) was higher over the entire wavelength range (450-900 nm), while the reflectances recorded during days 2, 3 and 4 (Lviva-day2 to Lviva-day4) were low with similarity (without distinction between them). This development can possibly be attributed to progressive changes in the cuticle, which thickens or changes composition with growth, as well as to a slight loss of water that influences the diffusion of light. Variations in pigmentation related to diet and physiological processes may also play an important role in the evolution of spectral properties (Figure 10a)..
In contrast, dead larvae are distinguished from day one (Lmorta-day1) by significantly higher reflectance across the spectrum (400-900 nm), with a progressive decrease in reflectance observed during days 2, 3, and 4 (Lmorta-da2, Lmorta-day3, and Lmorta-day4). This sharp decrease in reflectance is mainly due to and possibly due to dehydration (loss of water, linked to the decomposition of the larvae), a natural phenomenon after death that considerably modifies the way light is absorbed and reflected. The degradation of cellular structures alters the scattering of light, while the biochemical changes associated with decomposition lead to spectral modifications. The proliferation of microorganisms and putrefaction processes can also influence the optical properties of dead larvae, decreasing their reflectance in different regions of the spectrum (Figure 10b).
The comparison between live and dead larvae revealed a distinct reflectance dynamic: the live larvae maintained a relatively stable reflectance trend with a slight decrease over the days probably due to physiological changes, while the dead larvae exhibited, except on the first day, low reflectances, due to the processes of dehydration and decomposition (putrefaction).
This hyperspectral analysis highlights the potential of spectroscopy to differentiate the physiological state of insects based on their reflectance, thus providing a relevant tool for the study of their mortality and postmortality transformations.
3.6. Hyperspectral Signature of Diatraea saccharalis Larvae Parasitized by C. flavipes
Figure 11 highlights the variations in the hyperspectral reflectance of D. saccharalis larvae parasitized by C. flavipes at different stages of post-parasitism in a wavelength range (400 to 1000 nm). These results of the mean reflectances were acquired 3, 6, 8 and 10 days after parasitism of the 20-day-old larvae and were represented by individual curves (Figure 11 a, b, c, d). The comparative graph (Figure 11 e) and the histogram (Figure 11 f) were made to discriminate the means of the reflectances, with the curves a; b; c; and d in each graph constituting the mean hyperspectral reflectances of the parasitized larvae repeats..
At 3 days after parasitism, the curves showed moderate reflectance values, indicating physiological changes that were still not very pronounced (Figure 11 a). In contrast, 6 days later, a slight increase in reflectance was observed, reflecting incipient tissue changes caused by parasitoid development (Figure 11 b). This trend was most pronounced 8 days after parasitism, with differences in reflectance, particularly in the visible spectrum (550-700 nm) and in the near-infrared (700-900 nm), where reflectance showed more significant changes in the structure of the larvae's internal tissues. At 10 days later, the curves showed maximum (higher) reflectances, possibly indicating advanced degradation of internal tissues and significant metabolic changes (morphological, physiological) of the larvae (Figure 11 c).
Although hyperspectral reflectances were higher at all wavelengths (400,900 nm) from day 8 post-parasitism, no significant differences were observed between the different groups in the mean reflectances (a; b; c; and d) of the post-parasitism periods (Day-3, Day-6, Day-8 and Day-10).
Figure 11e shows significant differences and allows direct comparison between the different reflectance curves of the four post-parasitism periods (Day-3, Day-6, Day-8 and Day-10), with these differences in hyperspectral reflectances recorded between 500 and 900 nm reflecting the increasing impact of parasitism on cell integrity and larval tissue composition. The average reflectances of parasitized larvae 10 days later were significantly higher, and these differences show the progressive evolution of physiological, morphological, metabolic and structural damage caused by the development of the parasitoid inside the larvae.
The histogram of mean hyperspectral reflectances (Figure 11f) showed statistical differences, according to the SNK test (p < 0.05), between the post-parasitism periods, thus confirming the significance of the observed variations, demonstrating that the mean reflectance increased significantly (F = 59.81; P < 0.0001) as the parasitoid developed inside the larvae.
The differences in mean hyperspectral reflectances observed in these analyses were directly related to the physiological and metabolic effects induced by parasitism. The development of C. flavipes inside D. saccharalis larvae causes tissue changes, changes in water content, reductions in cell density, and changes in cuticle pigments, with these changes significantly influencing the way light was reflected, particularly in the near-infrared, a region sensitive to variations in cell structure and tissue hydration.
These results showed that hyperspectral reflectance can be used as a tool to monitor physiological changes caused by parasitism, as well as the possibility of use for non-destructive monitoring of larvae in biological control studies.
3.7. Spectral Principal Component Analysis of Larval Stages of Diatraea saccharalis
Figure 12 shows the result of the Principal Component Analysis (PCA) of the larval stages with a projection of the hyperspectral reflectance data in a reduced two-dimensional space (x,y), defined by the first two principal components: PC1 and PC2. This visualization allows you to explore the similarities and differences between the larval stages based on reflectance measurements at different wavelengths (400-1000 nm). The points were distributed along the PC1 and PC2 axes, reflecting the variations in the mean reflectance between different larval stages. PC1 captured the main trend of change between stages, while PC2 described additional variations not explained by PC1. PC1 explained 86.39% of the total variance in the data, making it the main axis of variation. This means that most of the observed differences in hyperspectral reflectance measurements were due to wavelength-related variations. PC2 explained 13.27% of the variance and the additional variation captured, allowing better differentiation of the larval stages, revealing important information that is probably related to physiological, morphological and biochemical characteristics of the insect.
The points of the larval stages (Larva1, Larva2, Larva3, Larva4, Larva5) were colored, according to the wavelength, allowing the visualization of groupings or separations between these stages. Larva1, as the first larval stage, was associated with an area of the graph where PC1 values were lower, with more distinct reflectance due to initial structural or physiological differences. Larva 4, relatively close to Larva1, stood out from the other stages, with a specific (intermediate) position in the PCA space. In contrast, Larva2, Larva3 and Larva5 showed overlap, suggesting that their reflectance profiles are more similar, reaffirming that possibly these differences are related to physiological or structural changes during larval development.
3.8. Spectral Principal Component Analysis of Dead, Live and Parasitized Larvae of Diatraea saccharalis
The Principal Component Analysis (PCA) performed on the mean reflectance profiles of live larvae (Live Larvae), dead larvae (Dead Larvae) and parasitized larvae (Lp-day3, Lp-day6, Lp-day8, Lp-day10) of D. saccharalis allowed us to visualize their distribution in a three-dimensional space (x,y,z). This statistical method highlighted the spectral differences between the different physiological states and revealed the impact of parasitism on the evolution of the physiological, morphological and biochemical properties of the larvae (Figure 13).
The hyperspectral analysis of PCA shows a clear structuring of the reflectance groups, with the live larvae forming a distinct group, characterized by a moderately low reflectance (close to PC3 0.08%), mainly due to their low water content (related to the realization of physiological molting) and the integrity of their biological tissues. In contrast, dead larvae are located in a clearly separated zone, reflecting low reflectance. This difference in reflectance is probably explained by cellular degradation and post-mortality biochemical transformations.
Between the two groups (live and dead larvae), the larvae parasitized by C. flavipes occupied intermediate positions (but distinct from each other), thus illustrating a progressive transition of their spectral properties according to the evolutionary days of parasitism. The "Lp-day3" larvae, corresponding to the third day after parasitism, remained relatively close to the live larvae, suggesting that the effects of the parasitoid on the structure and composition of the However, as the parasitism progressed (Lp-day6, Lp-day8), a more marked modification of the spectral characteristics was observed, reflecting physiological changes and increased consumption of internal larval resources by the parasitoid.
The larvae on the 10th day after parasitism (Lp-dia10) were very close to the group of dead larvae and close to PC1 (98.54%), indicating an advanced deterioration of their biological condition. This evolution can be attributed to the destruction of tissue by the parasitoid and the interruption of metabolic functions, leading to changes in spectral reflectances similar to those of larvae observed after death.
The hyperspectral analysis of the PCA highlighted a "continuum" between live, parasitized and dead larvae, reflecting the progressive changes in biological properties induced by parasitism. This approach allowed not only to differentiate physiological states, but also to evaluate the evolution of the effects of the parasitoid (C. flavipes) on the larvae over time (days). Hyperspectral spectroscopy combined with PCA stands out as a promising tool to monitor and characterize the impacts of parasitism on D. saccharalis, offering interesting perspectives for the detection and management of biological control.
3.9. Spectral Principal Component Analysis of the Life Stages of Diatraea saccharalis
The Principal Component Analysis performed on the profiles of the mean reflectance of the different stages of D. saccharalis allowed to visualize its distribution in a multidimensional spectrum space (x,y,z) represented by PC1, PC2 and PC3. This statistical method reduced the complexity of the data by extracting the principal axes that explain most of the observed variance. Thus, the PCA analysis showed a structured organization of the different stages and the arrangement of the points in the graph reflected the spectral similarities and differences according to the developmental stages of D. saccharalis (Figure 14).
The "new-egg" and "old-egg" stages showed different positions due to spectral variations related to the composition, physiology, biochemistry and colors or evolutionary stage of their outer envelope (chorion). The transition between the larval stages (larva1 to larva 5) was observed by a progressive arrangement of crescent naneira, reflecting the modifications of the cuticle and pigments as they grew.
The pupae (new pupal and old pupa) formed a distinct group, separate from larvae and adults. This positioning was influenced by the important transformations undergone during metamorphosis, notably the thickening and hardening of the cuticle, thus modifying its optical and structural properties.
Adults were categorized according to their sex and the observation faces (dorsal and ventral). This distinction was explained by morphological and pigmentary differences that influence hyperspectral reflectance. The separation between males and females, as well as between the dorsal and ventral surfaces, suggested a marked variability in the structure and composition of their integument.
Several factors can explain the distribution of points in the PAP: the composition of the cuticle and pigmentation, which evolve at each stage of development, with the aging of organisms, noticeable in the distinction between young and old forms (new vs old), and differences between sexes and body features in adults. The analysis showed that hyperspectral reflectance can be a relevant criterion to differentiate the stages of D. saccharalis, and that this characteristic evolves according to biological transformations during the life cycle of D. saccharalis.
4. Discussion
The main objective of the present study was to characterize, through a hyperspectral approach, the different stages of development of D. saccharalis and the post-parasitism phases of its larvae parasitized by C. flavipes. The results showed marked variations in hyperspectral reflectances according to the stages of the insect and the evolution of the parasitized larvae, attributed to interactions between physiological, morphological, biochemical and metabolic factors specific to each stage. Transitions between developmental stages (egg, larva, pupa, and adult) alter the way light is absorbed, reflected, or transmitted, generating distinct hyperspectral signatures. At the same time, the physicochemical and molecular composition of D. saccharalis varies according to the energy needs and biological processes specific to each stage. For example, eggs have a composition rich in proteins, lipids, carbohydrates, nucleic acids, chitin, minerals, and water, optimized for the protection, structure, and nutrition of the embryo. At this stage, proteins and chitin play a key role in resistance to environmental stresses and cuticle coloration. These variations reflect the dynamic adaptation of biological components to the requirements of the insect's life cycle, while also illustrating the relationship between hyperspectral reflectances and underlying metabolic or structural transformations [41,42].
The variations in hyperspectral reflectance observed between newly laid eggs (24 hours after laying) and those in the pre-hatching phase of D. saccharalis probably revealed significant physicochemical changes during embryonic development. The newly laid eggs had a higher reflectance in the visible spectrum and particularly in the near-infrared (NIR, 700-950 nm), possibly reflecting by a higher water content. This content gradually decreases as the embryo develops, leading to structural changes in the chorion. In addition, the pre-hatched eggs showed a lower reflectance, probably due to biochemical modifications, in particular the accumulation of pigments related to the formation of larval structures. When laid, D. saccharalis eggs are clear, usually translucent, and lack significant pigments [43]. However, as embryonic development progresses, its coloration evolves to shades of dark brown and then to black in the pre-hatch phase. This color change is attributed to the formation of the embryo, whose head usually appears black, as well as to the processes of dehydration and pigmentation that influenced hyperspectral reflectances [44]. These observations are consistent with previous studies on the identification of host eggs and their developmental stages of Trichogramma galloi Zucchi, 1988, Trichogramma pretiosum Riley, 1879 and Trichogramma atopovirilia Oatman & Platner, 1983 (Hymenoptera: Trichogrammatidae) by hyperspectral reflectance [10]. Differences in hyperspectral signatures constitute a non-destructive method to assess egg maturity and essential for the management of pest populations in agricultural environments [45,46,47].
The variations in hyperspectral reflectances throughout the different larval stages (L1 to L5) allowed us to analyze the changes related to their growth, namely in terms of size, thickening of the cuticle (reinforcement of its density) and changes in pigmentation (changes in biochemical composition). The composition of the larvae is mainly dominated by proteins, fats, water and carbohydrates, which are essential for their rapid growth. Its cuticle, on the other hand, is primarily composed of chitin and proteins [48]. The results also showed that the variability of hyperspectral reflectances between the larval stages is strongly influenced by physiological factors, such as molting or preparation for pupation, as well as by biochemical modifications, including variation in protein, lipid and pigment content. In addition, internal tissue growth and morphological changes, such as cuticle thickening or larval size, also influenced these hyperspectral reflectance variations [1,45].
The larvae used in this study were fed an artificial diet, a method commonly used in the laboratory to ensure precise control of the nutrients ingested. The composition of these diets influences several physiological aspects, including pigmentation, growth, duration of developmental stages, and survival [49,50]. In D. saccharalis, as in lepidoptera in general, cuticle pigmentation is determined by the presence of melanins, carotenoids, and ommochromes, whose expression is modulated by genetic, nutritional, and environmental factors [51,52]. This partly explains the differences in hyperspectral reflectance observed between the first larval stage and subsequent stages (L2 to L5) at different wavelengths.
This ability to accurately differentiate through hyperspectral reflectance is essential for the rapid identification of larval stages and the monitoring of D. saccharalis populations. These results are in agreement with those of [1], which characterized the hyperspectral signatures of the immature stages of Lucilia sericata (Meigen, 1826) (Diptera: Calliphoridae). In addition, another study was conducted to identify the first instar larvae (stage) of three important forensic meat fly species (L. sericata, Calliphora vicina Robineau-Desvoidy, 1830 and Calliphora vomitoria (L., 1758) (Coleoptera: Calliphoridae) analyzing their cuticular hydrocarbons by gas chromatography coupled to mass spectrometry (GC-MS) [53].
Hyperspectral reflectance analyses at the chrysalis stage revealed that young pupae had higher reflectance than mature pupae (old pupae). This difference can be attributed to the progressive condensation of chitin and the pigmentation processes associated with pupae maturation. Variations in reflectance between these two phases may also be influenced by the reorganization of internal tissues, a key phenomenon of holometamorphosis, as the cuticle of young pupae is generally thinner and less pigmented that reflects more light [54]. In contrast, the low reflectance observed in mature (old) pupae between 550 and 900 nm may result from the accumulation of protective pigments, cuticle densification, as well as protein and lipid degradation, resulting in increased light absorption. These transformations are essential to prepare the insect for its adult life. The results obtained are similar to those of previous work, which used hyperspectral reflectance to determine the age of pupae and identify fly species such as Calliphora dubia (Macquart, 1855) and Chrysomya rufifacies (Macquart, 1843) (Diptera: Calliphoridae) [45], with this study providing proof of concept, demonstrating a direct relationship between pupal age (number of days since the onset of pupation), characteristics of external reflectance and its internal morphological development. This approach provides a non-invasive and non-destructive method for estimating the age and developmental stage of insects. Previous work has also determined the age of pupae of Chrysomya megacephala (Fabricius, 1794) (Diptera: Calliphoridae) by combining hyperspectral reflectance analysis and machine learning, confirming the potential of this technique for the study of insect development [55].
Significant differences in hyperspectral reflectance observed between males and females, as well as between dorsal and ventral surfaces, particularly in females of D. saccharalis, suggested sexual dimorphism in cuticle composition and pigmentation. The greater reflectance on the ventral surface of females may be related to reproductive adaptations and the specific structure of their cuticle. In adults, the presence of hairs, the coloration of their integument, and the multilayered composition of the cuticle influence these spectral variations [56]. These differences can therefore be interpreted as strategies for adapting to the environment and its biology [57]. In addition, variability in reflectance, according to sex and body region, may play a role in sexual selection and reproduction. Similar studies conducted have analysed the hyperspectral reflectance profiles of three insect species, differentiating between males and females (Frankliniella occidentalis Pergande 1895 (Thysanoptera: Thripidae), Nilaparvata lugens Stäl, 1854 (Hemiptera: Delphacidae) and Bothrogonia ferruginea (Fabricius, 1877) (Hemiptera: Cicadellidae)} [58]. Other previous research work used proximal hyperspectral imaging to evaluate four of the major soybean pests (Euschistus heros (Fabricius, 1798) (Hemiptera: Pentatomidae), Diceraeus melacanthus (Dallas, 1851) (Hemiptera: Pentatomidae), Spodoptera eridania Pedra, 1871 (Lepidoptera: Noctuidae), and Chrysodeixis includens) (Walker, 1858) (Lepidoptera: Noctuidae), as well as the damage they cause to crops [4]. Our results also corroborate previous work, which used an integrative approach combining morphology, mitochondrial DNA, and hyperspectral reflectance profiling to identify seven species of leafhoppers of the genus Bundera Distant, 1908 (Hemiptera: Cicadellidae) [59]. This study highlights the potential of hyperspectral spectroscopy as a taxonomic and ecological tool for insect classification and identification.
The 3D Principal Component Analysis allowed to efficiently differentiate the different stages of development of D. saccharalis, highlighting hyperspectral variations associated with physiological and morphological changes. The distinctive grouping of larvae, pupae, and adults reflects major biochemical transformations during metamorphosis. This multivariate approach revealed patterns of continuous transition between stages, illustrating the dynamics of the life cycle of D. saccharalis. The integration of PCA with supervised sorting methods can improve diagnostic accuracy for precision agriculture applications. These results are in line with previous work, which identified the developmental stages of Metisa plana Walker, 1883 (Lepidoptera: Psychidae) using hyperspectral imaging coupled with machine learning algorithms [60]. Other studies have also highlighted the growing importance of spectral Remote Sensing in insect systematics and in the phenomic study of insect behavior and physiology [61]. Also, the internal morphology of flies (Diptera: Calliphoridae) was analyzed to estimate the age of the developmental stages and refine the evaluation of the post-mortem interval [62].
In addition, the hyperspectral differences between live and dead larvae reflect physiological changes, including water loss and progressive tissue degradation. Gradual decrease in herpespectral reflectance after death of D. saccharalis larvae is consistent with studies of “postmortem” spectral changes in biological tissues [54,63,64,65,66]. These results highlight the potential of hyperspectral imaging as a tool for the rapid detection of insect mortality, thus providing a valuable resource for ecological studies and population monitoring in natural or laboratory settings.
The progressive increase of hyperspectral reflectance in parasitized larvae of D. saccharalis revealed the degradation of internal tissues and metabolic changes induced by C. flavipes. The rearing of the larvae of D. saccharalis was carried out in the laboratory, with an artificial diet based on soybean meal and wheat germ. The average duration of the larval stage was between 46 and 50 days before the beginning of the pupal stage. The larvae were parasitized by C. flavipes on day 20 of their life cycle, and the parasitoid developed for 13 days inside the host before emerging and pupae. It took only 12 days for the parasitoid to cause the death of its host. Three days after parasitism, the larvae showed low hyperspectral reflectance, comparable to that of the non-parasitized larvae, indicating that the effects of the parasitoid were not yet noticeable.
However, between 8 and 10 days after parasitism, the larvae's physiology changed, with a cuticle gradually becoming transparent, leading to an increase in hyperspectral reflectance. The evolution of hyperspectral reflectances over the days after parasitism highlighted progressive changes in the internal structures in relation to the parasitoid's activity. These results corroborate those of [67,68], which demonstrated the efficacy of C. flavipes as an endoparasite for the biological control of lepidopteran pests.
This approach is a non-destructive method to assess the impact of biological control on populations of D. saccharalis and other pests. It confirms the efficacy of hyperspectral imaging in monitoring the effects of parasitism, as demonstrated by studies on parasitoid-host interactions [2,69]. The results of the Principal Component Analysis (PCA) allowed us to understand a clear "continuum" between the live state, the parasitized state and the death of the larvae, thus illustrating the progressive destruction of their physiological properties. These results highlight the sensitivity of hyperspectral imaging to monitor parasite impacts, assess the health status of larvae, and detect subtle changes in their physiological conditions. This breakthrough paves the way for innovative, non-invasive applications in applied entomology, agriculture, and interaction ecology [70,71].
5. Conclusions
This study demonstrated that hyperspectral Remote Sensing is an effective tool to accurately characterize and identify the different life stages of Diatraea saccharalis, as well as the developmental stages of larvae parasitized by Cotesia flavipes. The hyperspectral analysis allowed a clear distinction between live, parasitized and dead larvae, revealing the physiological changes caused by parasitism. These results reinforce the potential of this technology as a non-destructive and accurate method for monitoring pests and evaluating the effectiveness of biological control. The creation of a hyperspectral database and the use of robust statistical tools, such as Principal Component Analysis, open up new perspectives for more sustainable agriculture, with less dependence on pesticides and greater efficiency in integrated pest management. Future research should also focus on the composition and effects of artificial diets on the hyperspectral reflectances of each stage of D. saccharalis with a comparison of those of nature.
Author Contributions
Conceptualization, S.I.B. and D.L.R..; methodology, S.I.B., D.L.R. and S.A.B.; software, S.I.B. and D.L.R.; validation, S.I.B., D.L.R. and S.A.B.; formal analysis, S.I.B., D.L.R.; investigation, S.I.B.; resources, D.L.R., S.A.B. and P.G.P.; data curation, S.I.B.; writing-original draft preparation, S.I.B.; writing-review and editing, S.I.B., D.L.R. and S.A.B.; visualization, S.I.B.; supervision, D.L.R. and S.A.B.; project administration, D.L.R.; funding acquisition, D.L.R., from CAPES. All authors have read and agreed to the published version of the manuscript.
Funding
This research was funded by “Coordenação de Aperfeiçoamento de Pessoal de Nível Superior–Brasil (CAPES)”, grant number 001.
Acknowledgments
We would like to thank the “Program de Pesquisa em Engenharia – Fitossanidade em Cana-de-açucar (CEPENFITO)”, Brazil for technical assistance; Insect Rearing Biology Laboratory (LBCI), Geomatics and Precision Agriculture Laboratory (LNGAP) of the Department of Agricultural Entomology “Faculdade de Ciências Agrárias e Veterinárias-FCAV-UNESP - Jaboticabal” and “Unidade da Usina de São Martinho (USM)” for the insects rearing, experiments and equipment support. We would also like to sincerely thank the Department of Agricultural Entomology and UNESP for providing university facilities to help the study development.
Conflicts of Interest
The authors declare no conflicts of interest.
Abbreviations
| PCA | Principal Component Analysis |
| SR | Remote Sensing |
| nm | nanometer |
References
- Warren, J.-A.; Ratnasekera, T. P.; Campbell, D. A.; Anderson, G. S. Spectral Signatures of Immature Lucilia Sericata (Meigen) (Diptera: Calliphoridae). Insects 2017, 8 (2), 34. [CrossRef]
- Nansen, C.; Stewart, A. N.; Gutierrez, T. A. M.; Wintermantel, W. M.; McRoberts, N.; Gilbertson, R. L. Proximal Remote Sensing to Differentiate Nonviruliferous and Viruliferous Insect Vectors – Proof of Concept and Importance of Input Data Robustness. Plant Pathology 2019, 68 (4), 746–754. [CrossRef]
- Pinto, J.; Powell, S.; Peterson, R.; Rosalen, D.; Fernandes, O. Detection of Defoliation Injury in Peanut with Hyperspectral Proximal Remote Sensing. Remote Sensing 2020, 12 (22), 3828. [CrossRef]
- Iost Filho, F. H.; De Bastos Pazini, J.; De Medeiros, A. D.; Rosalen, D. L.; Yamamoto, P. T. Assessment of Injury by Four Major Pests in Soybean Plants Using Hyperspectral Proximal Imaging. Agronomy 2022, 12 (7), 1516. [CrossRef]
- Barros, P. P. D. S.; Rosalen, D. L.; Iost Filho, F. H.; Martins, G. D.; Di Leo, N. Monitoramento Fitossanitário Utilizando Sensoriamento Remoto: Avanços e Desafios. Rev. Bras. Cartogr. 2021, 73 (2), 489–515. [CrossRef]
- Nansen, C.; Strand, M. R. Proximal Remote Sensing to Non-Destructively Detect and Diagnose Physiological Responses by Host Insect Larvae to Parasitism. Frontiers in Physiology 2018, 9. [CrossRef]
- Rhodes, M. W.; Bennie, J. J.; Spalding, A.; ffrench-Constant, R. H.; Maclean, I. M. D. Recent Advances in the Remote Sensing of Insects. Biological Reviews 2022, 97 (1), 343–360. [CrossRef]
- Abd El-Ghany, N. M.; Abd El-Aziz, S. E.; Marei, S. S. A Review: Application of Remote Sensing as a Promising Strategy for Insect Pests and Diseases Management. Environ Sci Pollut Res 2020, 27 (27), 33503–33515. [CrossRef]
- Thériault, D. Dépistage Automatique Du Doryphore de La Pomme de Terre à L’aide de L’imagerie Ultra-Haute Résolution Acquise Par Drone et de L’apprentissage Profond. PhD Thesis, Institut National de la Recherche Scientifique (Canada), 2019. https://search.proquest.com/openview/1f91e04160908751f55159090d7d8a9f/1?pq-origsite=gscholar&cbl=18750&diss=y (accessed 2024-01-25).
- Nansen, C.; Coelho Jr, A.; Vieira, J. M.; Parra, J. R. P. Reflectance-Based Identification of Parasitized Host Eggs and Adult Trichogramma Specimens. Journal of Experimental Biology 2014, 217 (7), 1187–1192.
- Tefera, A. T.; Banerjee, B. P.; Pandey, B. R.; James, L.; Puri, R. R.; Cooray, O.; Marsh, J.; Richards, M.; Kant, S.; Fitzgerald, G. J. Estimating Early Season Growth and Biomass of Field Pea for Selection of Divergent Ideotypes Using Proximal Sensing. Field Crops Research 2022, 277, 108407. [CrossRef]
- Radhika, S.; Tamura, Y.; Matsui, M. Determination of Degree of Damage on Building Roofs Due to Wind Disaster from Close Range Remote Sensing Images Using Texture Wavelet Analysis; IEEE, 2018; pp 3366–3369.
- Fullana-Pericàs, M.; Conesa, M. À.; Gago, J.; Ribas-Carbó, M.; Galmés, J. High-Throughput Phenotyping of a Large Tomato Collection under Water Deficit: Combining UAVs’ Remote Sensing with Conventional Leaf-Level Physiologic and Agronomic Measurements. Agricultural Water Management 2022, 260, 107283. [CrossRef]
- Song, Z.; Zhang, B.; Feng, H.; Zhu, S.; Hu, L.; Brydegaard, M.; Li, Y.; Jansson, S.; Malmqvist, E.; Svanberg, K.; Zhao, G.; Bood, J.; Svanberg, S.; Li, D. Application of Lidar Remote Sensing of Insects in Agricultural Entomology on the Chinese Scene. J Applied Entomology 2020, 144 (3), 161–169. [CrossRef]
- Yin, H.; Cao, Y.; Marelli, B.; Zeng, X.; Mason, A. J.; Cao, C. Soil Sensors and Plant Wearables for Smart and Precision Agriculture. Advanced Materials 2021, 33 (20), 2007764. [CrossRef]
- Alves, L. Q.; Franco, P. N.; Zanetti, W. A. L.; Góes, B. C. Desempenho Da Produção Da Cultura de Cana-de-Açúcar Nos Principais Estados Produtores. Revista Brasileira de Engenharia de Biossistemas 2021, 15 (2), 303–317.
- Dias, H. B.; Inman-Bamber, G.; Sentelhas, P. C.; Everingham, Y.; Bermejo, R.; Christodoulou, D. High-Yielding Sugarcane in Tropical Brazil–Integrating Field Experimentation and Modelling Approach for Assessing Variety Performances. Field Crops Research 2021, 274, 108323. [CrossRef]
- da Silva, J. H. B.; de Almeida, L. J. M.; Araújo, J. R. E. S.; Guimarães, H. S.; dos Anjos Dantas, É.; da Silva, D. A. M.; Neto, F. P.; de Melo Fernandes, J. P. V.; de Lima, J. M. G.; da Costa Alves, E. M. Variabilidade Temporal (2000–2020) Da Produção de Cana-de-Açúcar Em Alagoa Nova, Brejo Paraibano. Scientific Electronic Archives 2022, 15 (8).
- Oliveira, M. H. R. de. Produção de mudas pré-brotadas de cana-de açúcar sob irrigação localizada. Dissertação (mestrado em Irrigação no Cerrado)- Instituto Federal Goiano, Campus Ceres, 2019. https://repositorio.ifgoiano.edu.br/handle/prefix/1784.
- Lopes, A. B.; Sousa, B. B.; de Oliveira, R. A. P.; Guimarães, C. R. R.; Cerqueira, F. B. Avaliação Tecnológica de Quatro Cultivares de Cana-de-Açúcar Em Função Da Infestação de Diatraea saccharalis Em Pedro Afonso, TO-Estudo de Caso. Research, Society and Development 2022, 11 (13), e340111335388–e340111335388.
- Carvalho, T. R. de; Cavichioli, F. A.; Nascimento, D. D. do; Soares, N. M. Fitonematoides de importância para a cultura da cana-de-açúcar no brasil. Revista Interface Tecnológica 2023, 20 (2), 837–848. [CrossRef]
- Silva, C. C. Sistema colaborativo de indicadores de avaliação para a sustentabilidade: o caso propriedade de produção agrícola do Estado de Minas Gerais - Brasil. May 27, 2021. [CrossRef]
- Mora, S. F. E. Prospecção de Bactérias Entomopatogênicas para o Controle do Percevejo-Marrom Euschistus heros (Fabricius, 1798). 2024. Dissertação (mestrado em Sanidade, Segurança Alimentar e Ambiental no Agronegócio) – Programa de Pós-Graduação, Instituto Biológico, São Paulo, 2023.
- Bellotti, A. Controle biológico no contexto da agricultura sustentável. Palestra proferida no III SIMPÓSIO DE CONTROLE BIOLÓGICO (1992: Águas de Lindóia). Anais... Jaguariúna: EMBRAPA-CNPDA 1992, 2–5.
- Urach Ferreira, P. H.; Ferreira, M. da C. Sphenophorus levis Behavior Studies: Evaluating Insect Attractiveness or Repellency to One Insecticide Treatment and Assessing Nocturnal Insect Activity and Location Pattern. Insects 2023, 14 (2), 205. [CrossRef]
- Santos-Cividanes, T. M.; Cividanes, F. J.; Garcia, J. C.; Vilela, M.; Moraes, J. C.; Barbosa, J. C. Silicon Induces Resistance to Diatraea saccharalis in Sugarcane and It Is Compatible with the Biological Control Agent Cotesia flavipes. J Pest Sci 2022, 95 (2), 783–795. [CrossRef]
- Costa, F. S. S. da. Promoção de crescimento e controle de insetos das Ordens Lepidoptera e Hemiptera via colonização sistêmica por Bacillus thuringiensis em Algodoeiro e Tomateiro. 2024. Tese (doutorado) — Universidade de Brasília, Faculdade de Agronomia e Medicina Veterinária, 2023.
- Abreu, J. A. S. de; Caleffe, R. R. T.; Julio, A. H. F.; Oliveira, S. R. de; Conte, H.; Ruvolo-Takasusuki, M. C. C. Effects of Dietary Palm Oil on Nutritional Indices of Diatraea saccharalis (Lepidoptera: Crambidae) for Cotesia flavipes (Hymenoptera: Braconidae) Production. Acta Sci., Agron. 2024, 46, e63410. [CrossRef]
- Santos, L. A. O.; Mihsfeldt, L. H. Capacidade de Busca e de Parasitismo de Cotesia flavipes Cameron (Hymenoptera: Braconidae) Em Lagartas de Diatraea saccharalis (Fabricius) (Lepidoptera: Crambidae). EntomoBrasilis 2014, 7 (2), 106–109.
- Merlin, B. L.; Cônsoli, F. L. Regulation of the Larval Transcriptome of Diatraea saccharalis (Lepidoptera: Crambidae) by Maternal and Other Factors of the Parasitoid Cotesia flavipes (Hymenoptera: Braconidae). Front Physiol 2019, 10, 1106. [CrossRef]
- Arboleda, B.; Vargas, G. Efficacy of Cotesia flavipes (Hymenoptera: Braconidae) in Reducing Diatraea tabernella (Lepidoptera: Crambidae) Injury in Sugar Cane. flen 2019, 102 (3), 520–525. [CrossRef]
- da Silva, J. F.; de Brito, C. H.; de Oliveira Barbosa, V.; Alves, J. C. G.; Abreu, K. G. Influência de Dietas e Temperaturas Na Biologia de Diatraea saccharalis Fabricius 1794 e Diatraea flavipennella Box 1931. Research, Society and Development 2022, 11 (16), e145111637612–e145111637612. [CrossRef]
- Silva, T. S. S.; Santos, P. da S.; Vieira, R. I. S.; Negrisoli Junior, A. S.; Guzzo, E. C. Within-Host Competition between Cotesia flavipes and Heterorhabditis bacteriophora in Diatraea saccharalis. BioControl 2024. [CrossRef]
- Santos-Cividanes, T. M.; Cividanes, F. J.; Garcia, J. C.; Vilela, M.; Moraes, J. C.; Barbosa, J. C. Silicon Induces Resistance to Diatraea saccharalis in Sugarcane and It Is Compatible with the Biological Control Agent Cotesia flavipes. Journal of Pest Science 2022, 1–13.
- Holman, A. P.; Pickett, D. N.; Orr, A. E.; Tarone, A. M.; Kurouski, D. A Nondestructive Technique for the Sex Identification of Third Instar Cochliomyia macellaria Larvae. Journal of Forensic Sciences 2024, 69 (6), 2075–2081. [CrossRef]
- Machado, P. A. Utilização de tecnologia de precisão na apicultura : uma revisão sistematica. 2024. Trabalho de Conclusão de Curso (Bacharel em Zootecnia), Universidade Federal do Rio Grande do Sul. Faculdade de Agronomia, 2024.
- da Silva, R. B.; de Sousa Aquino, I.; de Farias Borges, P.; da Silva Barbosa, A.; de Medeiros, G. R.; de Sousa Melo, T. Aspectos Comportamentais Do Parasitoide Cotesia flavipes Produzido Em Laboratório No Litoral Norte Paraibano. Research, Society and Development 2021, 10 (2), e46910212666–e46910212666. [CrossRef]
- Macedo, N. Método de Criação Do Parasitóide Cotesia flavipes (Cameron). Controle, Biológico de Pragas: Produção massal e controle de qualidade 2000, 161–174.
- de Sá, O. R. Biologia Da Broca Da Cana-de-Açúcar (Diatraea saccharalis) (Lepidoptera: Crambidae) Em Dieta Artificial. Ciência et Praxis 2010, 3 (05), 13–16.
- Bongomin, O.; Lamo, J.; Guina, J. M.; Okello, C.; Ocen, G. G.; Obura, M.; Alibu, S.; Owino, C. A.; Akwero, A.; Ojok, S. UAV Image Acquisition and Processing for High-Throughput Phenotyping in Agricultural Research and Breeding Programs. The Plant Phenome Journal 2024, 7 (1), e20096. [CrossRef]
- Eddin, A. S.; Ibrahim, S. A.; Tahergorabi, R. Egg Quality and Safety with an Overview of Edible Coating Application for Egg Preservation. Food chemistry 2019, 296, 29–39. [CrossRef]
- Rezende, G. L.; Vargas, H. C. M.; Moussian, B.; Cohen, E. Composite Eggshell Matrices: Chorionic Layers and Sub-Chorionic Cuticular Envelopes. Extracellular composite matrices in arthropods 2016, 325–366.
- Kannan, M.; Elango, K.; Kalyanasundaram, M.; Govindaraju, K. Ultra-structural and Physico-chemical Characterization of Eggs and Egg Hairs (Setae) of the New Invasive Pest, Fall Armyworm, Spodoptera frugiperda (JE Smith) in India: A First Report. Microscopy Research and Technique 2021, 84 (7), 1422–1430.
- Moriyama, M. Physiological and Biochemical Mechanisms of Insect Color Change Towards Understanding Molecular Links. Pigments, Pigment Cells and Pigment Patterns 2021, 451–472.
- Voss, S. C.; Magni, P.; Dadour, I.; Nansen, C. Reflectance-Based Determination of Age and Species of Blowfly Puparia. International Journal of Legal Medicine 2017, 131, 263–274. [CrossRef]
- Pechal, J. L.; Moore, H.; Drijfhout, F.; Benbow, M. E. Hydrocarbon Profiles throughout Adult Calliphoridae Aging: A Promising Tool for Forensic Entomology. Forensic Science International 2014, 245, 65–71. [CrossRef]
- Pickering, C. L.; Hands, J. R.; Fullwood, L. M.; Smith, J. A.; Baker, M. J. Rapid Discrimination of Maggots Utilising ATR-FTIR Spectroscopy. Forensic Science International 2015, 249, 189–196. [CrossRef]
- Abdelwahab, S. I.; Taha, M. M. E.; Mariod, A. A. Structural Characterization: Physicochemical Properties, Thermal Stability, and Quality Characteristics of Insect Oils. Insect Oil as a Source of Nutraceuticals 2025, 115–125.
- Ottocento, C.; Rojas, B.; Burdfield-Steel, E.; Furlanetto, M.; Nokelainen, O.; Winters, S.; Mappes, J. Diet Influences Resource Allocation in Chemical Defence but Not Melanin Synthesis in an Aposematic Moth. Journal of Experimental Biology 2024, 227 (3), jeb245946. [CrossRef]
- Vacari, A. M.; Genovez, G. de S.; Laurentis, V. L. de; Bortoli, S. A. D. Fonte Proteica Na Criação de Diatraea saccharalis e Seu Reflexo Na Produção e No Controle de Qualidade de Cotesia flavipes. Bragantia 2012, 71, 355–361.
- Francois, C. L. Morphology and Physiology of Larval Color Variation in the White-Lined Sphinx Moth, Hyles lineata. 2020. Thesis (doctor of Philosophy) - University of Arizona in the Graduate College, 2020.
- Francois, C.; Davidowitz, G. Genetic Color Polymorphism of the Whitelined Sphinx Moth Larva (Lepidoptera: Sphingidae). Journal of Insect Science 2020, 20 (4), 19. [CrossRef]
- Moore, H. E.; Adam, C. D.; Drijfhout, F. P. Identifying 1st Instar Larvae for Three Forensically Important Blowfly Species Using “Fingerprint” Cuticular Hydrocarbon Analysis. Forensic Science International 2014, 240, 48–53. [CrossRef]
- Frere, B.; Suchaud, F.; Bernier, G.; Cottin, F.; Vincent, B.; Dourel, L.; Lelong, A.; Arpino, P. GC-MS Analysis of Cuticular Lipids in Recent and Older Scavenger Insect Puparia. An Approach to Estimate the Postmortem Interval (PMI). Analytical and Bioanalytical Chemistry 2014, 406, 1081–1088. [CrossRef]
- Zhang, X.; Qu, H.; Zhou, Z.; Chen, S.; Ngando, F. J.; Yang, F.; Xiao, J.; Guo, Y.; Cai, J.; Zhang, C. Age Determination of Chrysomya megacephala Pupae through Reflectance and Machine Learning Analysis. Insects 2024, 15 (3), 184. [CrossRef]
- Chauhan, V.; Kumar, P. G.; Kumar, A.; Sharma, L.; Gandhi, V.; Vashisht, S. D. Chapter-8 Remote Sensing and Reflectance Profiling in Entomology. Chief Editor Dr. RK Naresh 2021, 61, 133.
- De Loof, A.; Huybrechts, J.; Geens, M.; Vandersmissen, T.; Boerjan, B.; Schoofs, L. Sexual Differentiation in Adult Insects: Male-Specific Cuticular Yellowing in Schistocerca gregaria as a Model for Reevaluating Some Current (Neuro) Endocrine Concepts. Journal of insect physiology 2010, 56 (8), 919–925. [CrossRef]
- Li, X.; Xu, H.; Feng, L.; Fu, X.; Zhang, Y.; Nansen, C. Using Proximal Remote Sensing in Non-Invasive Phenotyping of Invertebrates. PLoS One 2017, 12 (5), e0176392. [CrossRef]
- Wang, Y.; Nansen, C.; Zhang, Y. Integrative Insect Taxonomy Based on Morphology, Mitochondrial DNA, and Hyperspectral Reflectance Profiling. Zoological Journal of the Linnean Society 2016, 177 (2), 378–394. [CrossRef]
- Johari, S. N. A. M.; Khairunniza-Bejo, S.; Shariff, A. R. M.; Husin, N. A.; Basri, M. M. M.; Kamarudin, N. Identification of Bagworm (Metisa plana) Instar Stages Using Hyperspectral Imaging and Machine Learning Techniques. Computers and Electronics in Agriculture 2022, 194, 106739. [CrossRef]
- Nansen, C.; Elliott, N. Remote Sensing and Reflectance Profiling in Entomology. Annual Review of Entomology 2016, 61 (1), 139–158. [CrossRef]
- Davies, K.; Harvey, M. L. Internal Morphological Analysis for Age Estimation of Blow Fly Pupae (Diptera: Calliphoridae) in Postmortem Interval Estimation. Journal of forensic sciences 2013, 58 (1), 79–84. [CrossRef]
- Pérez-Martínez, C.; Pérez-Cárceles, M. D.; Legaz, I.; Prieto-Bonete, G.; Luna, A. Quantification of Nitrogenous Bases, DNA and Collagen Type I for the Estimation of the Postmortem Interval in Bone Remains. Forensic science international 2017, 281, 106–112.
- Martín, R. D. D.; Camacho-Martínez, Z.; Hernández, J. R. A.; Valencia-Caballero, L. Proteomics as a New Tool in Forensic Sciences. Spanish Journal of Legal Medicine 2019, 45 (3), 114–122. [CrossRef]
- Ortiz-Herrero, L.; Uribe, B.; Armas, L. H.; Alonso, M.; Sarmiento, A.; Irurita, J.; Alonso, R.; Maguregui, M.; Etxeberria, F.; Bartolome, L. Estimation of the Post-Mortem Interval of Human Skeletal Remains Using Raman Spectroscopy and Chemometrics. Forensic science international 2021, 329, 111087.
- Ku, K.-B.; Mansoor, S.; Han, G. D.; Chung, Y. S.; Tuan, T. T. Identification of New Cold Tolerant Zoysia Grass Species Using High-Resolution RGB and Multi-Spectral Imaging. Sci Rep 2023, 13 (1), 13209. [CrossRef]
- Salamanca, L.; Echeverri-Rubiano, C.; Rondón, M.; Manzano, M. R.; Sarmiento, C. E.; Michaud, J.; Vargas, G. Divergent Life Histories between Wild and Commercially-Sourced Cotesia flavipes (Hymenoptera: Braconidae) Parasitizing Four Species of Diatraea (Lepidoptera: Crambidae). Biological Control 2023, 178, 105144. [CrossRef]
- de Assis Gomes, J.; Oliveira, A. L. Eficácia Para o Combate Da Broca Da Cana-de-Açúcar. Revista Interface Tecnológica 2020, 17 (1), 467–478.
- Nansen, C.; Ribeiro, L. P.; Dadour, I.; Roberts, J. D. Detection of Temporal Changes in Insect Body Reflectance in Response to Killing Agents. PLoS One 2015, 10 (4), e0124866. [CrossRef]
- Banas, A. M.; Banas, K.; Chu, T. T.; Naidu, R.; Hutchinson, P. E.; Agrawal, R.; Lo, M. K.; Kansiz, M.; Roy, A.; Chandramohanadas, R. Comparing Infrared Spectroscopic Methods for the Characterization of Plasmodium falciparum-Infected Human Erythrocytes. Communications Chemistry 2021, 4 (1), 129. [CrossRef]
- Vänninen, I. Advances in Insect Pest and Disease Monitoring and Forecasting in Horticulture. 2022. Published by Burleigh Dodds Science Publishing Limited, 2022, pp 1-67.
Figure 1.
Camera and hyperspectral sensor device. Source: [40].
Figure 1.
Camera and hyperspectral sensor device. Source: [40].
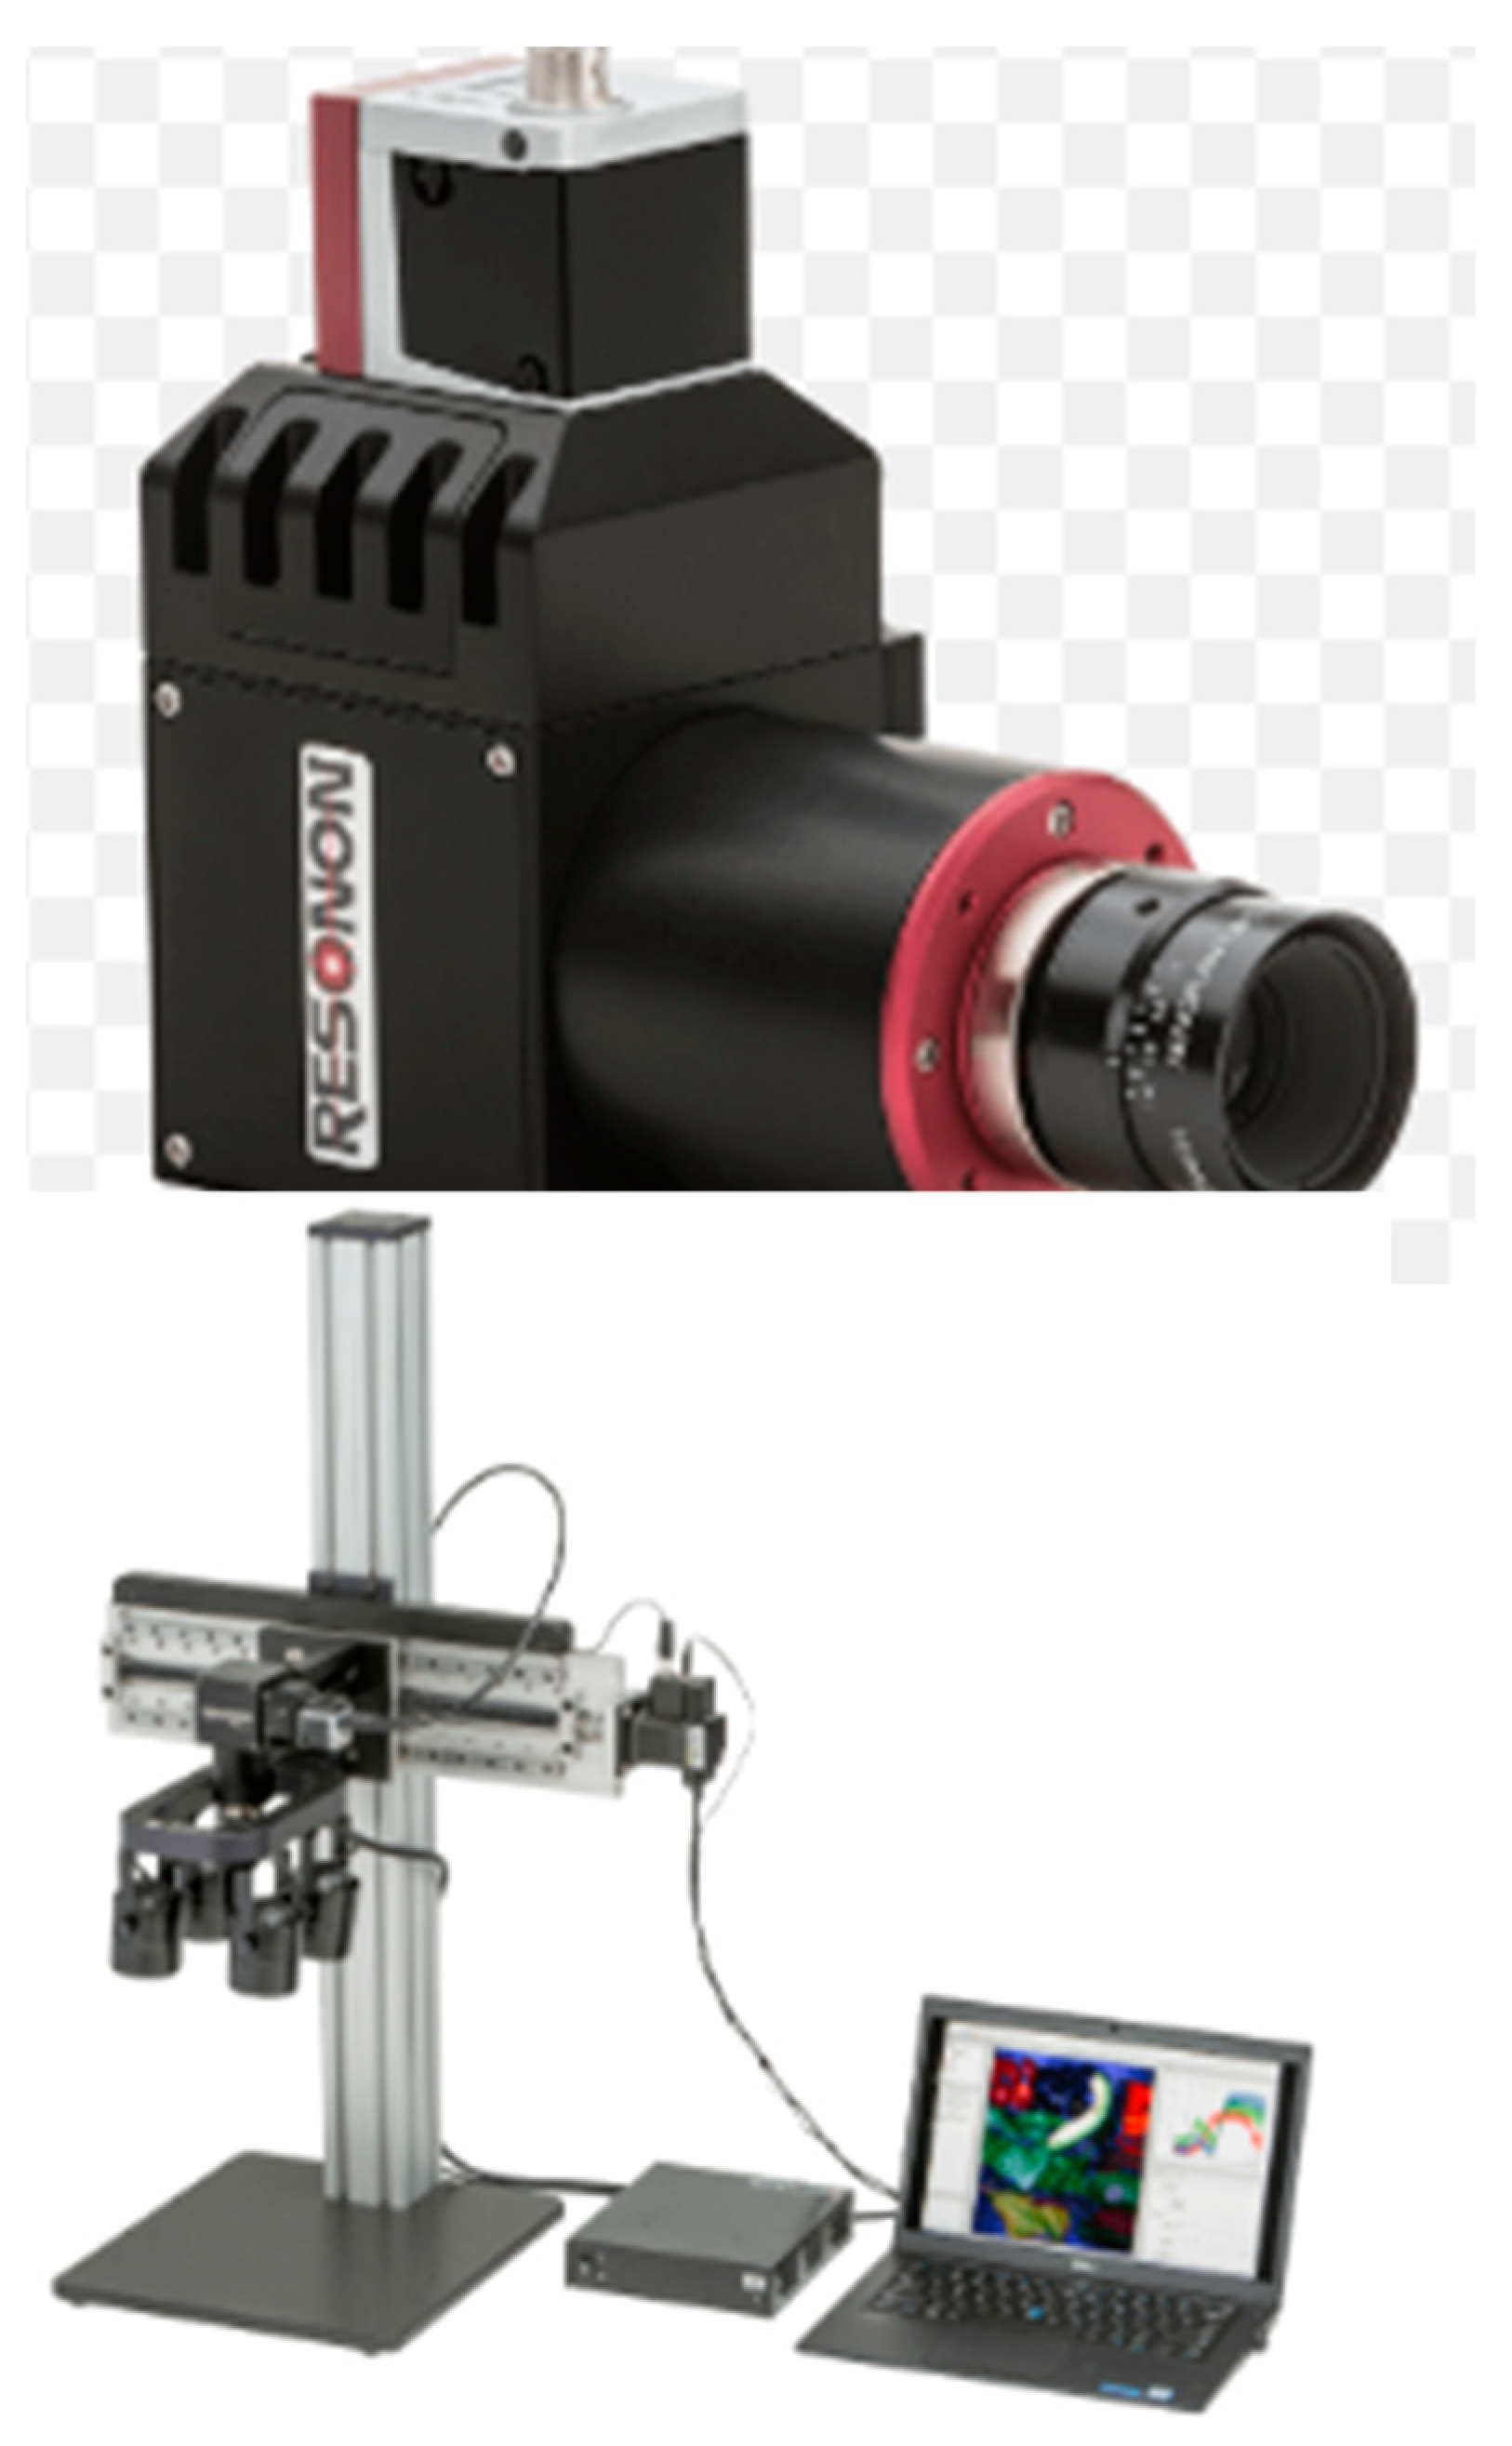
Figure 2.
Samples. New eggs; old eggs (b); live lavas (20 days old) (c); new pupae (D); and old pupae (e). Source: Souradji, 2025.
Figure 2.
Samples. New eggs; old eggs (b); live lavas (20 days old) (c); new pupae (D); and old pupae (e). Source: Souradji, 2025.
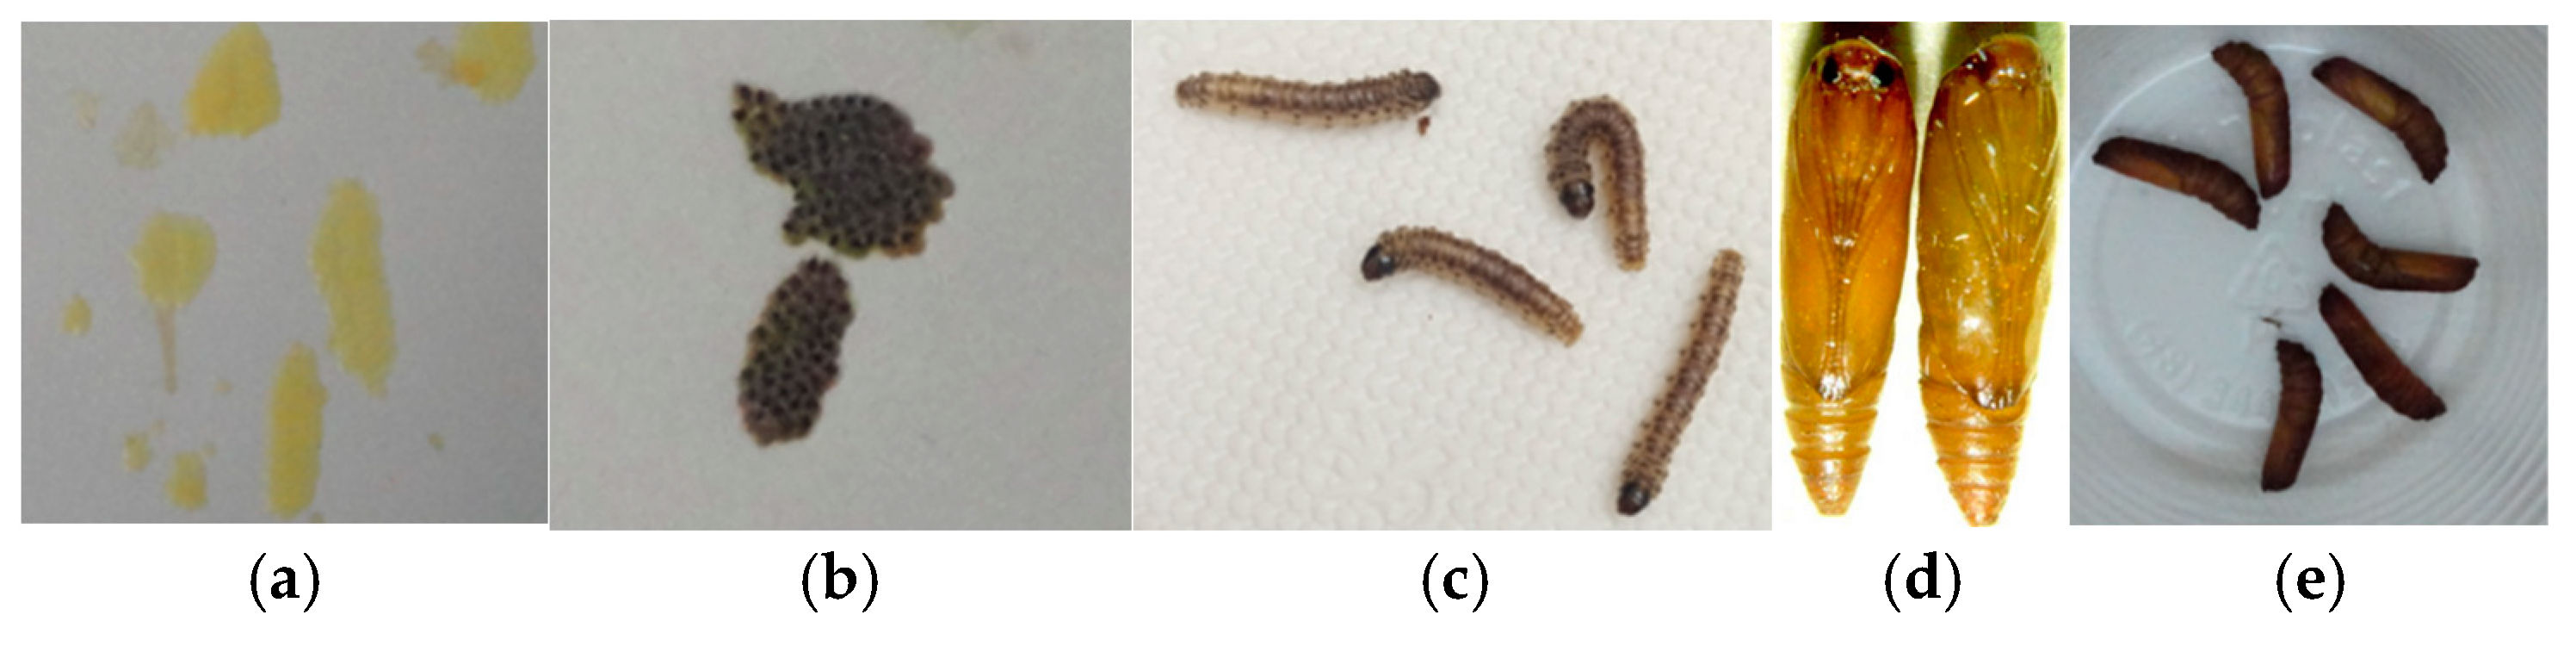
Figure 3.
Process of obtaining dead larvae (a,b,c,d), dead pupae (e), live pupae (f) and adults asphyxiated in the disposable cup (g). Source: Souradji, 2025.
Figure 3.
Process of obtaining dead larvae (a,b,c,d), dead pupae (e), live pupae (f) and adults asphyxiated in the disposable cup (g). Source: Souradji, 2025.
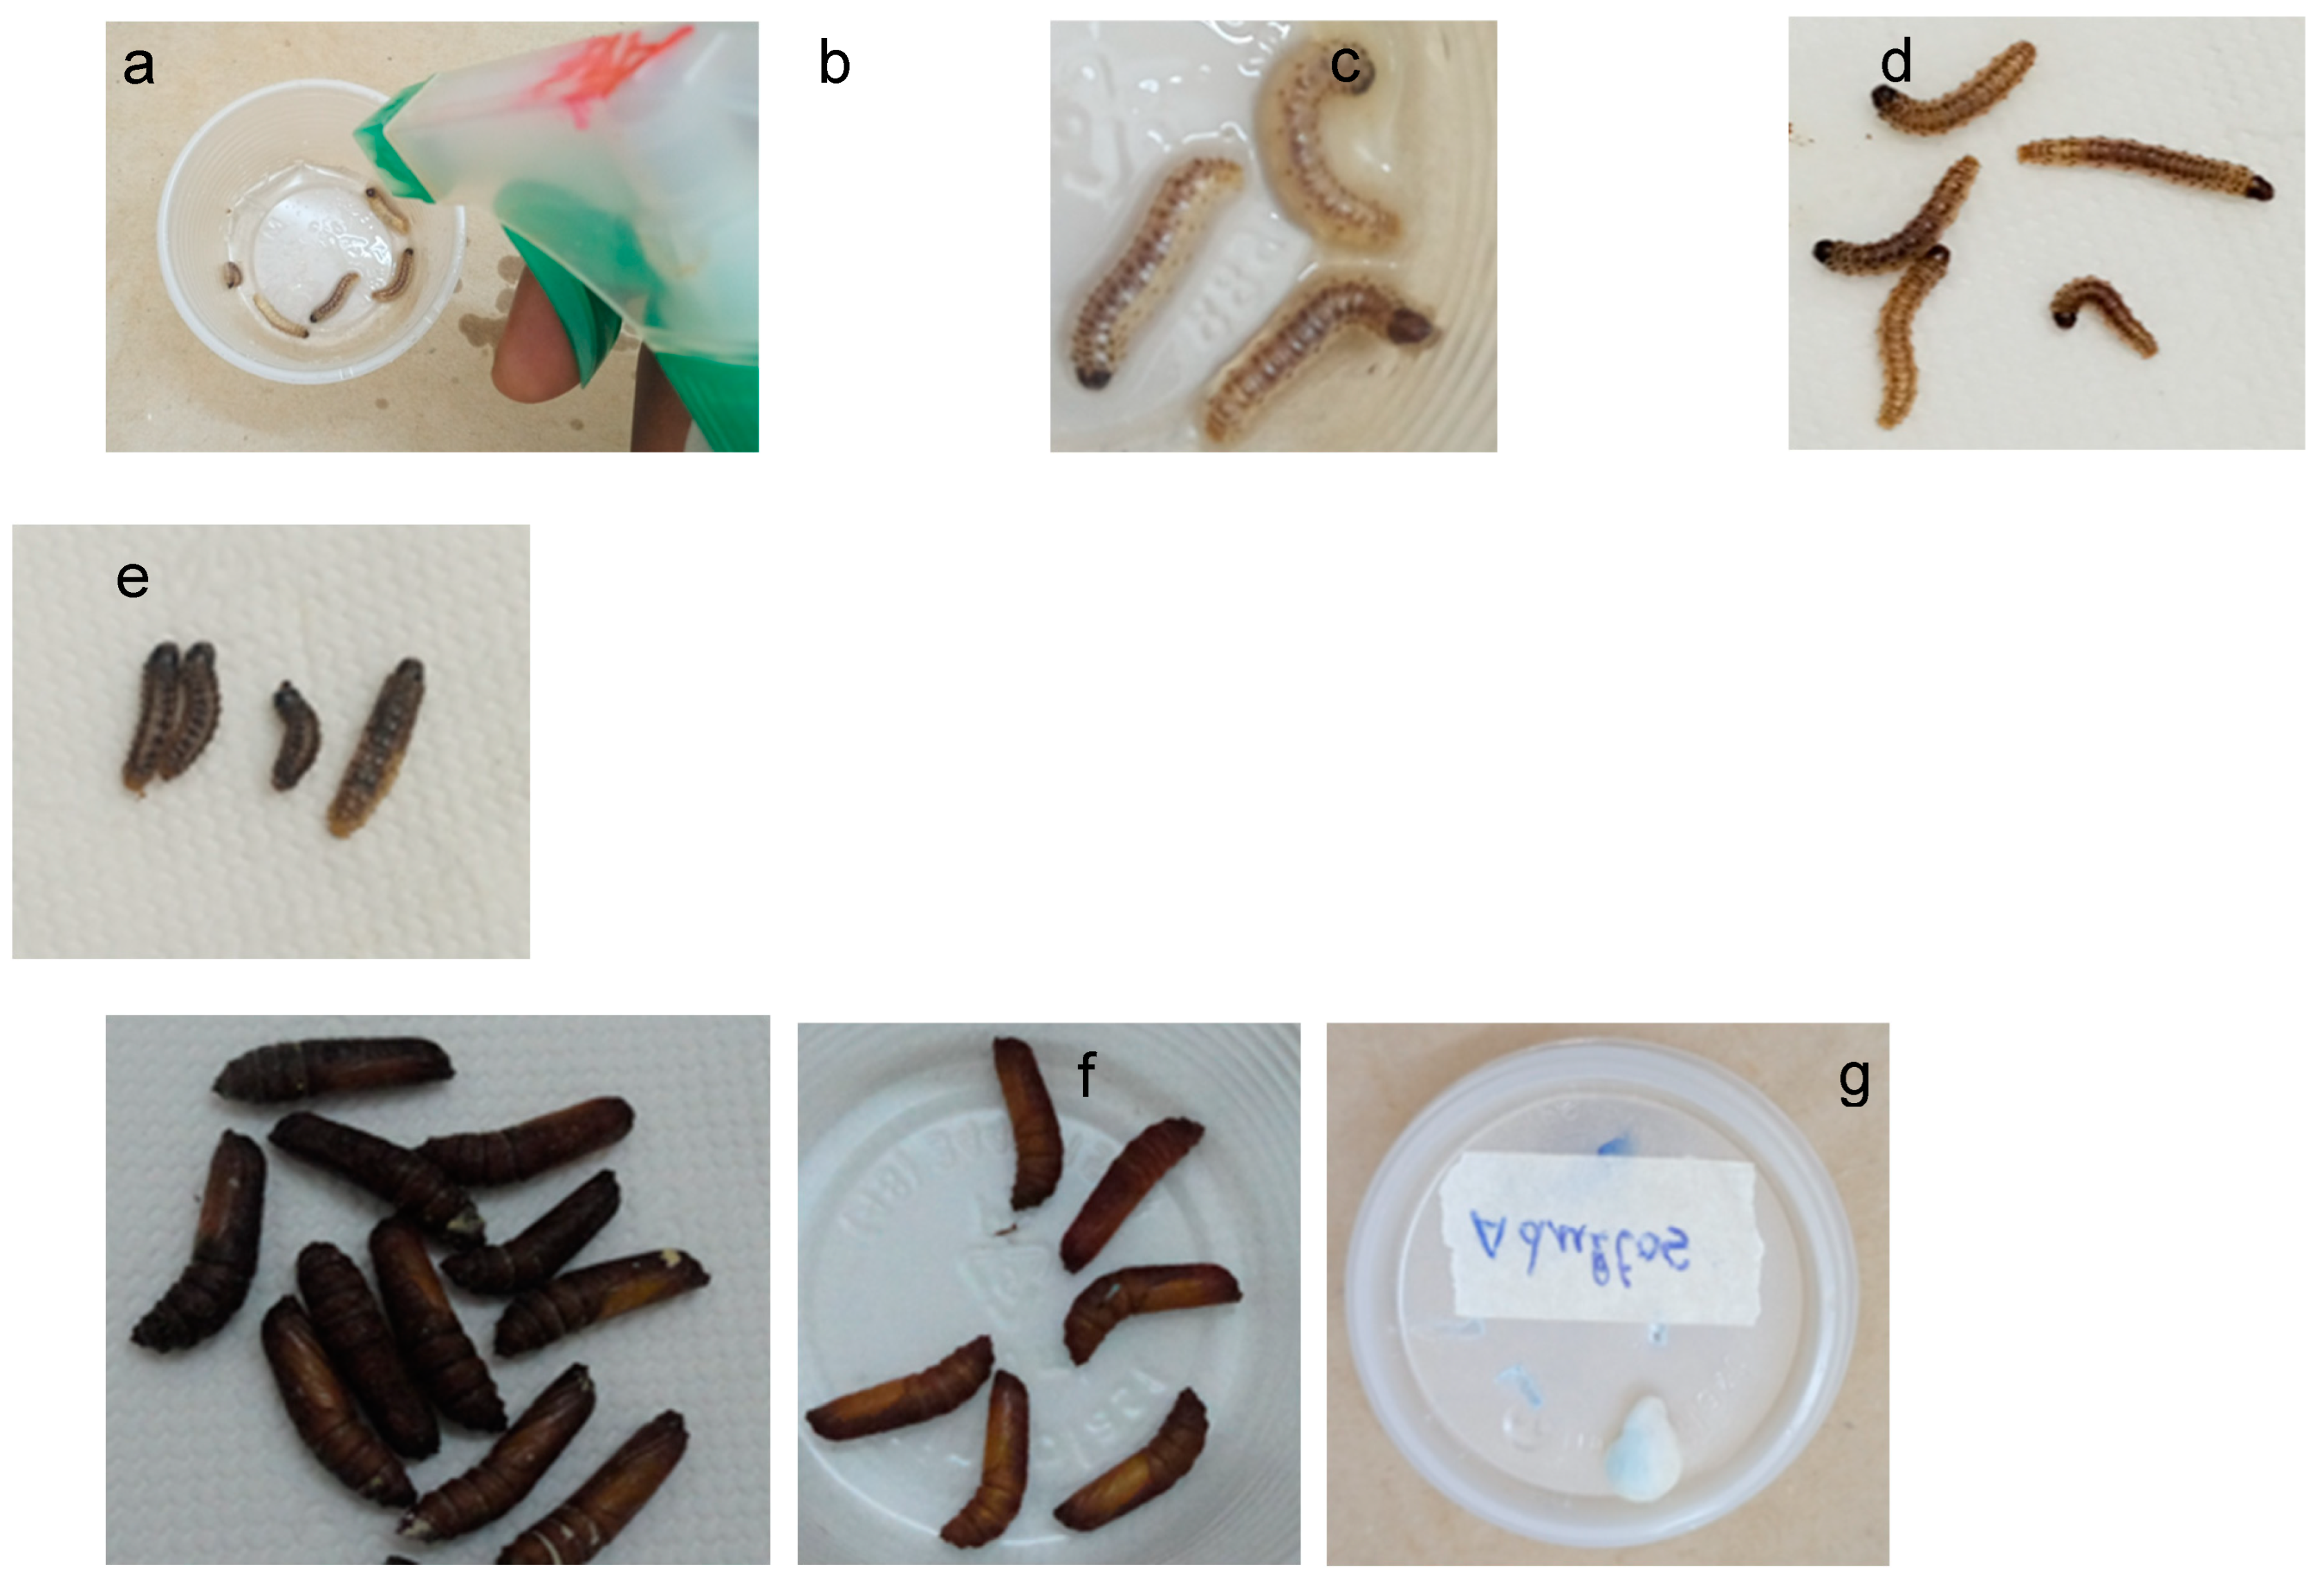
Figure 4.
Larvae (in the photo no larvae are seen!!) of D. saccharalis parasitized by C. flavipes with replicas of the larvae in Petri dishes (a); parasitized larvae in diet (b); formation of pupae of C. flavipes (c). Source: Souradji, 2025.
Figure 4.
Larvae (in the photo no larvae are seen!!) of D. saccharalis parasitized by C. flavipes with replicas of the larvae in Petri dishes (a); parasitized larvae in diet (b); formation of pupae of C. flavipes (c). Source: Souradji, 2025.
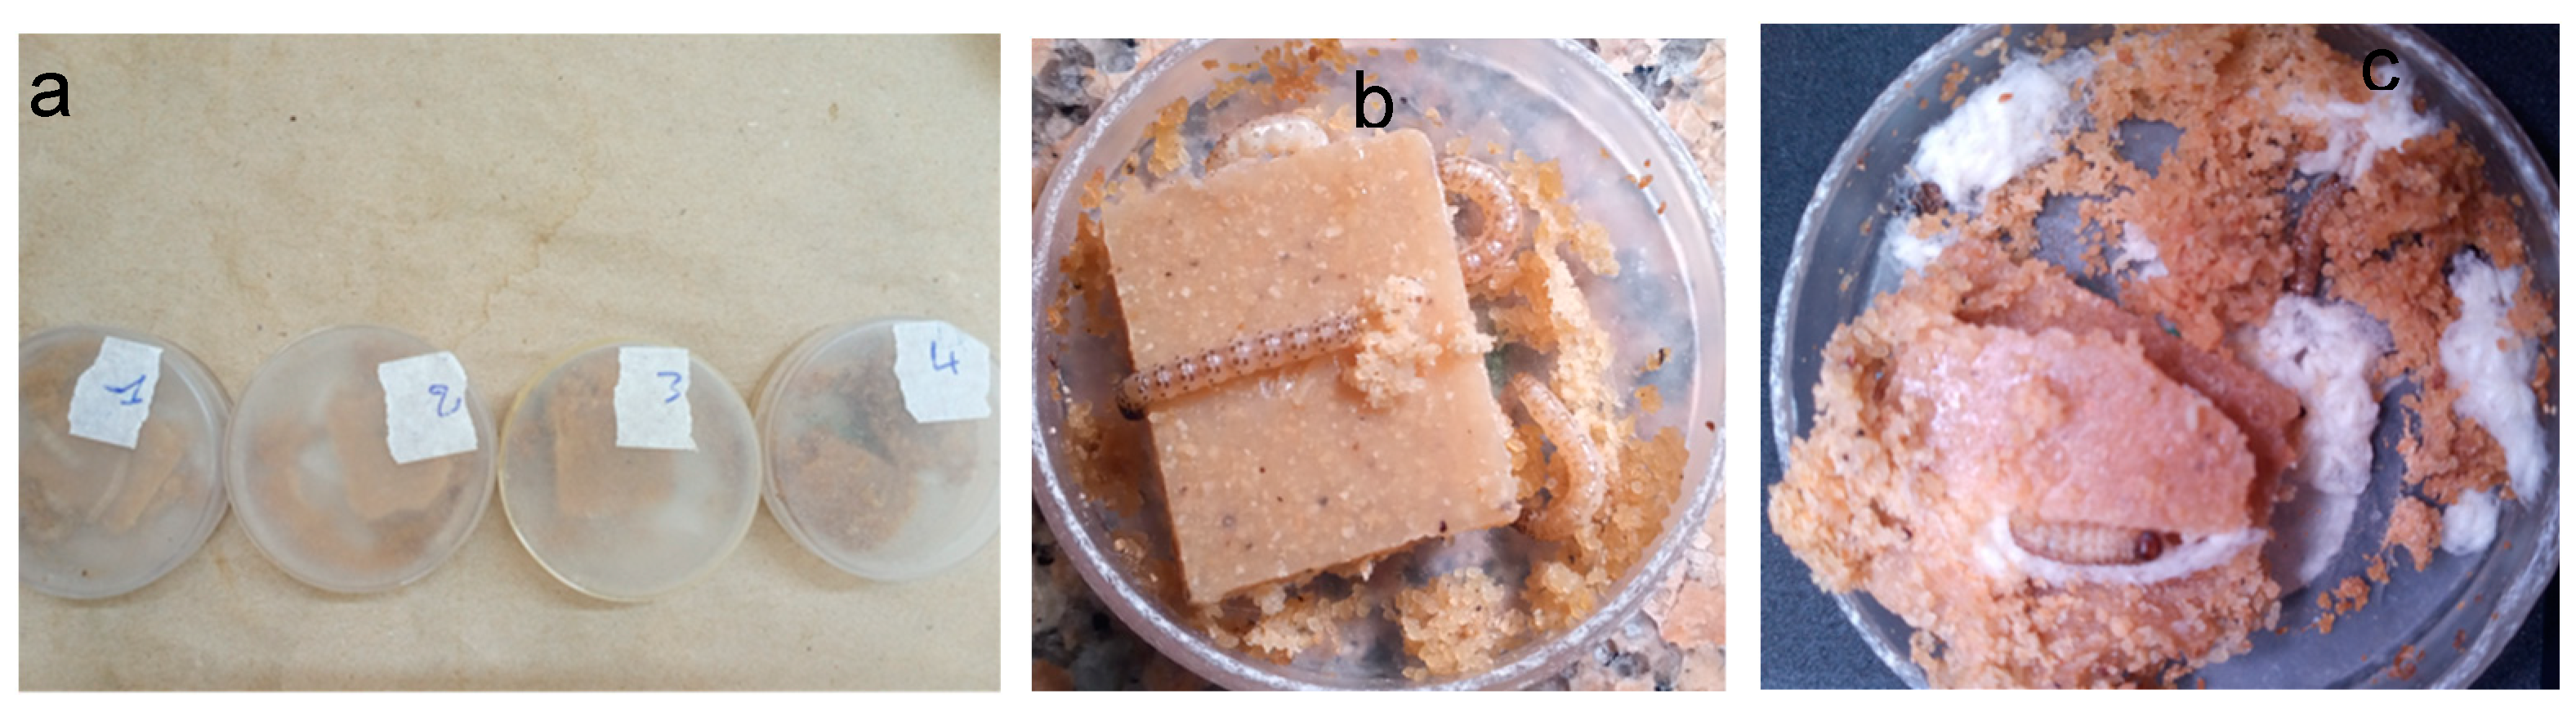
Figure 5.
Process of collecting hyperspectral reflectance data from samples. Source: Souradji, 2025.
Figure 5.
Process of collecting hyperspectral reflectance data from samples. Source: Souradji, 2025.
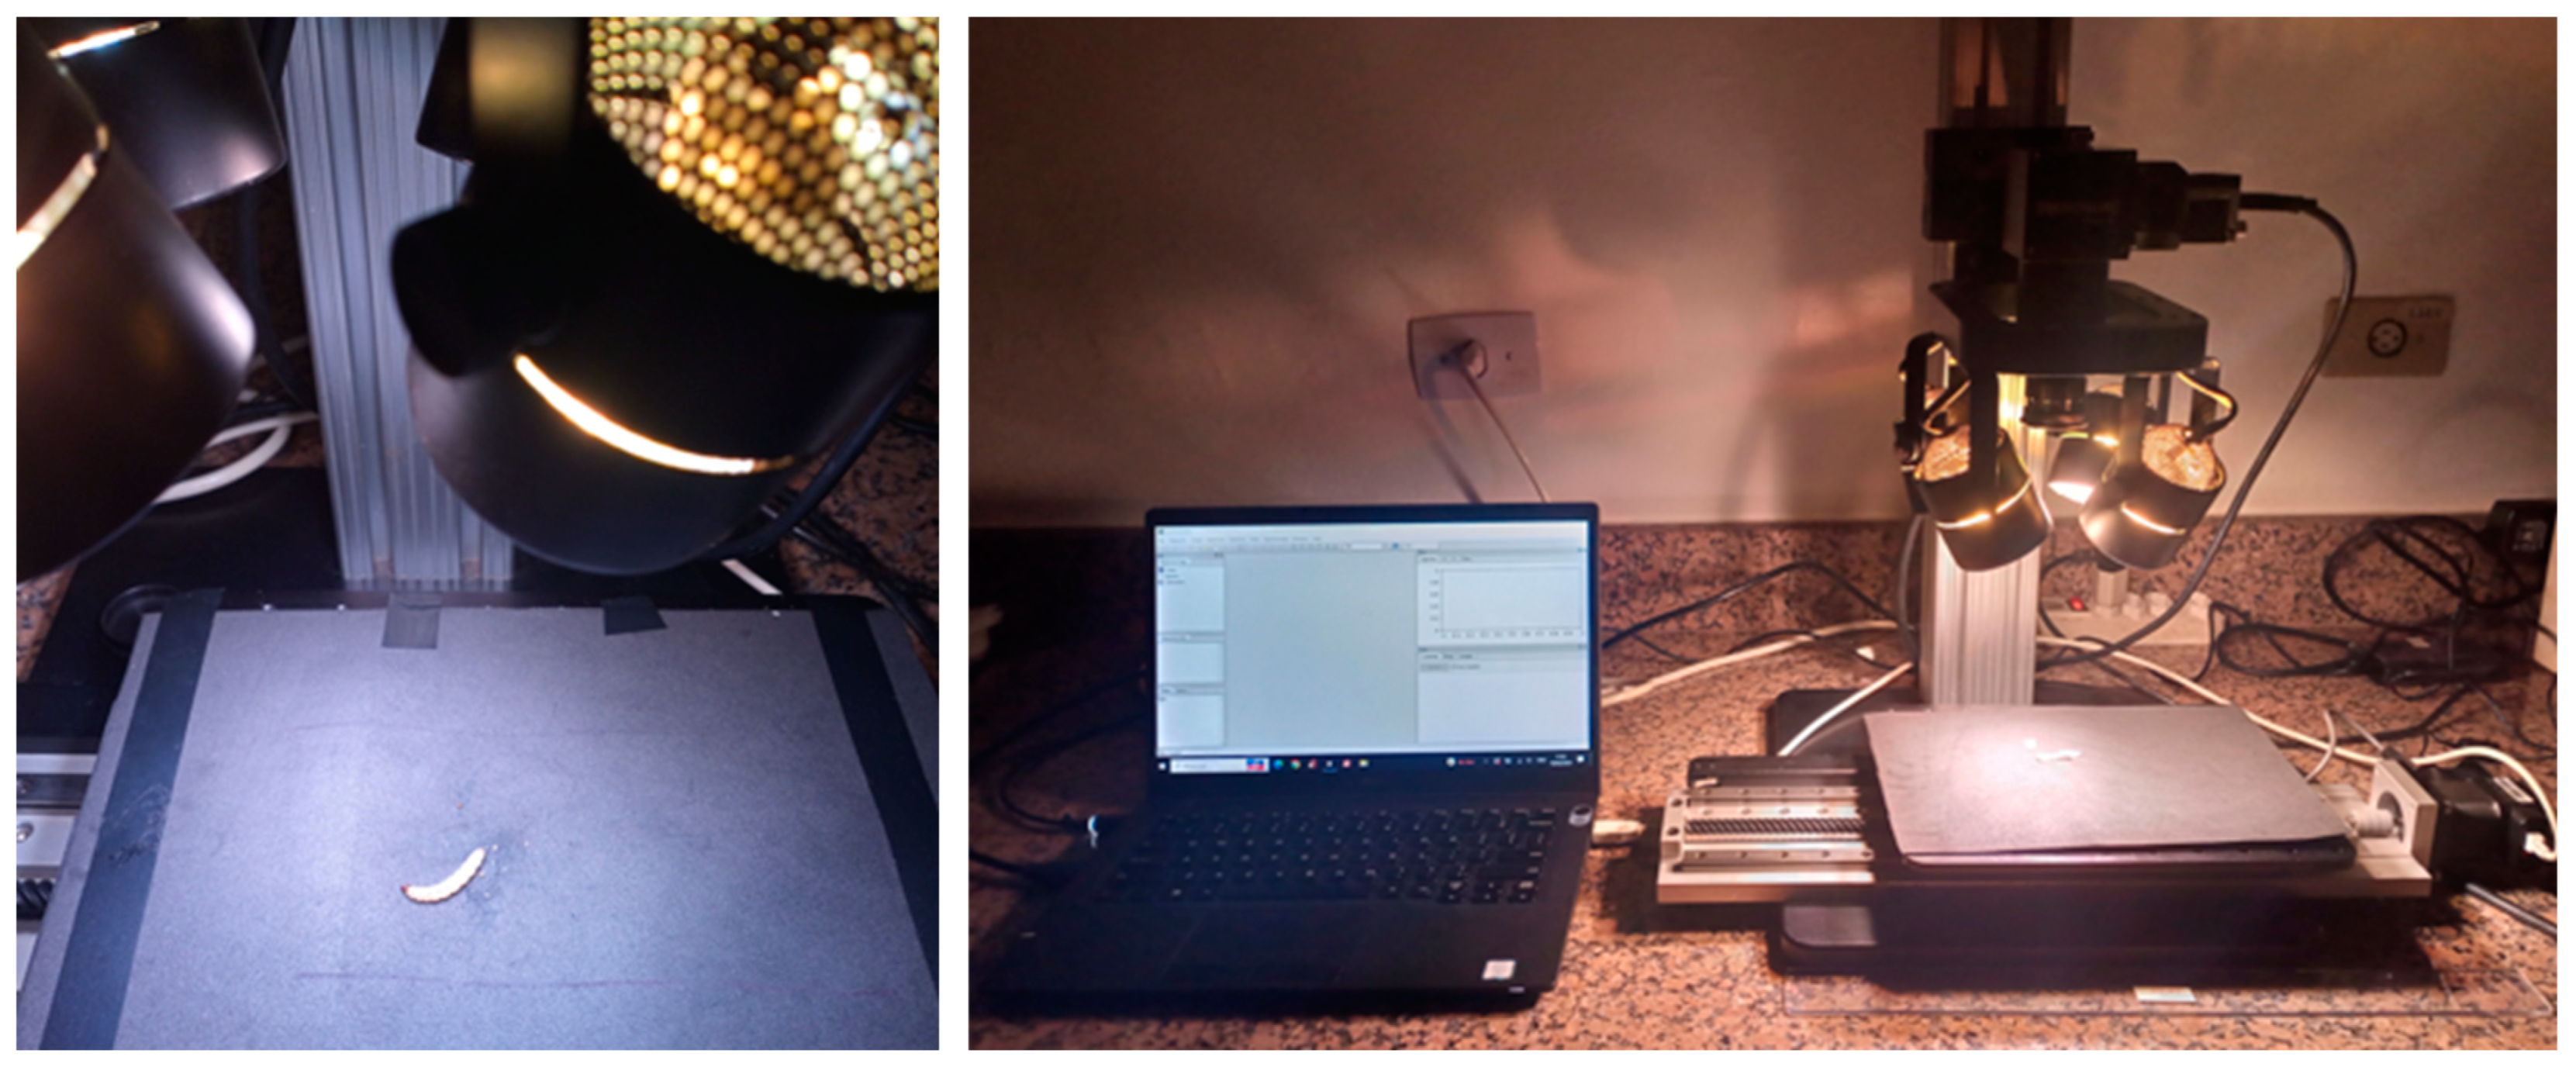
Figure 6.
Hyperspectral reflectance of D. saccharalis eggs. a (new eggs); b (old eggs); c (new eggs vs old eggs); d (comparison of the means of the reflectance of all wavelengths). *CI (95% confidence interval). *Means followed by the same letter do not differ from each other by the SNK test (p˂0.05).
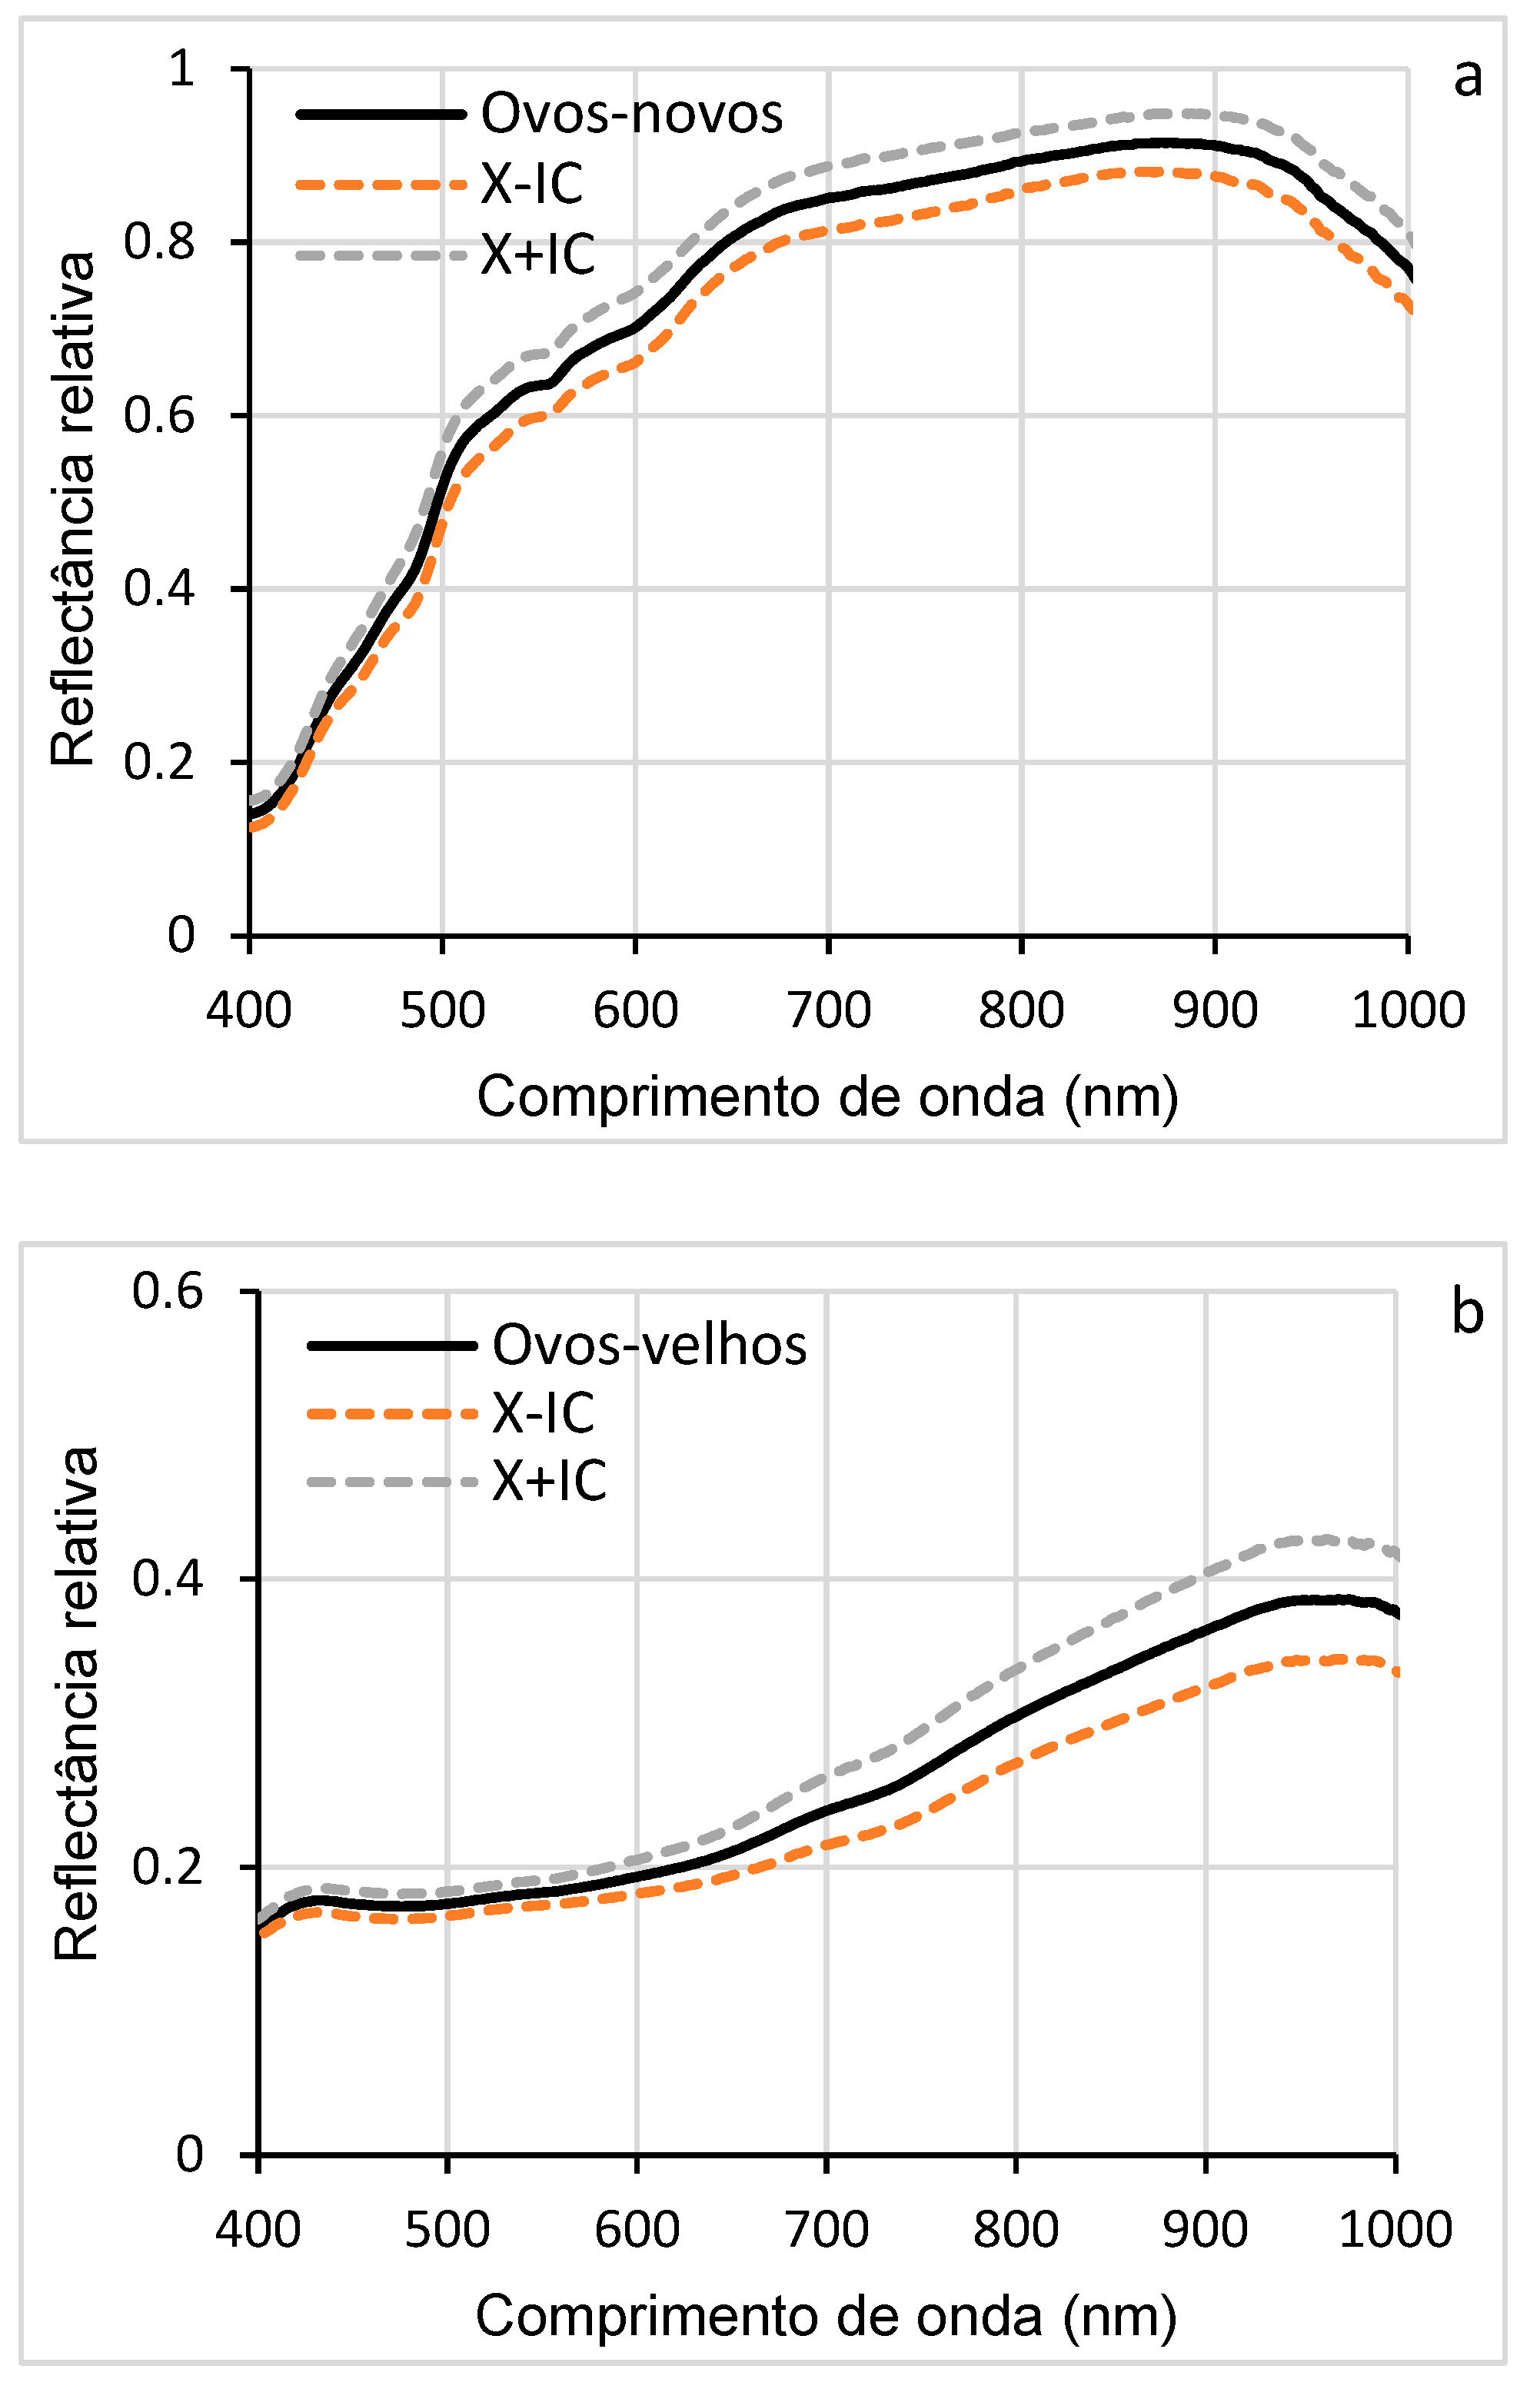
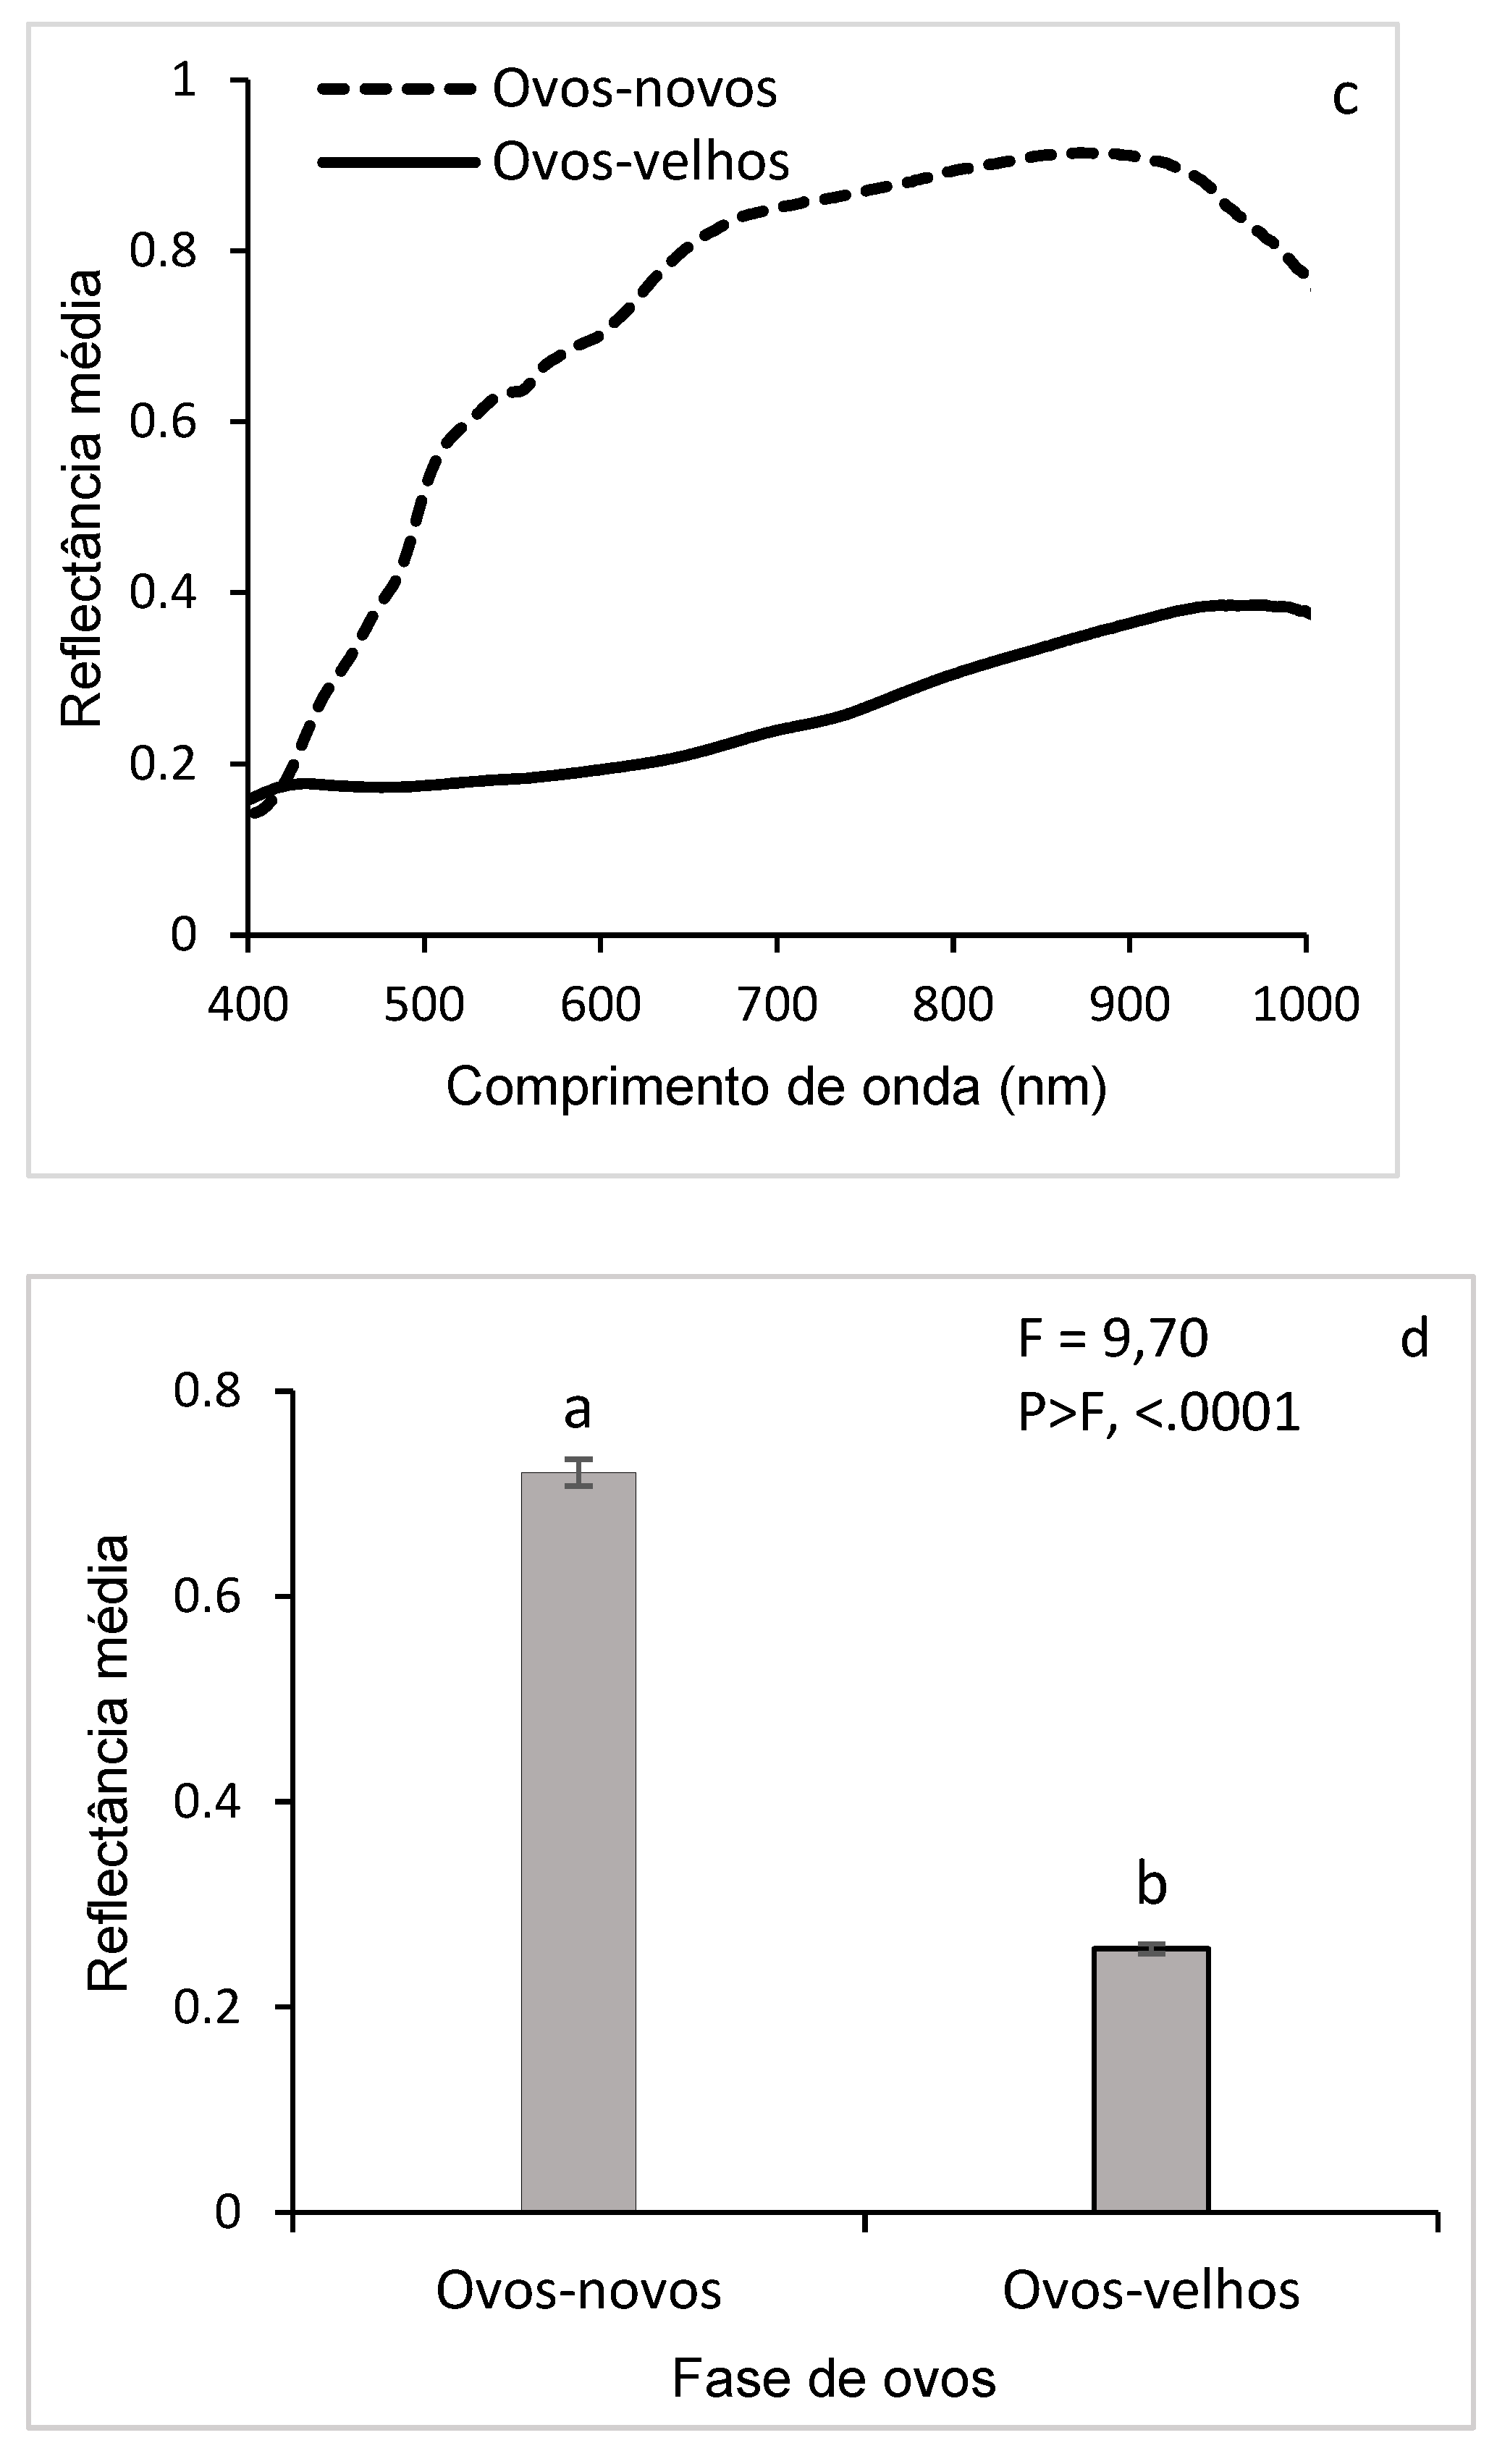
Figure 7.
Hyperspectral reflectance (a, b, c, d, e, f, g) and comparison of the means (g) of the larval stages of D. saccharalis. (larva 1: 7 DAH; larva2: 15 DAH; larva3: 20 DAH; larva4: 30 DAH; larva5: 40 DAH, where DAH is days after hatching the eggs). *CI (95% confidence interval). *Means followed by the same letter do not differ from each other by the SNK test (p˂0.05).
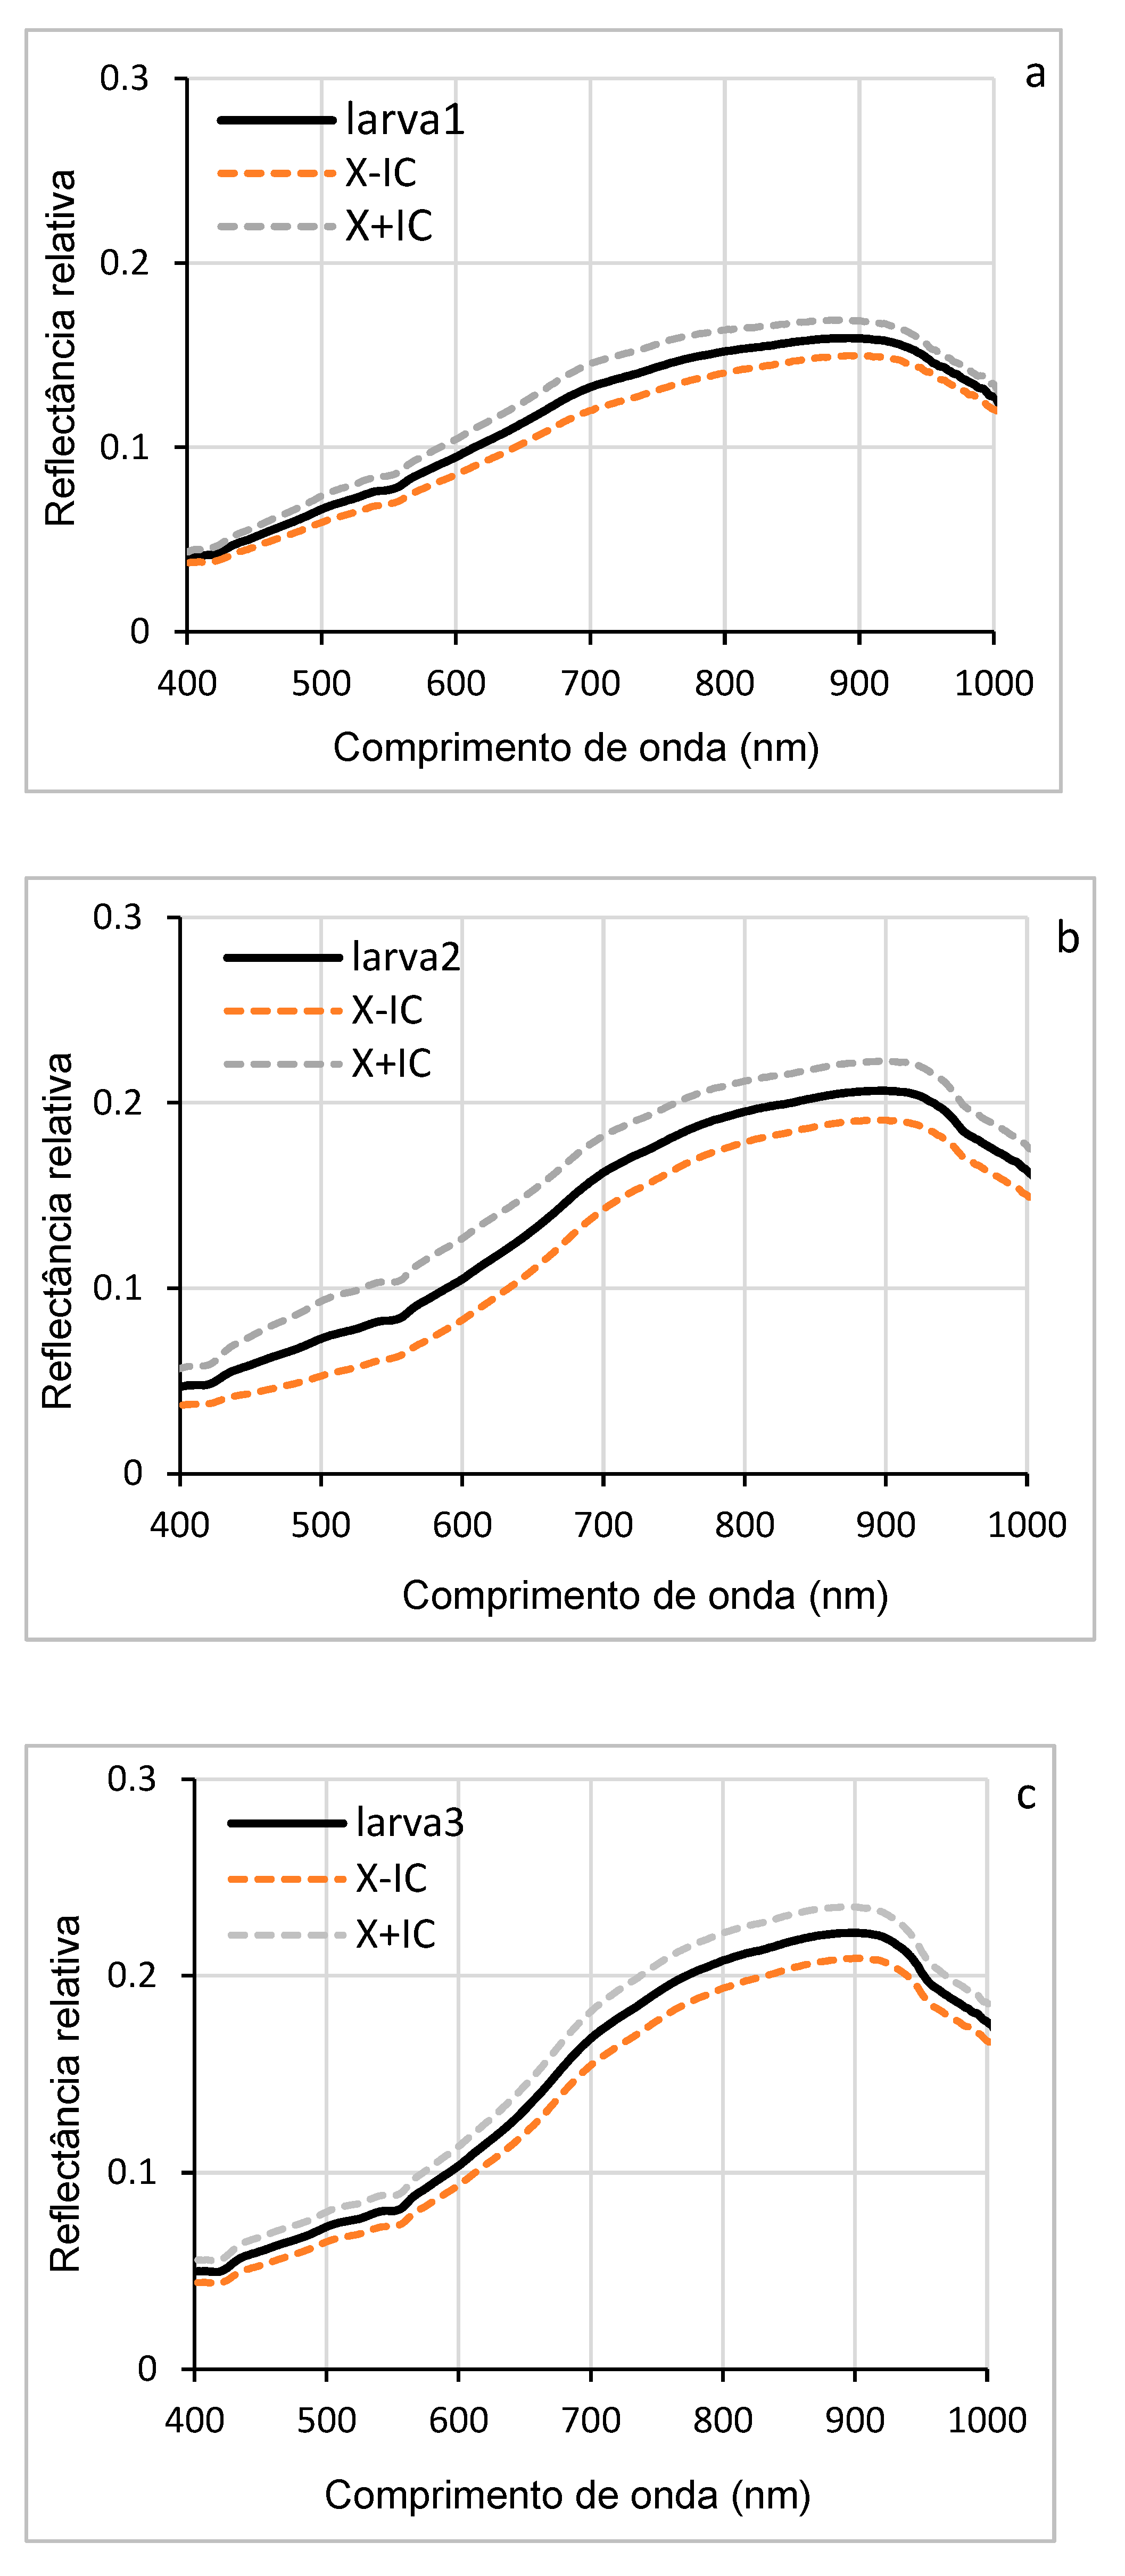
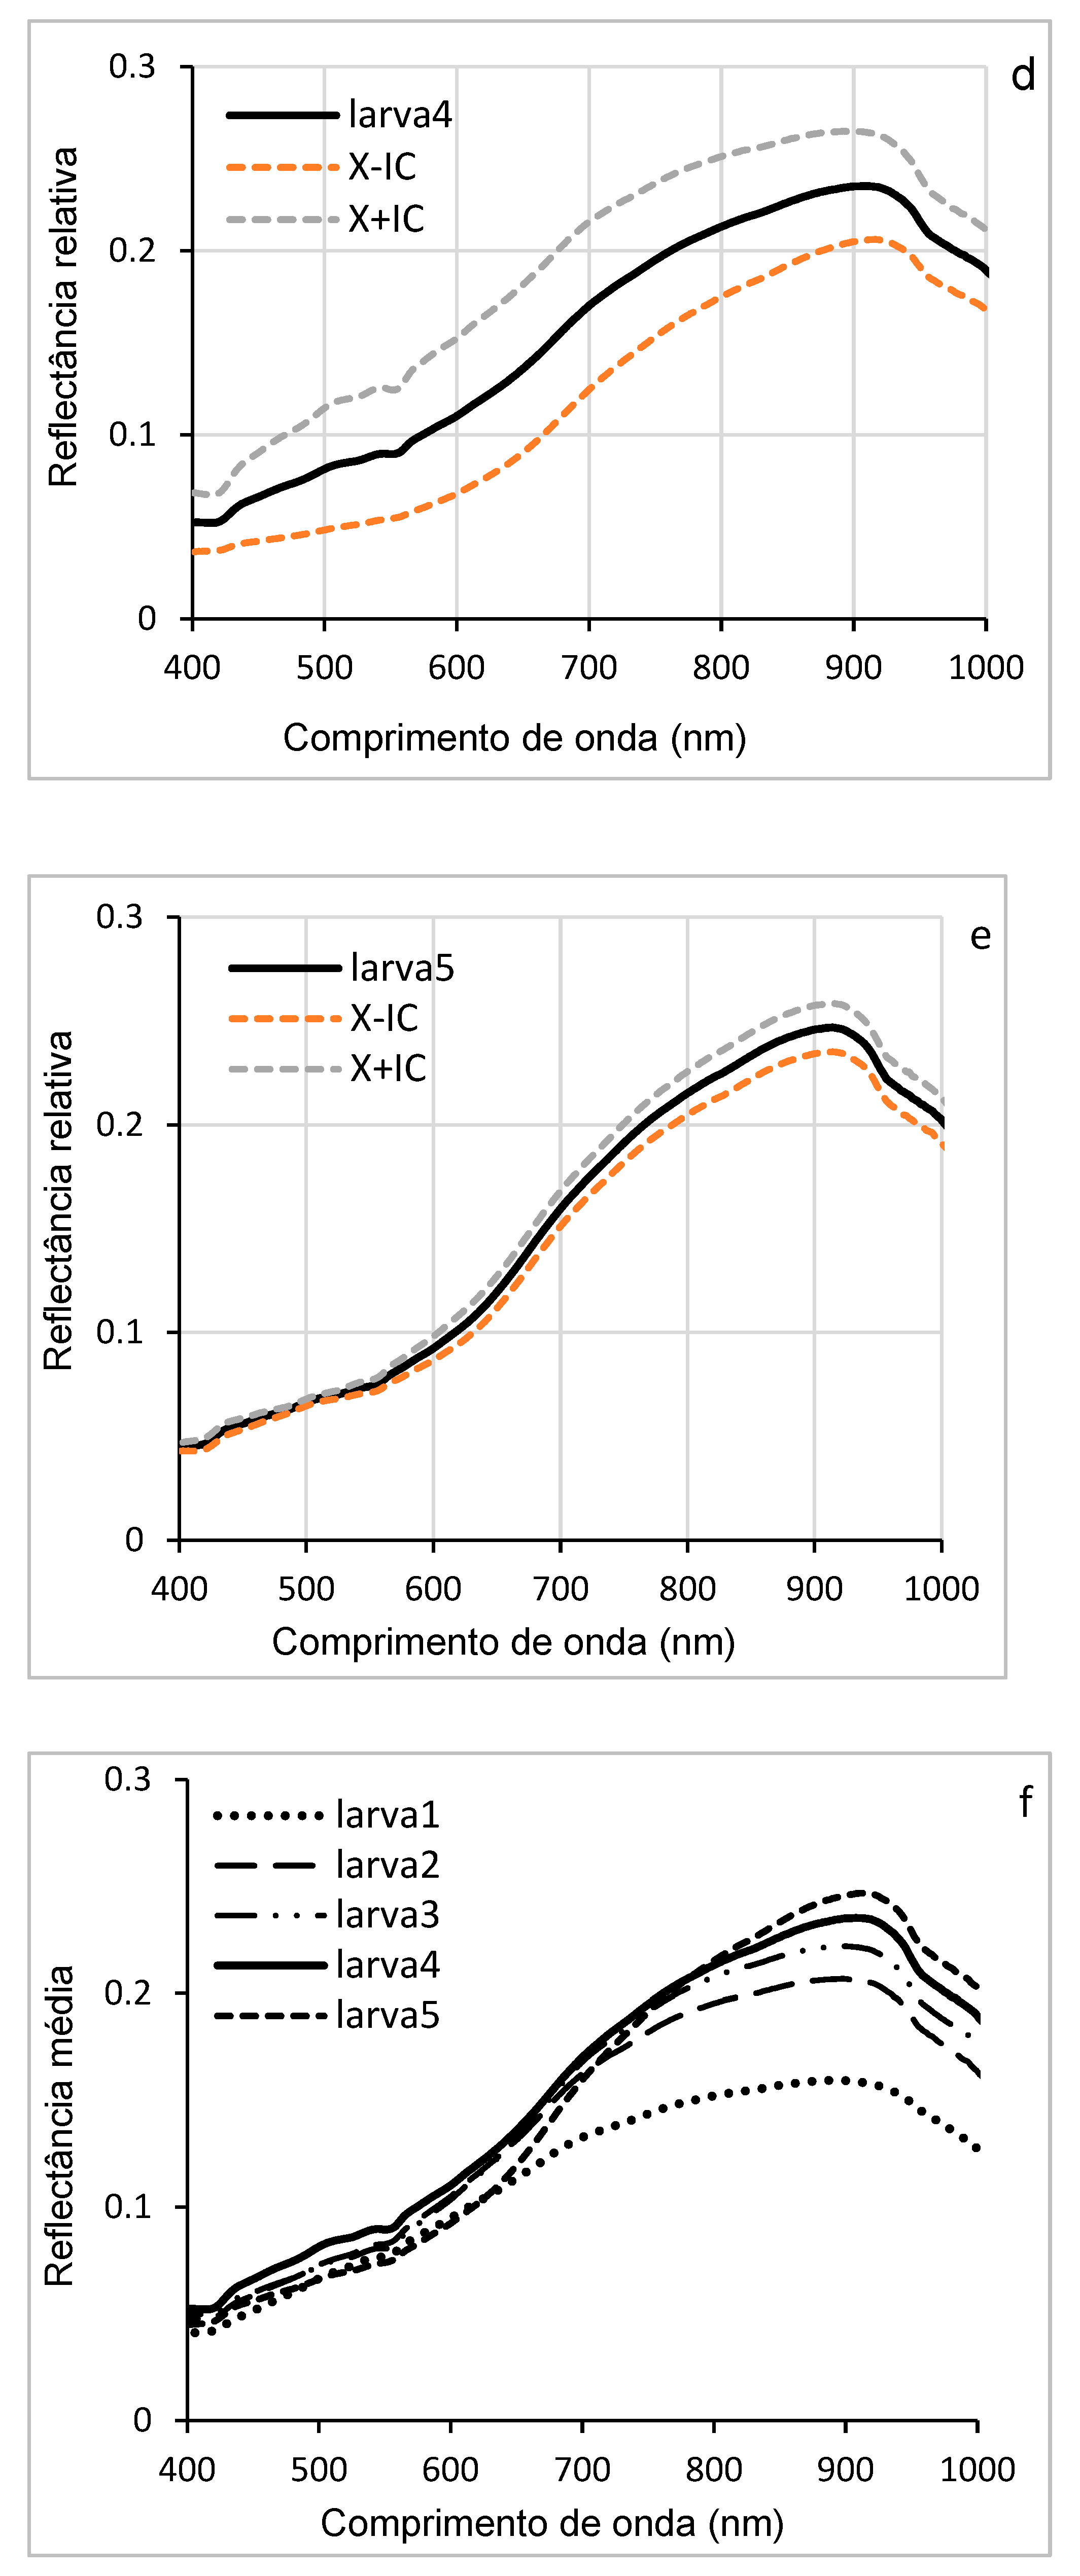
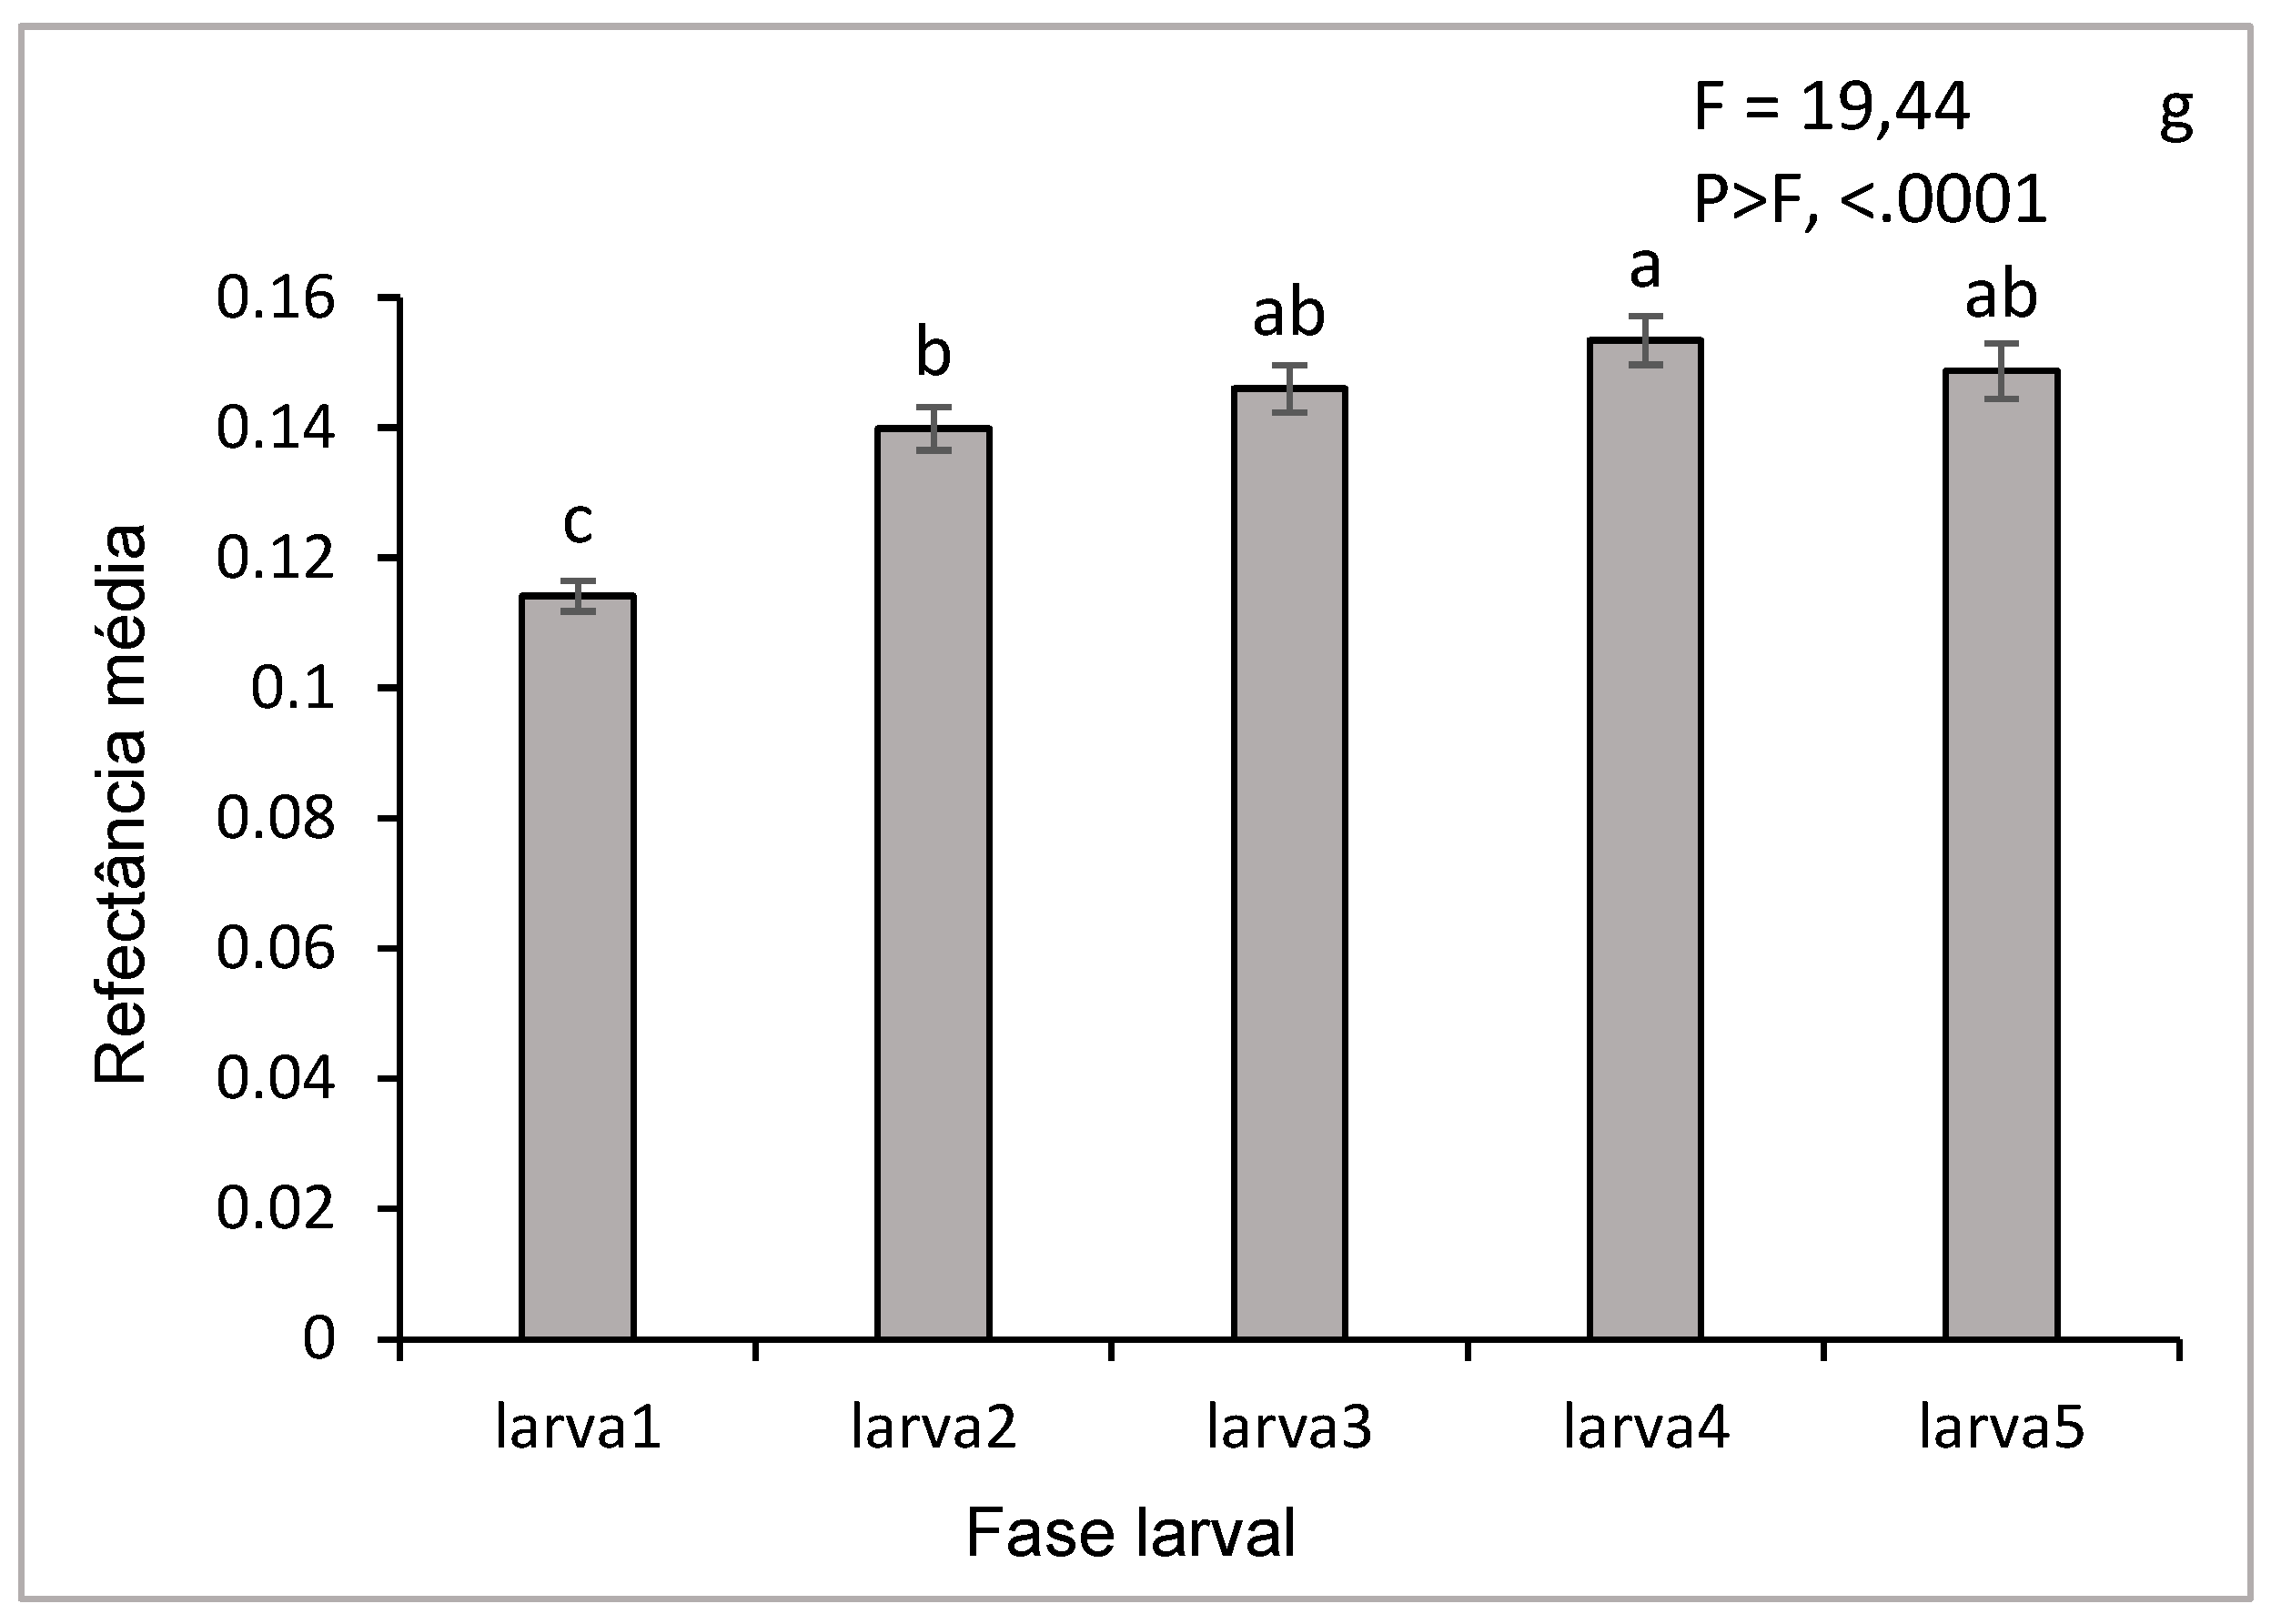
Figure 8.
Hyperspectral reflectance (a, b, c) and comparison of the means (d) of the hyperspectral response of the different phases of the pupae of D. saccharalis. (New pupa: 2-day-old pupa; 9-day-old pupa; pupa). *CI (95% confidence interval). *Means followed by the same letter do not differ from each other by the SNK test (p˂0.05).
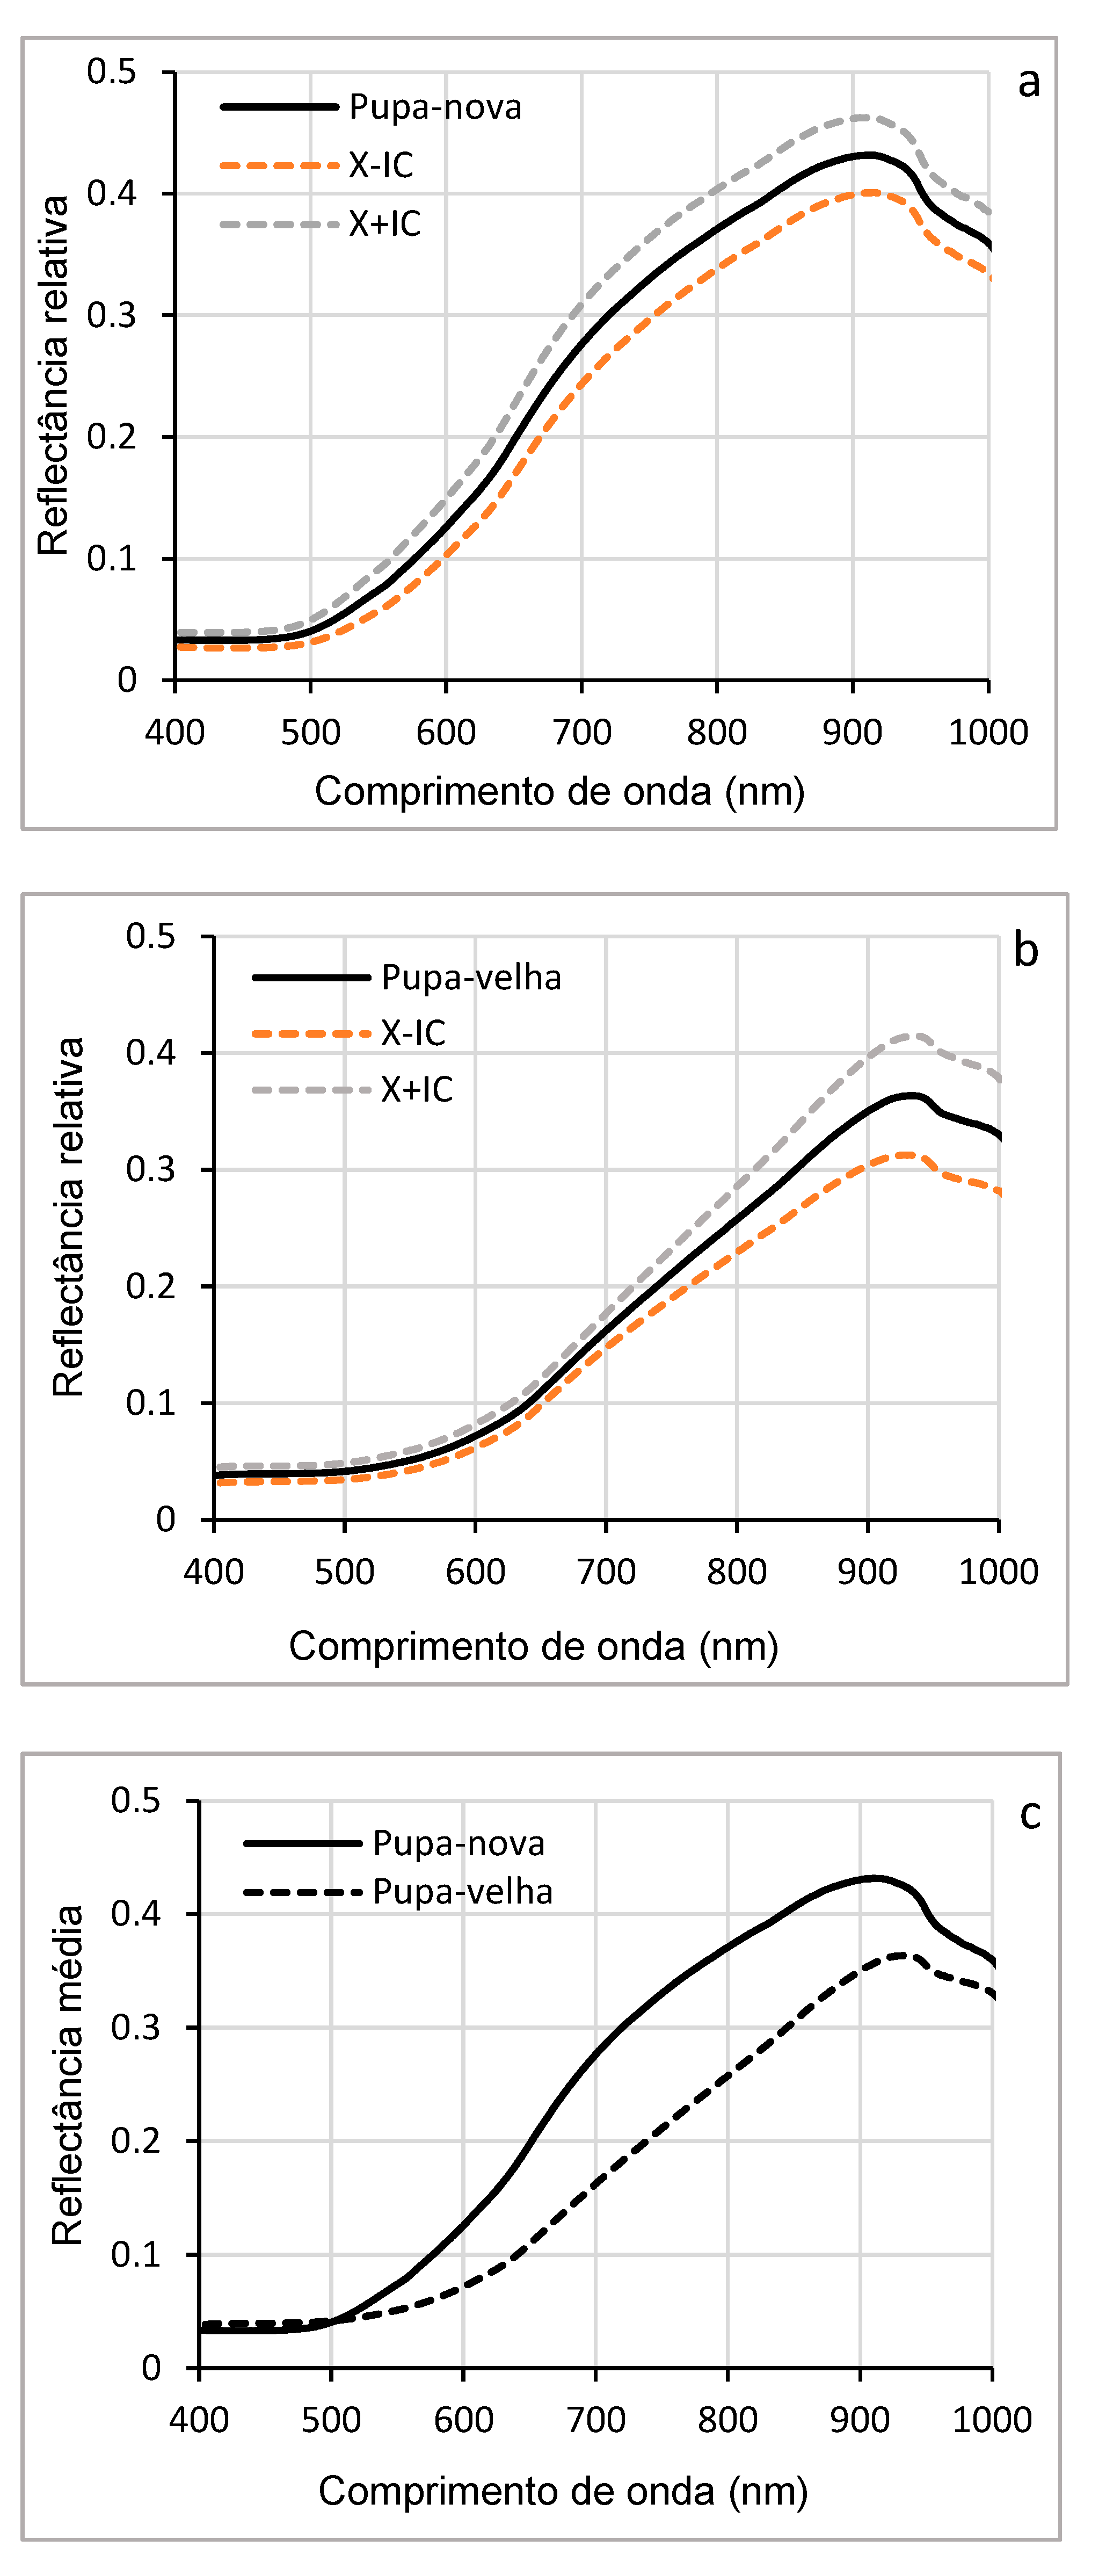
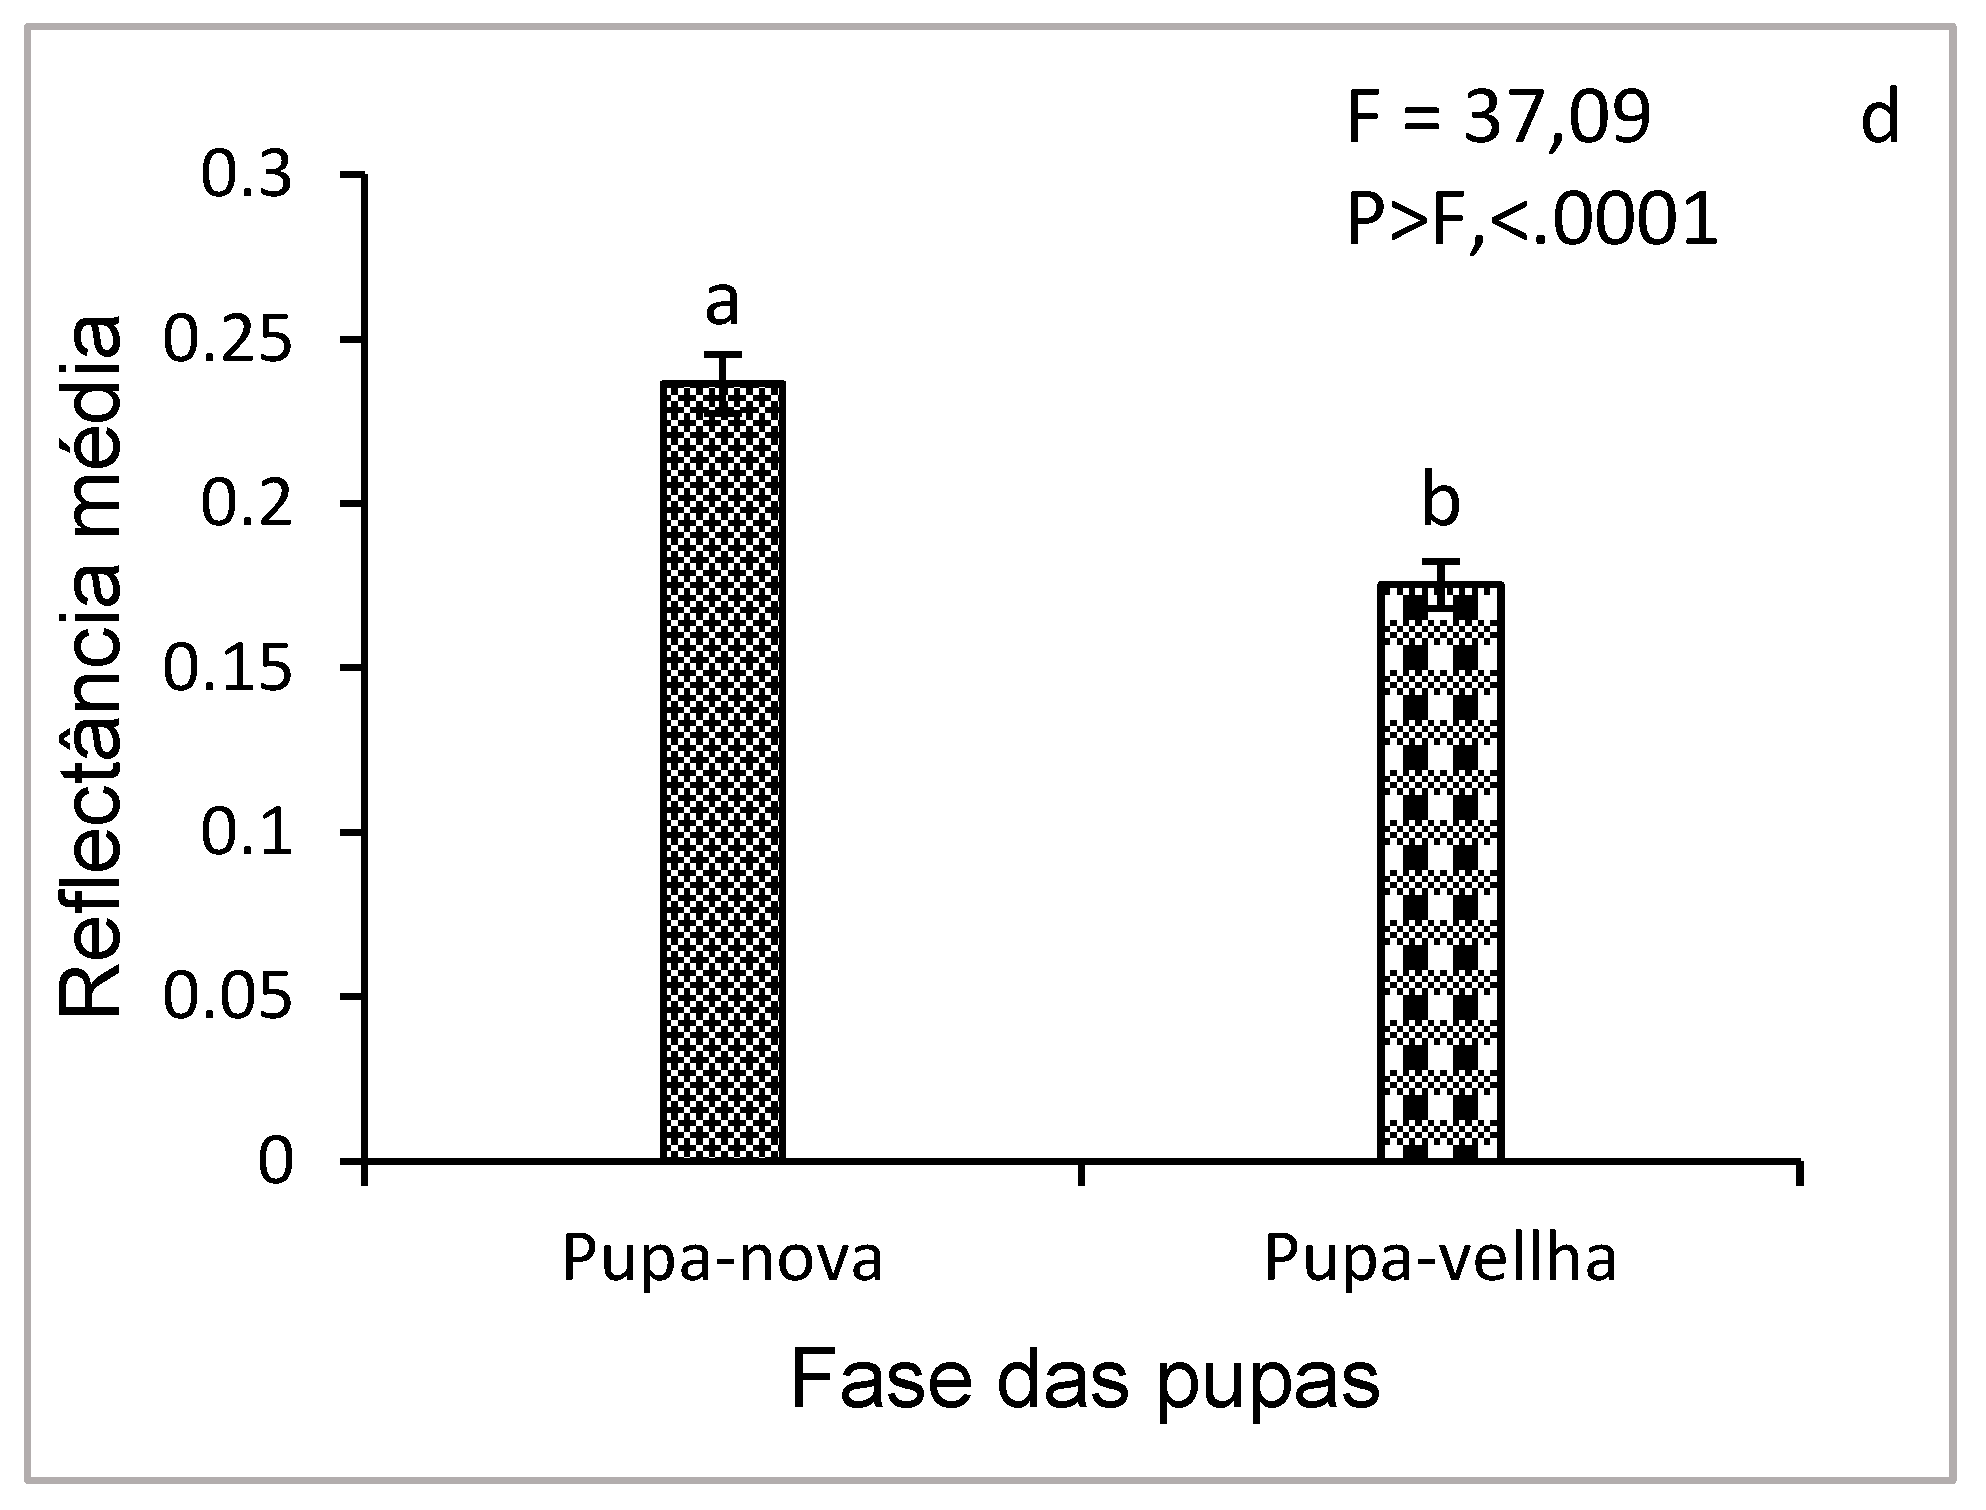
Figure 9.
Hyperspectral reflectance (a,b,c) and comparison of means (d) of the hyperspectral response of the dorsal and ventral parts of adults of D. saccharalis. *CI (95% confidence interval). *Means followed by the same letter do not differ from each other by the SNK test (p˂0.05).
Figure 9.
Hyperspectral reflectance (a,b,c) and comparison of means (d) of the hyperspectral response of the dorsal and ventral parts of adults of D. saccharalis. *CI (95% confidence interval). *Means followed by the same letter do not differ from each other by the SNK test (p˂0.05).
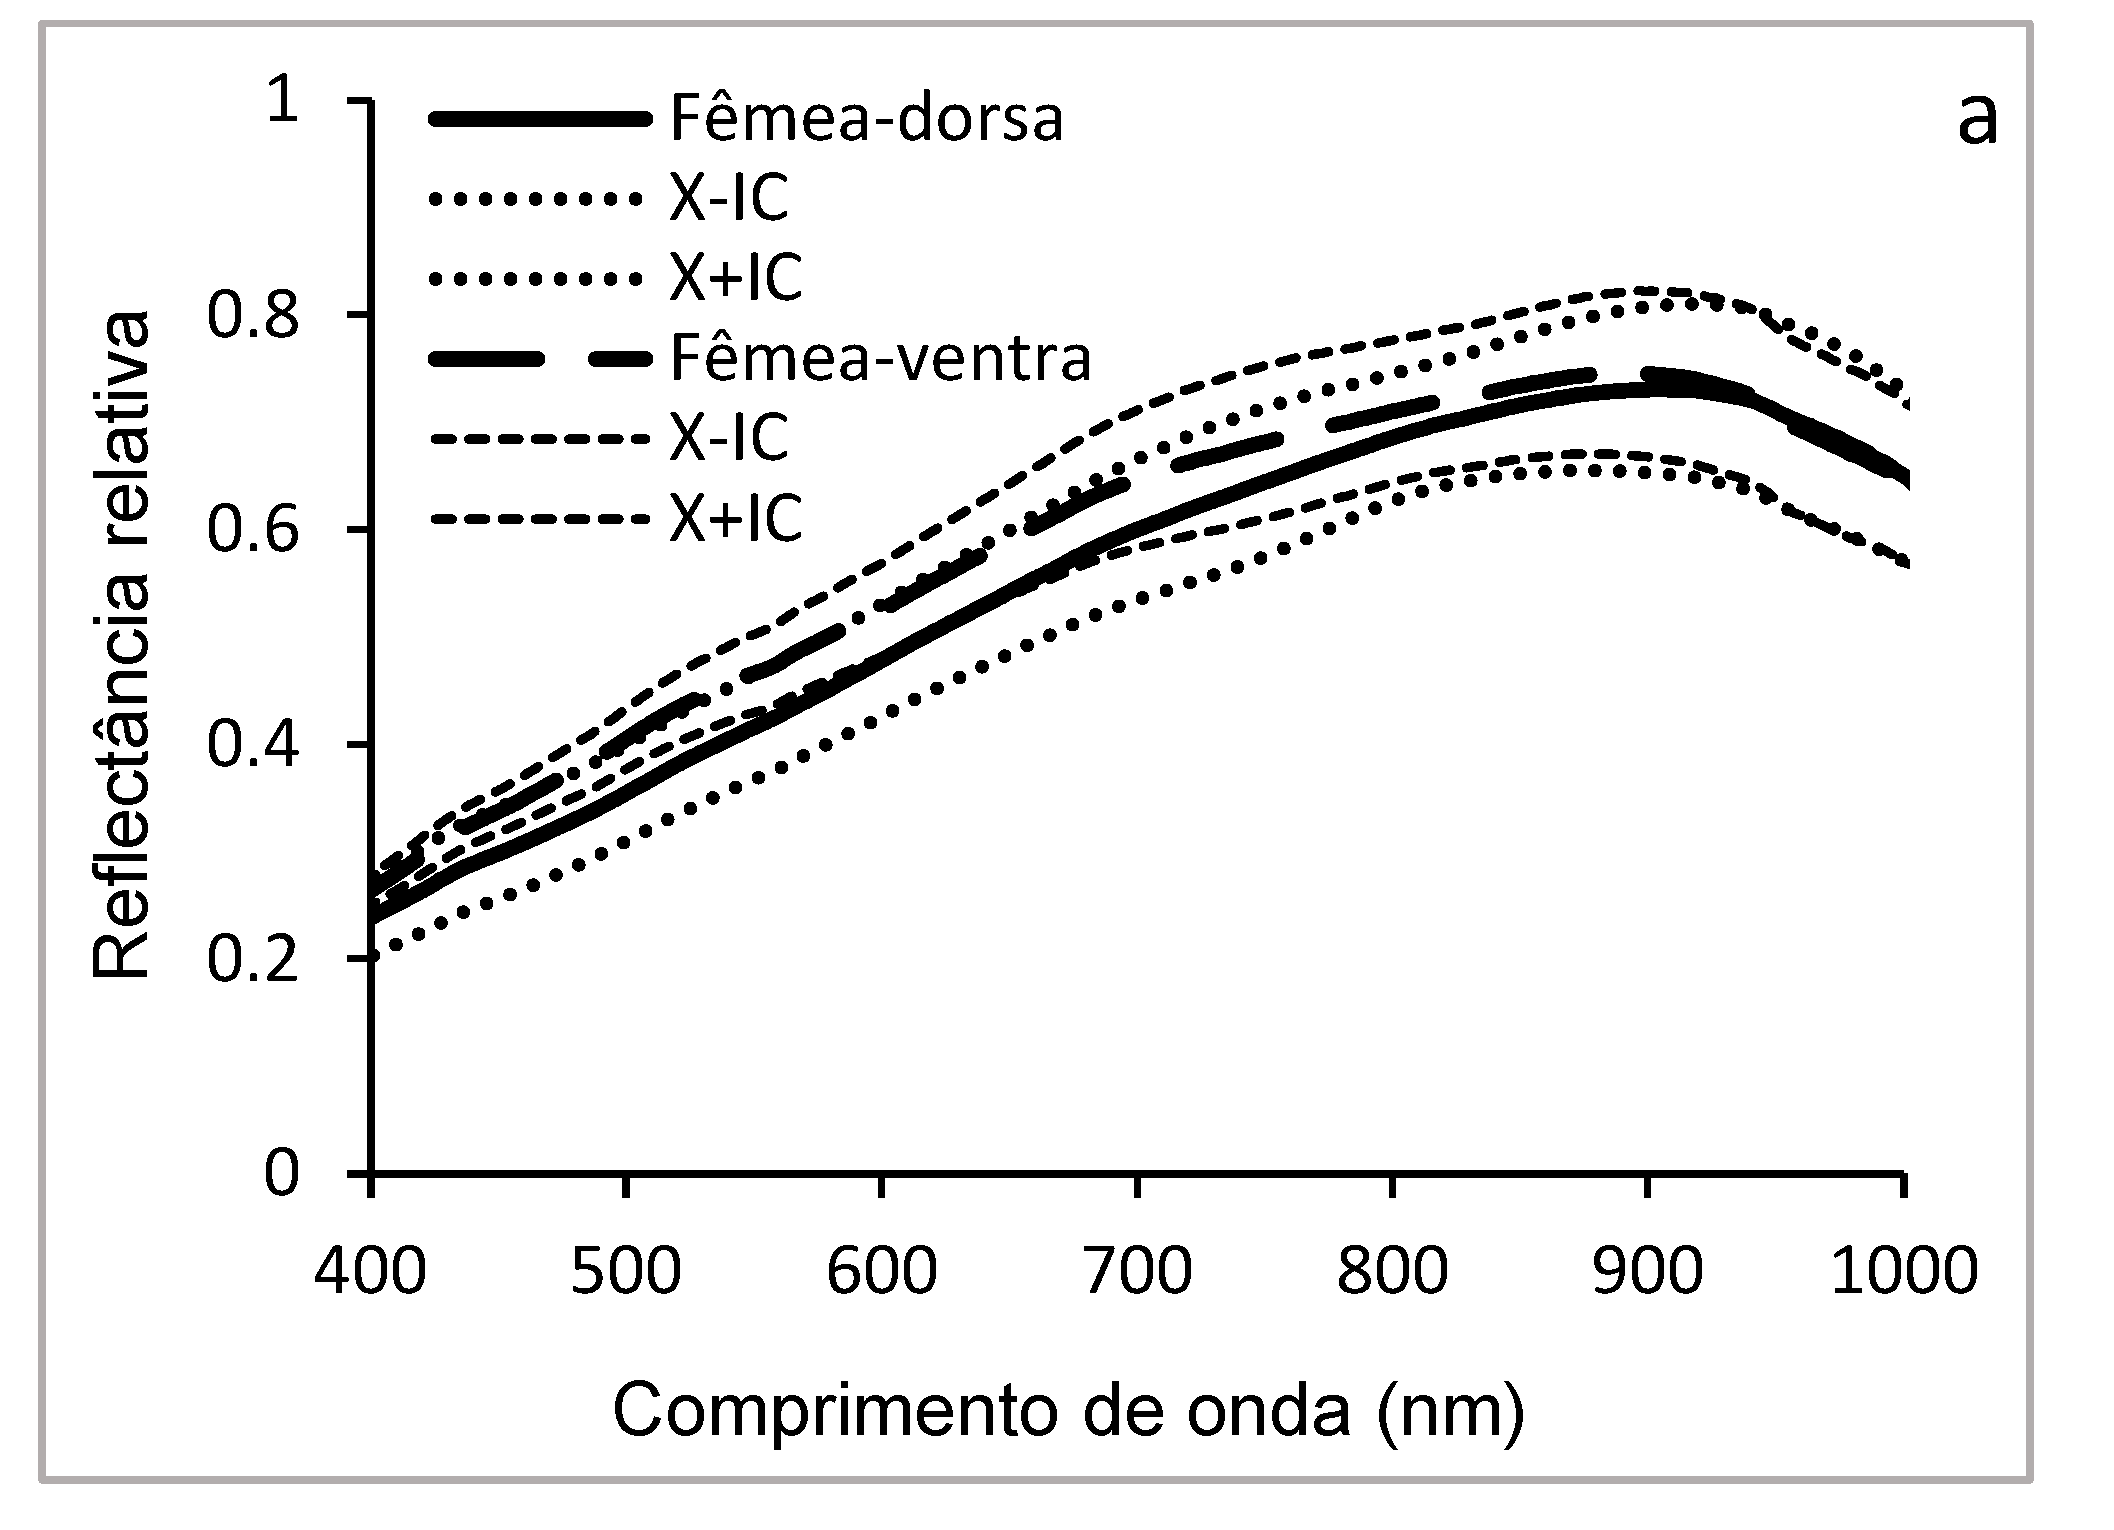
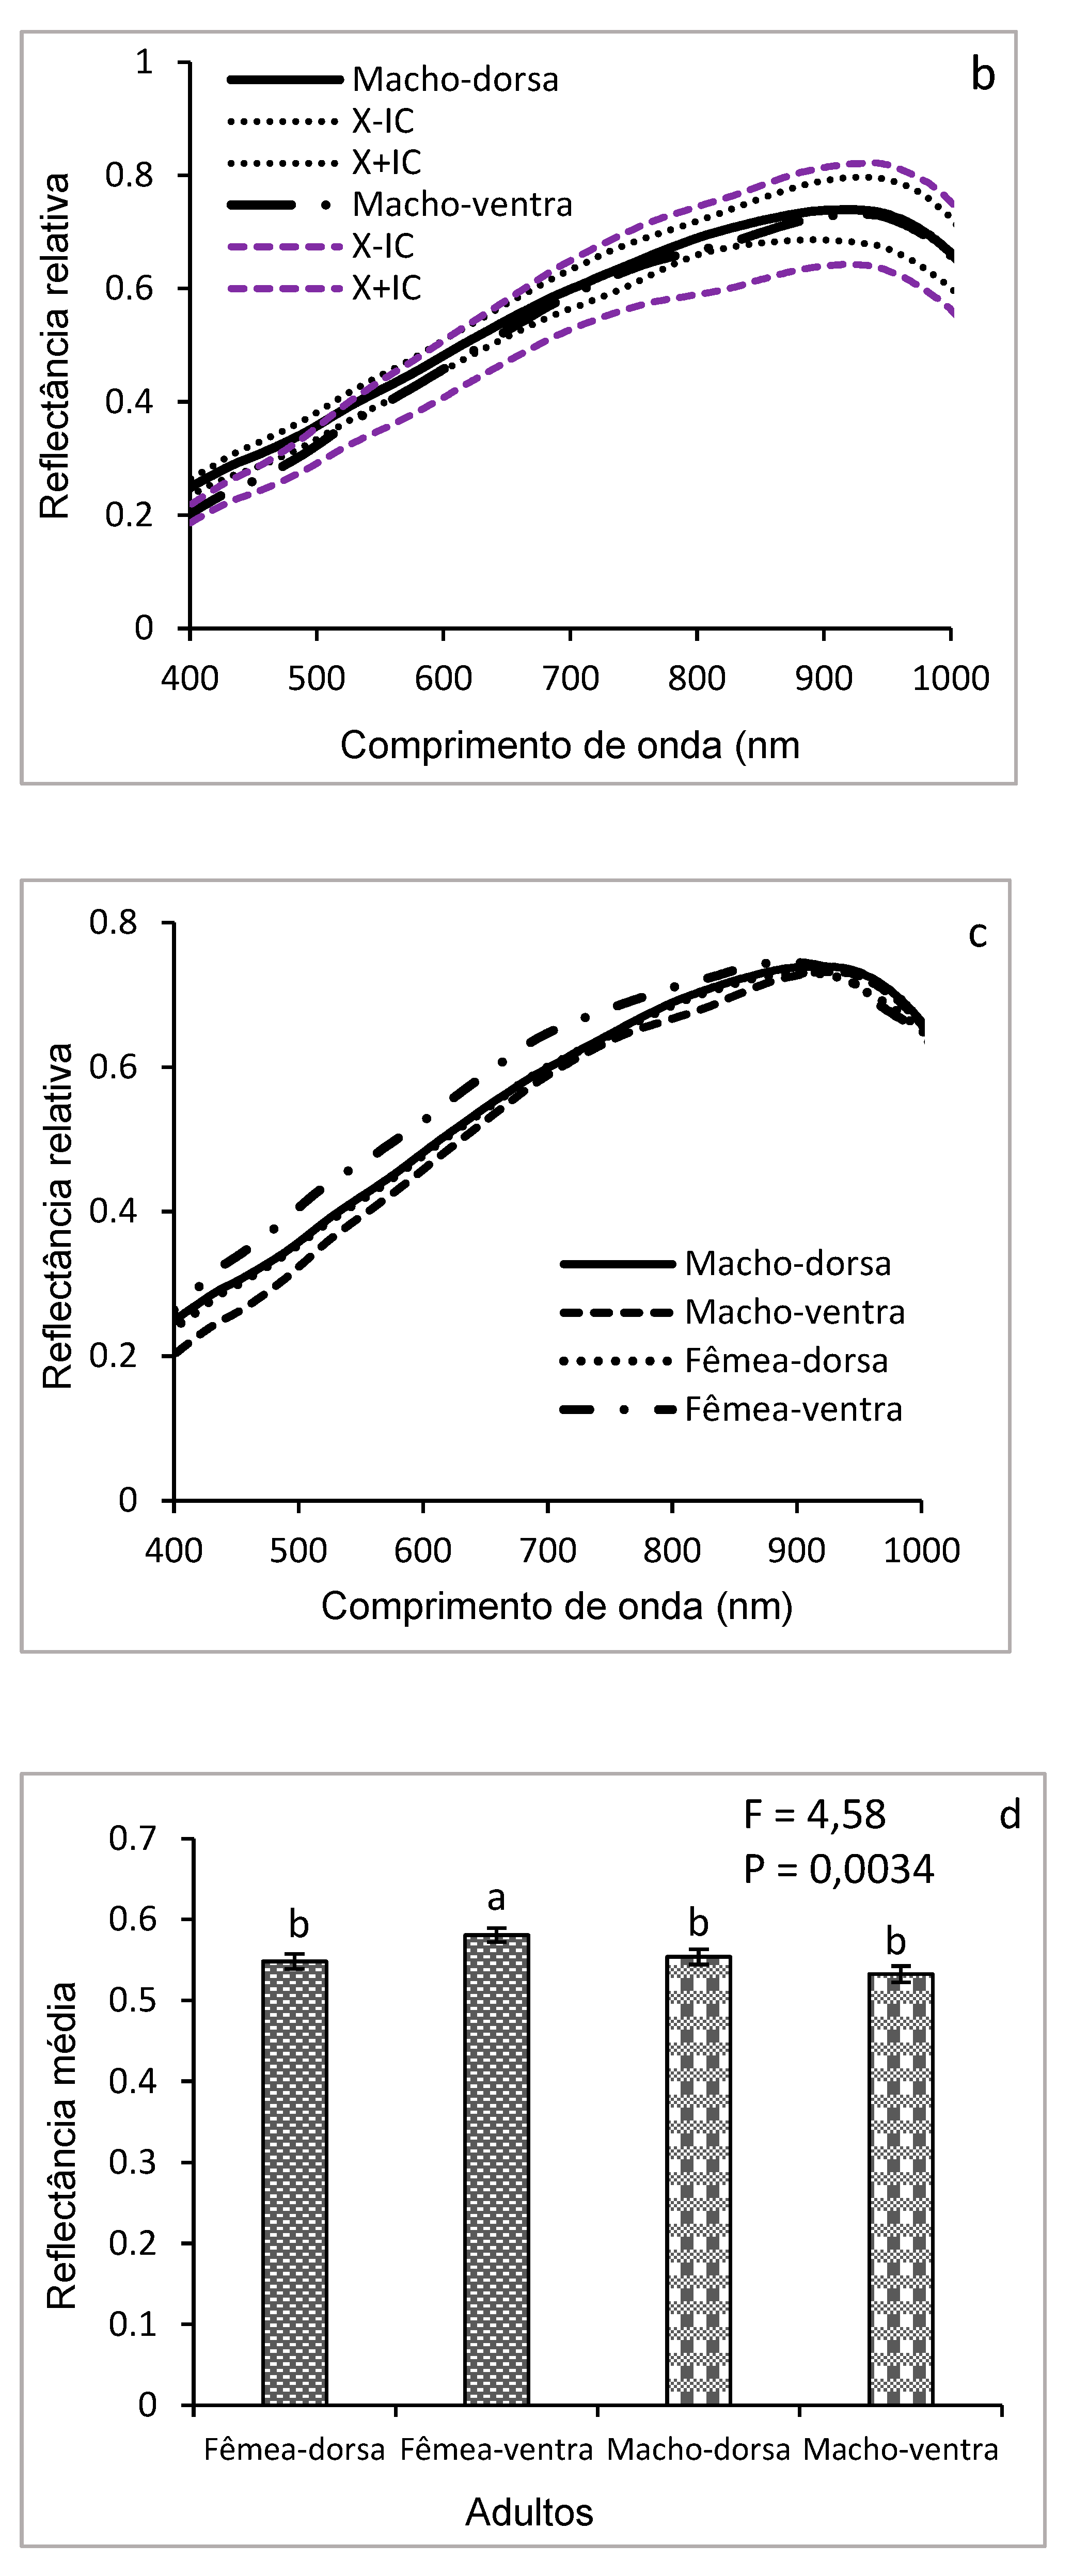
Figure 10.
Hyperspectral reflectance of live (a) and dead (b) lavas of D. saccharalis.
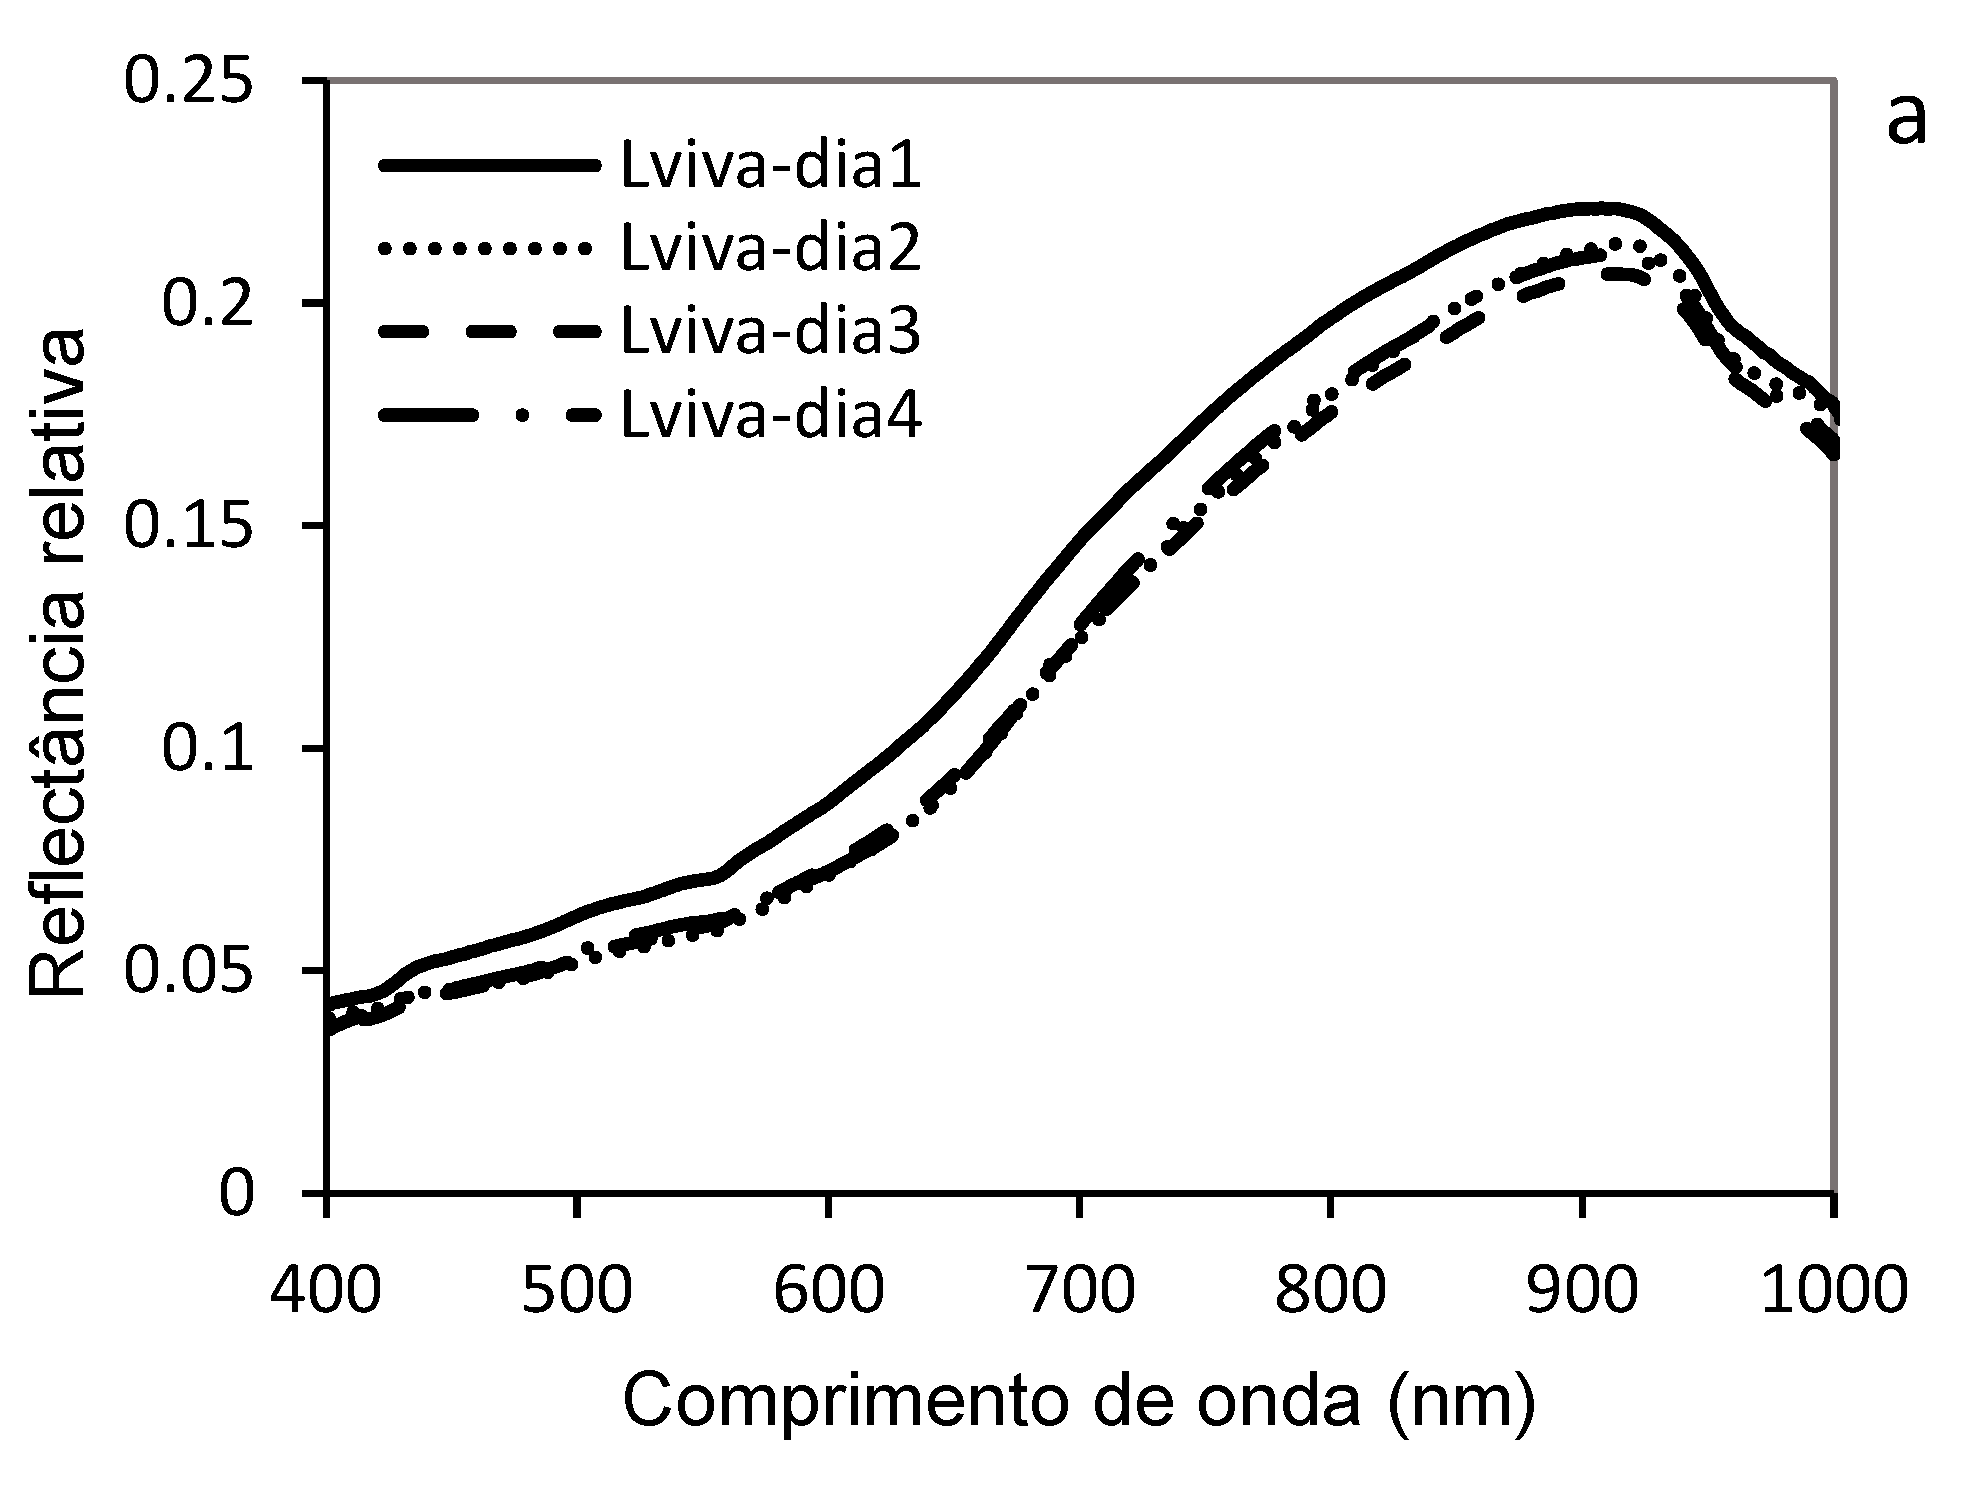
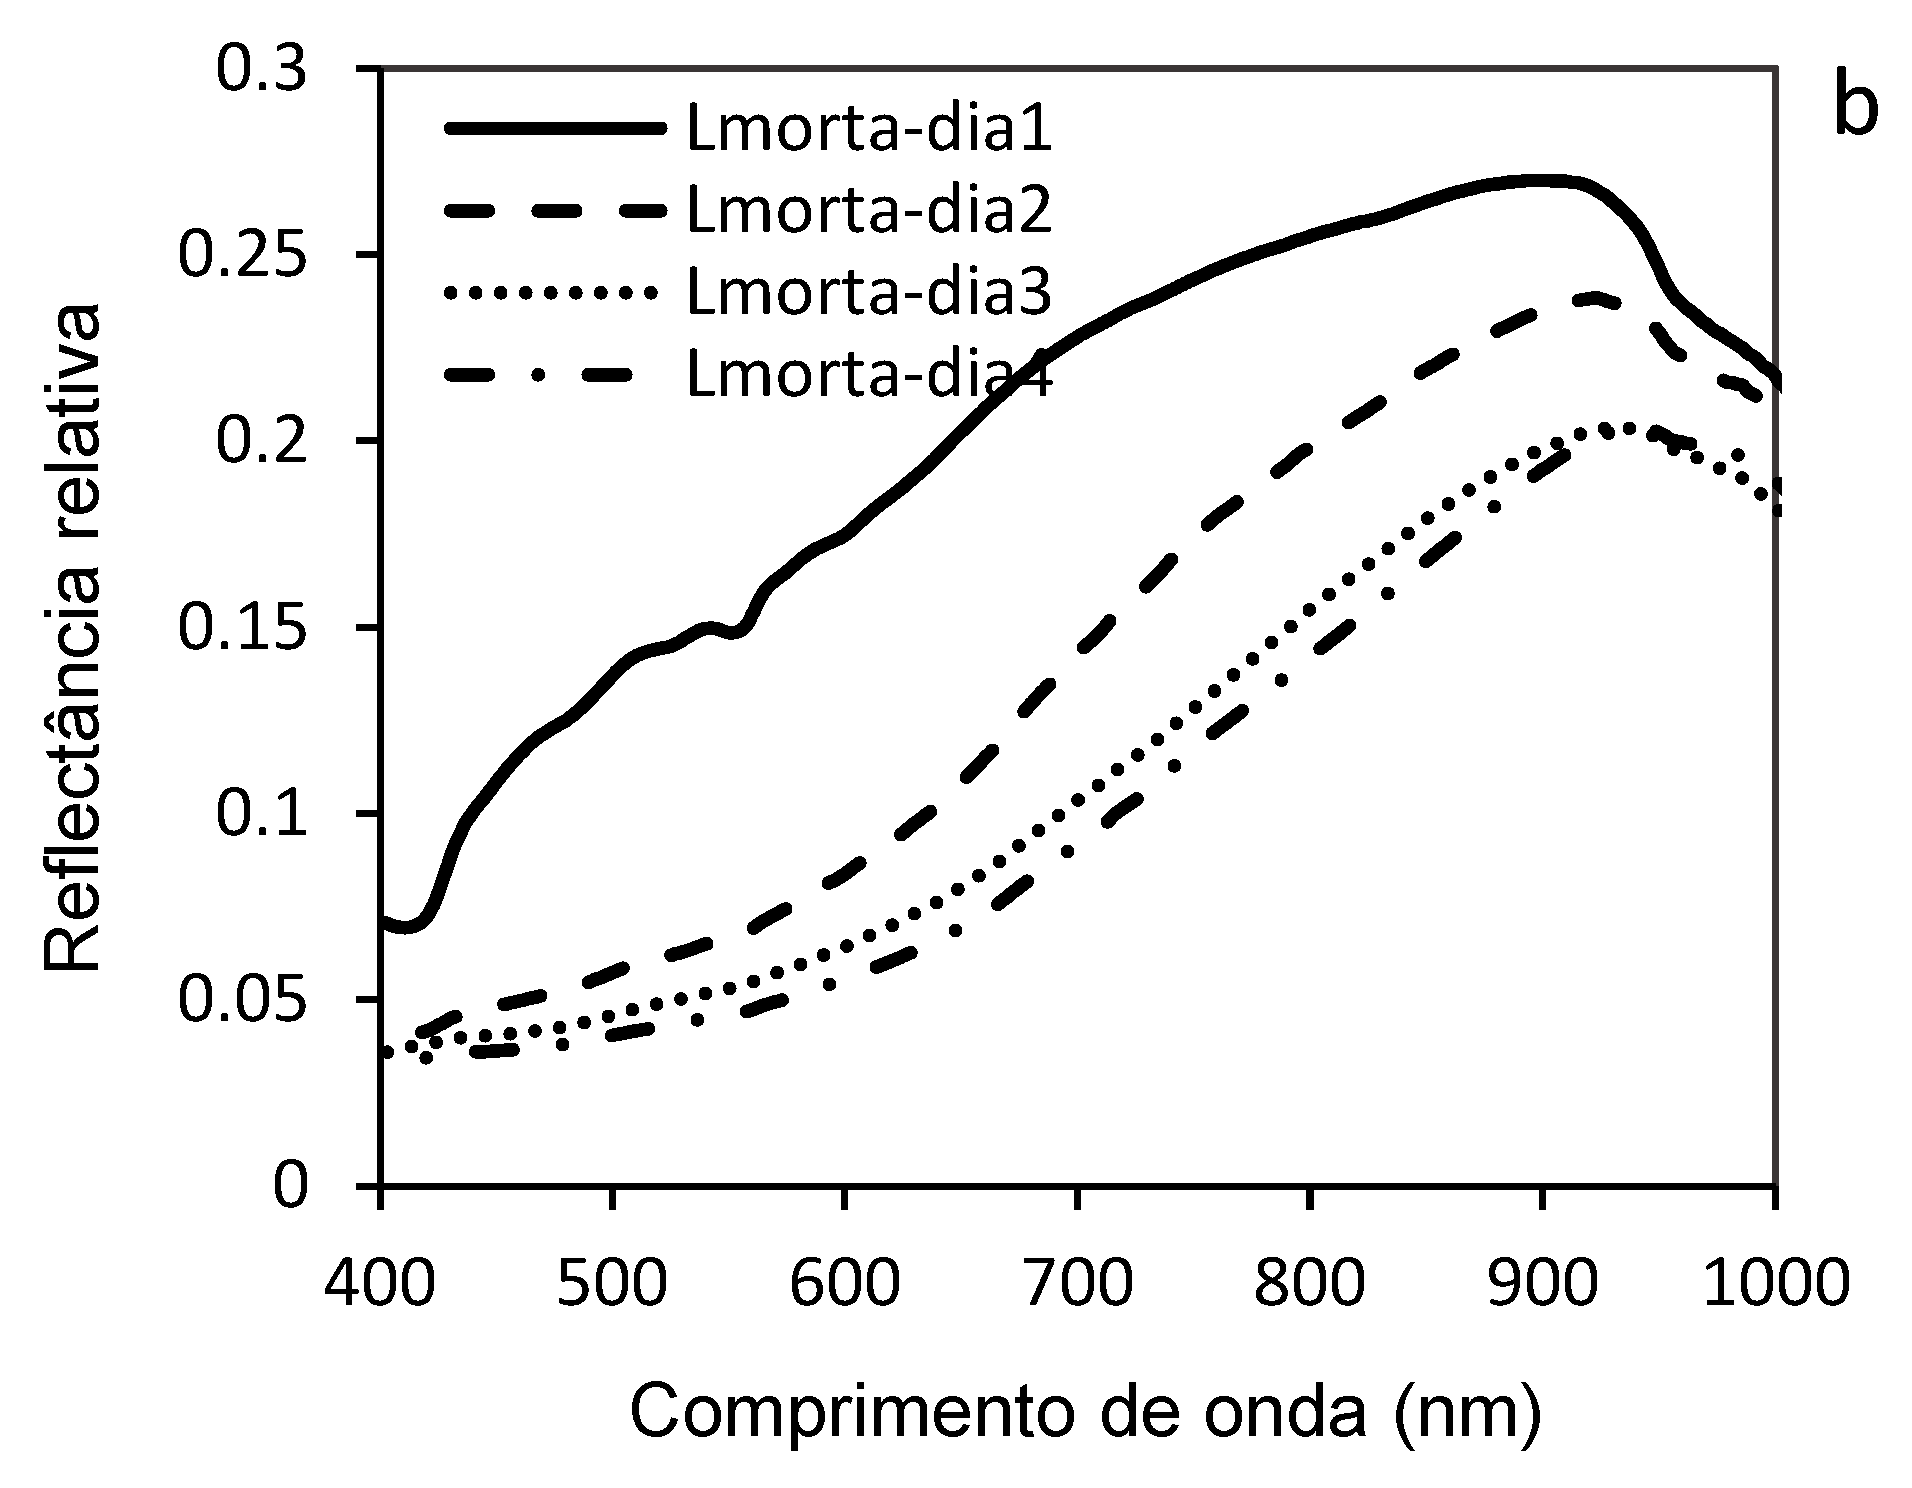
Figure 11.
Mean hyperspectral reflectance of D. saccharalis lavas, 3-6-8-10 days after parasitism by C. flavipes (a,b,c,d,e) and comparison of the mean reflectances of the days post-parasitism (f). *Means followed by the same letter do not differ from each other by the SNK test (p˂0.05).
Figure 11.
Mean hyperspectral reflectance of D. saccharalis lavas, 3-6-8-10 days after parasitism by C. flavipes (a,b,c,d,e) and comparison of the mean reflectances of the days post-parasitism (f). *Means followed by the same letter do not differ from each other by the SNK test (p˂0.05).
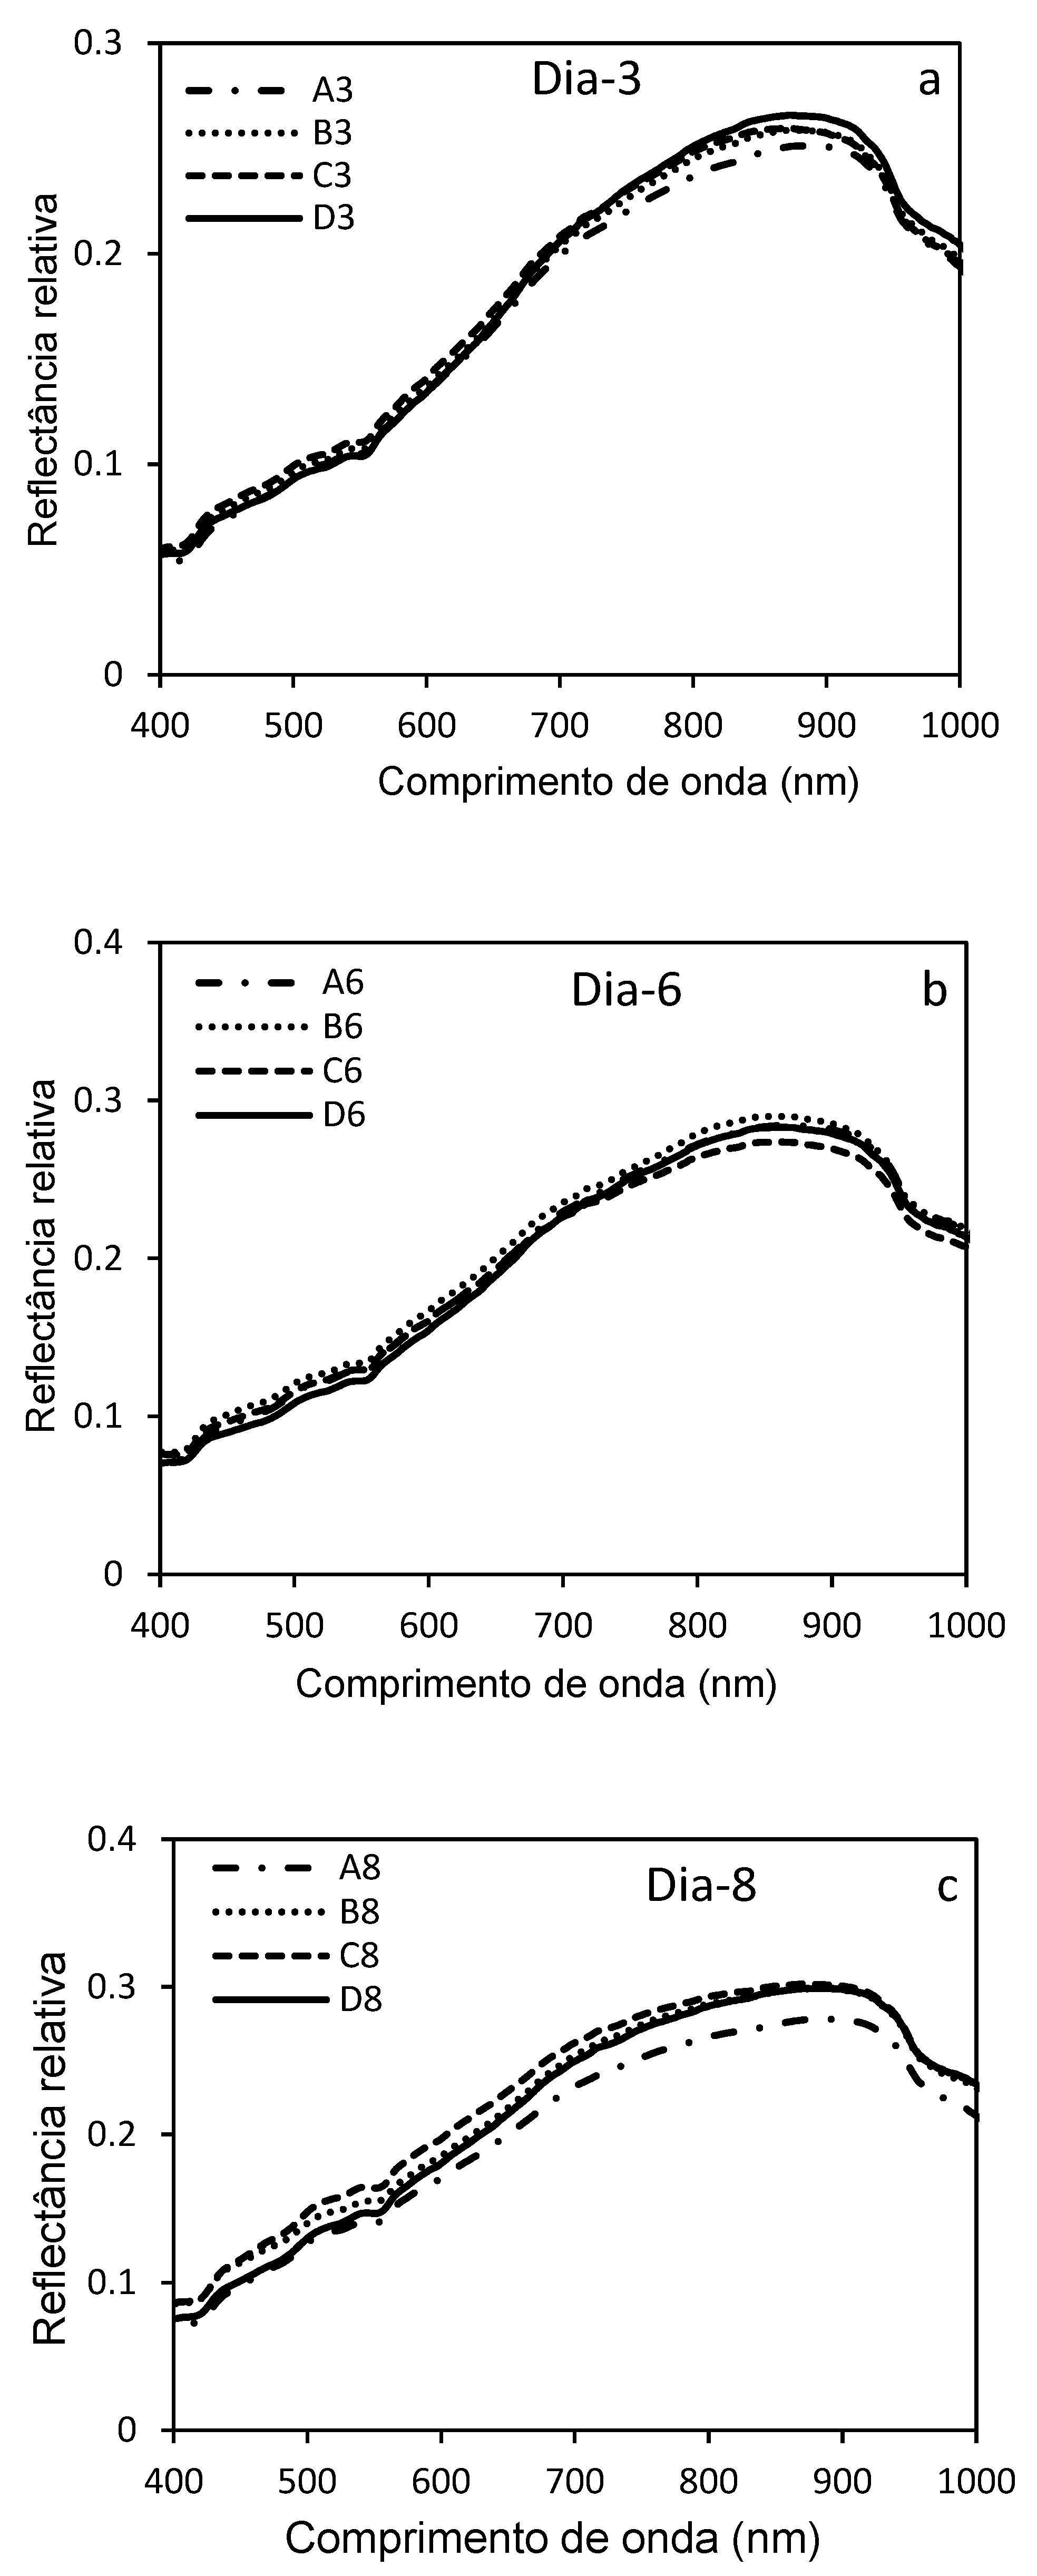
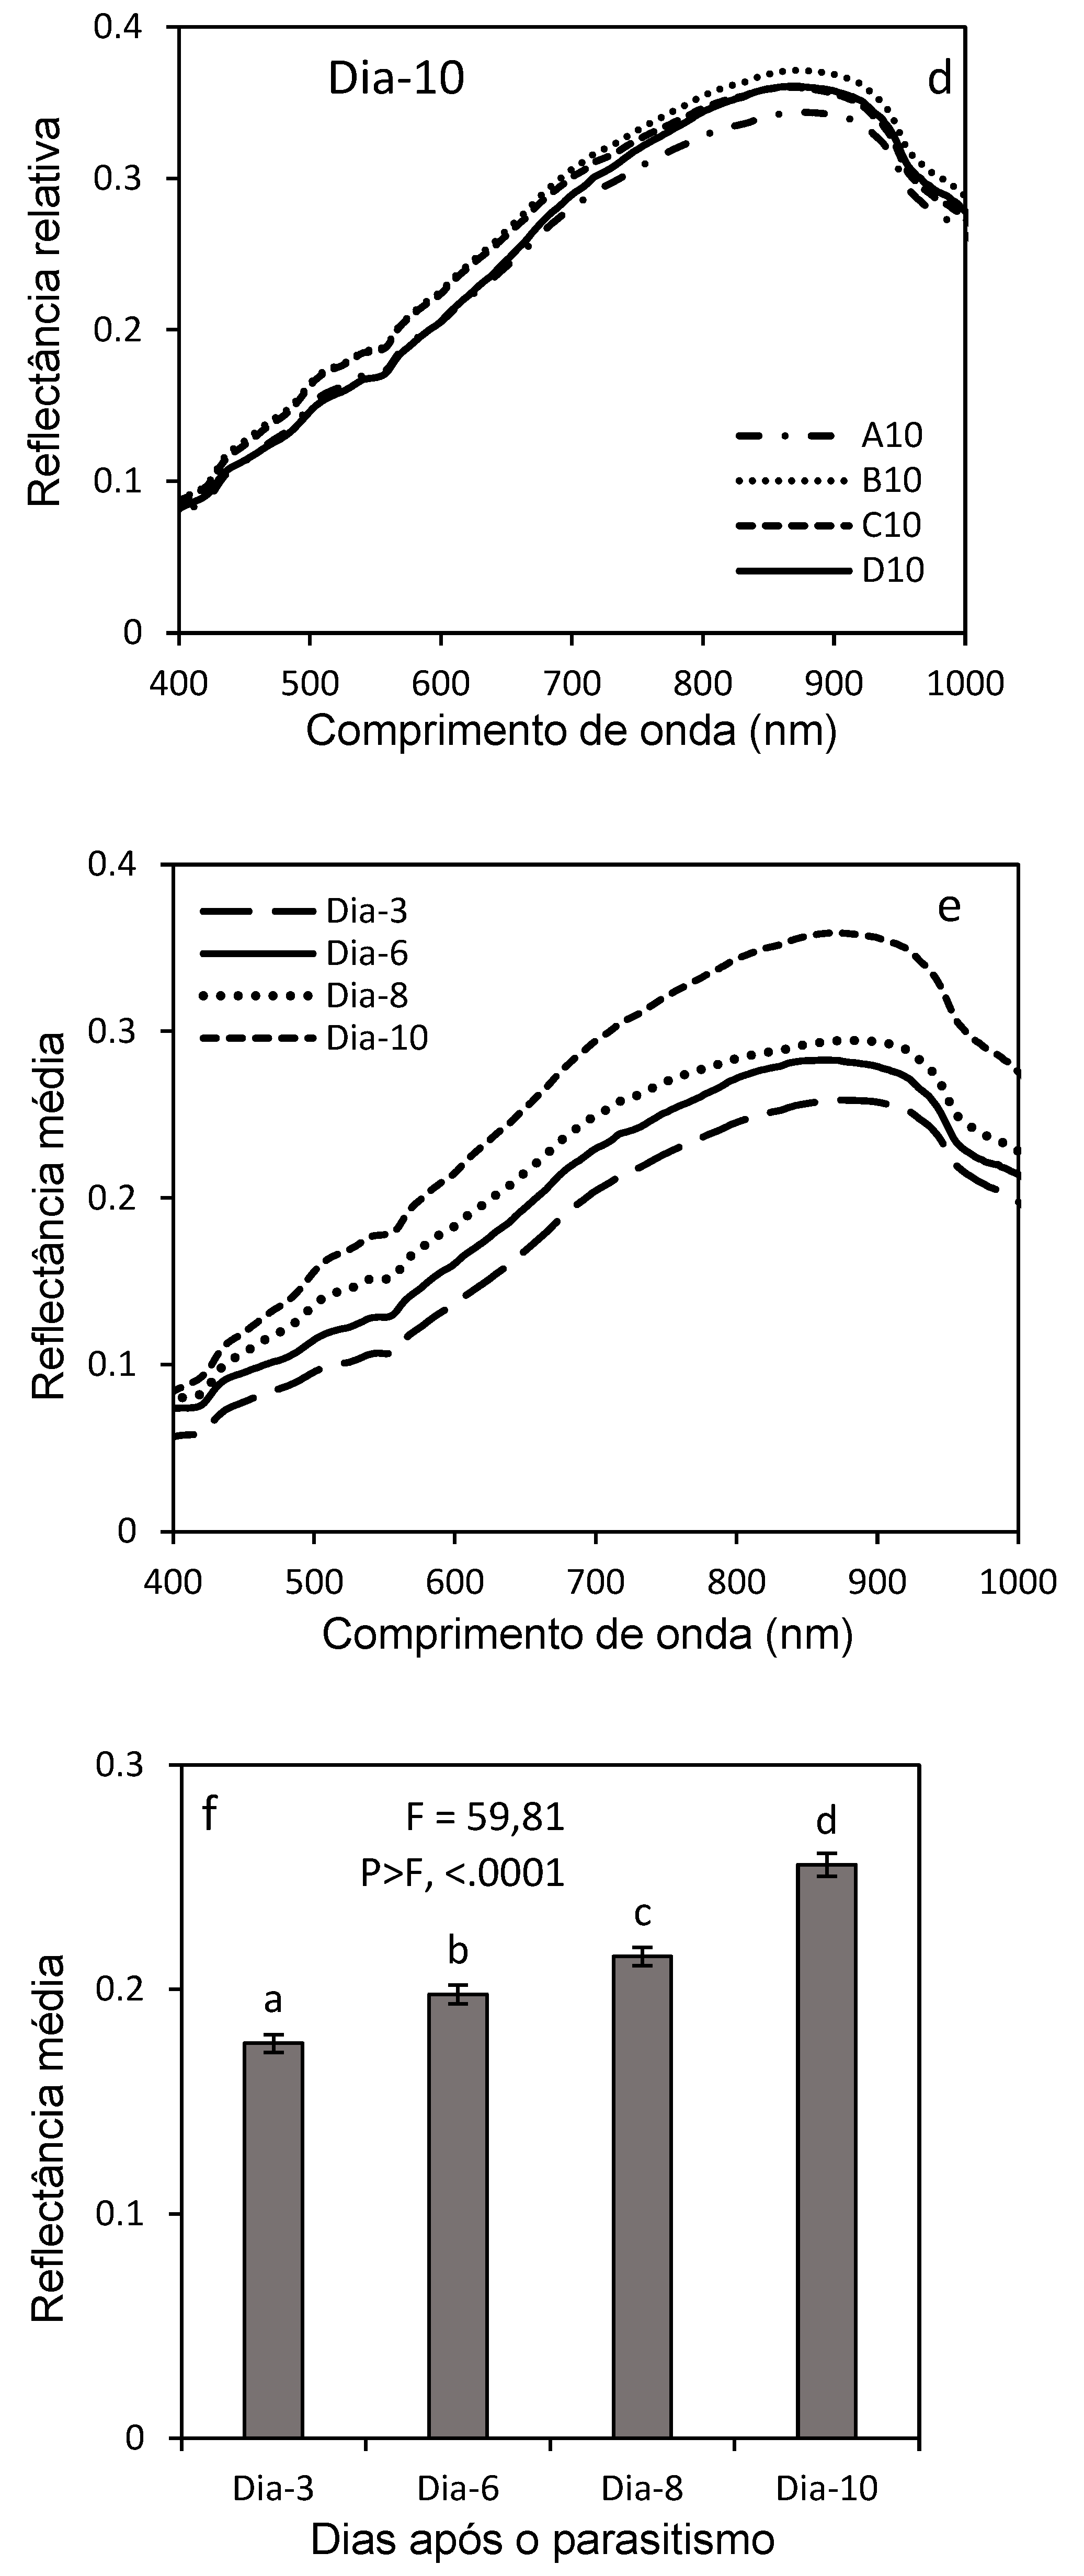
Figure 12.
2D Principal Component Analysis of larval stages of D. saccharalis.
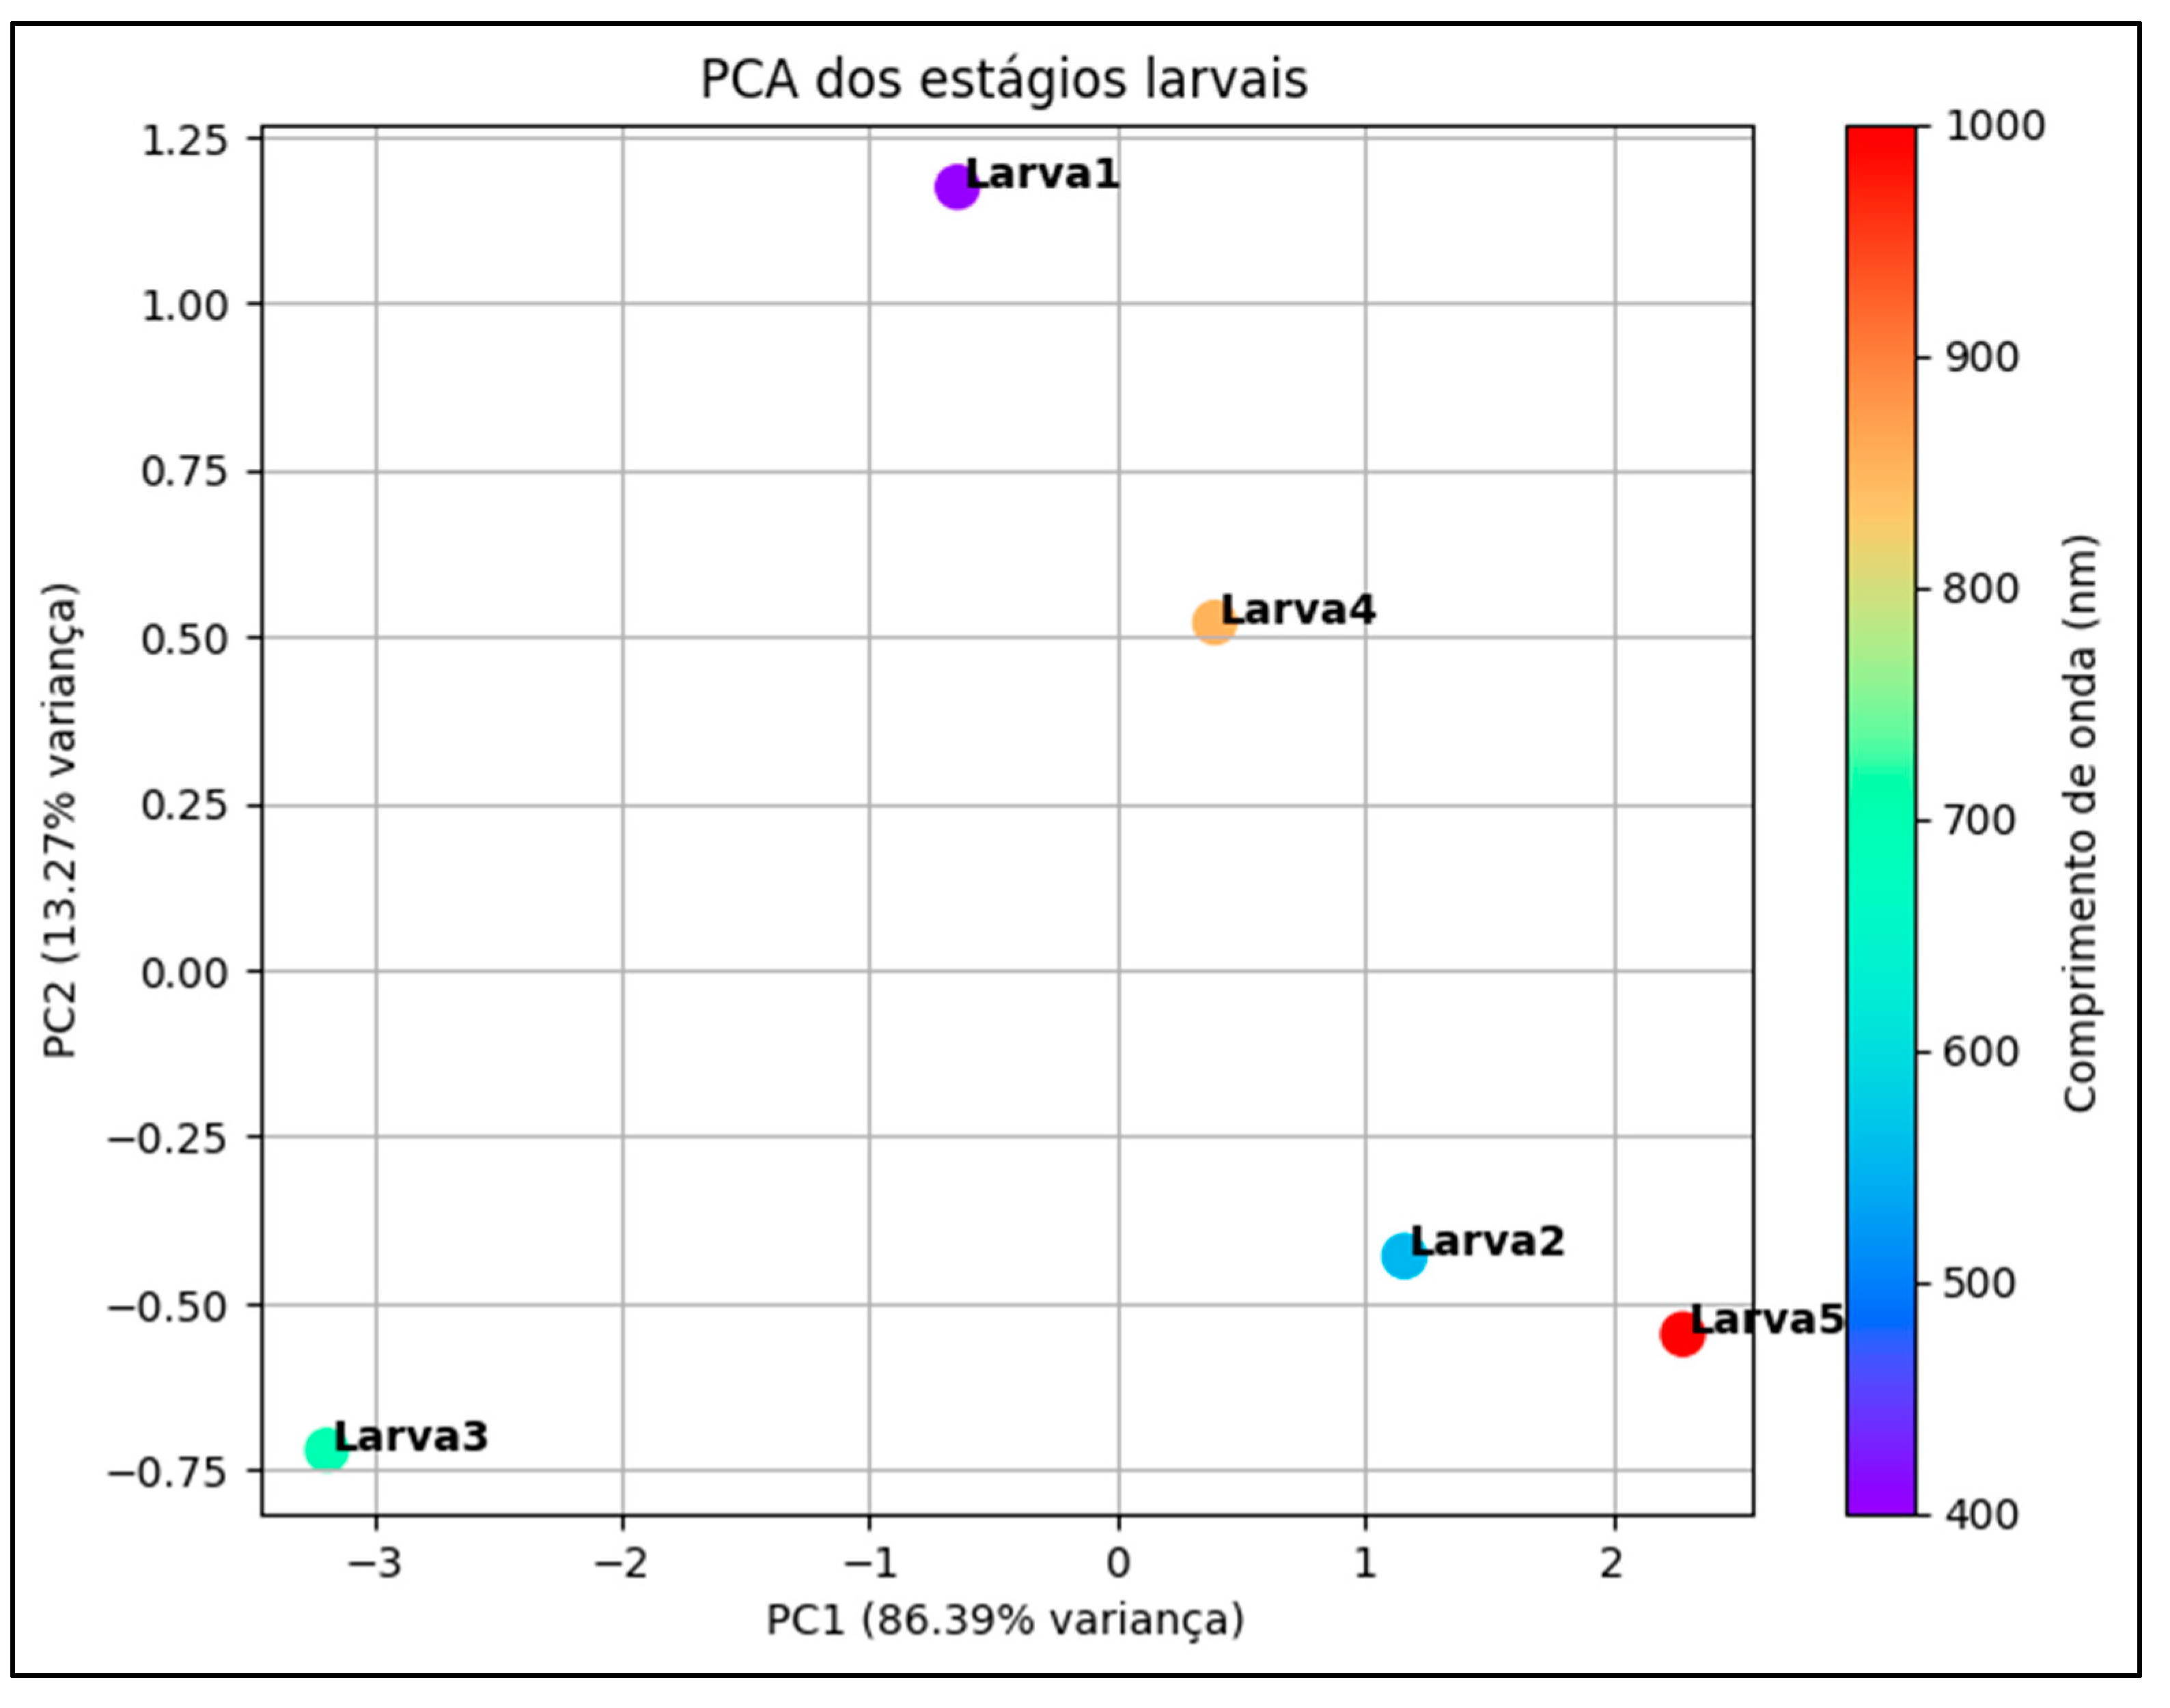
Figure 13.
3D principal component analysis of dead and live lavas and larvae of D. saccharalis parasitized by C. flavipes. *Lp = parasitized larva.
Figure 13.
3D principal component analysis of dead and live lavas and larvae of D. saccharalis parasitized by C. flavipes. *Lp = parasitized larva.
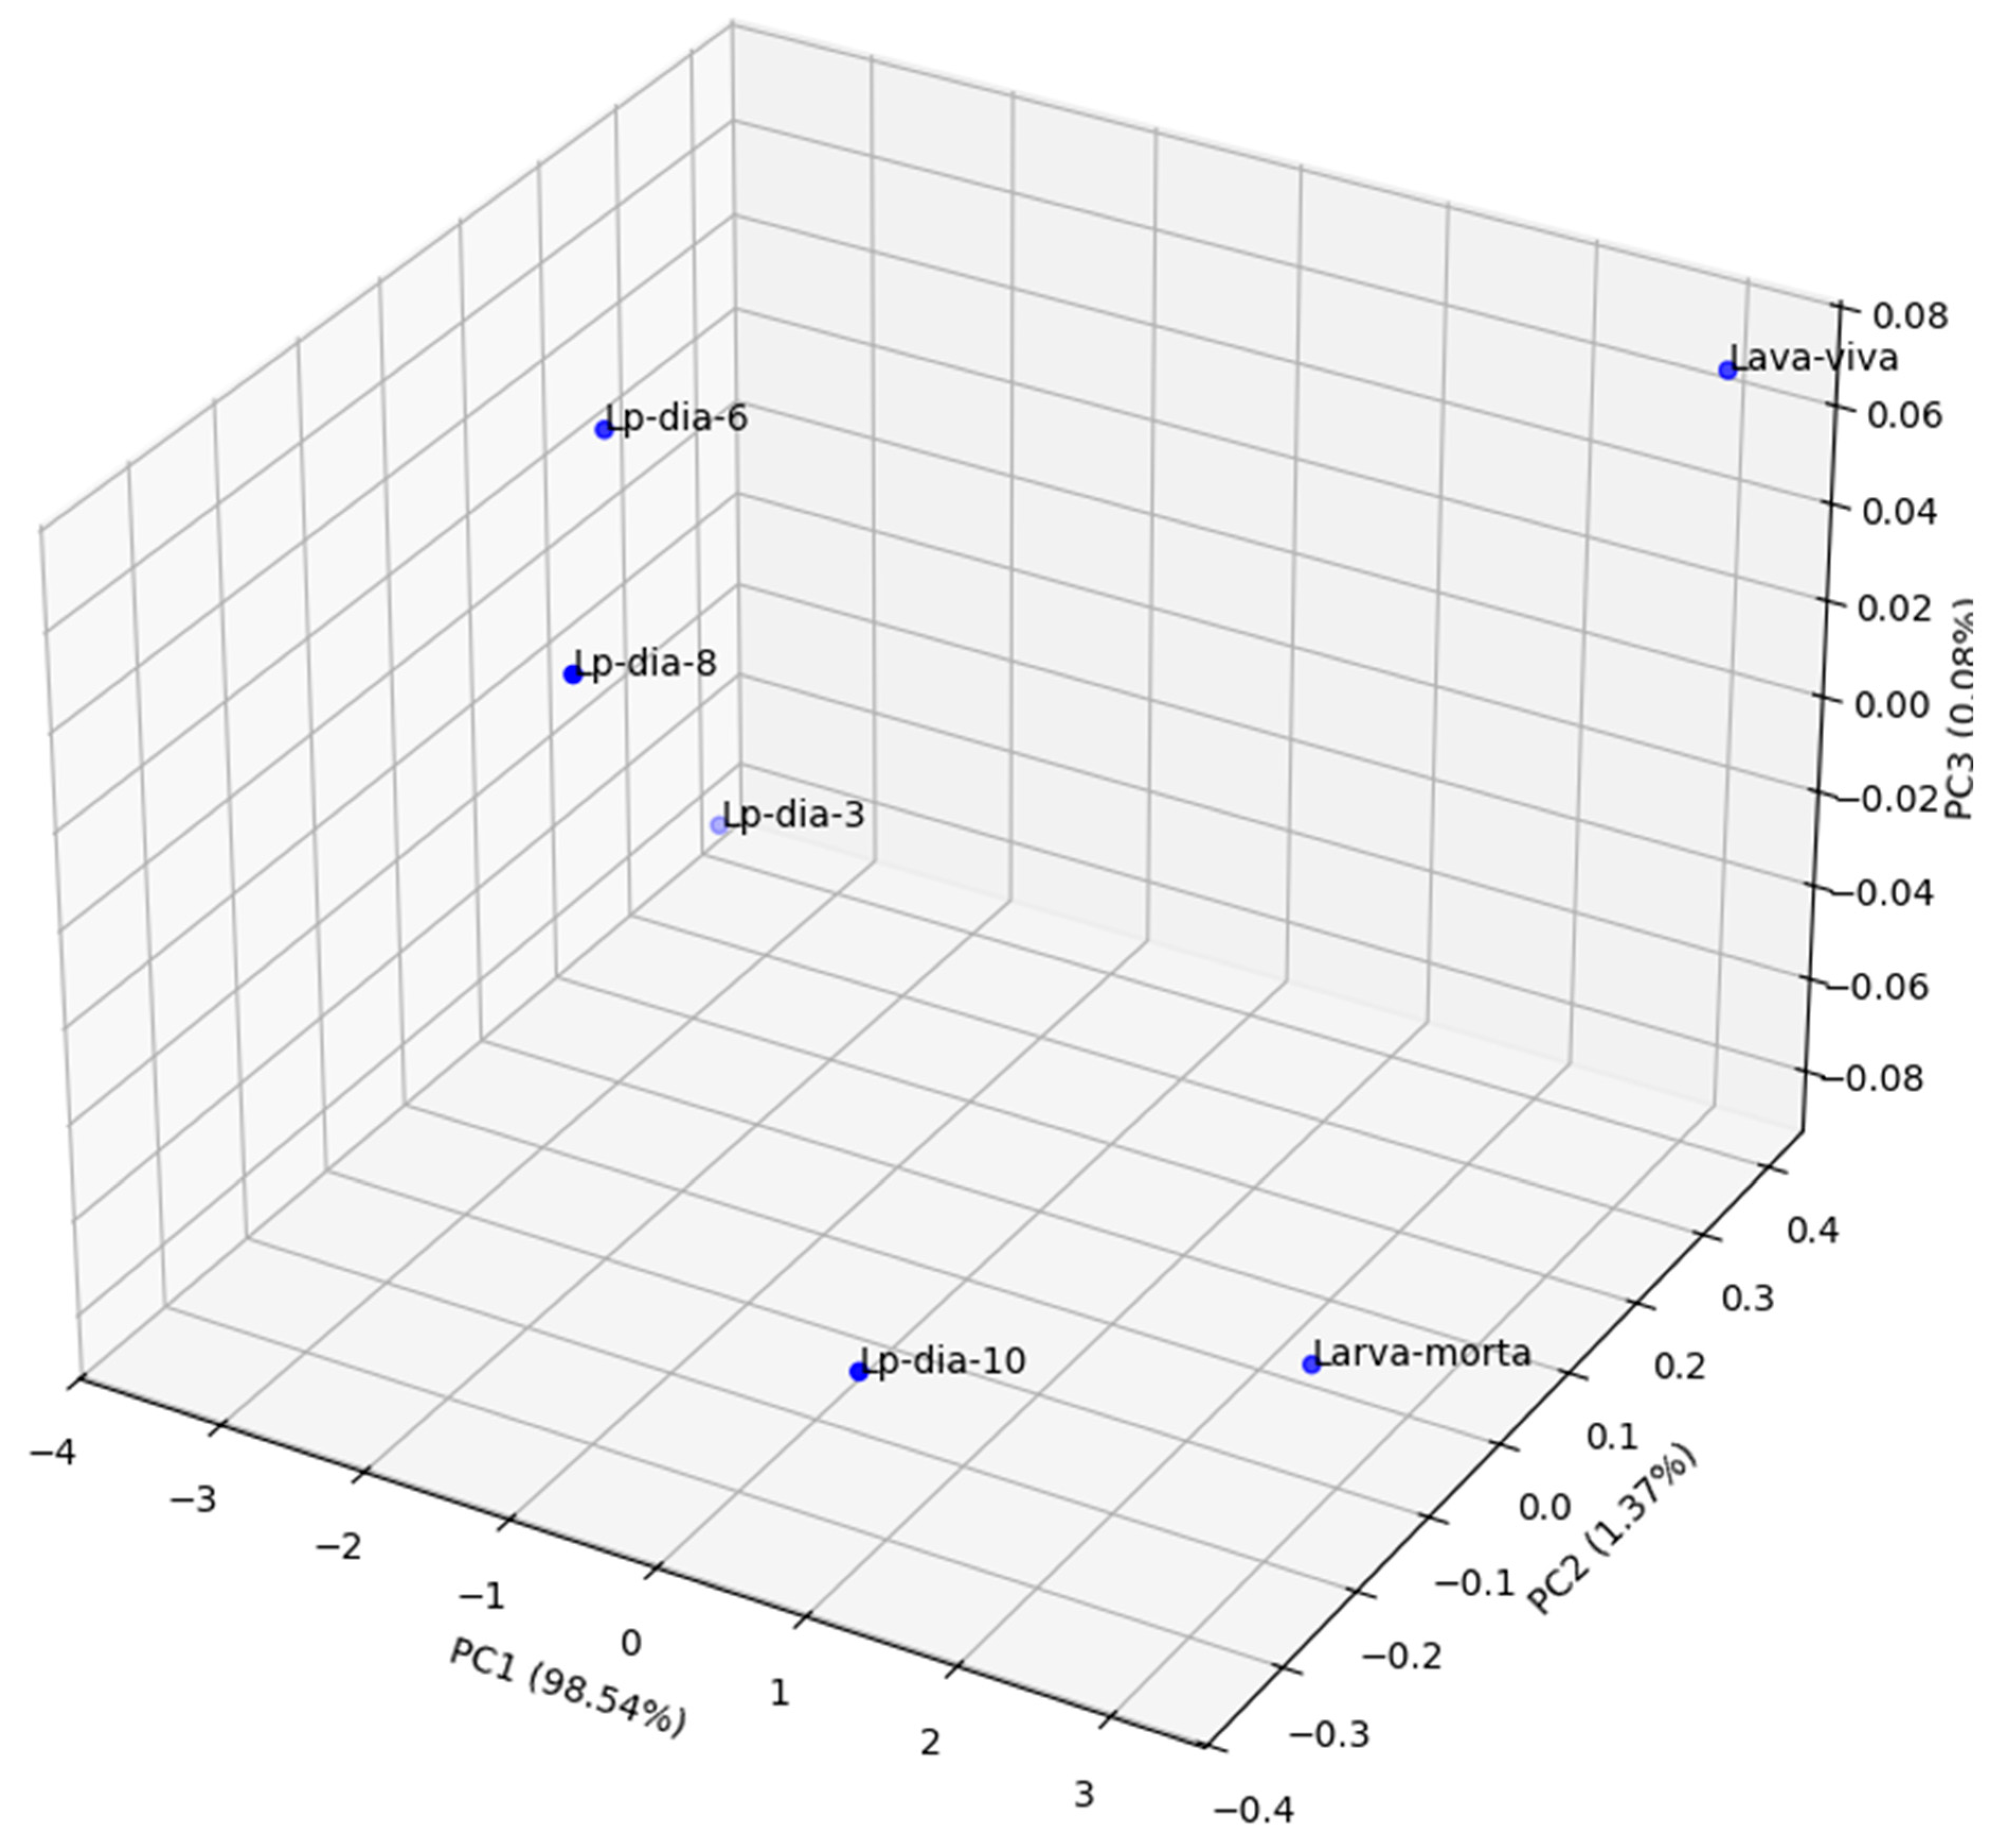
Figure 14.
3D Principal Component Analysis of D. saccharalis stages. Percentage of variance explained: PC1 (97.75%), PC2 (1.52%), PC3 (0.66%).
Figure 14.
3D Principal Component Analysis of D. saccharalis stages. Percentage of variance explained: PC1 (97.75%), PC2 (1.52%), PC3 (0.66%).
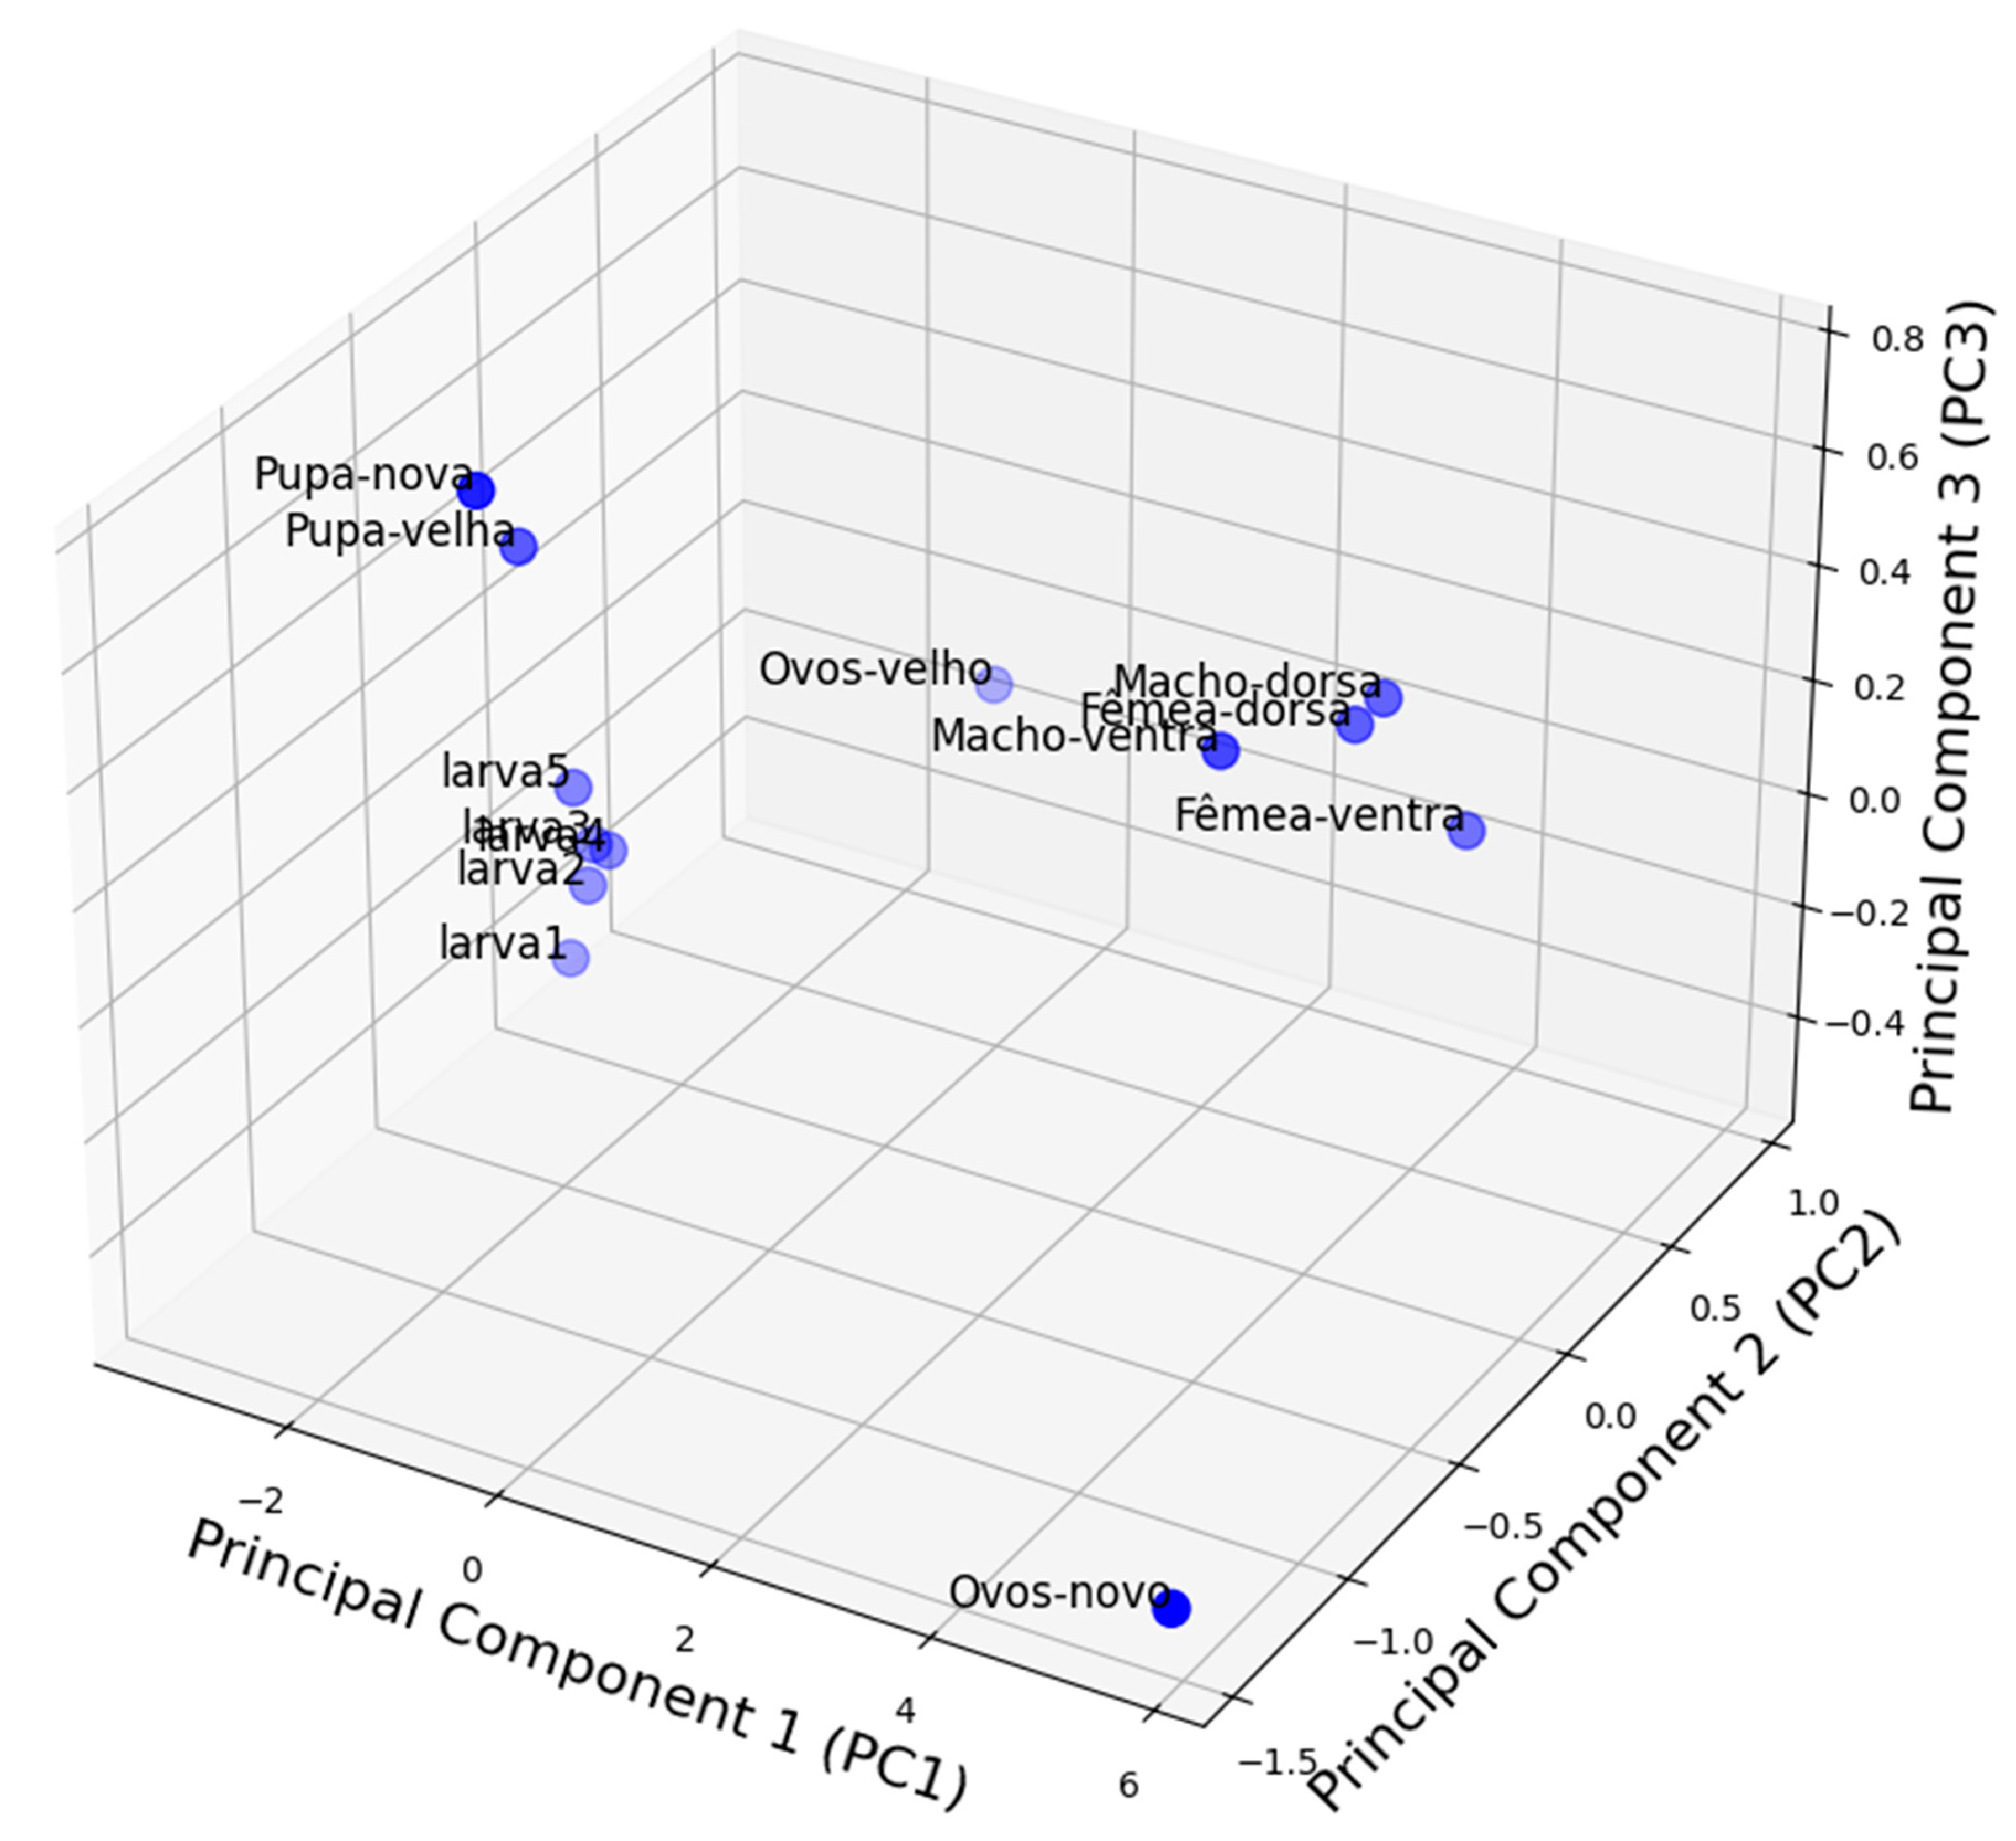

Table 1.
Modified diet for the rearing of Diatraea saccharalis caterpillars.
| Igredientes | Quantity | Purpose |
|---|---|---|
| Soybean meal | 450 g | Protein |
| Wheat germ | 200 g | Protein |
| Brewer's yeast | 800 g | For fermentation |
| Nipagin | 11 g | Anti-Contaminant |
| Granulated sugar | 85 g | Carbohydrate |
| Ascorbic acid | 20 g | Vitamin C |
| Sorbic acid | 10 g | Diet Preservative |
| Methylparahydroxybenzoate | 35 g | Antimicrobial preservative |
| Wesson salts | 20 g | Minerals |
| Choline chloride | 4 g | Vitamin |
| Agenato | 106 g | Thickener |
| Vitamin Solution* | 15 mL | Vitamin complex |
| Vita Gold | 1 mL | Vitamin complex |
| Formaldehyde | 2.5 mL | Egg treatments |
| Binotal | 250 mg | Anticontaminant (antibiotic) |
| Distilled water | 7.1 L | Solvent |
*Vitamin solution composed of 500 mL of distilled water, 1 bottle of dry vitamins and 1 bottle of wet vitamins. Source: [39].
Disclaimer/Publisher’s Note: The statements, opinions and data contained in all publications are solely those of the individual author(s) and contributor(s) and not of MDPI and/or the editor(s). MDPI and/or the editor(s) disclaim responsibility for any injury to people or property resulting from any ideas, methods, instructions or products referred to in the content. |
© 2025 by the authors. Licensee MDPI, Basel, Switzerland. This article is an open access article distributed under the terms and conditions of the Creative Commons Attribution (CC BY) license (http://creativecommons.org/licenses/by/4.0/).
Copyright: This open access article is published under a Creative Commons CC BY 4.0 license, which permit the free download, distribution, and reuse, provided that the author and preprint are cited in any reuse.


